Article

A Laser Damage Threshold for Microscope Glass Slides

1
National Metrology Institute, The Scientific and Technological Research Council of Türkiye (TÜBİTAK-UME, Ulusal Metroloji Enstitüsü), Kocaeli 41470, Türkiye
2
Physics Department, Gebze Technical University, Kocaeli 41470, Türkiye
*
Author to whom correspondence should be addressed.
Photonics 2023, 10(9), 967; https://doi.org/10.3390/photonics10090967
Submission received: 14 July 2023 / Revised: 17 August 2023 / Accepted: 21 August 2023 / Published: 24 August 2023
(This article belongs to the Special Issue Laser-Induced Damage)

Abstract

:
Laser-based light sources have fostered innovative developments in biomedical and biosensor fields. However, laser-induced damage to optical components is a limitation for designing and implementing highly sensitive biosensors, necessitating the development and characterization of suitable optical components. Microscope glass slides are among the most extensively used optical units in this field. This study investigated the laser-induced damage threshold (LIDT) of high-quality microscope glass slides obtained from three different vendors. An S-on-1 protocol following the ISO 21254 series standards was adopted to ensure a meaningful comparative analysis. Multiple laser pulses at a constant fluence (at the three laser wavelengths most widely used in biosensors) were used for LIDT tests. An automated test bench was developed and employed to minimize the influence of human factors on the test results. The fatigue damage mechanism was observed in all the samples. The findings revealed good consistency among LIDT values within and across batches from the same vendor. However, a notable discrepancy was observed when comparing the results of slides obtained from different vendors, with threshold values differing by up to two-fold. This study emphasizes the need to carefully consider the glass material source when selecting microscope glass slides for laser-sensitive applications.

1. Introduction

Various laser sources have been widely used in sensors and applications in bioscience. These include laser–material interaction [1,2], laser-based medical imaging [3], laser-induced fluorescence and fluorescence spectroscopy [4] applications, and confocal fluorescence imaging applications [5]. Along with monochromatic radiation, lasers provide a beam that can be focused over a small area of several microns. The need to confine the light in a small area (in micron size) in complex sensors such as lab-on-chip sensors and small structures such as micro-channels, optical fibers, and micro-optical components is dictated by the nature of the processes they are involved in. However, all optical components can withstand a limited optical radiation intensity. Therefore, laser destruction of optical elements on the optical path is a limiting factor for many sensors and applications.
Delivering high power or energy per unit area yields a high power density (expressed in W/cm2) or energy density (J/cm2) for continuous wave or pulsed laser radiation, respectively. For the latter, the laser fluence, along with the spatial domain, and the concentration of laser energy in the timescale play a vital role in laser–material interaction mechanisms [6]. There is a fluence value, namely the laser-induced damage threshold (LIDT), below which optical components demonstrate exceptional resistance to laser damage and reliability. Above this fluence level, the light–material interaction can produce irreversible modifications in materials, where different damage mechanisms are initiated by involving various defect characteristics. In addition to material properties (bulk material with both isotropic and anisotropic structures, crystal-like or amorphous or optically coated thin film, mechanically modified surfaces, etc.), the LIDT value also depends on the radiation parameters of the incident light (continuous wave or pulsed irradiation, wavelength, spot size, temporal and spatial beam profiles, pulse duration, repetition rate, etc.). Fortunately, it is possible to assess the LIDT value using established tests. Currently, these tests for the qualification of optical components for a given laser fluence are regulated by the ISO 21254 series standards [7,8,9,10]. According to these standards, there are several automated systems [11,12,13]. LIDT test stations working in atmospheric and vacuum environments have been developed and validated [14,15].
Since the invention of lasers, numerous studies have been conducted on the LIDT of various materials and optical components, and most dominant studies have been performed on nanosecond pulse durations. These studies demonstrate that even bulk optical components, which are made from high-quality transparent solids such as fused silica [16,17,18] and BK7 [19], to some extent, always contain various surface, subsurface, or bulk absorbing and structural defects [6,20,21]. When interacting with a sufficient fluence of laser irradiation, these defect centers initiate an irreversible damage process [22]. For bulk materials, surface, subsurface, and bulk defects limit the optical lifetime in systems.
In this work, we investigated the laser damage resistance of the microscope glass slides. Although microscope glass slides were initially invented and standardized for use in microscope-based research in the 19th century [23], these glass plates, made from high-quality glass materials, are ubiquitous optical components in modern biological and analytical laboratories. Microscope glass slides are widely used as substrates in many devices and applications. The LIDT values of microscope glass slides were examined under multishot nanosecond laser radiation. The samples were examined at 355 nm, 532 nm, and 1064 nm wavelengths, the most widely used wavelengths in many applications and sensors. The tests were performed in an automated damage testing station that allowed us to perform the procedures for damage testing automatically. The tests were implemented using the S-on-1 procedure by real-time calculation of the recommended laser pulse energy for each test site, as proposed by the ISO 21254-2 standard [8]. A series of microscope glass slides obtained from three vendors were tested, and S-on-1 characteristic damage curves were generated and compared.
The remainder of this paper is organized as follows: Section 2 illustrates the laser damage test facility’s measurement method and main metrological characteristics. Thereafter, the results of the experimental measurements, including the characterization and comparison, are discussed in Section 3. Finally, a discussion and conclusions are presented in Section 4.

2. Materials and Methods

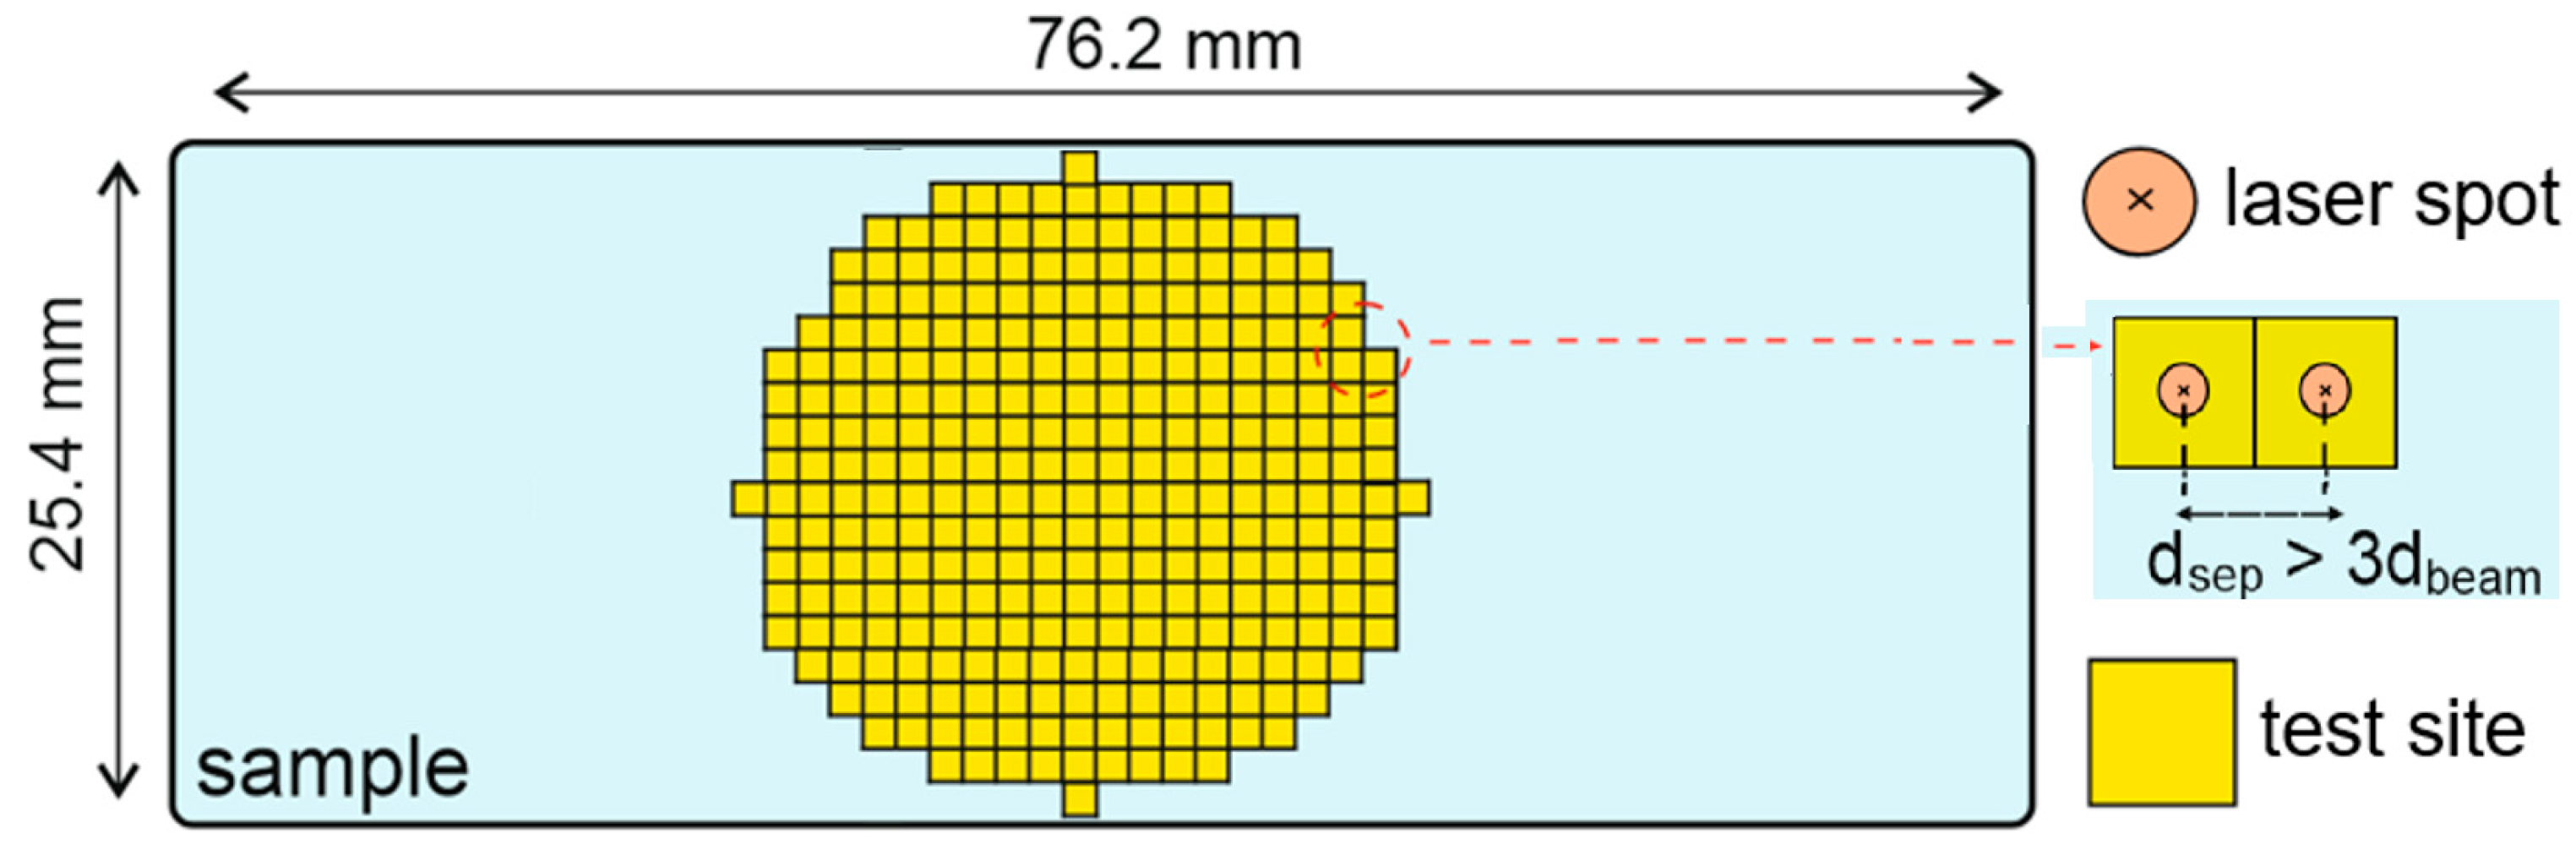
2.1. Microscope Glass Slides

The microscope glass slides examined in this study were obtained from three vendors. Two vendors declared that the slides were manufactured from clear white soda-lime glass material, while the third was manufactured from high-quality glass. Generally, microscope glass slides are produced from soda-lime and borosilicate glass materials. Soda-lime glass mainly comprises SiO 2 (~73%); the remainder comprises soda ( Na 2 O ), lime ( CaO ), and other chemical oxides to reduce the melting point and improve workability. Due to the low dispersion and high transmission characteristics in the visible region, soda-lime glass materials are preferable for producing microscope slides [24].
All the glass slides had the same nominal size of 26 × 75 mm and a thickness of 1 mm. To avoid randomness among the samples, the thickness of each specimen used in the damage threshold tests was individually assessed. We used slides with a 1.0 mm–1.02 mm thickness range during the tests. In this study, the samples from three suppliers are denoted as S1, S2, and S3.

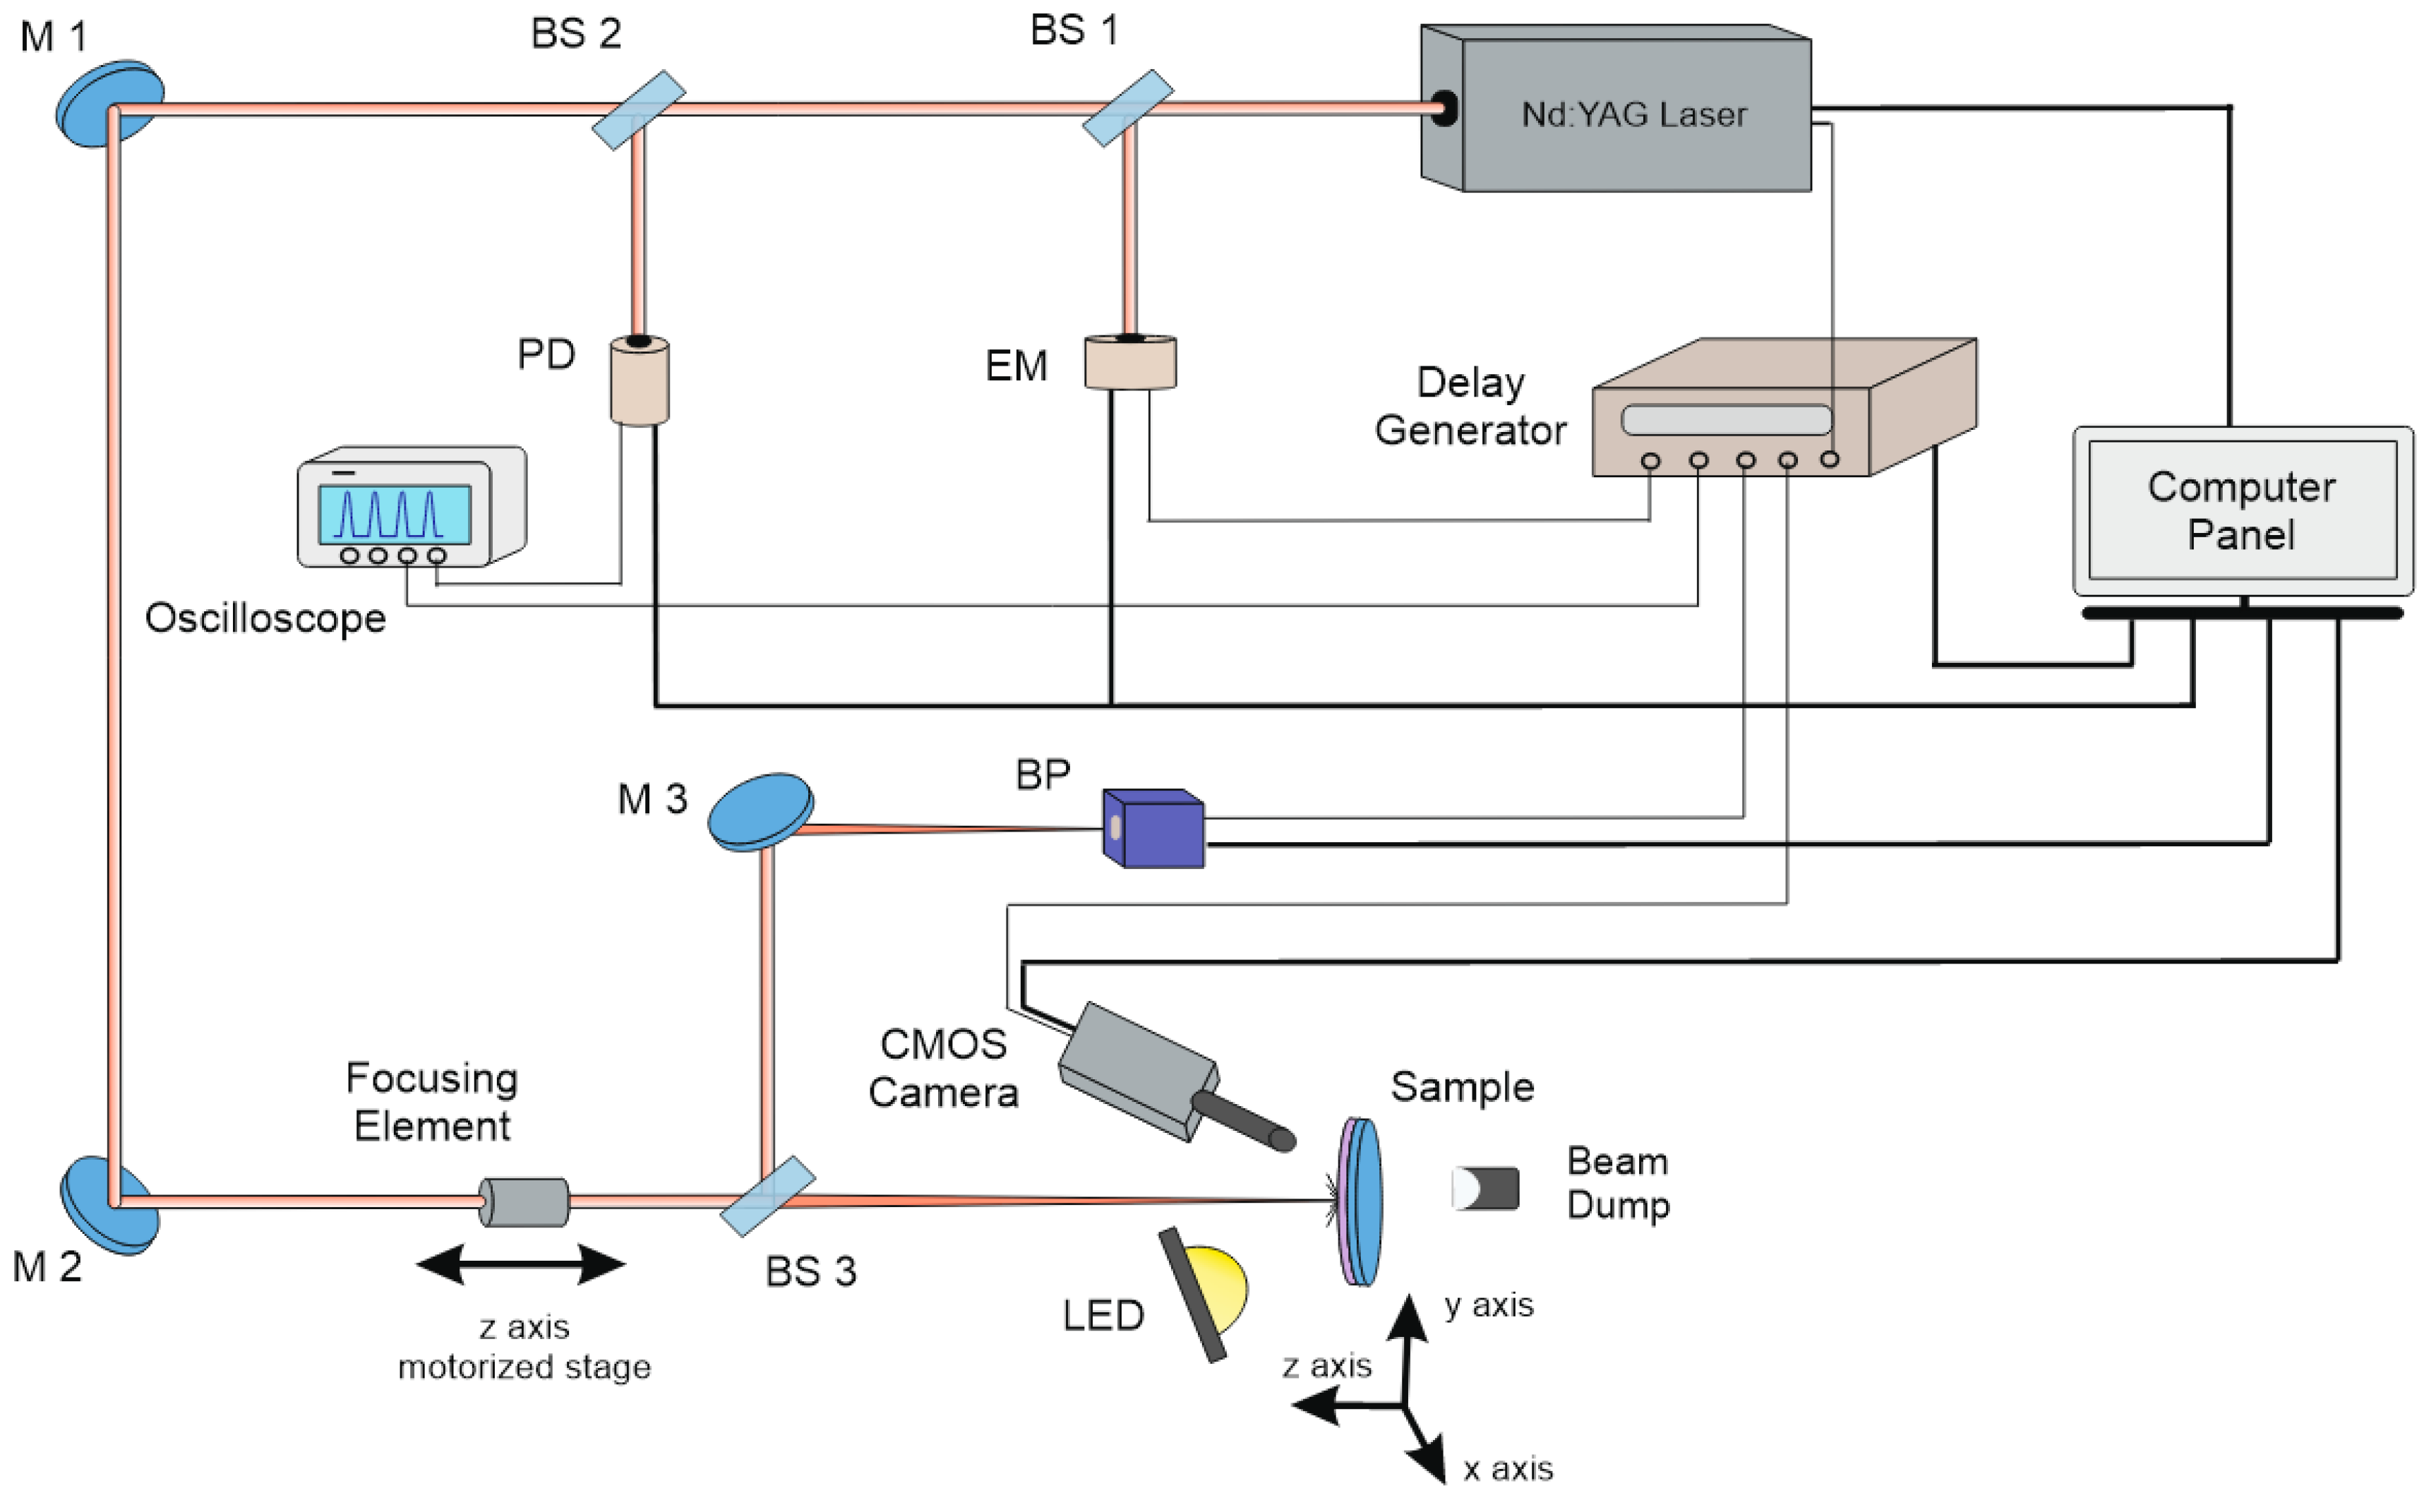
2.2. The LIDT Measurement System

The LIDT measurements were performed using a test facility, as shown in Figure 1. A Nd:YAG laser system (Ekspla NL740, Vilnius, Lithuania) was used to provide laser pulses at three wavelengths: the fundamental radiation at 1064 nm (1ω) and second and third harmonics at 532 nm (2ω) and 355 nm (3ω), respectively. At all wavelengths, the laser generated a single-mode (longitudinal) beam with linear polarization along the horizontal direction. The laser had a repetition rate of 100 Hz, but all the tests described in this work were carried out at a repetition rate of 20 Hz.

2.2.1. Beam Diagnostics

Computer-controlled half-wave plates (in a motorized rotation stage) combined with a polarizing beam splitter were used to adjust the beam energy to the desired value. For real-time beam diagnostic purposes, small fractions of the beam were redirected by three different wedged plates (BS1–BS3) in the diagnosis system. A photodiode (PD) (APD 210, Thorlabs, Newton, NJ, USA) connected to a high-speed digital oscilloscope (KEYSIGHT, DSOS254A, 2.5 GHz) was used for the temporal characterization of the laser pulse as well as for counting the number of fired pulses during the tests. To monitor the stability of the laser output, the BS2 beam splitter was used to direct a fraction of the remaining beam to an energy meter (EM) (EnergyMax, J-25MB-HE, Coherent, Santa Clara, CA, USA) connected to a computer station.
A couple of flat mirrors (M1 and M2, Figure 1) were used to adjust the laser beam onto a focusing element. The focusing element, comprising a combination of several lenses fixed on a computer-controlled linear stage, was used to focus the laser beam onto the surface of the specimen. For each harmonic of the laser, a different set of mirrors and lenses with coatings appropriate for that wavelength was used. So, by changing the lenses and the distance between them, the configuration of the focusing element was adjusted for each wavelength individually. The computer-controlled linear stage, with a traveling distance of 30 cm, was used to move the whole focusing element along the optical path with respect to the sample surface. The translation system allowed the precise positioning of the sample surface at the focal point, achieving an accuracy of ±1.25 mm. This level of accuracy exceeds one order of magnitude compared to the Rayleigh length corresponding to each wavelength [25,26]. Finally, a BS3 beam splitter and camera-based beam profiler (10-bit CMOS-1.001-Nano-UV, Cinogy, Duderstadt, Germany) were used to record and analyze the spatial energy distribution for each laser pulse. A beam profiler (placed at a distance equivalent to the samples from the focusing lens) was used to monitor the beam diameter, which was used to calculate the fluence of each laser pulse.

2.2.2. Real-Time Damage Detection

During the tests, the test site under investigation was continuously monitored with a 10× built-in microscope system (VZM 450× with 2× extension, Edmund Optics, Barrington, NJ, USA) conjugated with a 12-bit CMOS camera (EO-2223C, Edmund Optics, Barrington, NJ, USA). To protect the camera from directly reflected laser pulses, a blocking filter, individually selected for each laser harmonic, was used.
After each laser pulse, the camera recorded high-resolution images of the test site, which was continuously illuminated with a high-power, high-brightness light-emitting diode (LED). The light of the LED, scattered by the damaged site, was acquired with the CMOS camera, and damage detection was carried out using an online image processing algorithm.
The CMOS camera has a 2048 × 2048 pixel array with a pixel size of 5.5 µm × 5.5 µm. At a working distance of 90 mm, this allows reaching a 1.1 µm/pixel spatial resolution, which results in approximately 10 pixels in detecting a damage defect with a diameter of approximately 10 µm.

2.3. The S-on-1 Test Method Summary

The specimens were tested using an S-on-1 measurement protocol based on the ISO-21254-2 standard. The results obtained in this study were obtained using the S = 500 regime, where each site was exposed to a constant fluence value determined according to the procedure described in the standard.
As shown in Figure 2, the central part of the specimens was used for the damage tests. In general, a large sample surface area must be used to improve the statistics and increase the accuracy of damage probability evaluations. The number of sites within the test area was determined by the diameter   d b e a m   of the laser beam spot (at 1/e2) and the distance between each site d s e p . The latter was set to three times the beam diameter. Table 1 lists the beam diameters at each wavelength on the surface.
In-house software developed using the LabVIEW programming package was used to control the LIDT station and the entire measurement procedure. In addition, the software provided online statistical analysis during tests and damage inspection. Once the test was completed, the software generated a measurement report. The reported damage probabilities for a given number of pulses and fluence values were determined by using the evaluation procedure described in the ISO 21254-2 standard. In addition, the software employed the binning method to calculate the damage probability curves [27], as described in Section 3.2.2.

2.4. Cleaning

The entire measurement campaign was conducted in a controlled laboratory environment with room temperature maintained at 22.5 ± 1 °C and relative humidity of 45.0 ± 10.0 rh%. During the tests, the specimen was placed in a chamber with continuous monitoring and controlled cleanliness and humidity. Prior to the tests, all samples were cleaned with isopropyl alcohol and dust-free wipes. The sample’s surface was examined manually using a built-in imaging microscope for unwanted imperfections and contamination.

3. Results

The section is organized as follows: First, the results obtained during the system characterization inherent to a typical pulse (including temporal and spatial beam profiles and energy stability) are presented. This is followed by the LIDT test results for the microscope glass slides.

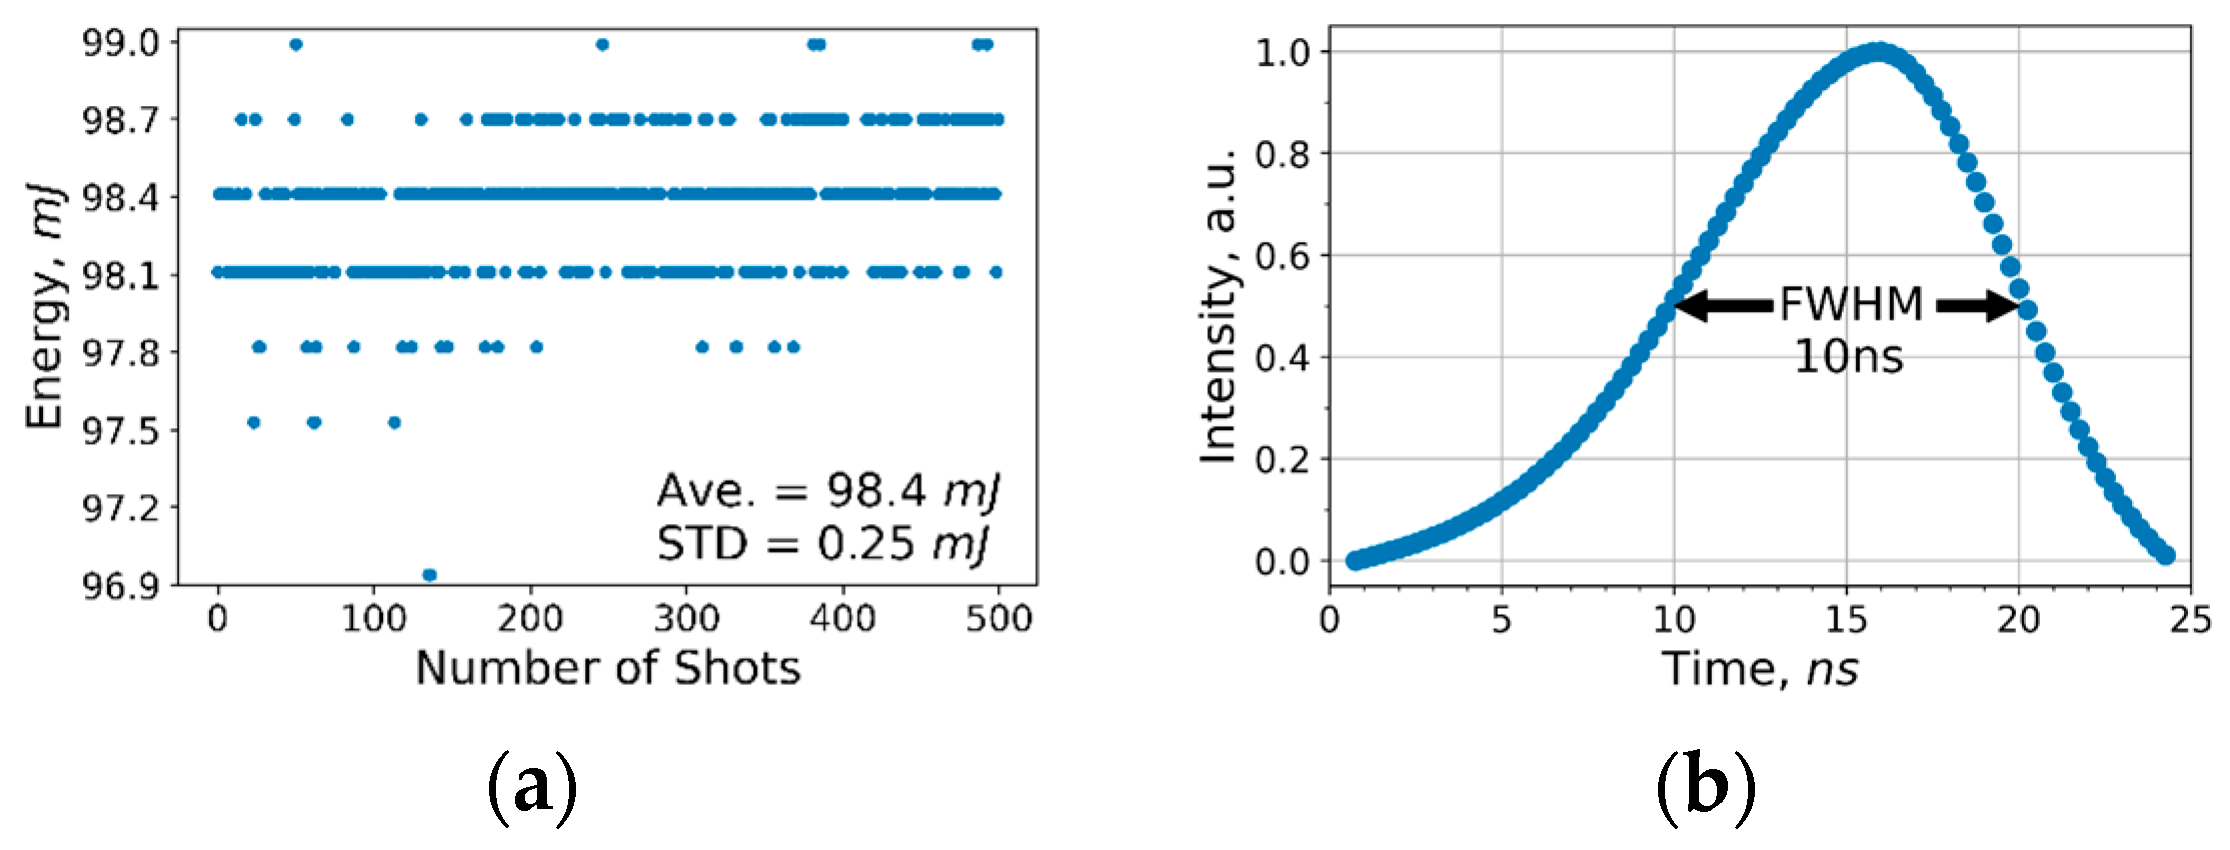
3.1. The Test System Characterization

Laser beam characteristics, such as the energy equivalence of each pulse in the pulse train, stability of the spatial and temporal distribution of this energy, and exact counting of shots per site, directly influence the accuracy of the damage threshold measurement. Thus, to obtain reliable results in the LIDT tests, accurate laser beam characterization at each wavelength is necessary. Moreover, monitoring at least one pulse energy and a spatial beam profile of each shot during the tests is essential for reliable results [8]. Therefore, the laser performance was continually monitored and controlled in the tests using an online diagnostic system. Below are some of the critical characteristics of the LIDT system.

3.1.1. Stability of Energy and Temporal Profile of Typical Pulses

As mentioned in Section 2.2.1, in the test setup, a pyroelectric detector head type J-25MB-HE was used to monitor the pulse energy of the individual laser pulses and the number of pulses fired at each test site. For these purposes, a small amount of reflected energy from beam splitter BS1 was measured with the J-25MB-HE. Figure 3a illustrates the typical distribution of the energy values of a pulse train consisting of 500 consecutive typical pulses at 1064 nm. The maximum standard deviation calculated for more than ten pulse trains did not exceed the value of 0.3%. At other wavelengths, this value was even smaller. To be conservative, we assume this value is equal to 0.5% in all uncertainty calculations.
In the experiments, the pulse duration was set to 10 ns at full width at half maximum (FWHM). Figure 3b illustrates a typical temporal profile of a typical laser pulse at a wavelength of 1064 nm, which was obtained by employing a 1 GHz Si photodetector (APD 210, Thorlabs) and a high-speed digital oscilloscope. Similar behavior was observed for the other two wavelengths. It is worth noting that the stability of the FWHM of approximately 1000 consecutive pulses was monitored several times at all wavelengths and at least three different energy levels. The maximum standard deviation, obtained at 355 nm and 10% of maximum laser output energy, was approximately 0.3 ns. Such a small deviation in the temporal profile had a negligible effect on the LIDT results. Therefore, owing to the high stability of the temporal characteristics of typical pulses, only the spatial beam profile (along with the energy level) was monitored during the tests.

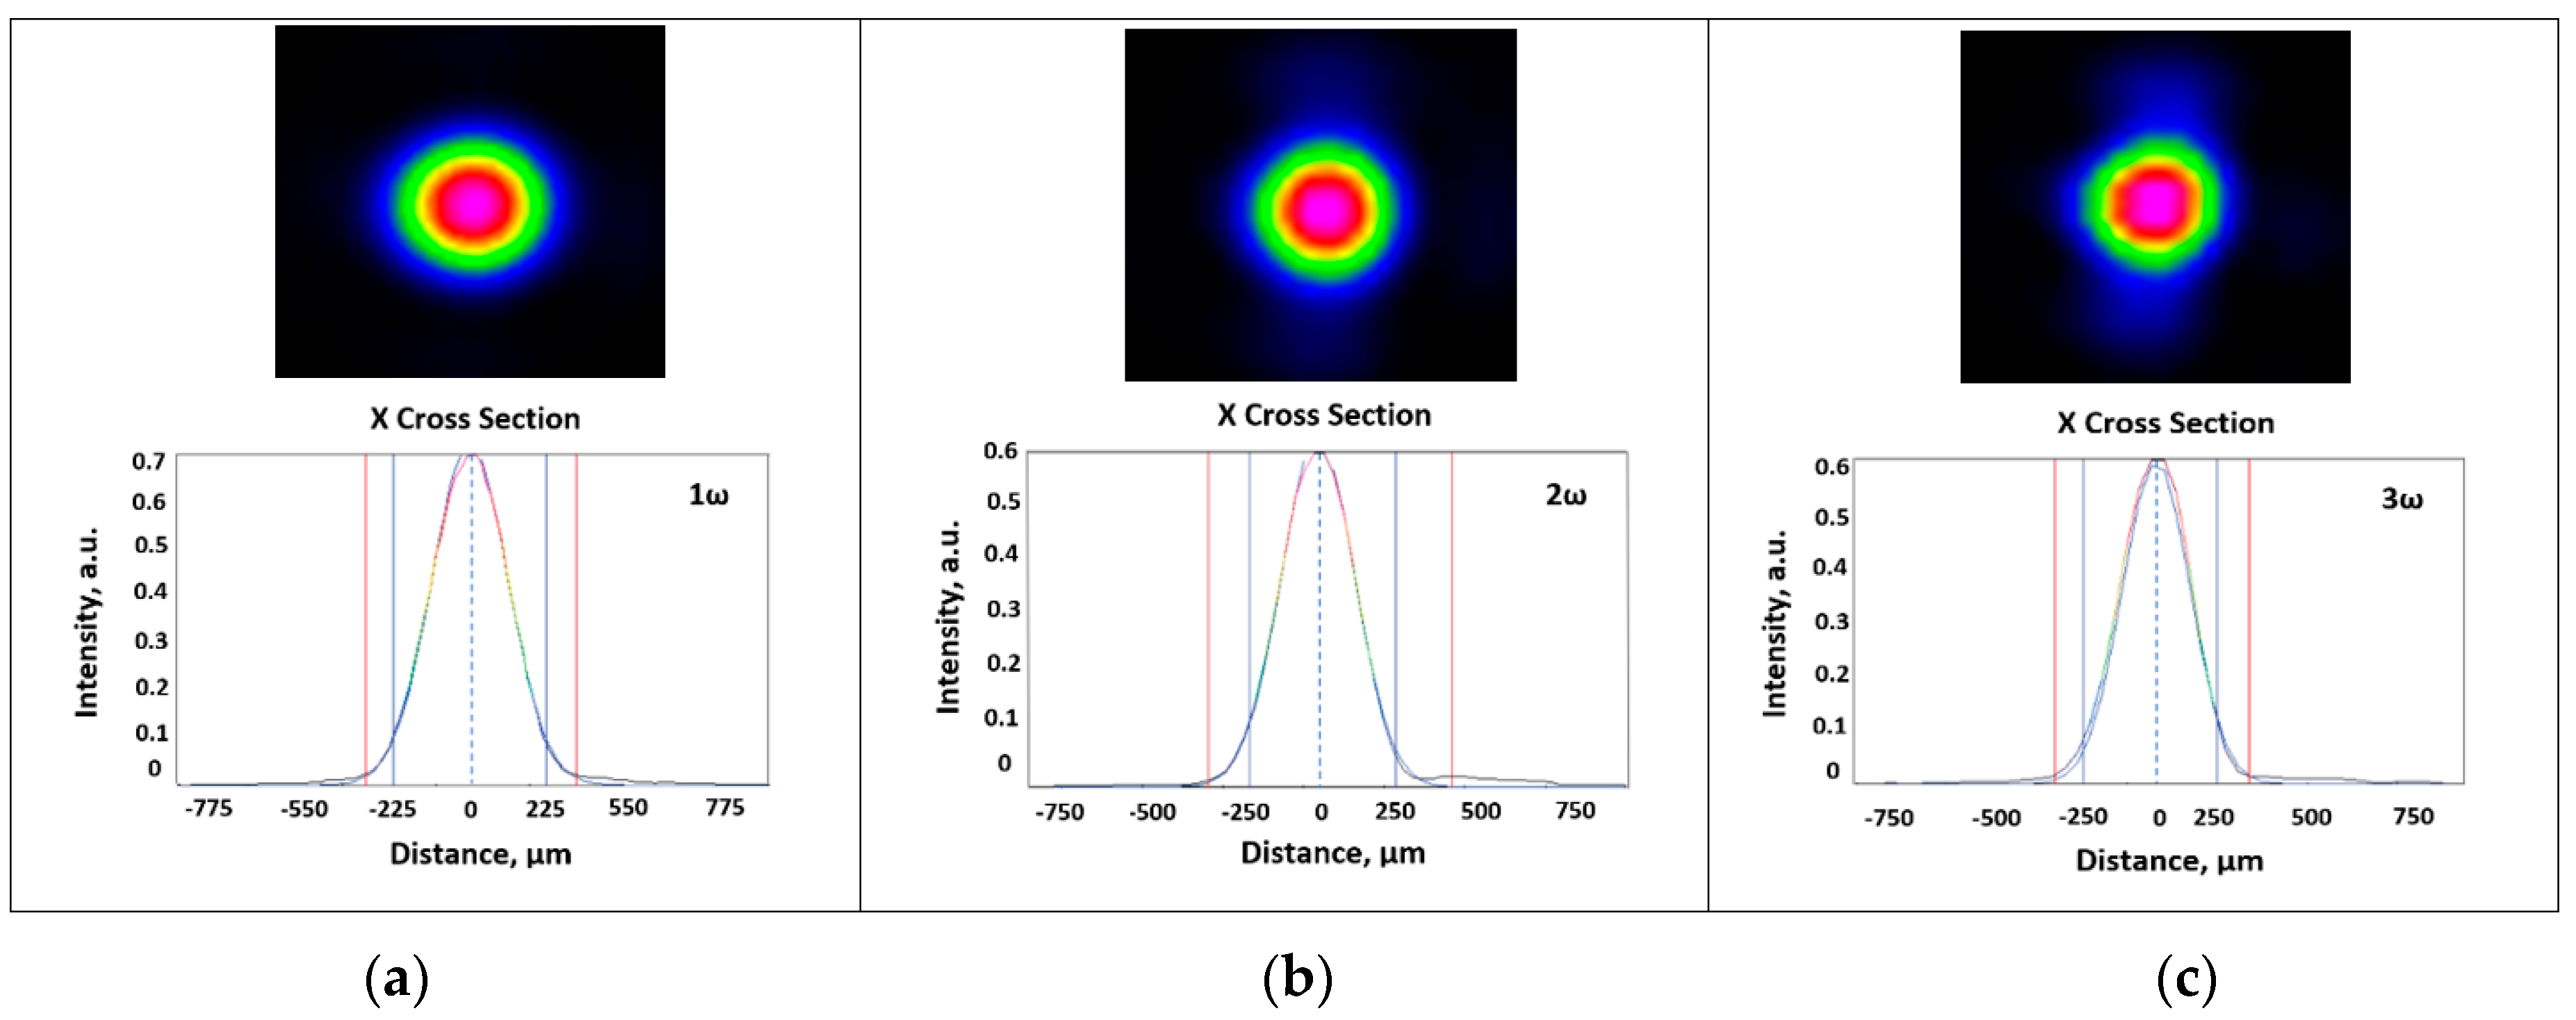
3.1.2. Spatial Beam Profile

Absolute calibration of laser-energy fluences is essential for quantitative studies of LIDTs. This calibration primarily depends on the accuracy of laser beam spot size and pulse energy measurements [28]. In the tests, the spatial energy distribution of the laser pulse was recorded and analyzed using an attenuated fraction of the incident laser (beam splitter BS3, Figure 1). This beam is focused onto the beam profiler using an objective lens system identical to that used for focusing the main beam onto the sample. The camera has 2048 × 2048 pixels, resulting in a maximum resolution of 5.5 µm × 5.5 µm in the image plane. The beam diagnostics system and RayCi Pro software (Cinogy, Duderstadt, Germany, Germany) were used to measure the diameter of the laser beam on the focal plane. The beam diameter d 1 / e 2 at each wavelength was assessed at the 1/e2 width. According to these results, the corresponding area was calculated using the following equation [7]: A = 1 8 π d 1 / e 2 2 . The calculated beam diameters and areas of the spot on the sample are listed in Table 1. Figure 4a–c illustrate typical spatial beam profiles and corresponding cross-sections (in one direction) of laser pulses in the target plane at each wavelength. Near-Gaussian profiles were observed at all wavelengths with a two-dimensional fit consistency above 0.95.

3.2. The LIDT Test Results

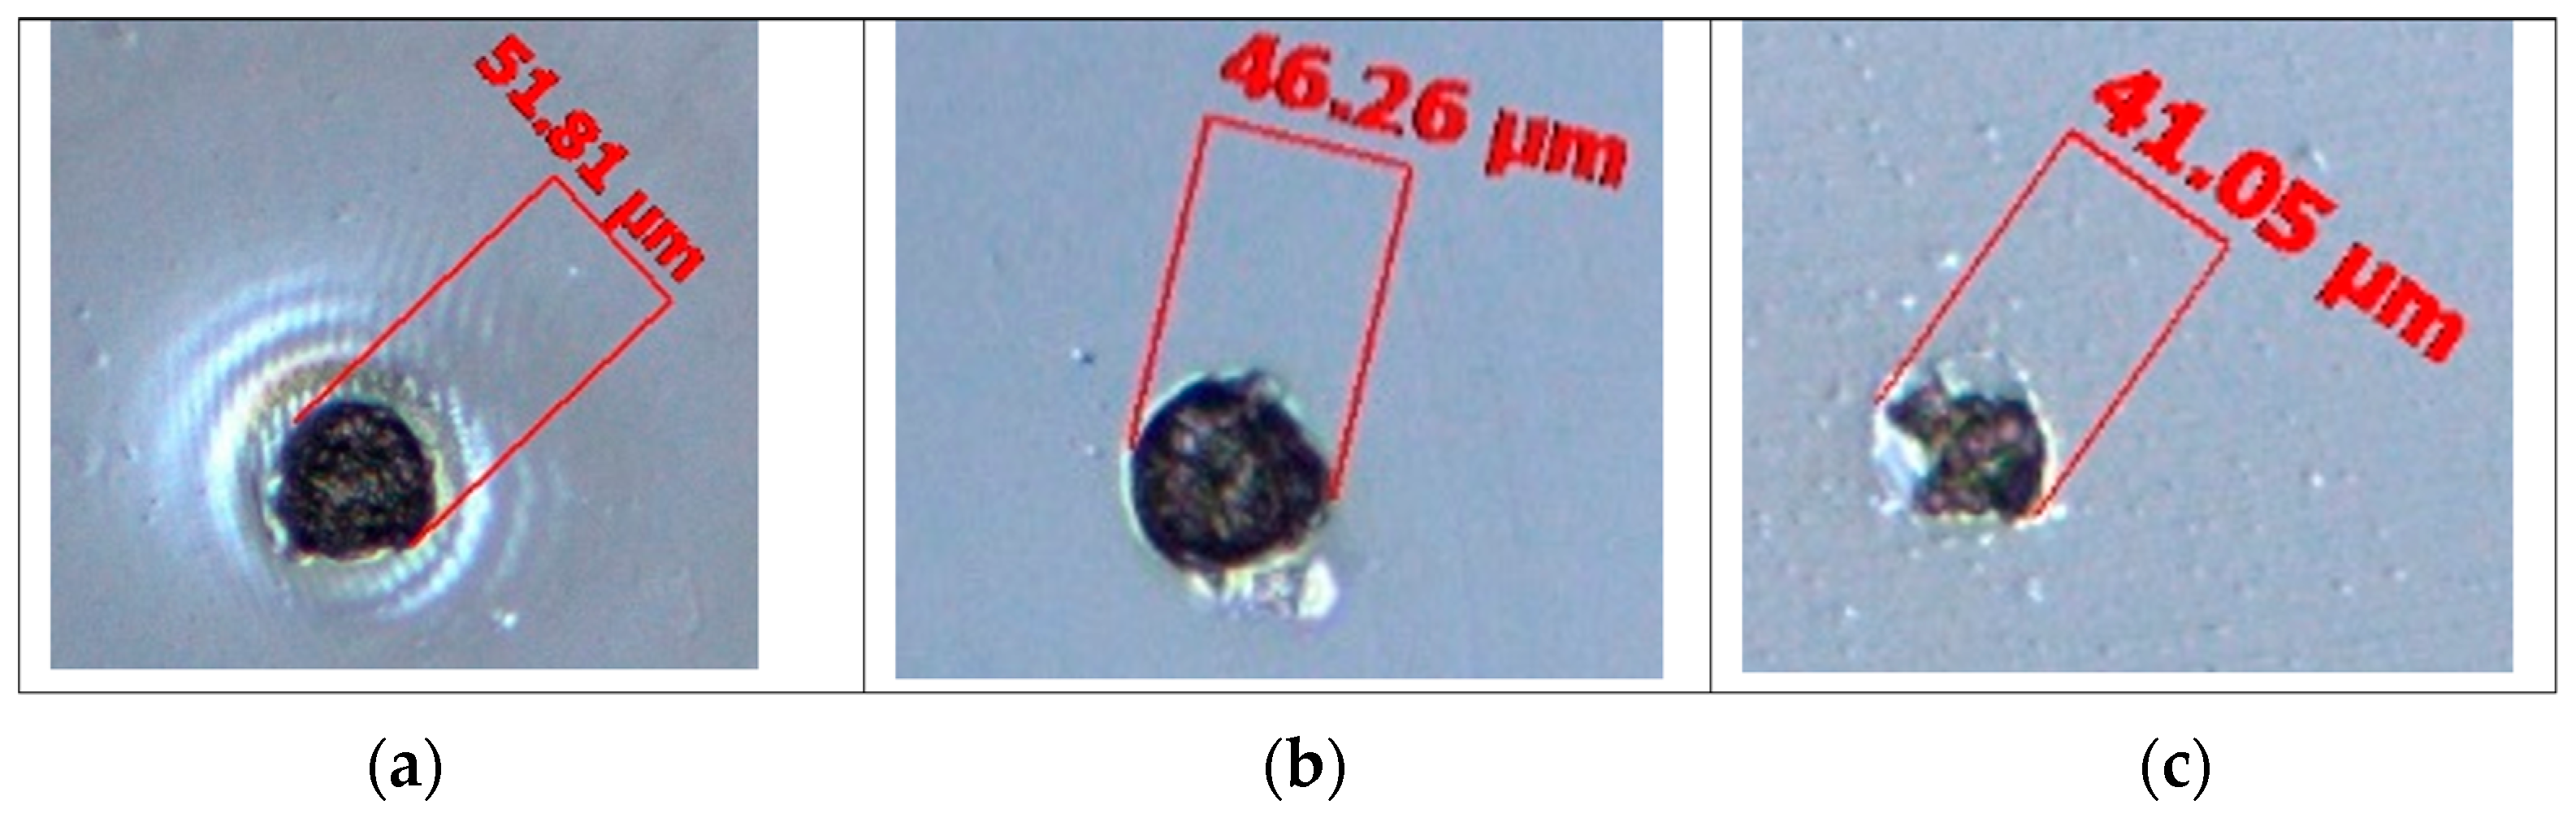
3.2.1. Damage Morphology

After conducting damage threshold tests, the samples were examined using surface inspection systems to identify distinct failure modes. Ex situ examination of the samples was visually performed using a Nomarski-type differential interference contrast (DIC) microscope (ZEISS Scope–A1, Carl Zeiss AG, Oberkochen, Germany) with magnifications up to 100×. The samples were transported in a protected, sealed box for optical profilometer (Sensofar SNeox, Terrassa, Spain) inspections after visual examination using a DIC microscope. Figure 5a–c illustrate an example of the DIC microscope images of typical damage sites of S1 samples at three utilized wavelengths. DIC damage inspection was performed at a magnification of 20×. Except for a few sites where the damage appeared as a change in the surface color, all detected damages had a similar crater-like morphology, which is in line with the literature [29]. The damage mechanisms vary by thermal absorption and electron avalanche depending on the laser pulse durations. In a nanosecond pulse duration in the dielectric defect-free bulk materials, the laser radiation is absorbed with the electrons in the conduction band. Then, the energy is transferred to the lattice, thus heating the material locally. Depending on the transfer duration and amount of the deposited energy, this temperature gradient results in two separate damage formation mechanisms: (i) the deposited heat energy is sufficient to cause a local melt, boiling, and ejection of a substance; (ii) mechanical cracks, caused by the locally confined high pressure and high temperature. The generally accepted picture of the later process is the forming of plasma, which expands with a hypersonic velocity and emits a shock wave. This results in the conversion of the optical energy to mechanical energy [17,30,31,32,33].
Figure 5a,b show that thermal effects primarily dominate the damage process, especially for 1064 nm and 532 nm wavelengths, as evident from the observed damage craters, circular scalds, and terrace-like ablated structures. However, damage morphologies, such as cracks or fractures (mainly attributed to laser-induced mechanical stress), were primarily observed in tests at 355 nm wavelength, as shown in Figure 5c and discussed in Section 4.
An optical profilometer was used to further investigate the damage morphology and reveal some topographic parameters. Figure 6(a1–a3) depict the results of the 3D scanning of the defect craters. All the damaged craters were examined with a measurement resolution of 8 nm. The system was employed in interferometric mode, where the corresponding images were acquired and saved by varying the distance between the objective lens (20× EPI) and the object surface. Then, the real-world dimensions were revealed using the Focus Variation algorithm of the profilometer’s software.
Figure 6(b1–b3) show an example of vertical cross-section profiles, where only the profiles corresponding to the deepest position are shown. The average depth observed at 1064 nm was approximately 13 µm. Average depths of approximately 8 µm and 1 µm were observed for the 532 nm and 355 nm wavelengths, respectively. Notably, the depth of the most damaged craters at 355 nm was localized on the sample surface with a depth of less than one µm.
Figure 7a–c show the histograms of the damage diameter distributions at different wavelengths obtained using the DIC microscope. All damaged sites used in the statistical evaluations were examined under the DIC microscope. In general, a good consistency between the damage diameter values obtained using the DIC microscope and the optical profilometer was observed. As can be seen from Figure 7, the average diameter of damage sites at 532 nm is higher than that observed at 355 nm. However, the average diameters of damage sites observed, 532 nm and 1064 nm, are of the same magnitudes. Taking into account that the beam diameter at 1064 nm is smaller than that at 532 nm (450 µm vs. 503 µm, as shown in Table 1), it can be concluded that there is a tendency of an increase in damage diameter with the increase in laser wavelength. Along with the spot size of the laser, the intensity of the incident laser mainly specifies the diameter of the circular damages; higher damage diameters can be observed at higher fluences. This explains the largest damage diameters and LIDT values at 1064 nm, which agrees with the literature [34,35].

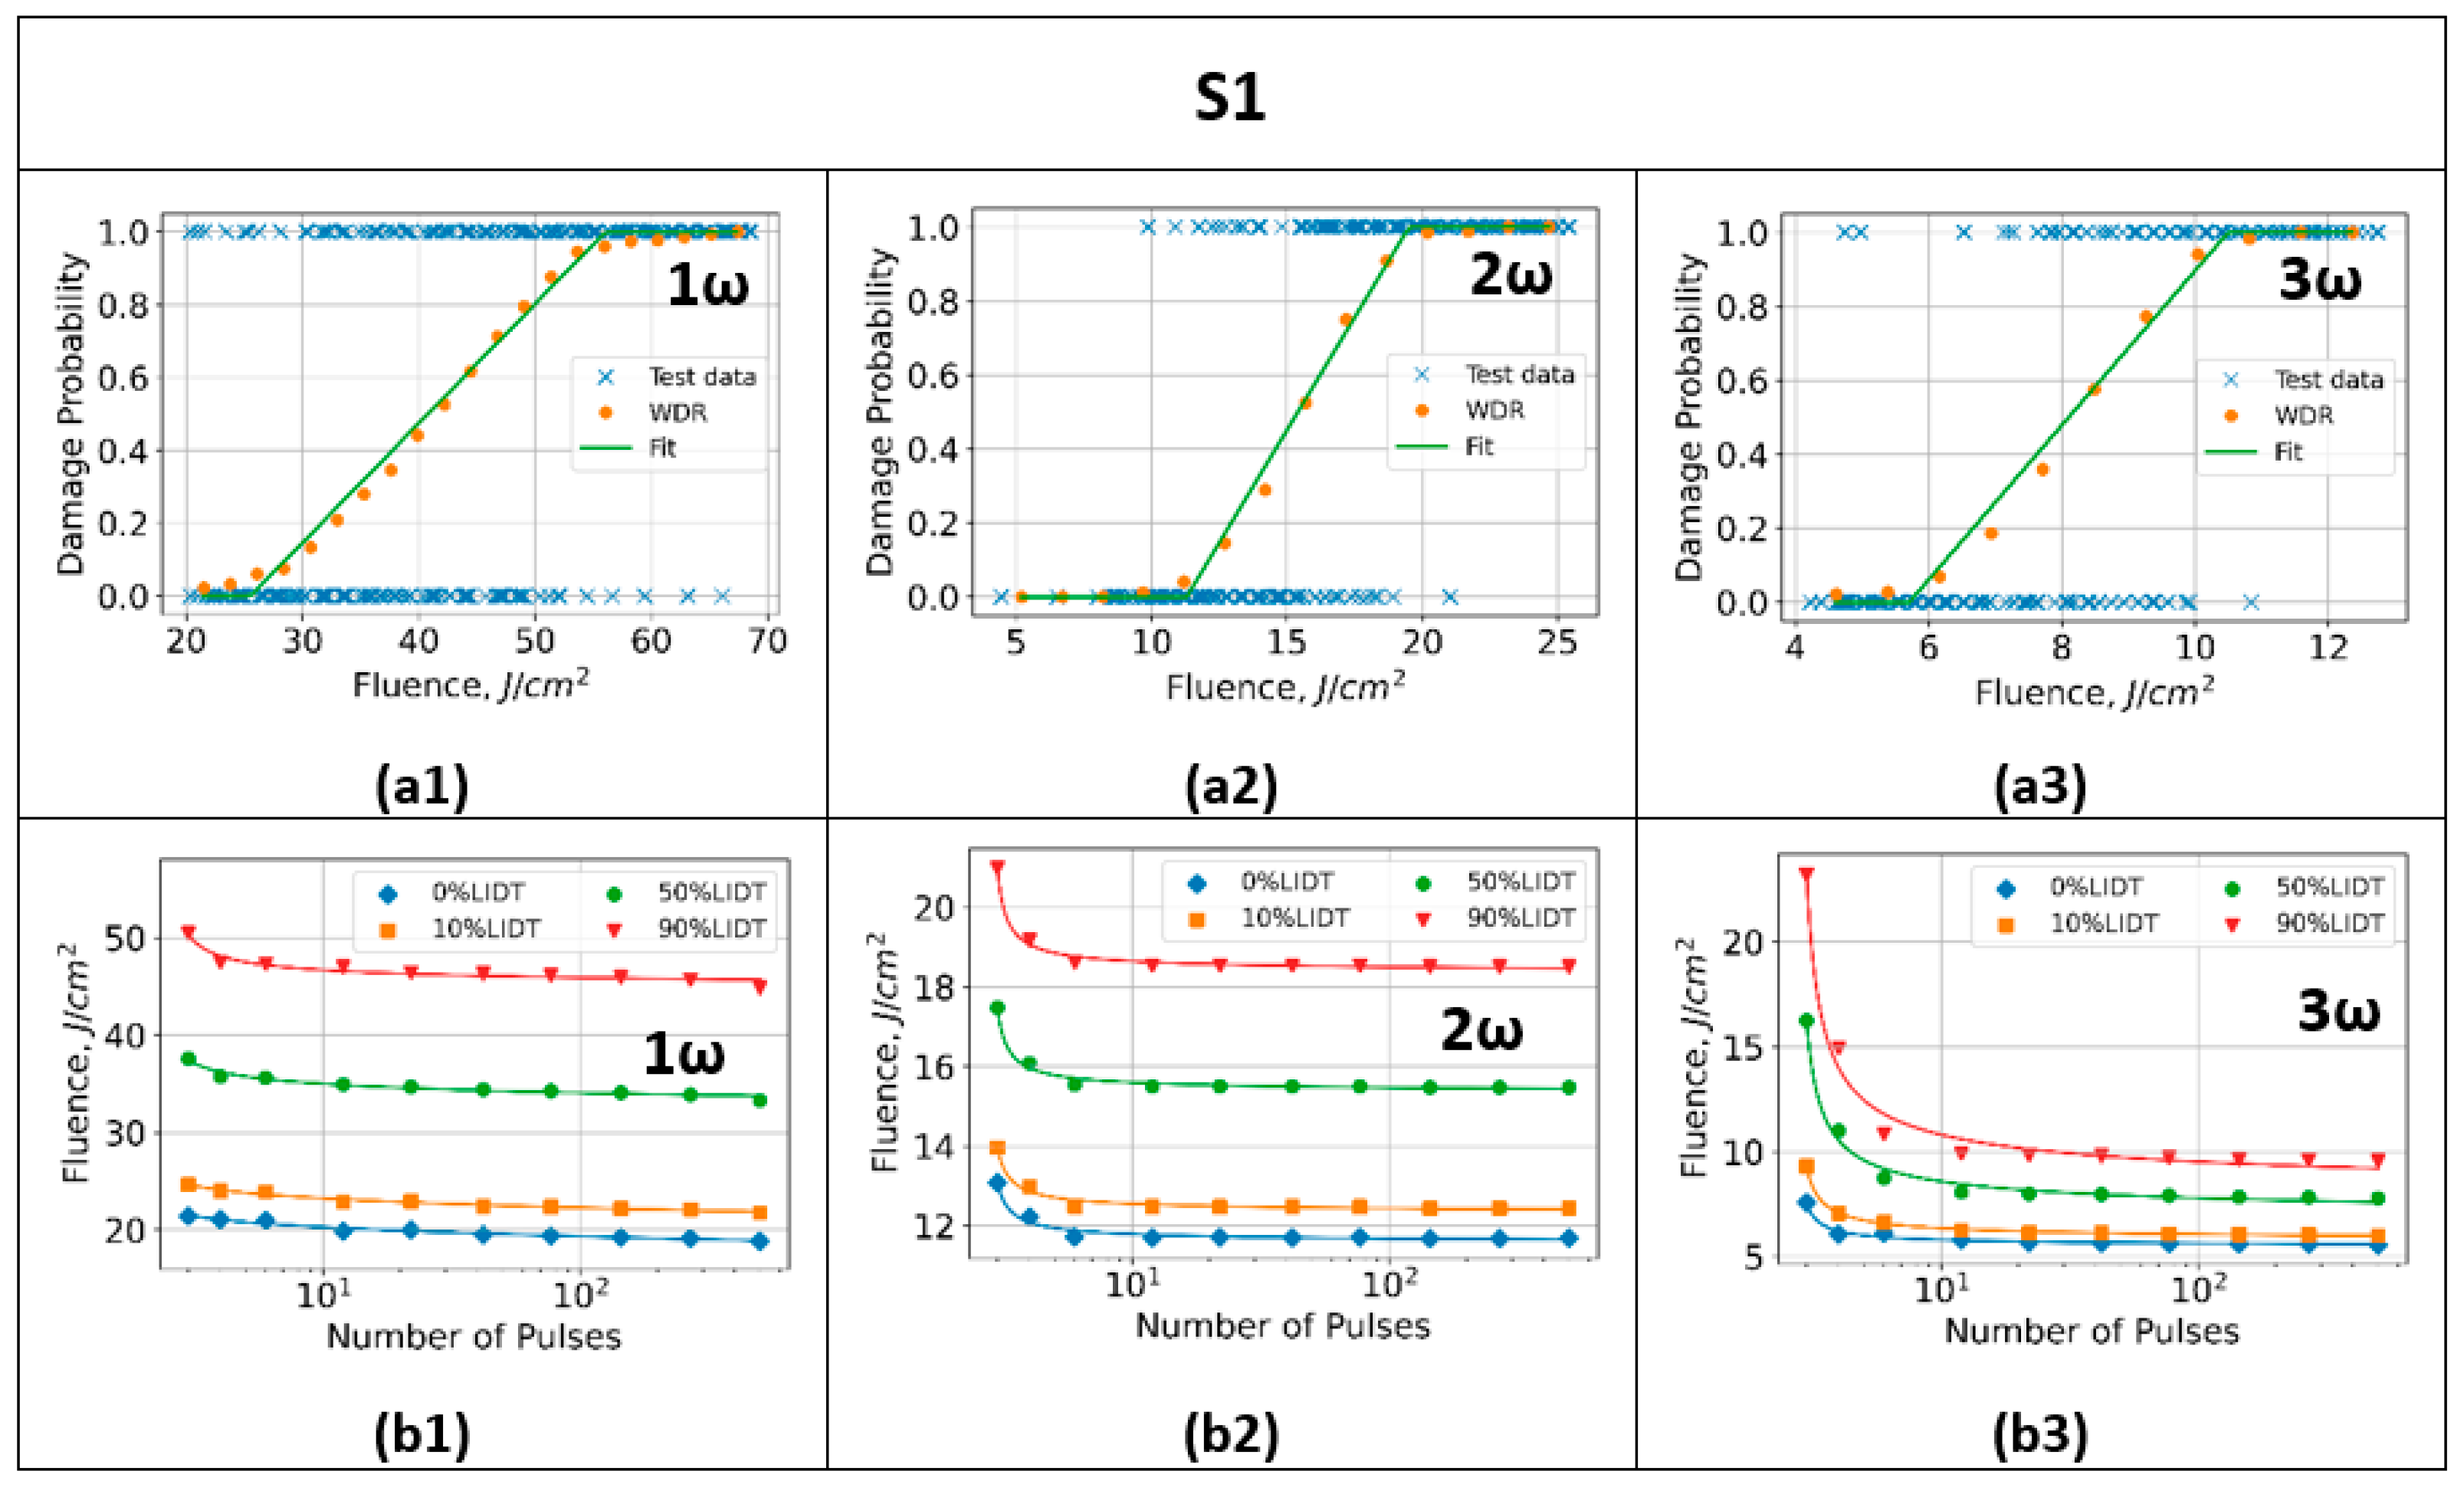
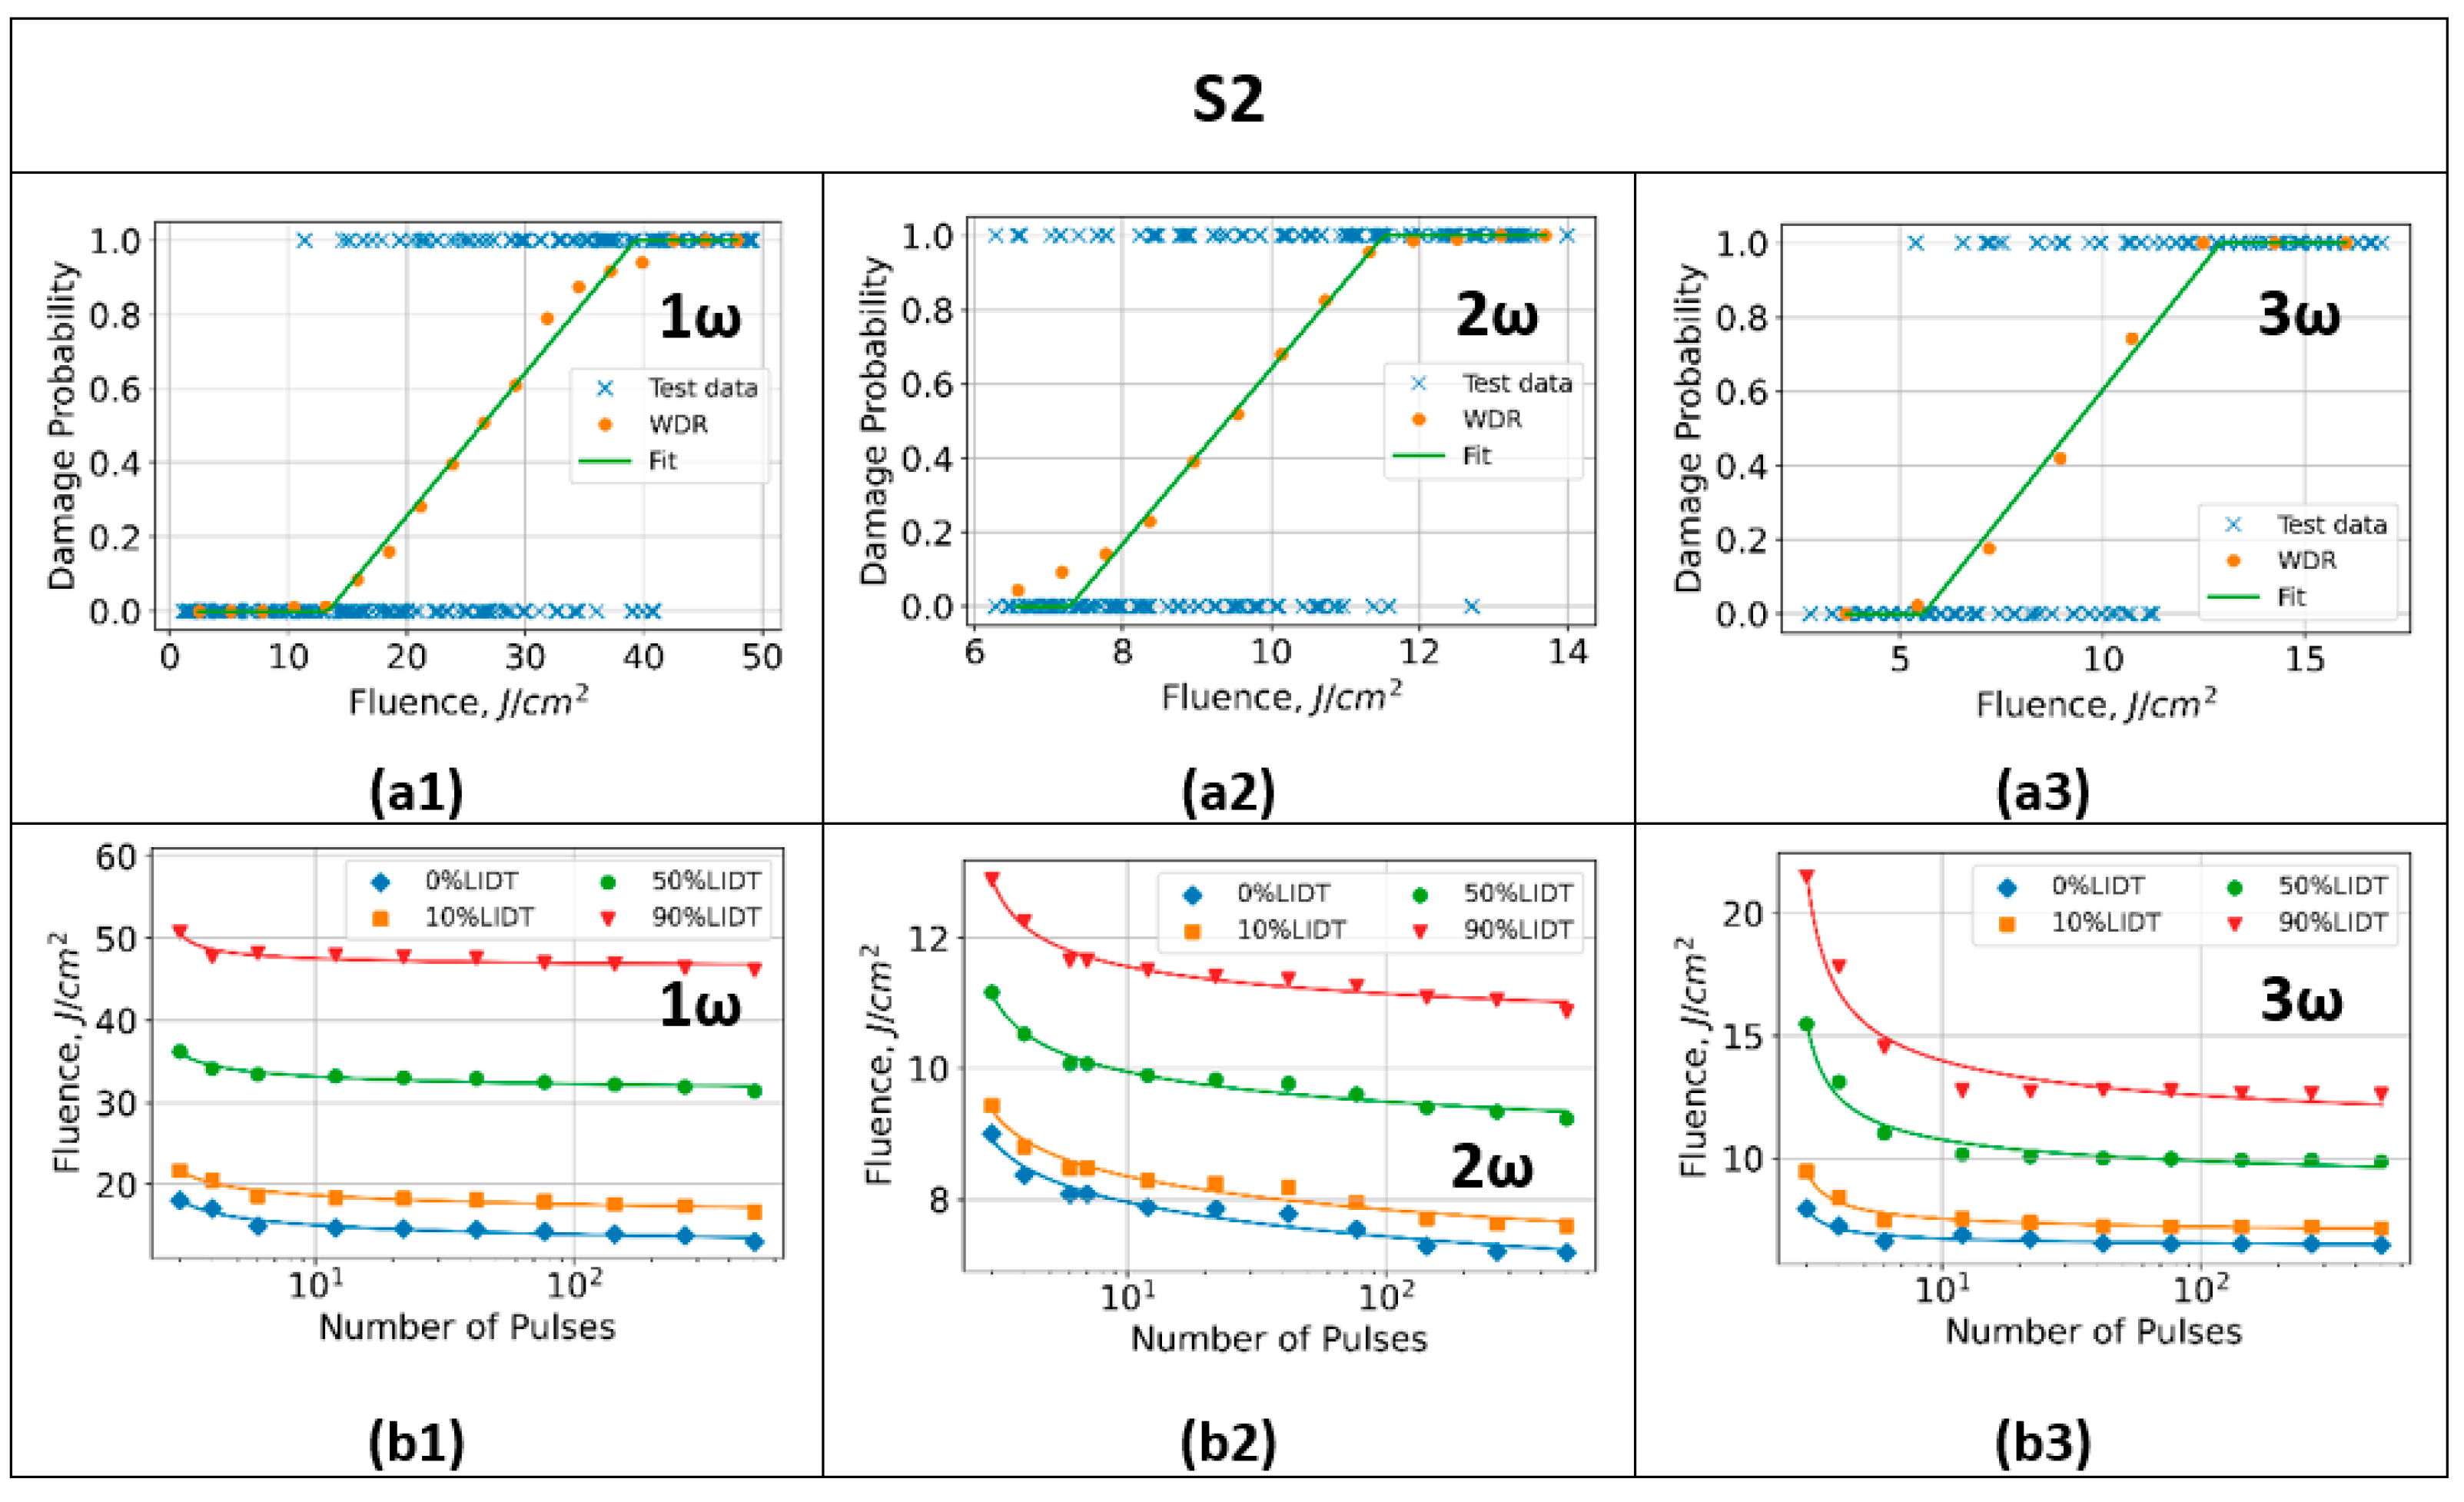
3.2.2. Characteristic Damage Curves

The maximum fluence value corresponding to a zero percent damage probability level is defined as the LIDT value of the sample under test. This work uses a linear function to extrapolate the damage probability to the zero level [8]. Typical results of the damage probability plots for specimens taken from samples S1, S2, and S3 are shown in Figure 8, Figure 9 and Figure 10(a1–a3), respectively. Table 2 summarizes the average LIDT values of the samples at each wavelength. The probability of multiphoton ionization is increased for shorter wavelengths [29], meaning fewer photons are needed to overcome the interband transitions. For this reason, LIDT values obtained at longer wavelengths are higher than those obtained at shorter wavelengths. This explains the wavelength-dependent variation in the average LIDT values of the samples summarized in Table 2, where the standard deviations describe the distribution of the calculation results. The total measurement uncertainty is presented in Section 3.2.3.
These results showed a significant discrepancy when comparing the LIDT values of slides obtained from different vendors, where the threshold values varied by up to two times, indicating notable differences between the samples.
It is worth noting here, in order to validate and more accurately compare the abovementioned LIDT values, in addition to the standard test data treatment method according to ISO 21254-2, a data reduction technique proposed in [27] was employed in the test data. The obtained experimental results fit well with the requirements of the data reduction technique. Therefore, it is expected that applying this technique would increase the precision of the statistical probability and decrease the error.
Please, note that the damage probability plots and characteristic damage curves in Figure 8, Figure 9 and Figure 10 were plotted using the data reduction technique. The resulting characteristic damage curves (corresponding to the damage probability plots, Figure 8, Figure 9 and Figure 10(a1–a3) and showing the fluences at 0%, 10%, 50%, and 90% damage probability levels versus the number of pulse shots are depicted in Figure 8, Figure 9 and Figure 10(b1–b3). All tested samples under multiple pulse irradiation demonstrated degradation of the LIDT value with increased pulses. A fitting function, F = F 0   n k , where F 0   is the single-shot LIDT, n is the number of pulses, and k is the constant factor of the fit, was fitted to all experimental data points for each sample and wavelength. The results indicate that all the samples demonstrate the fatigue effect.

3.2.3. Measurement Uncertainty

The uncertainty of the LIDT measurements was assessed according to the ISO 21254 recommendations. Commonly, two primary uncertainty sources, a systematic error due to the imperfection of the test system and data evaluation errors (the discretization errors due to the finite width of the fluence intervals), were considered. Once the setup was adjusted for a particular wavelength, no experimental parameters were modified to minimize the impact of systematic errors and to enforce identical experimental conditions for all samples.
Knowledge of the exact number of pulses at the moment of a damage event is one of the defining factors for the in situ statistical analysis of measured data, which has substantial significance in the accuracy of the S-on-1 method. In the LIDT system, the number of pulses fired before the damage event is determined in two independent ways: (i) with a timing sub-system of the setup and (ii) with the pulse energy monitoring system. The comparison of the number of counted pulses demonstrated that the difference was within two or three pulses. All energy meters involved in the experiments were calibrated and traceable to the UME radiometric scale. The total uncertainty in the absolute measurements, including the type B component obtained from the calibration certificate and the type A component standard deviation during the measurements, revealed values less than ±1.5% (at 1064 nm). The uncertainty in beam spot assessments at the focal point at 1/e2 diameter did not exceed ±3%.
Considering the aforementioned error values, we assume to have a total error allocation of 15%.

4. Discussion and Conclusions

In the present work, multiple-pulse (at 1064 nm, 532 nm, and 355 nm laser wavelengths) laser-damage studies were performed on microscope slide glasses. An accurate and reliable automated measurement system was used to perform a comparative study of microscope glass slides obtained from the three different manufacturers. The quantitative comparison of the LIDTs of the samples in this study was performed using an S-on-1 test protocol of the ISO 21254 standard.
Morphological observations revealed that, aside from infrequent color changes on the sample surface, which are more common in the 355 nm tests, a fatigue damage mechanism was observed across all samples. The damage morphology clearly illustrates that at longer wavelengths, prevailing damages exhibit crater-like patterns with central holes and diameters smaller than the beam diameter. In contrast, at 355 nm, the damage morphology differs significantly, featuring primarily shallow cracks or fractures (largely attributed to laser-induced mechanical stress) rather than the smoother profiles associated with crater-type damages. Typically, within the nanosecond laser pulse range, failures of bulk material components originate from impurities, defects, and inclusions.
During the initial laser pulses, these sources initiate small damage sites due to pronounced energy absorption and field intensification. These smaller initial damages, when exposed to additional laser irradiation, lead to an expansion of the affected area. The process, referred to as “damage growth” (for example, [36,37]), involves subsequent laser pulses with sufficient fluence that re-ignite the initial damage sites. Energy is then deposited around this region, heating these local centers and resulting in a significant temperature gradient and a high-pressure environment (in contrast to the uniformly adjusted areas). These mechanical and thermodynamic effects lead to micro-explosions, material melting, fragmentation, and generation of cracks in the material [38].
It has been demonstrated [37] that damage growth, akin to the damage initiation process, is influenced by factors including laser fluence and wavelength, as well as pulse duration and shape, the types of input and output surfaces, whether in air or vacuum. Recently, a robust correlation has been established between subsequent damage growth and the sizes (lateral size and vertical depth) and morphology of the initial damage sites [35].
As demonstrated in reference [18], the initial damage structures and morphologies exhibit a correlation with the laser wavelengths. A comparative investigation [35], contrasting the impact of 532 nm and 1064 nm laser irradiation, revealed distinct characteristics in initial damage sites and subsequent damage growth. Specifically, 532 nm laser irradiation led to the formation of numerous small craters, whereas under 1064-nm laser irradiation resulted in individual, large-sized, and deeper craters.
Moreover, a strong correlation has been found between the absorption coefficient of the defects and the laser-induced damage threshold of the surface, determining the damage morphologies [35,37]. The defects’ absorption coefficient strongly depends on the wavelength of the absorbed light. At shorter laser irradiation wavelengths, the higher photon energies and enhanced absorption effects of impurities and defects result in the rapid formation of damage structures. These include scattered small initial damage craters and material evaporation. Furthermore, as demonstrated in [18,36], the use of 355 nm laser irradiation produces a distinct damage morphology characterized by scattered, small, and shallow craters, a consequence of dispersed absorptive defects. Even with increased fluence, the laser energy is directed toward the rapid generation of numerous dispersed damage sites. This occurs before the individual sites undergo further growth, eventually encompassing the area of the laser beam. In contrast, the formation of macroscopic damages, such as large-scale craters and cracks, necessitates the substantial accumulation and subsequent release of thermal and mechanical stress.
Our findings across all tested samples and wavelengths exhibit a consistent pattern. With the exception of the 532 nm damage morphology, characterized by the predominance of single crater-like damages followed by the formation of numerous small craters (as observed in high-purity fused silica-based optical glasses [35]), the damage morphology at the other two wavelengths closely aligns with the descriptions above and in the literature. Our findings also confirm that when applying short wavelengths for UV applications, predominantly smaller inclusions and impurities with higher damage precursor densities will cause damage, as was observed for the damage at 355 nm.
The quantitative analysis of the test results demonstrated that the variation in the LIDT value for samples from the same vendor did not exceed a few tens of percent. However, the LIDT values of the glass slide samples obtained from different vendors varied significantly, with the threshold values differing by up to two times. This study highlights the importance of conscientiously evaluating the origin of glass materials when selecting microscope glass slides for laser-sensitive applications.

Author Contributions

Conceptualization, H.N. and P.T.; methodology, H.N. and F.Y.; software, Ö.F.K.; validation, P.T. and R.H.; formal analysis, R.H. and Ö.F.K.; investigation, H.N. and P.T.; data curation, P.T. and F.Y.; morphological analysis, Ö.F.K. and P.T.; writing—original draft preparation, H.N.; writing—review and editing, all authors; visualization, P.T. and Ö.F.K. All authors have read and agreed to the published version of the manuscript.

Funding

This research was funded by the Scientific and Technological Research Council of Turkey (TÜBİTAK) ARDEB 2568 Grant No 121N767.

Institutional Review Board Statement

Not applicable.

Informed Consent Statement

Not applicable.

Data Availability Statement

Data presented in this work are not publicly available at this time but can be obtained upon reasonable request from the authors.

Acknowledgments

The authors are grateful to anonymous referees for their useful comments and constructive suggestions. The authors thank Ayşe Gökçe ÖZBAY for her technical support during the optical profilometer measurements.

Conflicts of Interest

The authors declare no conflict of interest.

References

  1. Wan, Z.; Nguyen, N.; Gao, Y.; Li, Q. Laser-induced graphene for biosensors. Sustain. Mater. Technol. 2020, 25, e00205. [Google Scholar] [CrossRef]
  2. Mukundan, H.; Anderson, A.S.; Grace, W.K.; Grace, K.M.; Hartman, N.; Martinez, J.S.; Swanson, B.I. Waveguide-Based Biosensors for Pathogen Detection. Sensors 2009, 9, 5783–5809. [Google Scholar] [CrossRef]
  3. Ming, Y.; Hao, S.; Wang, F.; Lewis-Israeli, Y.R.; Volmert, B.D.; Xu, Z.; Goestenkors, A.; Aguirre, A.; Zhou, C. Longitudinal morphological and functional characterization of human heart organoids using optical coherence tomography. Biosens Bioelectron. 2022, 207, 114136. [Google Scholar] [CrossRef] [PubMed]
  4. Kwaśny, M.; Bombalska, A. Applications of Laser-Induced Fluorescence in Medicine. Sensors 2022, 22, 2956. [Google Scholar] [CrossRef]
  5. Papp, Z.F.; Demel, U.; Tilz, G.P. Laser scanning confocal fluorescence microscopy: An overview. Int. Immunopharmacol. 2003, 3, 1715–1729. [Google Scholar] [CrossRef]
  6. Wood, R.M. Damage Theory. In Laser-Induced Damage of Optical Materials, 1st ed.; Brown, R.G.W., Pike, E.R., Eds.; Institute of Physics Publishing: Bristol, UK; Philadelphia, PA, USA, 2003; pp. 54–99. [Google Scholar]
  7. ISO (International Organization for Standardization). Lasers and Laser-Related Equipment—Test Methods for Laser-Radiation-Induced Damage Threshold—Part 1: Definitions and General Principles; ISO 21254-1; ISO: Geneva, Switzerland, 2011. [Google Scholar]
  8. ISO (International Organization for Standardization). Lasers and Laser-Related Equipment—Test Methods for Laser-Radiation-Induced Damage Threshold—Part 2: Threshold Determination; 21254-2; ISO: Geneva, Switzerland, 2011. [Google Scholar]
  9. ISO (International Organization for Standardization). Lasers and Laser-Related Equipment—Test Methods for Laser-Radiation-Induced Damage Threshold—Part 3: Assurance of Laser Power (Energy) Handling Capabilities; 21254-3; ISO: Geneva, Switzerland, 2011. [Google Scholar]
  10. ISO (International Organization for Standardization). Lasers and Laser-Related Equipment—Test Methods for Laser-Radiation-Induced Damage Threshold—Part 4: Inspection, Detection and Measurement; 21254-4; ISO: Geneva, Switzerland, 2011. [Google Scholar]
  11. Stratan, A.; Zorila, A.; Rusen, L.; Simion, S.; Blanaru, C.; Fenic, C.; Neagu, L.; Nemes, G. Automated test station for laser-induced damage threshold measurements according to ISO 21254-1,2,3,4 standards. In Laser-Induced Damage in Optical Materials: 2012; SPIE: Bellingham, WA, USA, 2012; Volume 85301, pp. 85301Y-1–85301Y-9. [Google Scholar] [CrossRef]
  12. Melninkaitis, A.; Miksys, D.; Balciunas, T.; Balachninaite, O.; Rakickas, T.; Grigonis, R.; Sirutkaitis, V. Automated test station for laser-induced damage threshold measurements according to ISO 11254-2 standard. In Laser Beam Control and Applications; SPIE: Bellingham, WA, USA, 2006; Volume 6101, pp. 61011J-1–61011J-10. [Google Scholar] [CrossRef]
  13. Ma, B.; Zhang, Y.; Ma, H.; Liu, H.; Ji, Y. Automated laser damage threshold test systems of different test modes for optical elements. In Laser-Induced Damage in Optical Materials: 2012; SPIE: Bellingham, WA, USA, 2012; Volume 8530, pp. 85301P-1–85301P-8. [Google Scholar] [CrossRef]
  14. Allenspacher, P.; Riede, W.; Wernham, D.; Capanni, A.; Era, F. Vacuum laser damage test bench. In Laser-Induced Damage in Optical Materials: 2005; SPIE: Bellingham, WA, USA, 2005; Volume 5991, pp. 599128-1–599128-9. [Google Scholar] [CrossRef]
  15. Riede, W.; Allenspacher, P.; Schrröder, H.; Wernham, D.; Lien, Y. Laser-induced hydrocarbon contamination in vacuum. In Laser-Induced Damage in Optical Materials: 2005; SPIE: Bellingham, WA, USA, 2005; Volume 5991, pp. 59910H-1–59910H-13. [Google Scholar] [CrossRef]
  16. Zhu, C.; Liang, L.; Yuan, H.; Zhou, L.; Li, Y.; Wang, W. Investigation of stress wave and damage morphology growth generated by laser-induced damage on rear surface of fused silica. Opt. Express 2020, 28, 3942–3951. [Google Scholar] [CrossRef] [PubMed]
  17. Yang, L.; Xiang, X.; Yuan, X.; Zheng, W.; He, S.; Lv, H.; Yan, Z.; Wang, H.; Liao, W.; Miao, X.; et al. Bulk damage and stress behavior of fused silica irradiated by nanosecond laser. Opt. Eng. 2014, 53, 047103. [Google Scholar] [CrossRef]
  18. Ma, B.; Ma, H.; Jiao, H.; Cheng, X.; Wang, Z. Damage growth characteristics of different initial damage sites of fused silica under 355nm small laser beam irradiation. Opt. Laser Technol. 2014, 57, 136–144. [Google Scholar] [CrossRef]
  19. Dahmani, F.; Lambropoulos, J.C.; Schmid, A.W.; Papernov, S.; Burns, S.J. Crack arrest and stress dependence of laser-induced surface damage in fused-silica and borosilicate glass. Appl. Opt. 1999, 38, 6892–6903. [Google Scholar] [CrossRef]
  20. Shi, Z.; Sun, L.; Shao, T.; Liu, H.; Huang, J.; Ye, X.; Wang, F.; Yang, L.; Zheng, W. Statistically Correlating Laser-Induced Damage Performance with Photothermal Absorption for Fused Silica Optics in a High-Power Laser System. Photonics 2022, 9, 137. [Google Scholar] [CrossRef]
  21. Jee, Y.; Becker, M.F.; Walser, R.M. Laser-induced damage on single-crystal metal surfaces. J. Opt. Soc. Am. B Opt. Phys. 1988, 5, 648–659. [Google Scholar] [CrossRef]
  22. Ma, B.; Wang, K.; Han, J.; Zhang, Z.; Cheng, X. Difference in laser-induced damage behavior between back and front surfaces. Laser Phys. 2020, 30, 036003. [Google Scholar] [CrossRef]
  23. Scheer, U. Historical roots of centrosome research: Discovery of Boveri’s microscope slides in Würzburg. Phil. Trans. R. Soc. B 2014, 369, 20130469. [Google Scholar] [CrossRef]
  24. Wilson, C.R.; Hutchens, T.C.; Busse, L.E.; Frantz, H.A.; Shaw, L.B.; Sanghera, J.S.; Aggarwal, I.D. Antireflective structured surfaces on soda-lime windows for high power laser applications. In Advanced Optics for Imaging Applications: UV through LWIR V; SPIE: Bellingham, WA, USA, 2020; Volume 11403, pp. 114030H-1–114030H-5. [Google Scholar] [CrossRef]
  25. Melninkaitis, A.; Rakickas, T.; Miksys, D.; Grigonis, R.; Sirutkaitis, V.; Skrebutenas, A.; Buzelis, R.D.; Abromavicius, G.; Juskenas, R.; Selskis, A. Effect of deposition method and substrate surface quality on laser-induced damage threshold for repetitive 13-ns and 130-fs pulses. In Laser-Induced Damage in Optical Materials: 2004; SPIE: Bellingham, WA, USA, 2004; Volume 5647, pp. 43–52. [Google Scholar] [CrossRef]
  26. Bingelyte, V.; Sirutkaitis, V.; Eckardt, R.C. S-on-1-induced damage thresholds of high-reflection metallic coatings at 1064 nm. In Laser-Induced Damage in Optical Materials: 2002, Proceedings of the 7th International Workshop on Laser Beam and Optics Characterization, San Diego, CA, USA, 22–23 August 2003; SPIE: Bellingham, WA, USA, 2002; Volume 4932, pp. 513–519. [Google Scholar] [CrossRef]
  27. Jensen, L.; Mrohs, M.; Gyamfi, M.; Mädebach, H.; Ristau, D. Higher certainty of the laser-induced damage threshold test with a redistributing data treatment. Rev. Sci. Instrum. 2015, 86, 103106. [Google Scholar] [CrossRef]
  28. Liu, J.M. Simple technique for measurements of pulsed Gaussian-beam spot sizes. Opt. Lett. 1982, 7, 196–198. [Google Scholar] [CrossRef]
  29. Rastogi, V.; Chaurasia, S.; Munda, D.S. Laser induced damage studies in borosilicate glass using nanosecond and sub nanosecond pulses. J. Non Cryst. Solids 2017, 463, 138–147. [Google Scholar] [CrossRef]
  30. Stuart, B.C.; Feit, M.D.; Rubenchik, A.M.; Shore, B.W.; Perry, M.D. Laser-Induced Damage in Dielectrics with Nanosecond to Subpicosecond Pulses. Phys. Rev. Lett. 1995, 74, 2248–2251. [Google Scholar] [CrossRef]
  31. Stuart, B.C.; Feit, M.D.; Herman, S.; Rubenchik, A.M.; Shore, B.W.; Perry, M.D. Nanosecond-to-femtosecond laser-induced breakdown in dielectrics. Phys. Rev. B 1996, 53, 1749–1761. [Google Scholar] [CrossRef]
  32. Vogel, A.; Busch, S.; Jungnickel, K.; Birngruber, R. Mechanisms of intraocular photodisruption with picosecond and nanosecond laser pulses. Lasers Surg. Med. 1994, 15, 32–43. [Google Scholar] [CrossRef]
  33. Chen, X.Q.; Zu, X.-T.; Zheng, W.-G.; Jiang, X.D.; Lü, H.B.; Ren, H.; Zhang, Y.Z.; Liu, C.M. Experimental research of laser-induced damage mechanism of the sol-gel SiO2 and IBSD SiO2 thin films. Acta Phys. Sin. 2006, 55, 1201–1206. [Google Scholar] [CrossRef]
  34. Kuzuu, N.; Yoshida, K.; Yoshida, H.; Kamimura, T.; Kamisugi, N. Laser-induced bulk damage in various types of vitreous silica at 1064, 532, 355, and 266 nm: Evidence of different dam-age mechanisms between 266-nm and longer wavelengths. Appl. Opt. 1999, 38, 2510–2515. [Google Scholar] [CrossRef]
  35. Ma, B.; Ma, H.; Jiao, H.; Cheng, X.; Wang, Z. Laser-damage growth characteristics of fused silica under 1064- and 532-nm laser irradiation. Opt. Eng. 2013, 52, 116106. [Google Scholar] [CrossRef]
  36. Zhang, L.; Ma, B.; Wang, K.; Jiao, X.; Cheng, X.; Wang, Z. Morphology and growth properties of nano- and submicrometer-scale initial damage sites under 355  nm wavelength pulsed laser irradiation. Appl. Opt. 2018, 57, 3166–3171. [Google Scholar] [CrossRef]
  37. Norton, M.A.; Adams, J.J.; Carr, C.W.; Donohue, E.E.; Feit, D.M.; Hackel, R.P.; Hollingsworth, W.G.; Jarboe, A.J.; Matthews, M.J.; Rubenchik, A.M.; et al. Growth of laser damage in fused silica: Diameter to depth ratio. In Laser-Induced Damage in Optical Materials: 2007; SPIE: Bellingham, WA, USA, 2007; Volume 6720, pp. 67200H-1–67200H-10. [Google Scholar] [CrossRef]
  38. Zhang, F.; Miao, X.; Wang, B.; Liu, X.; Xu, M.; Liu, H.; Lü, T.; Qiu, R.; Guo, D.; Zhou, Q. Nanosecond laser-induced multi-focusing damage in the bulk of fused silica. Opt. Commun. 2023, 533, 129305. [Google Scholar] [CrossRef]
Figure 1. Experimental setup of the S-on-1 damage threshold tests.
Photonics 10 00967 g001
Figure 2. Schematic representation of test sites.
Photonics 10 00967 g002
Figure 3. (a) Energy stability of the laser at 1064 nm; (b) temporal pulse profile of typical laser pulse at 1064 nm.
Photonics 10 00967 g003
Figure 4. (ac) An example of 2D beam profiles and a cross-section in the X-axis of the laser beam at 1ω, 2ω, and 3ω, respectively.
Photonics 10 00967 g004
Figure 5. (ac) Typical images (DIC, 20×) of damage sites at 1ω, 2ω, and 3ω, respectively.
Photonics 10 00967 g005
Figure 6. (a1a3,b1b3) An example of 3D profiles of damage sites at 1ω, 2ω, and 3ω, respectively.
Photonics 10 00967 g006
Figure 7. (ac) The histograms of the damage diameter distributions.
Photonics 10 00967 g007
Figure 8. Representative test results for a specimen from S1 set: (a1a3) damage probability vs. laser fluence; (b1b3) the corresponding S-on-1 characteristic damage curves.
Photonics 10 00967 g008
Figure 9. Representative test results for a specimen from S2 set: (a1a3) damage probability vs. laser fluence; (b1b3) the corresponding S-on-1 characteristic damage curves.
Photonics 10 00967 g009
Figure 10. Representative test results for a specimen from S3 set: (a1a3) damage probability vs. laser fluence; (b1b3) the corresponding S-on-1 characteristic damage curves.
Photonics 10 00967 g010
Table 1. The energetic parameters of the LIDT system.
Wavelength
(nm)
Output
Energy (mJ)
Energy
Stability
(StdDev, %)
Beam   Quality   M 2 Spot Size
(μm)
Spot Area
(10−4 cm2)
Maximum
Fluence
(J/cm)2
1064150<0.51.64538.13820
53260<1.51.75029.91528
35537<2.02.25039.9236
Table 2. The average LIDT values and the standard deviations of three samples for the zero percent damage probability.
S1
LIDT
(J/cm)2
S2
LIDT
(J/cm)2
S3
LIDT
(J/cm)2
1064 nm19.3 ± 0.914.0 ± 0.913.4 ± 2.2
532 nm11.7 ± 0.57.5 ± 0.98.0 ± 1.3
355 nm8.6 ± 0.86.5 ± 0.74.5 ± 2.1
Disclaimer/Publisher’s Note: The statements, opinions and data contained in all publications are solely those of the individual author(s) and contributor(s) and not of MDPI and/or the editor(s). MDPI and/or the editor(s) disclaim responsibility for any injury to people or property resulting from any ideas, methods, instructions or products referred to in the content.

