Abstract
In order to address the issue of large-aperture optical windows operating in wind tunnel environments with dynamic responses, the damping ratio between the vibration isolation device and the mass of the system was calculated by the passive vibration isolation principle. Two isolation models using circular rubber pads and rectangular rubber pads were proposed, and it was proven that the stiffness value of the circular rubber pad is superior to that of the rectangular rubber pad. A three-dimensional model of the optical window was established using finite element analysis software to simulate the working vibration environment of the optical window. Modal analysis and harmonic response analysis were carried out on the optical system with the isolation device installed, and the nodal data of the optical glass surface changes in the optical window were input into the Zemax 19.4 optical design software in the form of Zernike coefficients to calculate imaging quality evaluation indicators. Through finite element structural analysis of the optical window and evaluation of optical performance indicators, it was demonstrated that under the background of the wind tunnel working environment, the isolation performance of the circular rubber pad in the isolation device of the optical window is superior to that of the rectangular rubber pad. This study can provide a design basis for the isolation analysis methods and isolation measures of optical windows in wind tunnel working environments. These research results have implications for the development of large-aperture optical windows in high-speed wind tunnel applications.
1. Introduction
In recent years, the optical inspection and airport spatial information acquisition fields have seen rapid development in technologies such as laser interferometry, aerial optical remote sensing, and infrared detection [1,2,3]. As a result, optical windows have become essential protective devices in various optical systems. In particular, in the complex environment of wind tunnels, optical windows play a crucial role in ensuring that the internal environment is free from external pollutants and maintaining the airtightness of the wind tunnel. Additionally, they reduce the interference of environmental factors on the measurement quality of the optical system. Therefore, analyzing the strength of the optical window is essential to ensure the quality of the optical system beam input and output and improve the stability of each precision measurement element inside the window. In summary, the analysis of optical window intensity is of utmost importance in modern optical system design and development [4,5,6].
In the early 1950s, the United States, the former Soviet Union, and other countries began the research on pneumatic optical windows and produced pneumatic optical windows for the use of high-energy laser emission system requirements, usually for small-aperture optical windows with diameters below 150 mm [7,8]. In the mid-1990s, the United States worked with space cameras, developing a large-aperture long focal length parallel light tube device to detect the SIRTF (NASA’S space infrared telescope facility) [9,10]. Since the 21st century, countries have increased their research on various types of optical windows in special environments, and the effect of aerodynamic optics on optical windows was analyzed in detail by Zhang et al. by combining optical transmission theory and numerical simulation methods [11]. Luo et al. calculated the surface deformation of ZnS flat optical windows under different environmental conditions and the effect of this deformation on the imaging quality of optical systems based on the principle of hydrodynamic analysis [12]. Crahan et al. studied the spherical optical windows of airborne high-energy laser systems and mitigated the effect of the optical windows on the beam emitted in the transient mode [13]. Lucca et al. investigated the aerodynamic optical effects and mechanical jitter of the optical window, with the field of view varying between 90° and 118°, and obtained the spatial distribution of the aerodynamic optical aberrations of the flat optical window [14]. Zhang et al. proposed an intermediate ring band auxiliary support form based on ordinary ring band support, which effectively reduces the wavefront error of the optical window and improves the support efficiency of the optical window with a large diameter-to-thickness ratio [15]. To understand and evaluate the use of optical windows as materials for high-speed solid shock wave detectors, Mithun et al. conducted experimental studies on high-speed collisions of laser emitting flyers with polycrystalline, glass, or polymer windows. The results showed that borosilicate crown glass (BK7) is one of the best optical windows [16]. Tahir et al. discussed some important considerations for the design of special specification optical windows for mid-wave infrared (MWIR) optical systems, such as the material used and the minimum thickness associated with the rated pressure to optimize the design of this optical window [17]. Liu et al. designed a large-aperture spliced optical window based on the principle of optical–mechanical–thermal integration and analyzed its optical properties in a force–thermal dynamic environment [18].
Based on the background of wind tunnel measurement research presented in this article, practical engineering experience has shown that airflow turbulence and noise generated during the operation of impulse-type wind tunnels can cause vibrations of optical windows on the side walls of the wind tunnel, finally leading to their failure [19,20]. To address this issue, based on the principle of vibration isolation, a vibration model of large-diameter circular flat optical windows with a specific field of view range was established. Finite element analysis software was utilized to perform modal analysis and harmonic response analysis on optical windows with different isolation schemes, which enabled the calculation of resonance frequency of the optical window system and the deformation of the window surface. Surface node data of the optical window obtained from harmonic response analysis were fitted with Zernike polynomials, and the resulting Zernike coefficients were input into the Zemax 19.4 optical software to calculate the wavefront distortion and modulation transfer function (MTF) curve, thereby verifying the feasibility of the optical windows with different isolation schemes working under this wind tunnel. These discoveries hold significant implications for devising vibration damping structures tailored to large-diameter optical windows.
2. Optical Window Structure Composition and Vibration Theory Analysis
2.1. The Composition of Optical Window Structure
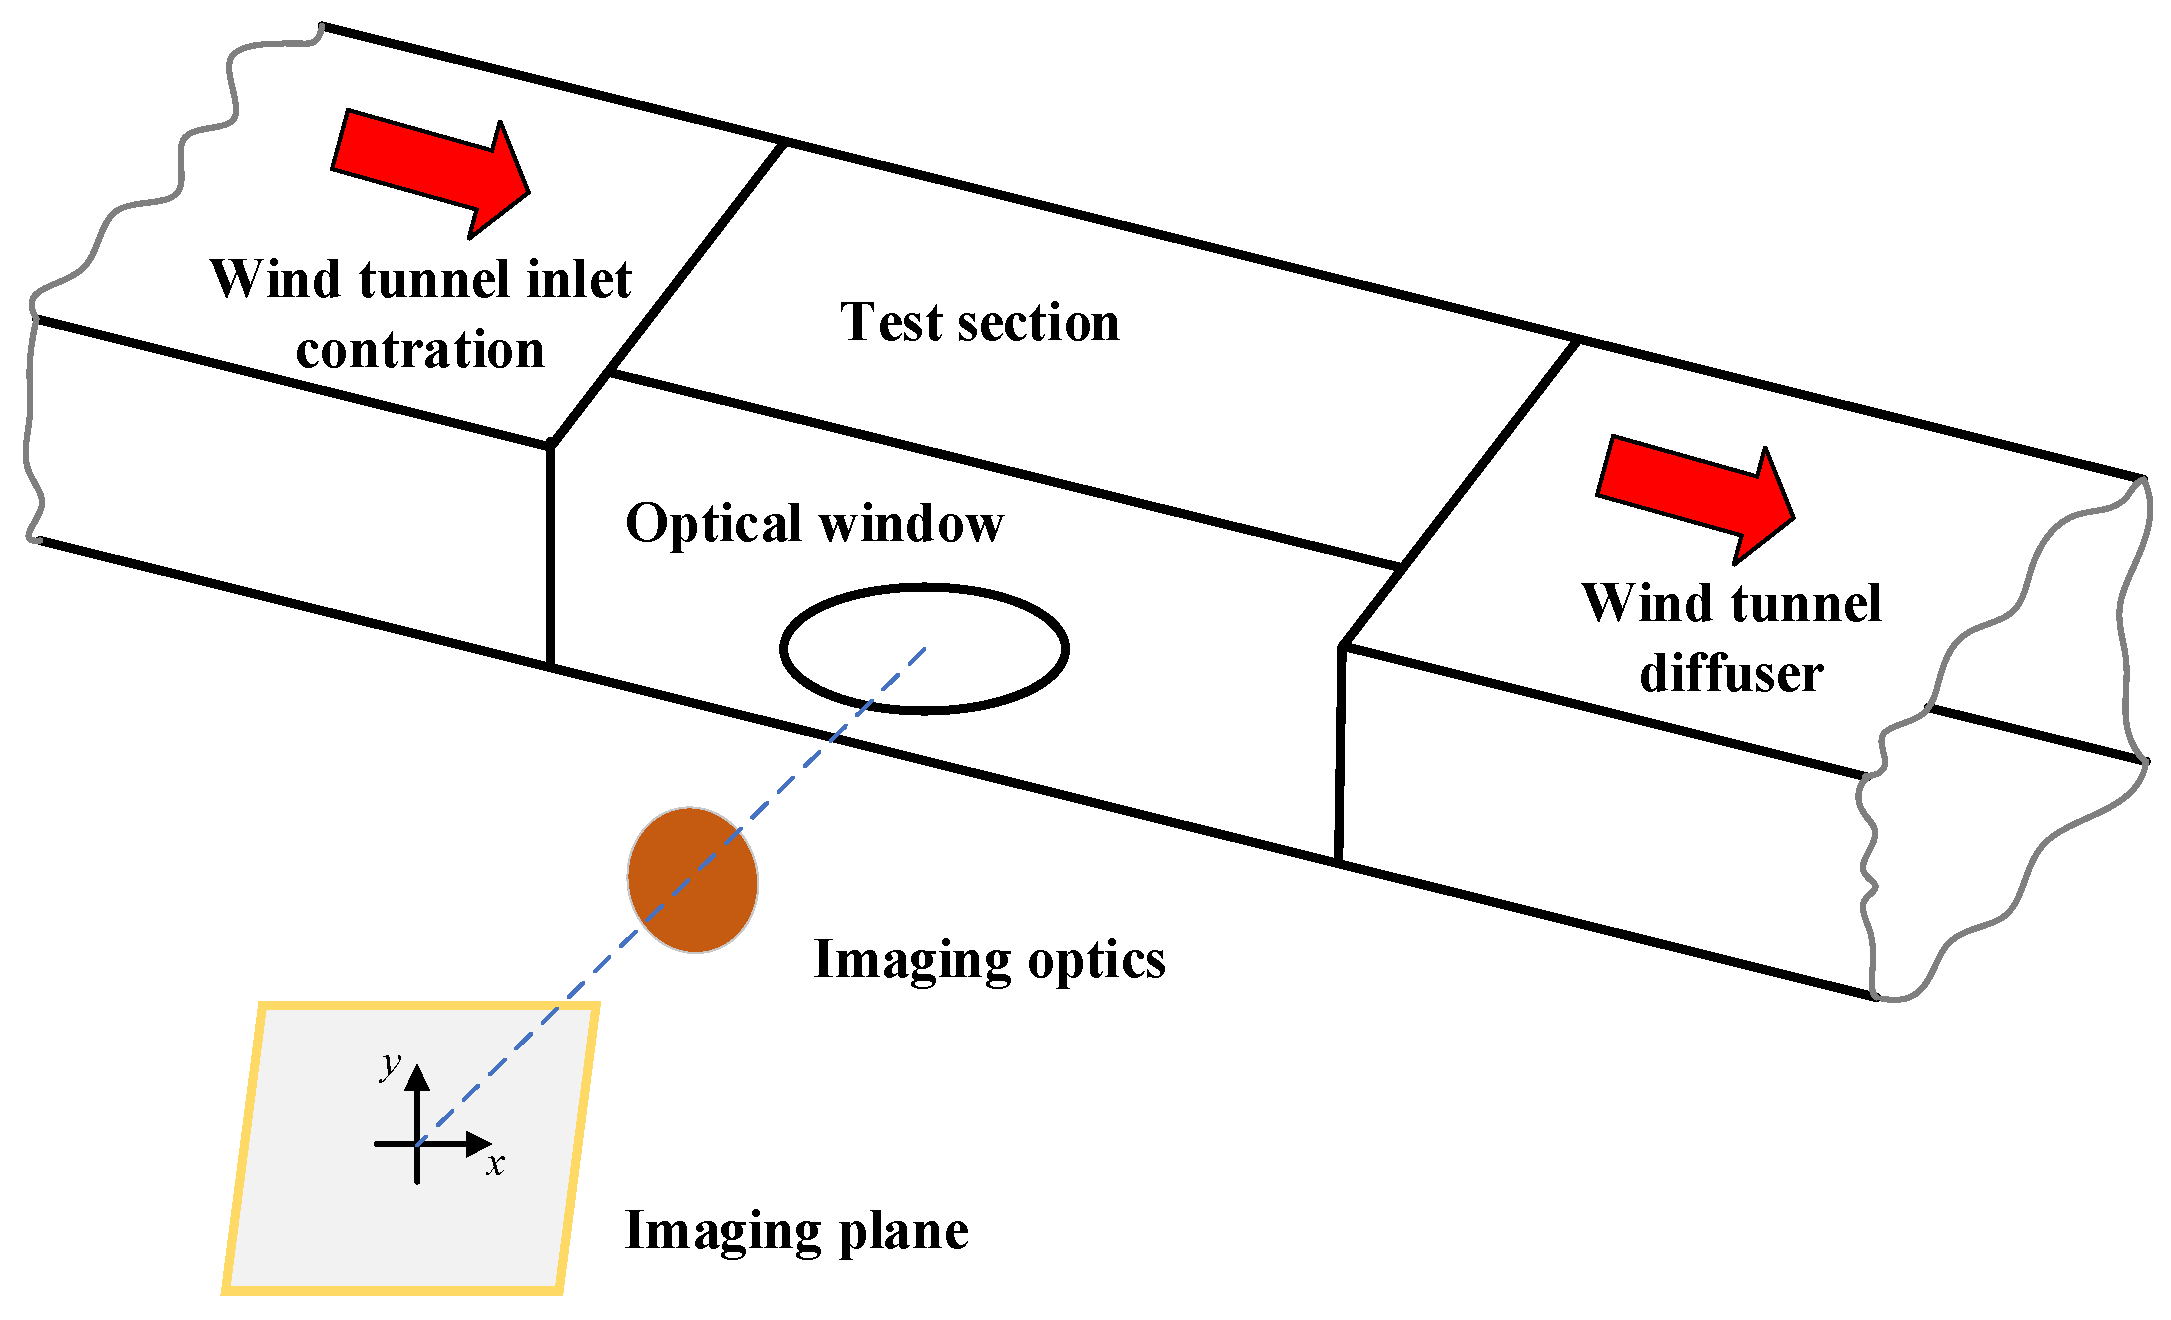
An intermittent wind tunnel is a pipe-like device that can artificially produce and control airflow in order to simulate the flow of gas around an aircraft or object, measure the effects of the airflow on the object, and observe corresponding physical phenomena [21,22,23]. The wind tunnel, as shown in Figure 1, is composed of a test section, optical windows, measurement equipment, and test objects. The test objects, such as aircrafts, are placed inside the test section, while measurement equipment, such as high-speed cameras and interferometers, are placed outside the wind tunnel. The measurement equipment observes the experimental data inside the wind tunnel through optical windows, which reduce the impact of the complex environment inside the wind tunnel on the measurement equipment. Due to the field of view requirements of the measurement equipment, the aperture of the optical window is up to 380 mm, far larger than that of traditional airborne optoelectronic detection windows.
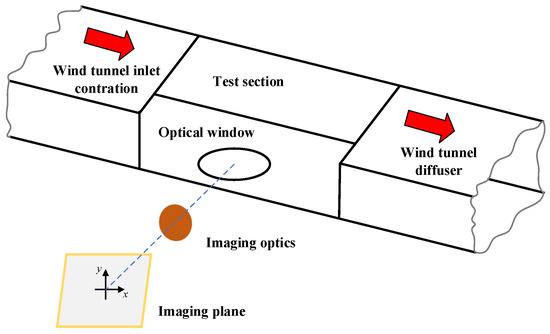
Figure 1.
Schematic diagram of the wind tunnel.
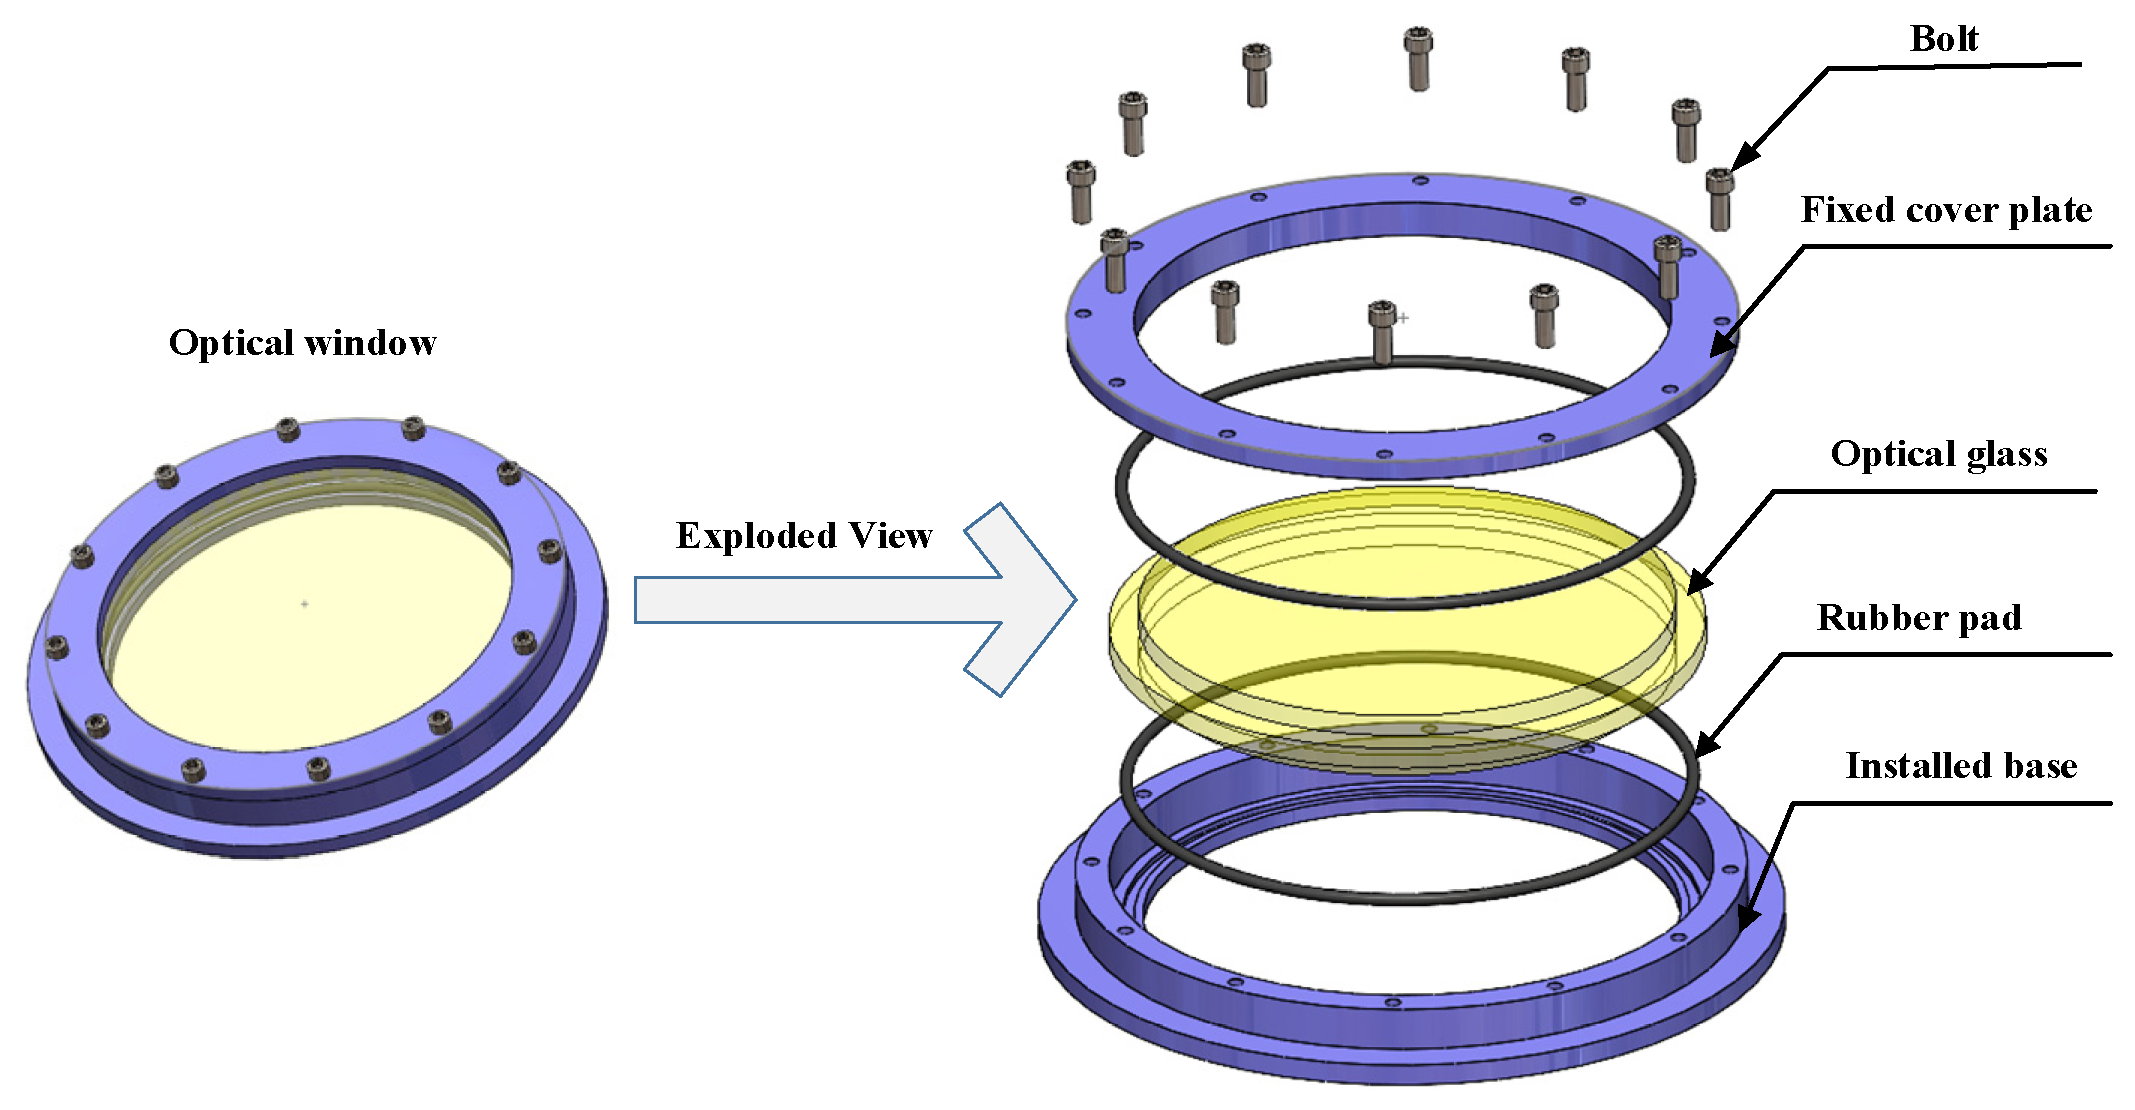
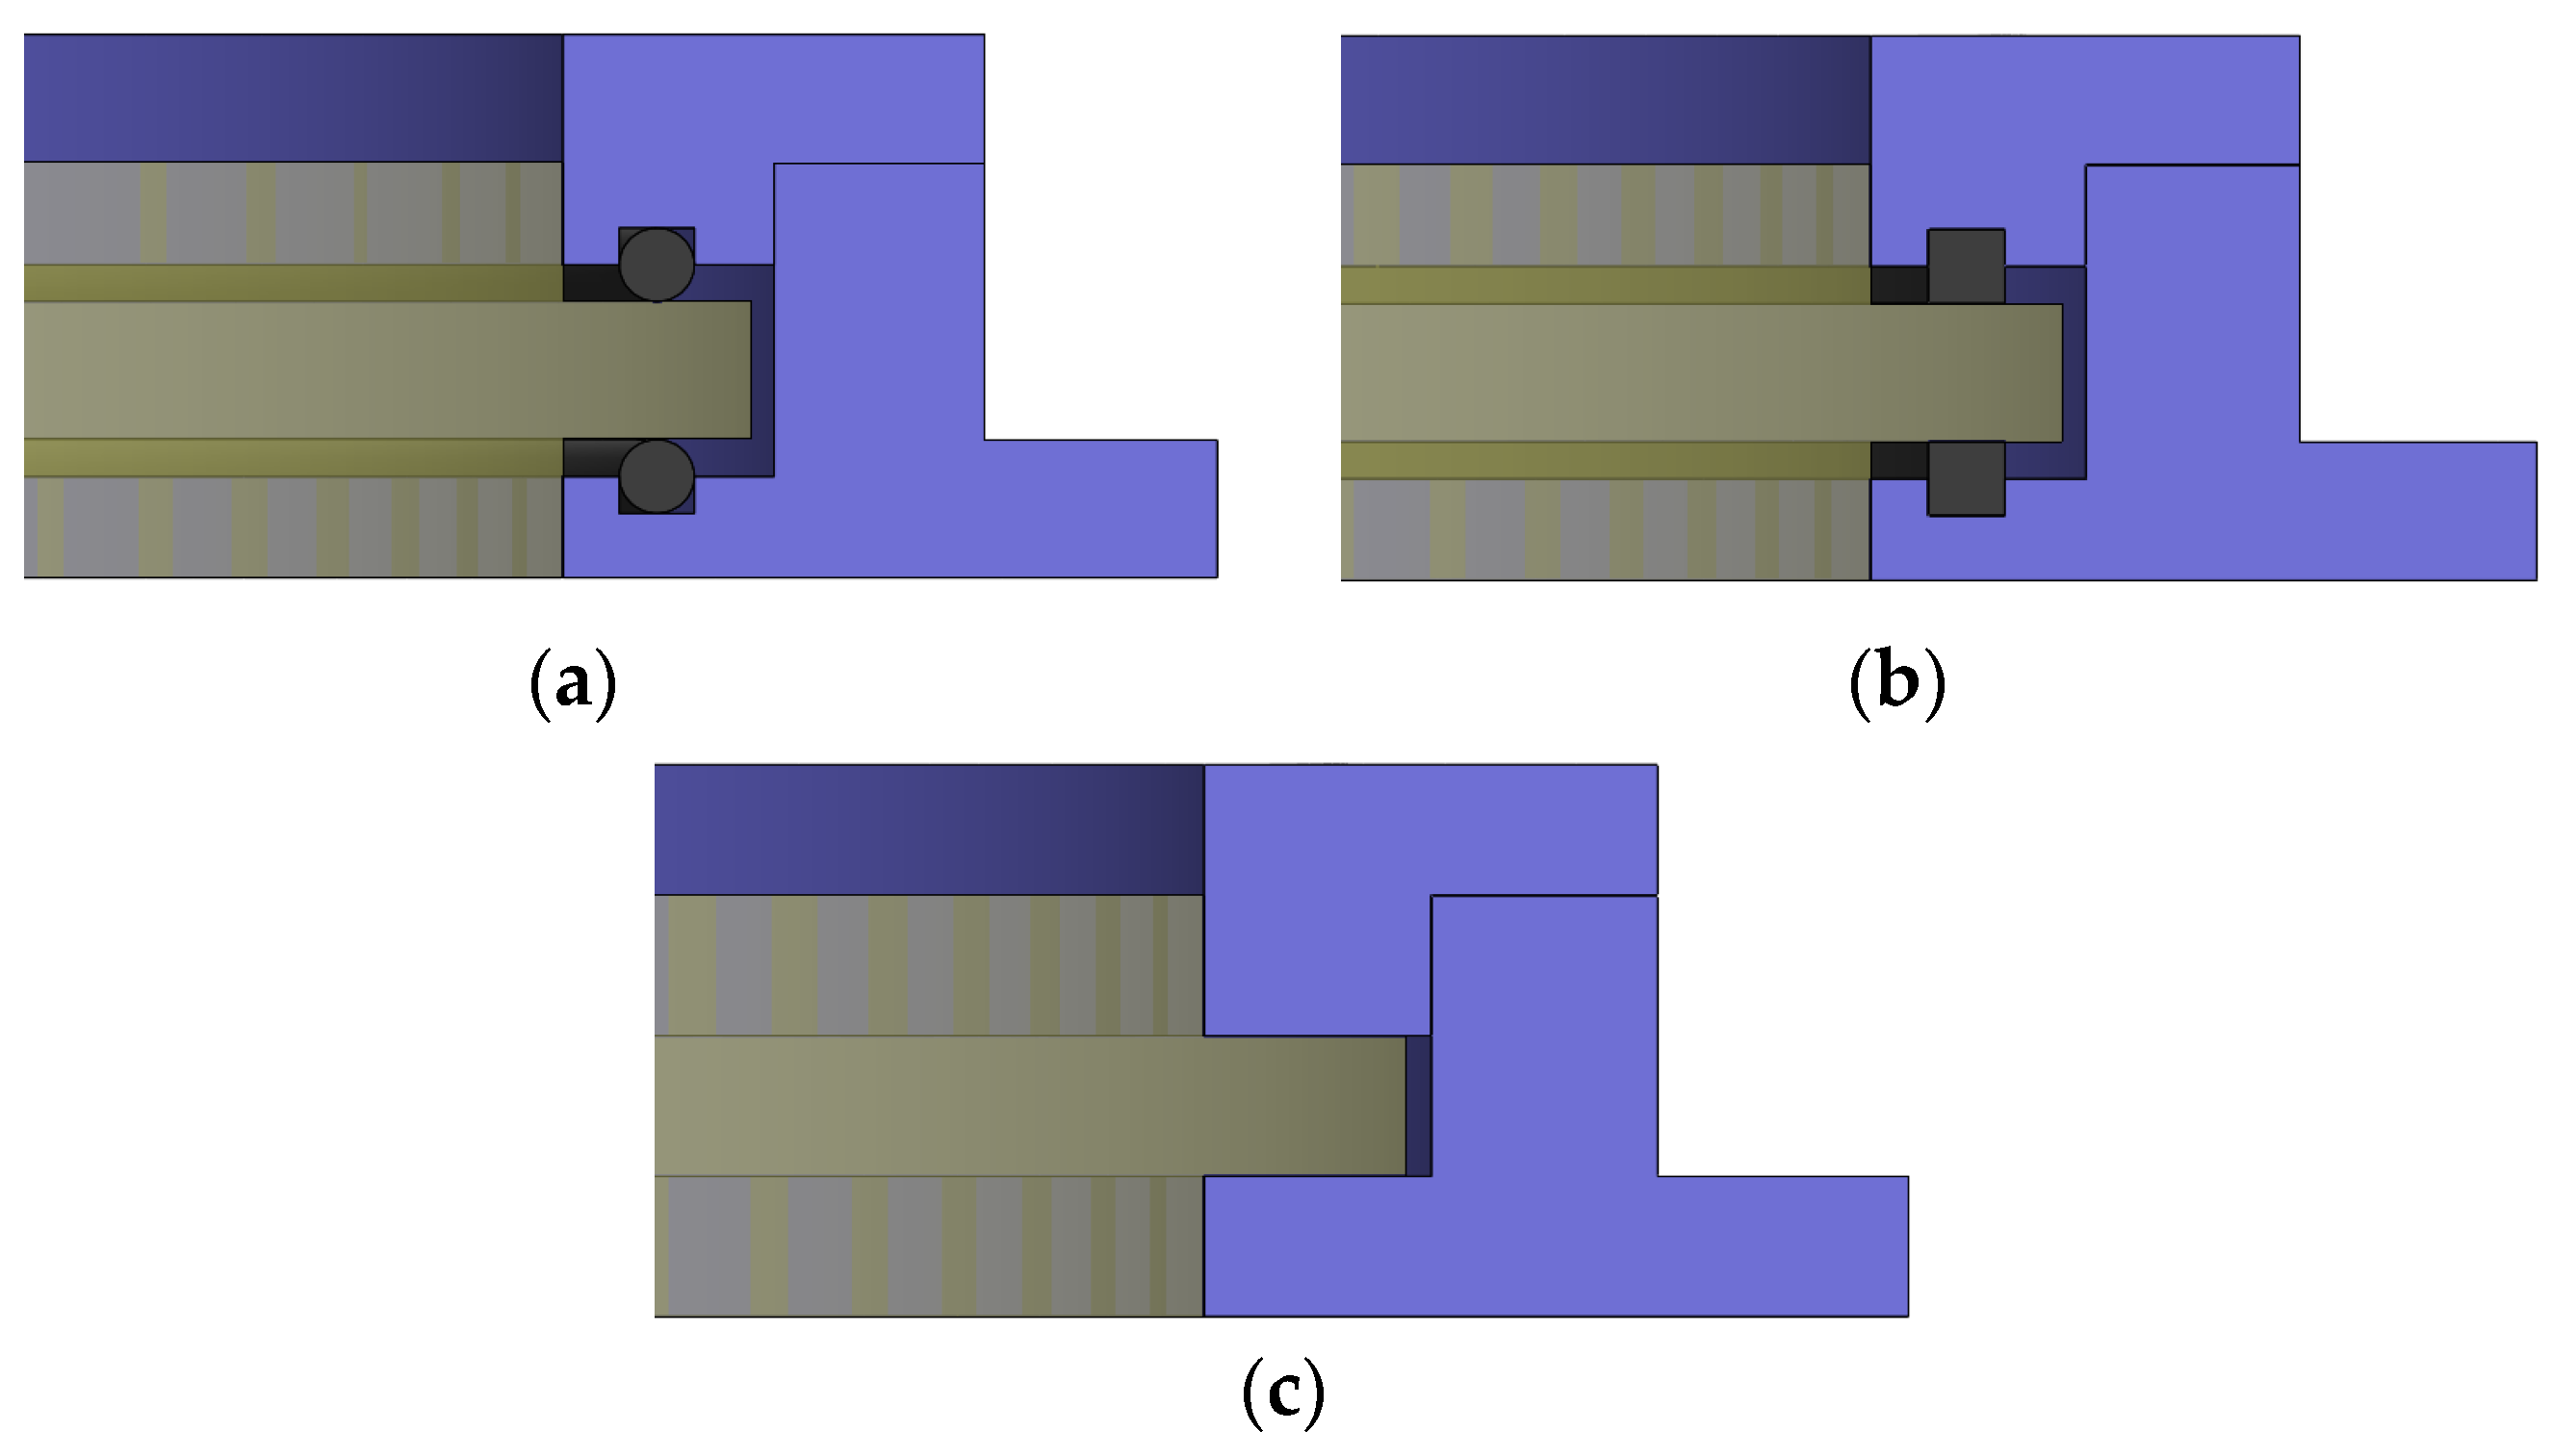
With the continuous development of optoelectronic systems, the technology of optical windows has been widely used in the field of wind tunnel measurements due to its unique advantages. However, the vibration phenomenon of the optical window caused by the noise and fluctuating airflow in the transient jet wind tunnel working environment can lead to changes in the surface shape of the window, thus reducing the imaging quality of the external optical system. To reduce the impact of vibration on the optical window, a corresponding isolation device, as shown in Figure 2, is required. The optical window structure mainly consists of a window base, optical glass, pressure plate, and isolation rubber pad, with optical glue used to fill the edge gap during installation and the optical glass serving as the part through which the light beam passes. In order to improve the connection strength between the window base and the wind tunnel inner wall, carbon steel (Q235) is used for the window base and fixed cover. BK7 optical glass, which has a wide transparent spectral range, good transparency, and ease of processing, is used for the optical glass [24,25]. Nitrile rubber is used for the isolation rubber pad due to its good damping performance and wear resistance [26].
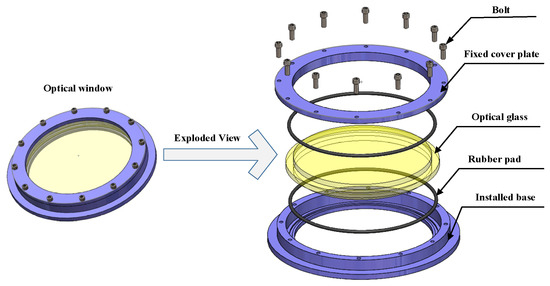
Figure 2.
The structure diagram of an optical window.
2.2. Theoretical Analysis of Vibration Isolation for Optical Windows
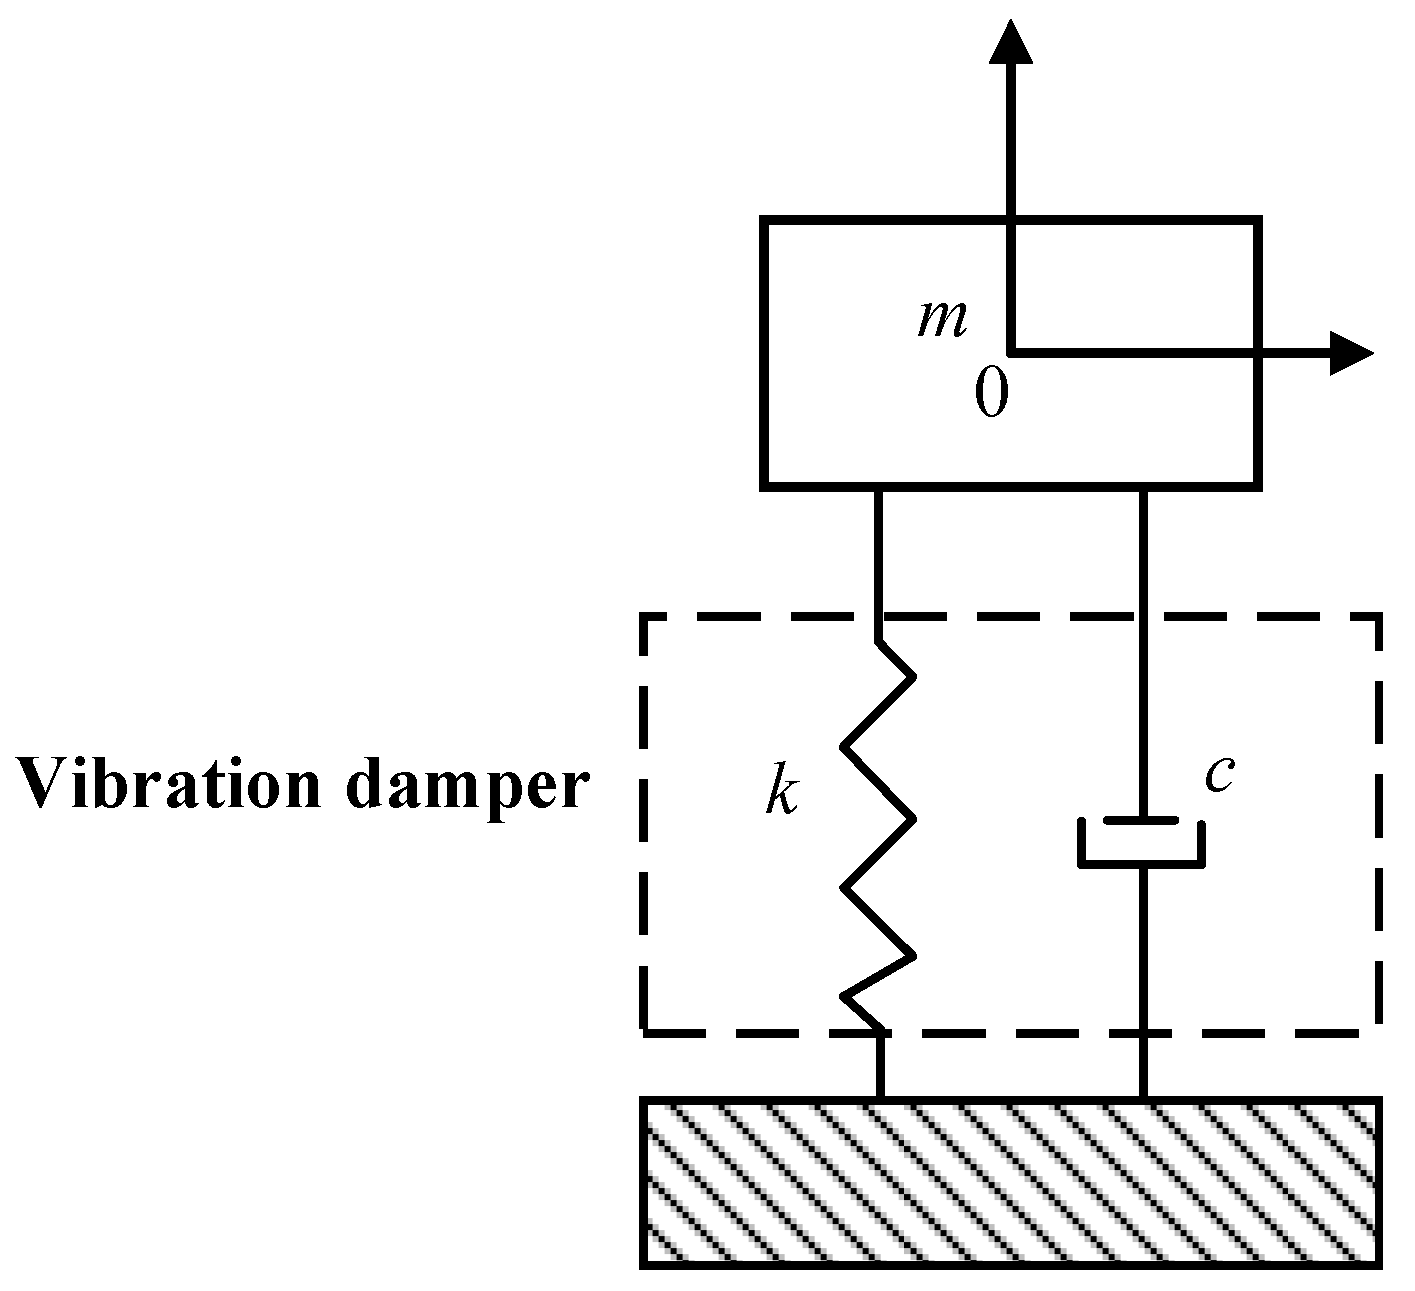
When the vibration frequency of the optical window support structure exceeds its own allowable frequency during the operation of the wind tunnel, cracks may appear on the surface of the optical window. To reduce or eliminate such effects, a passive isolation method [27,28,29] is adopted, using nitrile rubber with high viscosity and elasticity as the isolation device at the mounting base and pressure plate of the optical glass. Figure 3 shows a simplified displacement excitation mechanical model, where the mass is the glass, the spring–damper is the rubber pad, and the base motion is the wind tunnel.
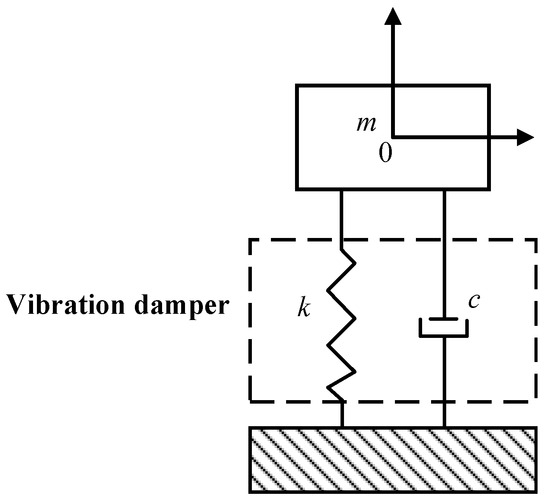
Figure 3.
Simplified displacement excitation mechanical model.
When the system undergoes harmonic motion, the motion differential equation of the model is as follows:
where is the acceleration of the object, is the damping coefficient, is the velocity of the object, is the spring constant, is the displacement of the object, is the net elongation of the spring, and is the relative velocity between the two ends of the damper.
When the excitation displacement acts on the rigid support component, the excitation displacement can be expressed as follows:
The steady-state response of mass m under forced vibration can be expressed as follows:
where Y is the amplitude of the excitation displacement , X is the amplitude of the steady-state response , I is imaginary unit, is angular frequency, and is phase angle.
By substituting the excitation displacement (2) and steady-state response (3) into Equation (1), the system isolation coefficient, i.e., displacement transmissibility, can be calculated as follows:
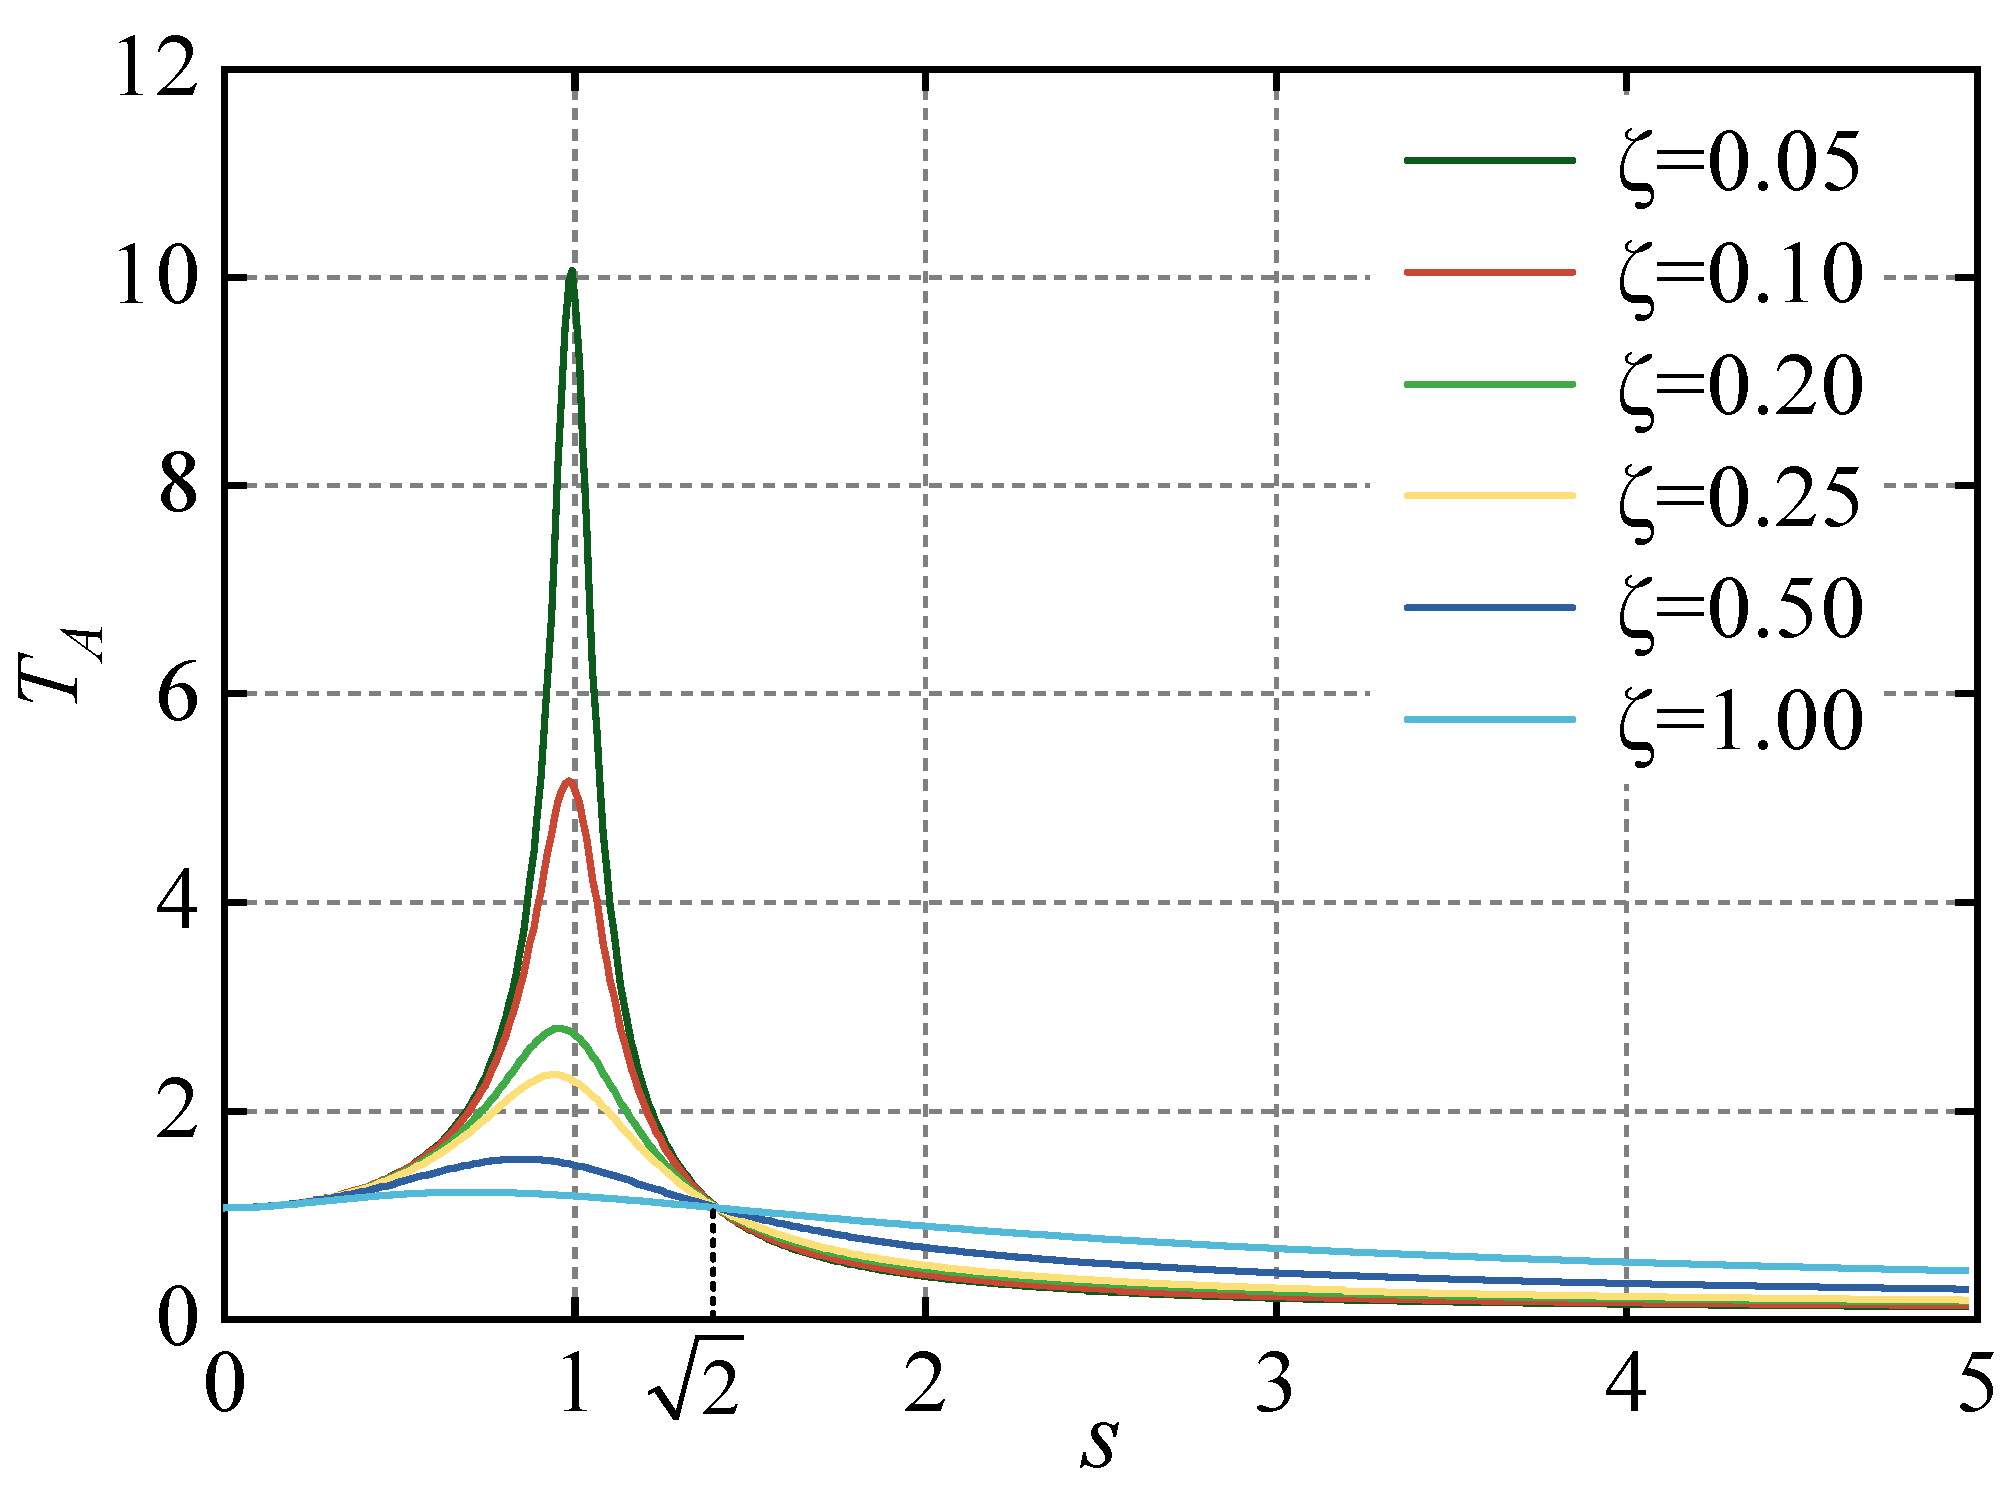
where s is the frequency ratio given by . is the natural frequency of the system given by . is the damping ratio given by . is the critical damping given by . The transfer function curve of the vibration isolation system was obtained by numerical analysis software and is shown in Figure 4, where the vertical axis represents and the horizontal axis represents the frequency ratio .
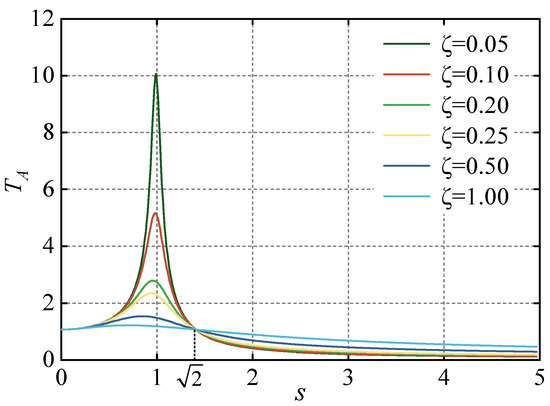
Figure 4.
Transfer function curve of isolation system.
According to Figure 4, different frequency ratios correspond to different displacement transfer ratios. When the frequency ratio is larger than , the displacement transfer ratio gradually decreases, indicating that the isolation system has better isolation capability. Therefore, reducing the stiffness of the isolation device to some extent can increase the frequency ratio and decrease the displacement transfer ratio, thus improving the isolation capability of the isolation system [19].
2.3. Design of Vibration Isolation Device for Optical Windows
Under the action of external loads, various parts of the vibration isolation rubber pad may exhibit different nonlinear physical phenomena. The stiffness of the vibration isolation rubber pad is an important indicator for evaluating its vibration isolation performance. Rubber with different shapes has different stiffness. This optical window vibration isolation device uses (a) a circular rubber pad, (b) a rectangular rubber pad, and (c) no rubber pad installed, as shown in Figure 5.
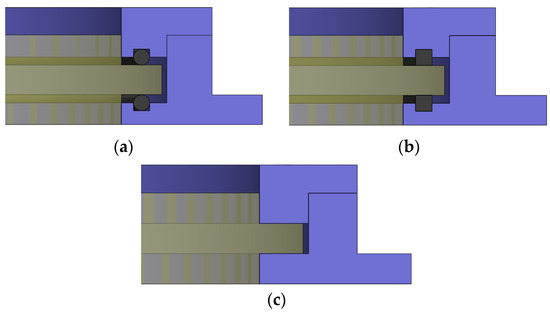
Figure 5.
Design of vibration isolation device for optical window: (a) circular rubber pad, (b) rectangular rubber pad, and (c) without rubber pad.
By calculating the stiffness of two different isolation devices, the isolation performance of the two devices can be theoretically compared. The following is the formula for calculating the compression stiffness of the rubber isolator [30,31].
where is the elastic modulus of the rubber pad; is the height of the rubber pad. is the shape factor of the rubber pad. is the ratio of the constrained area to the free area of the rubber pad. Formula (6) is applicable to cylindrical rubber pads, and Formula (7) is applicable when n > 0.2. is the constrained area of the rubber pad, which refers to the compressed area of the rubber pad that is usually in contact with the isolated object. is the free area of the rubber pad, which refers to the surface perpendicular to the deformed surface.
For the two different rubber pad isolation schemes, the area of the cylindrical rubber pad’s constrained surface is much smaller than that of the rectangular rubber pad’s constrained surface , i.e., the shape factor of the cylindrical rubber pad is much smaller than the shape factor of the rectangular rubber pad. However, the elastic modulus and height of the two rubber pads are the same. Therefore, it can be concluded that the stiffness of the circular rubber pad is less than the stiffness of the rectangular rubber pad, and the isolation performance of the circular rubber pad is better than that of the rectangular rubber pad.
3. Modal and Harmonic Response Analysis of Optical Windows
3.1. Modal Analysis
Modal analysis, a method for predicting structural performance and diagnosing faults, is widely used to study the vibration characteristics of structural components in general. The structural characteristics of optical components include mode shapes and natural frequencies, and different modes of different structures have different mode shapes and natural frequencies [32]. The dynamic pressure and noise generated in a shock-tube wind tunnel result in periodic vibrations throughout the wind tunnel and on the optical window. This can cause excessive deformation and structural damage to the optical window. Therefore, modal analysis must be conducted on the optical window to determine its natural frequencies and mode shapes.
Using three-dimensional modeling software (SOLIDWORKS), different isolation rubber pads were modeled for the optical window. The models were then imported into the finite element analysis software (ABAQUS), where the optical window was constrained by the installation base and the window pressure plate. The mesh was divided and the corresponding experimental parameters were set, as shown in Table 1 for the material parameters of each component.

Table 1.
Material parameters of optical window.
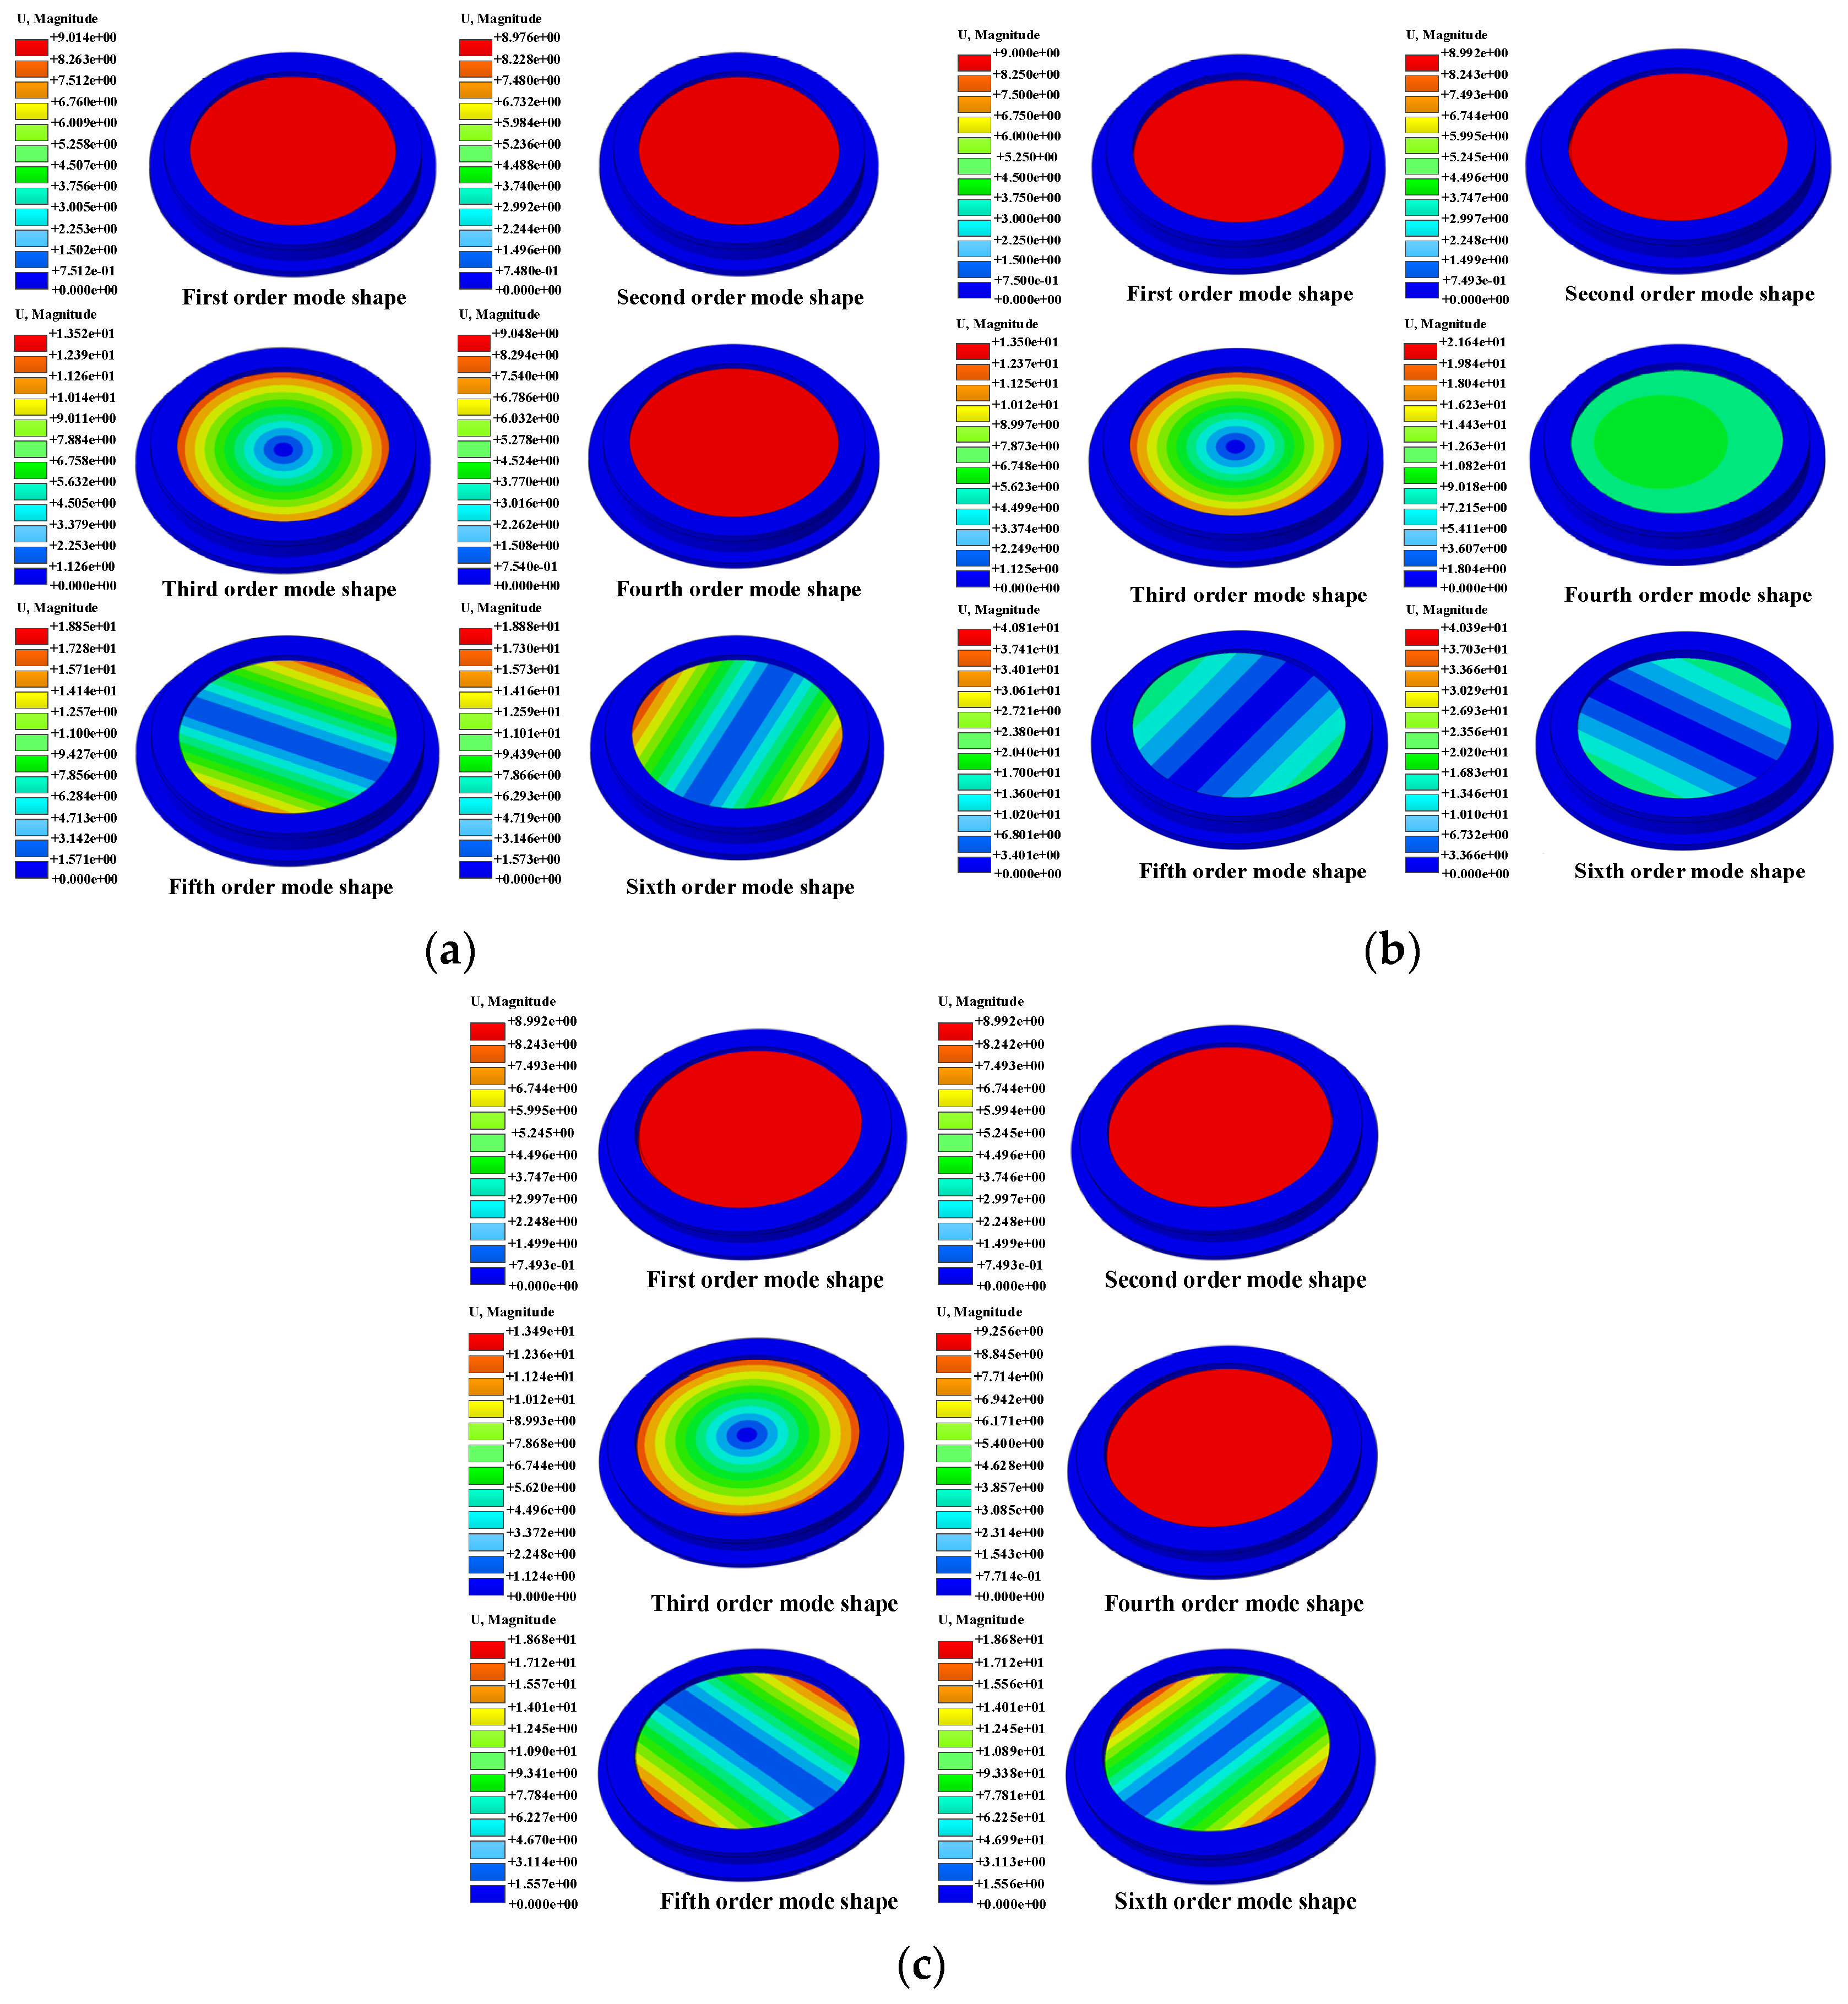
In any mechanical vibration system, there are infinite natural frequencies. However, in structural vibration, high-order modes have a low energy contribution, and the effect of vibration amplitude on the system can be neglected [33]. Therefore, only the first six modes of the optical window are analyzed. Figure 6 shows the modal shapes of optical windows with different vibration isolation devices.
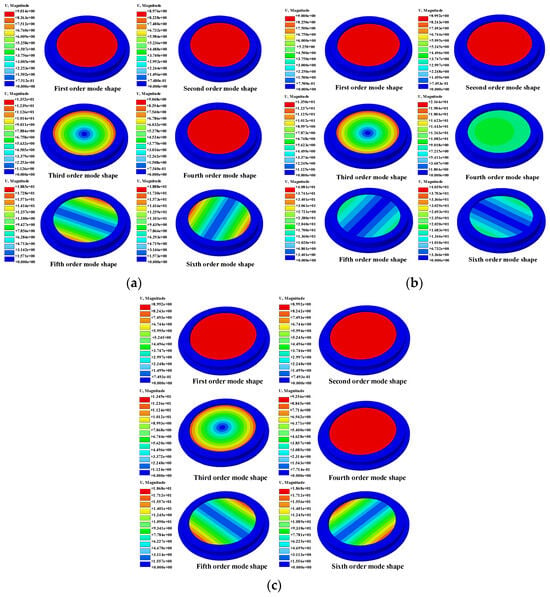
Figure 6.
Modal vibration patterns of optical windows with different isolation rubber pads: (a) circular rubber pad, (b) rectangular rubber pad, and (c) without rubber pad.
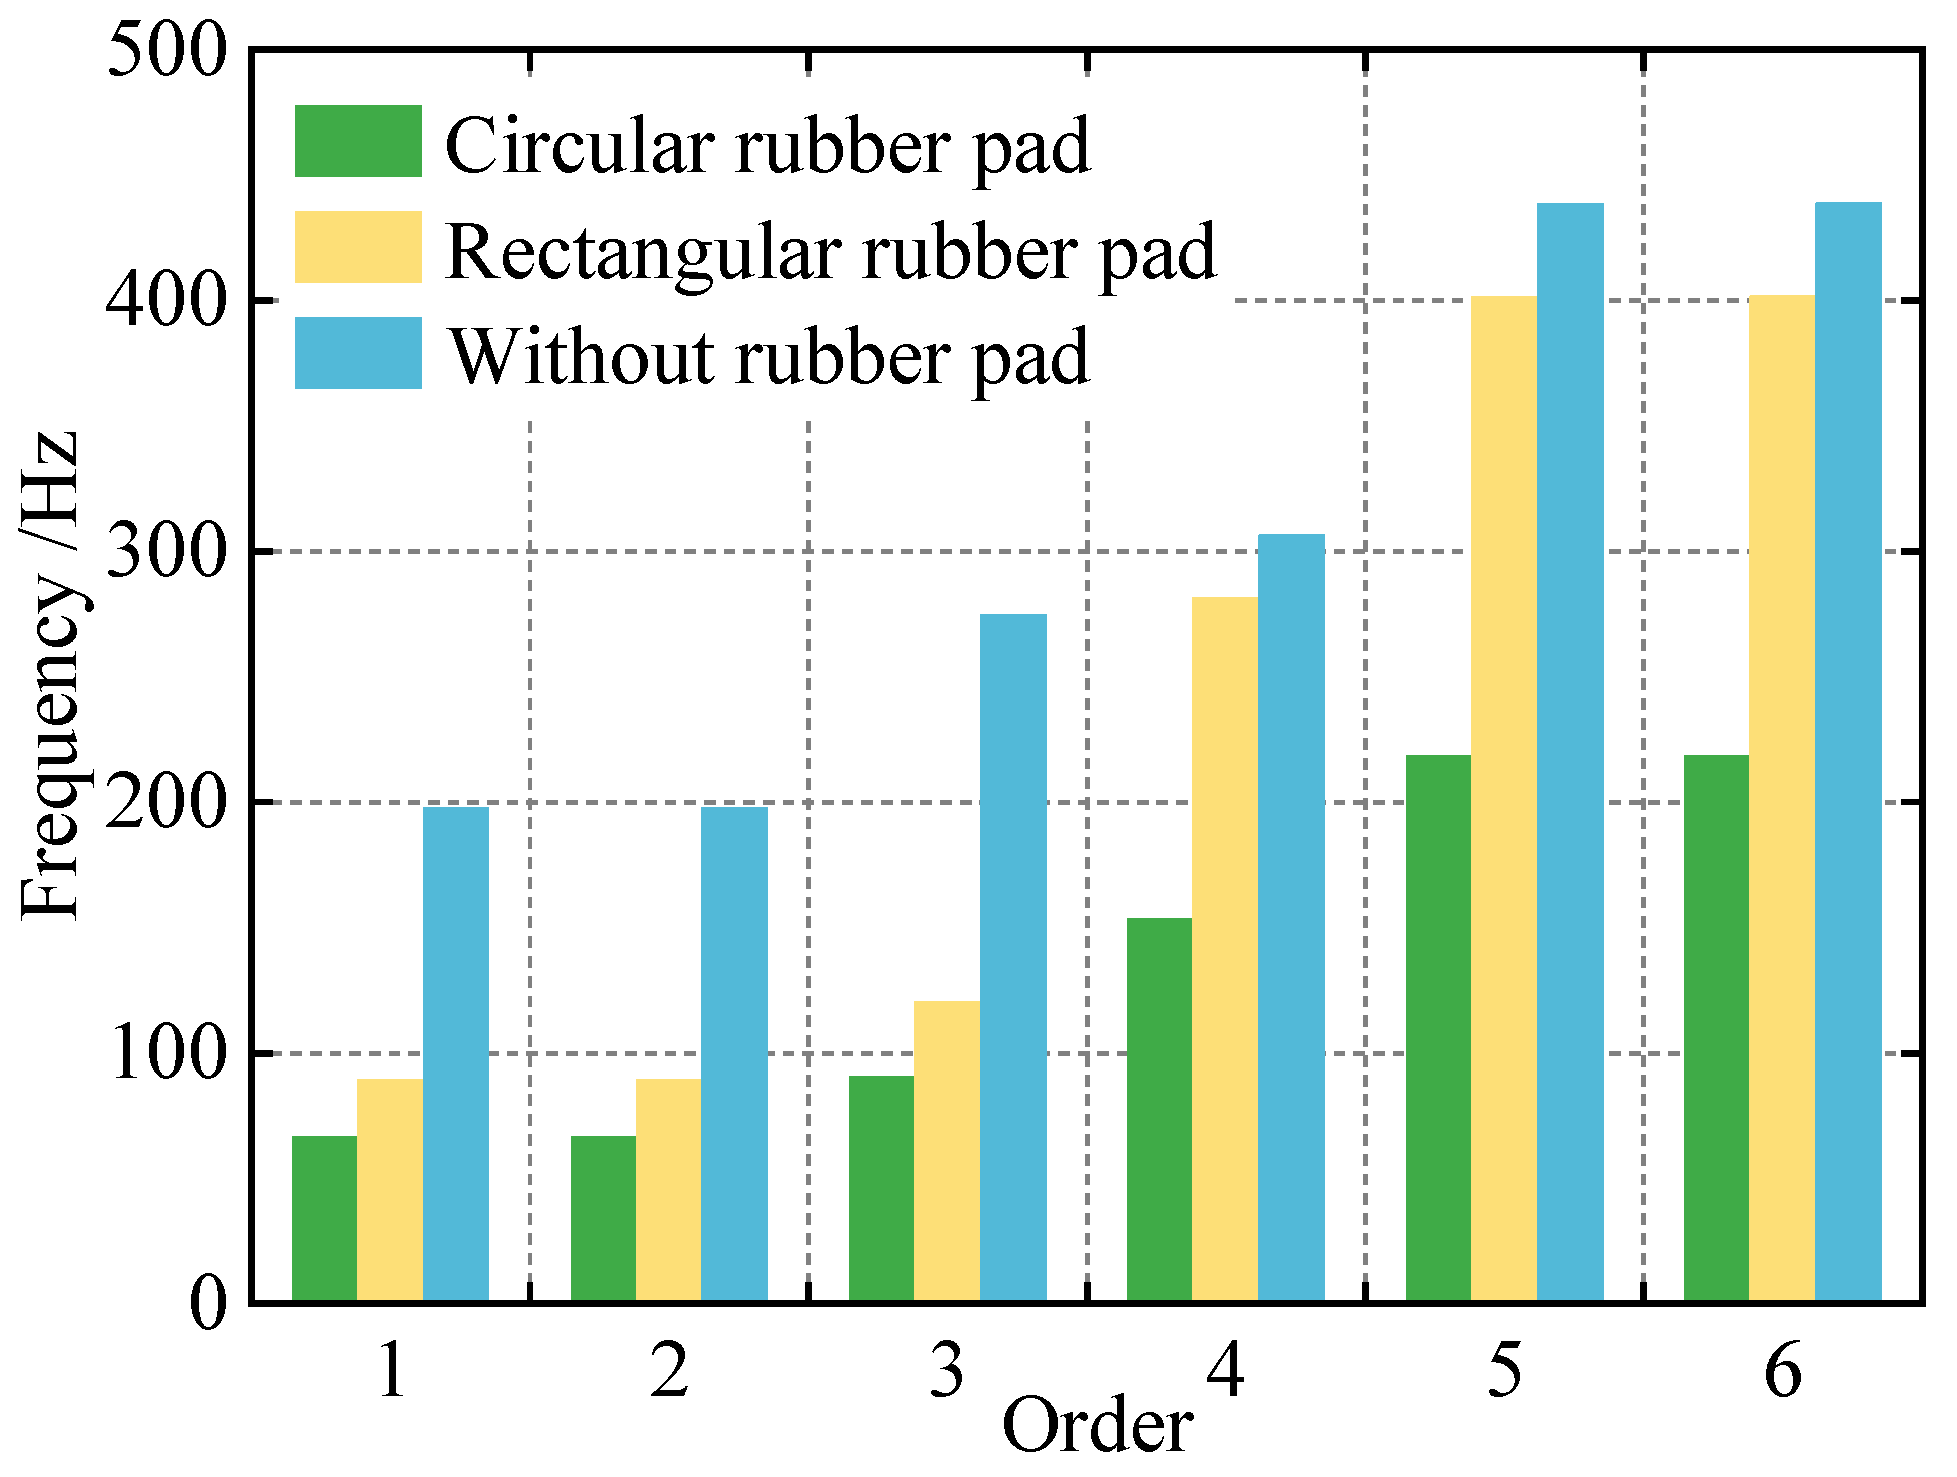
Figure 7 shows the modal analysis of the first six modes of the optical window with different isolation devices. By analyzing the modal characteristics of the optical window, it can be determined that the first mode frequencies of the optical window with circular and rectangular rubber isolators are 66.32 Hz and 89.20 Hz, respectively, and the inherent frequencies of each mode continue to increase. In the experimental environment, the excitation frequency range is 0.1–1.5 kHz, and the high-frequency modes are much higher than the first six modes of the circular and rectangular rubber isolators, so the influence of high-frequency vibration on the deformation of the optical window can be ignored after reaching a steady state. However, the first mode frequency of the optical window without any isolation device is 197.74 Hz, which falls within the low-frequency range of the excitation frequency and has a higher probability of resonance occurrence.
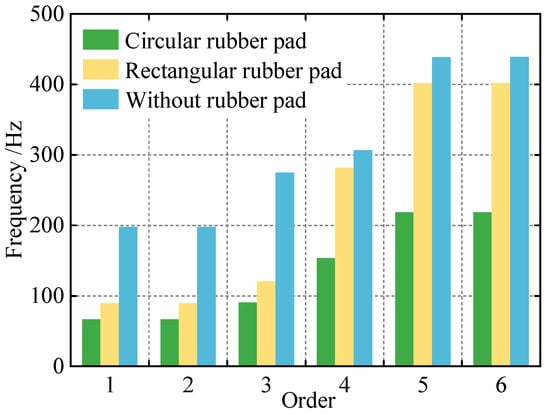
Figure 7.
Model diagram of optical windows with different isolation rubber pads.
3.2. Harmonic Response Analysis of Optical Windows
During the operation of the pulsed jet wind tunnel, the entire wind tunnel chamber is subjected to a certain pressure environment, and the structure of the optical window will vibrate. In order to calculate the structural response of the optical window under a set frequency of dynamic loads after adding the isolation device, harmonic response analysis was performed on the optical window. Harmonic response analysis is a technique for determining the structural response of a linear structure under a known frequency of harmonic load. By applying a series of different frequency periodic sine excitations to the linear system, the response value of the linear system at different frequencies can be obtained, thereby predicting the sustained dynamic characteristics of the overall structure and ensuring that the designed isolation device and overall structure can withstand different frequency harmonic loads [34].
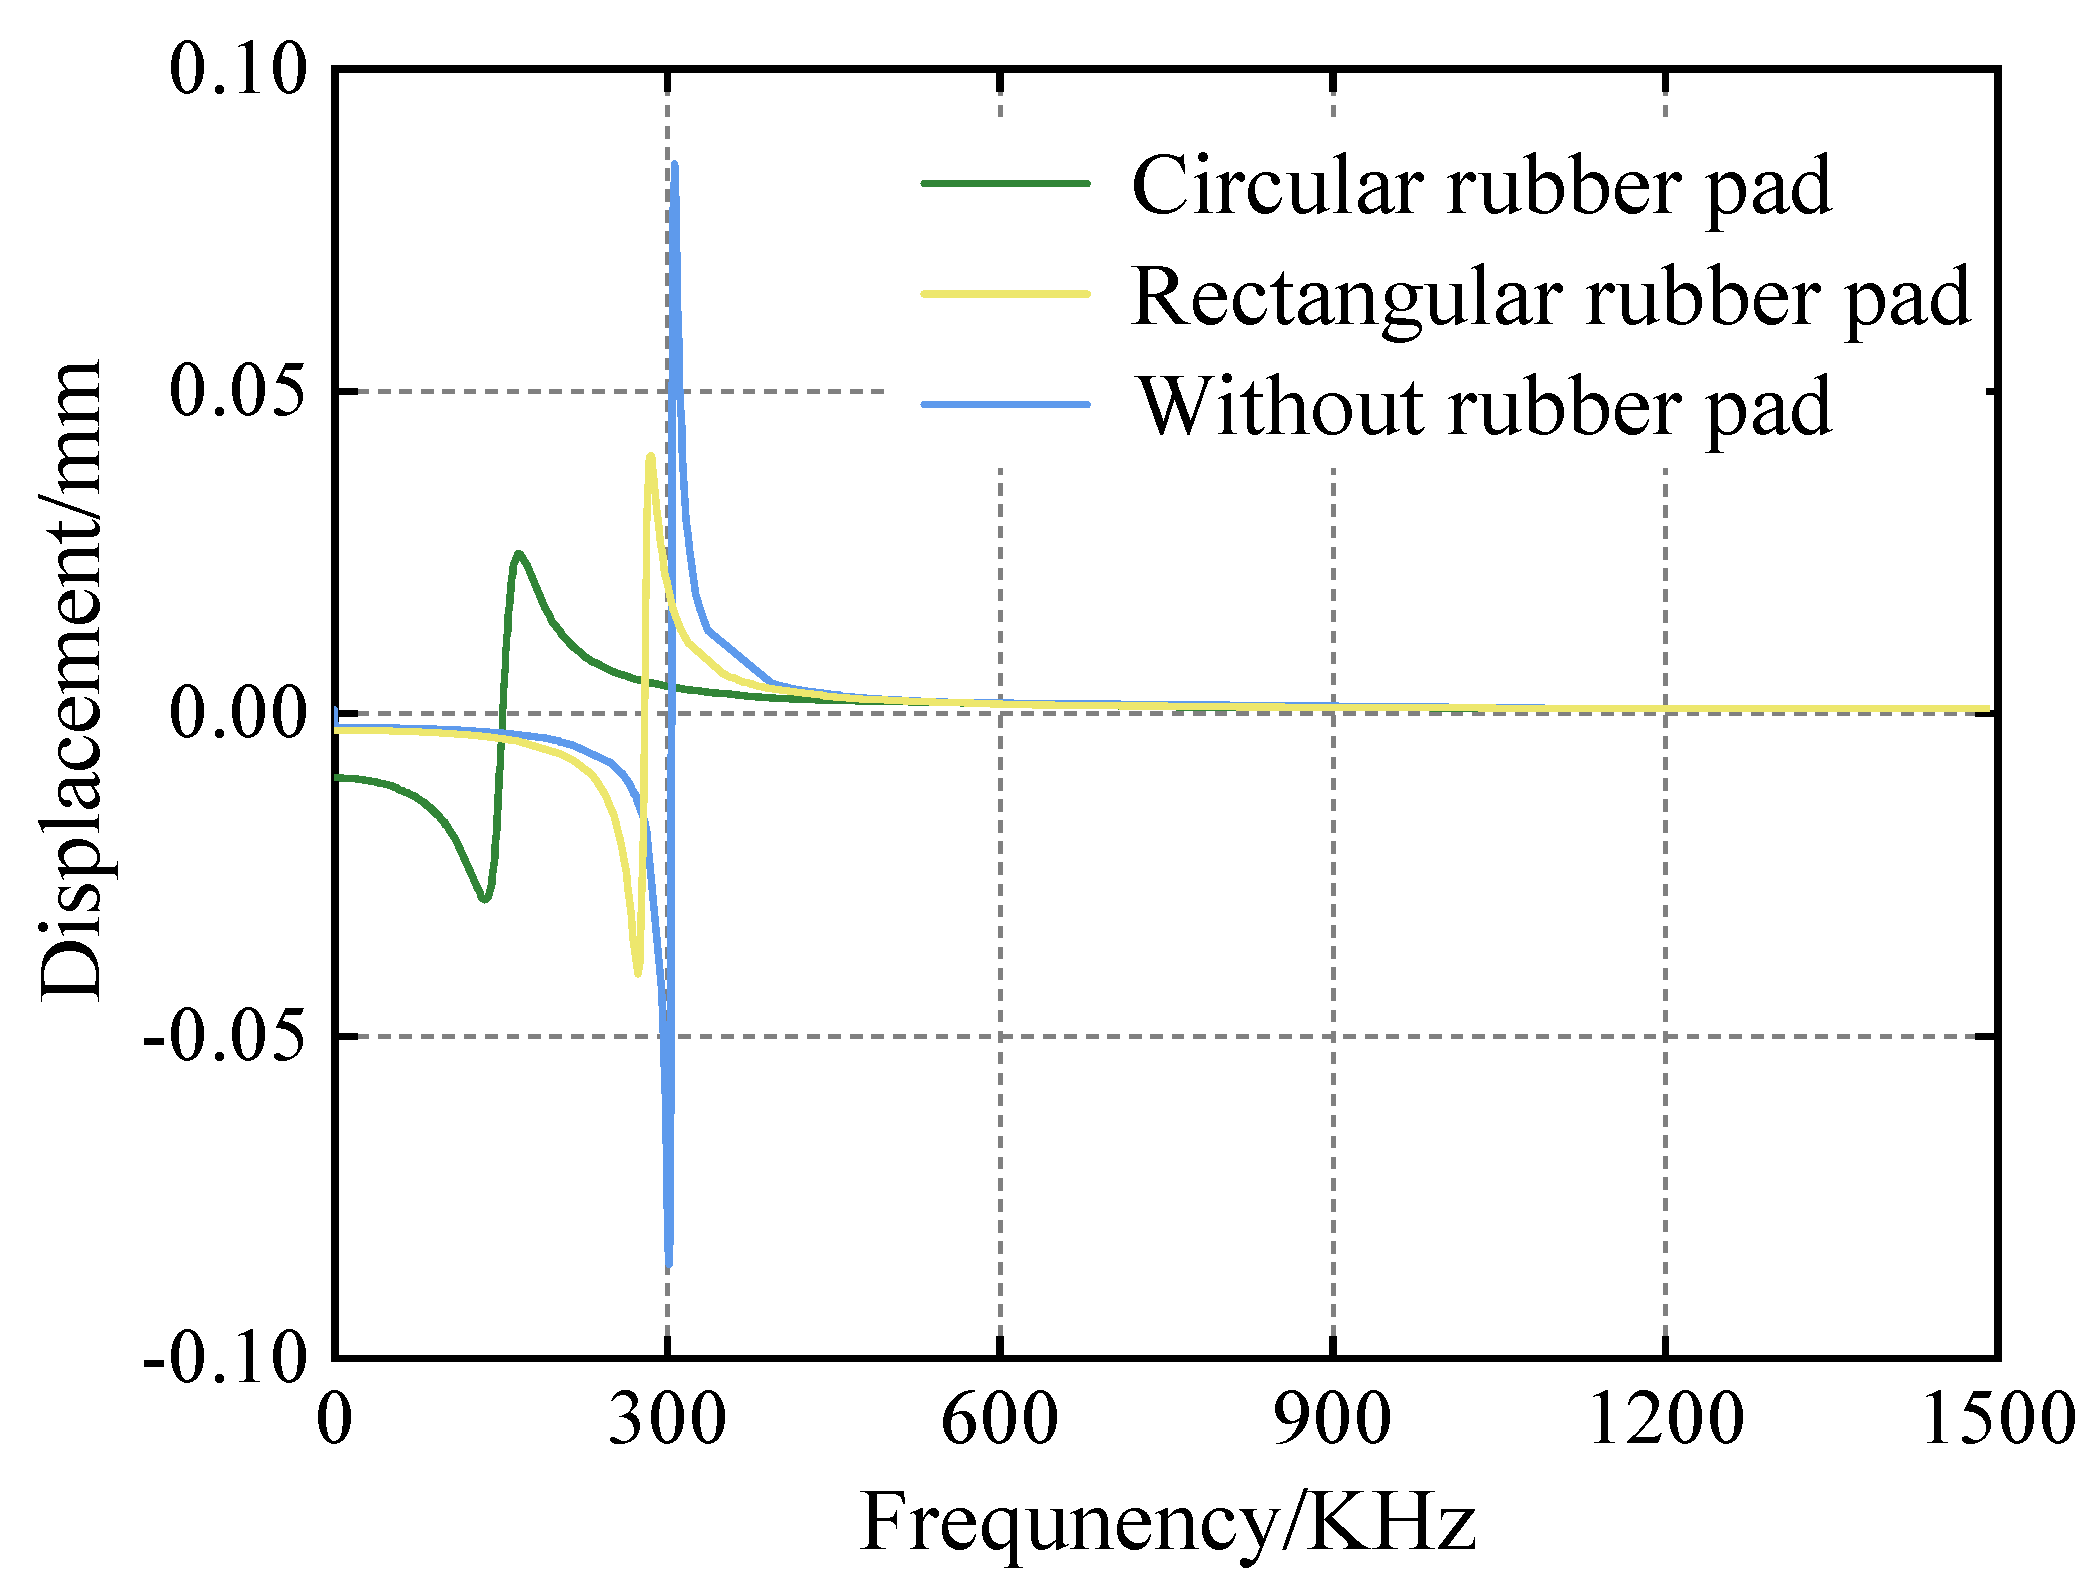
Through harmonic response analysis using finite element software, the surface deformation of the optical window with different vibration isolation devices was obtained with a scanning frequency set between 100 Hz and 1500 Hz, as shown in Figure 8.
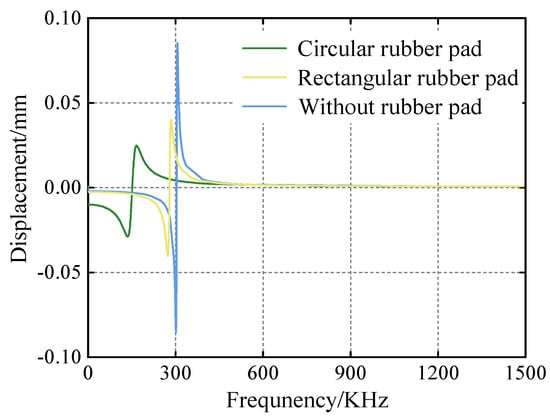
Figure 8.
Harmonic response analysis of optical windows with different isolation rubber pads.
According to Figure 8, the optical window with a circular rubber pad isolation device may experience resonance at an excitation frequency of 167.82 Hz, causing a significant displacement of up to 0.024 mm in the optical glass surface. Similarly, the optical window with a rectangular rubber pad isolation device may experience resonance at an excitation frequency of 287.29 Hz, resulting in a maximum displacement of 0.040 mm in the optical glass surface. In contrast, the optical window without any rubber pad isolation device may experience resonance at an excitation frequency of 308.81 Hz, causing a significant displacement of up to 0.085 mm in the optical glass surface.
4. Optical Performance Analysis of Optical Windows
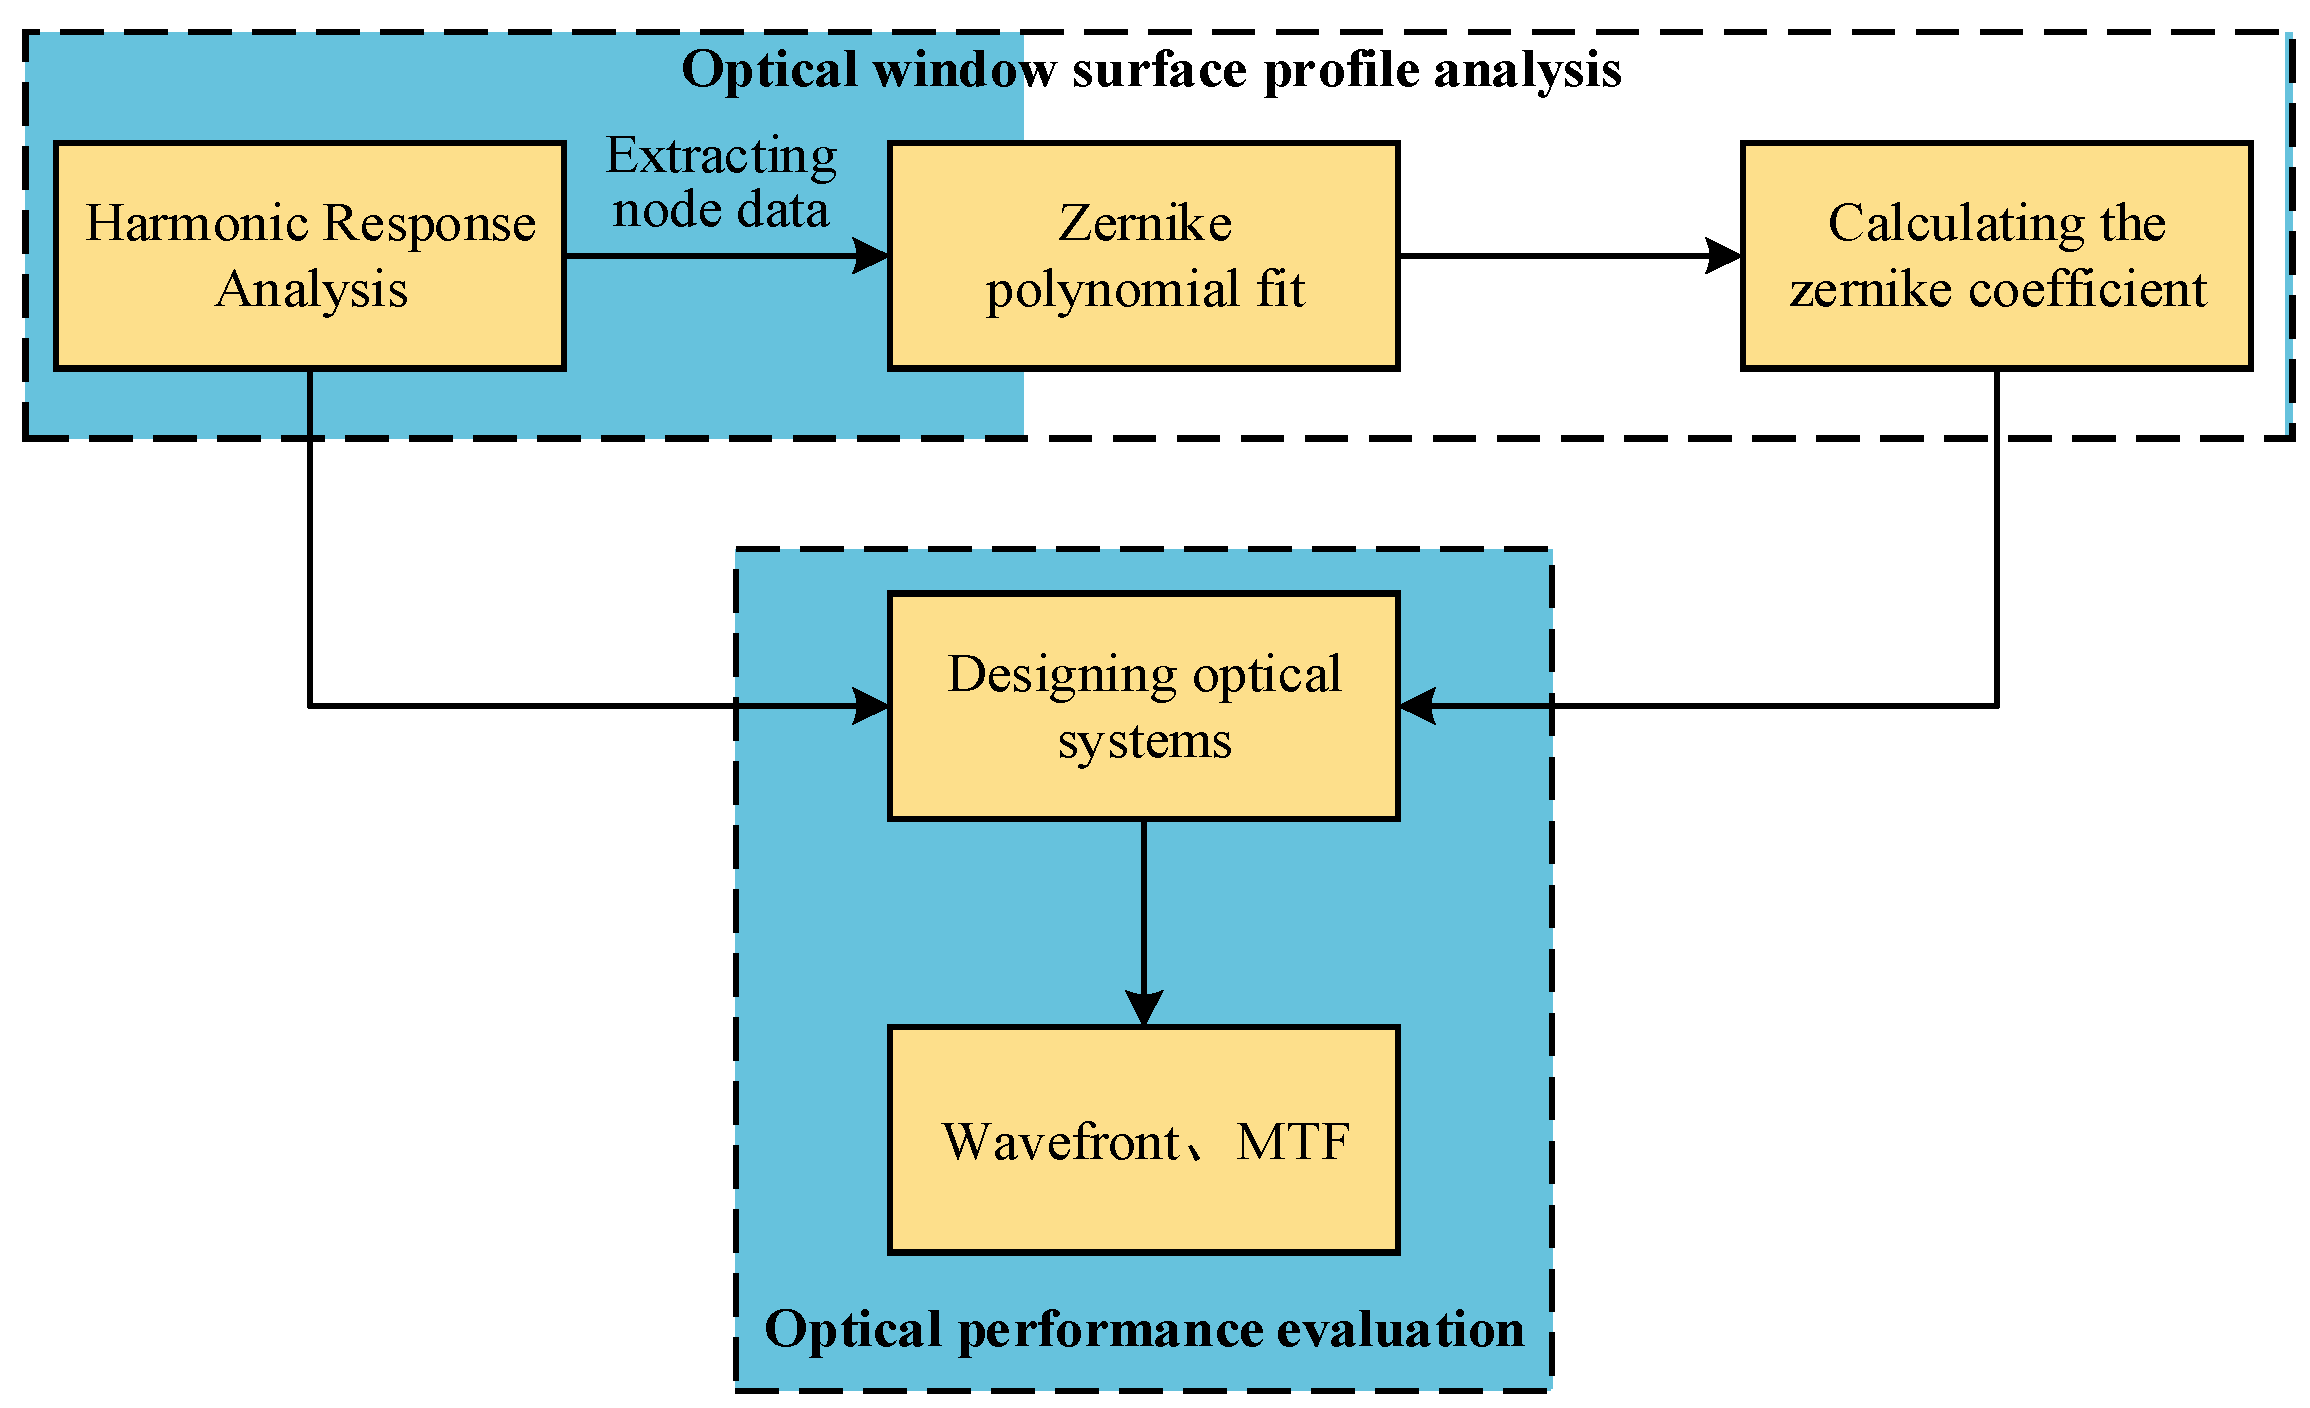
Environmental changes are one of the most important factors affecting the optical performance of the optical window. Such changes can cause distortion of the window surface, which must be fitted using Zernike polynomials to transfer the optical glass deformation data to the optical analysis software Zemax [35,36]. The specific analysis process is shown in Figure 9.
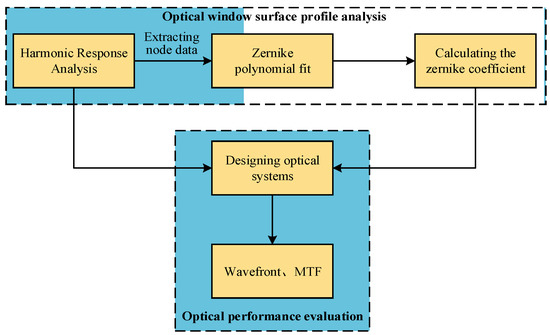
Figure 9.
Flowchart of optical performance analysis.
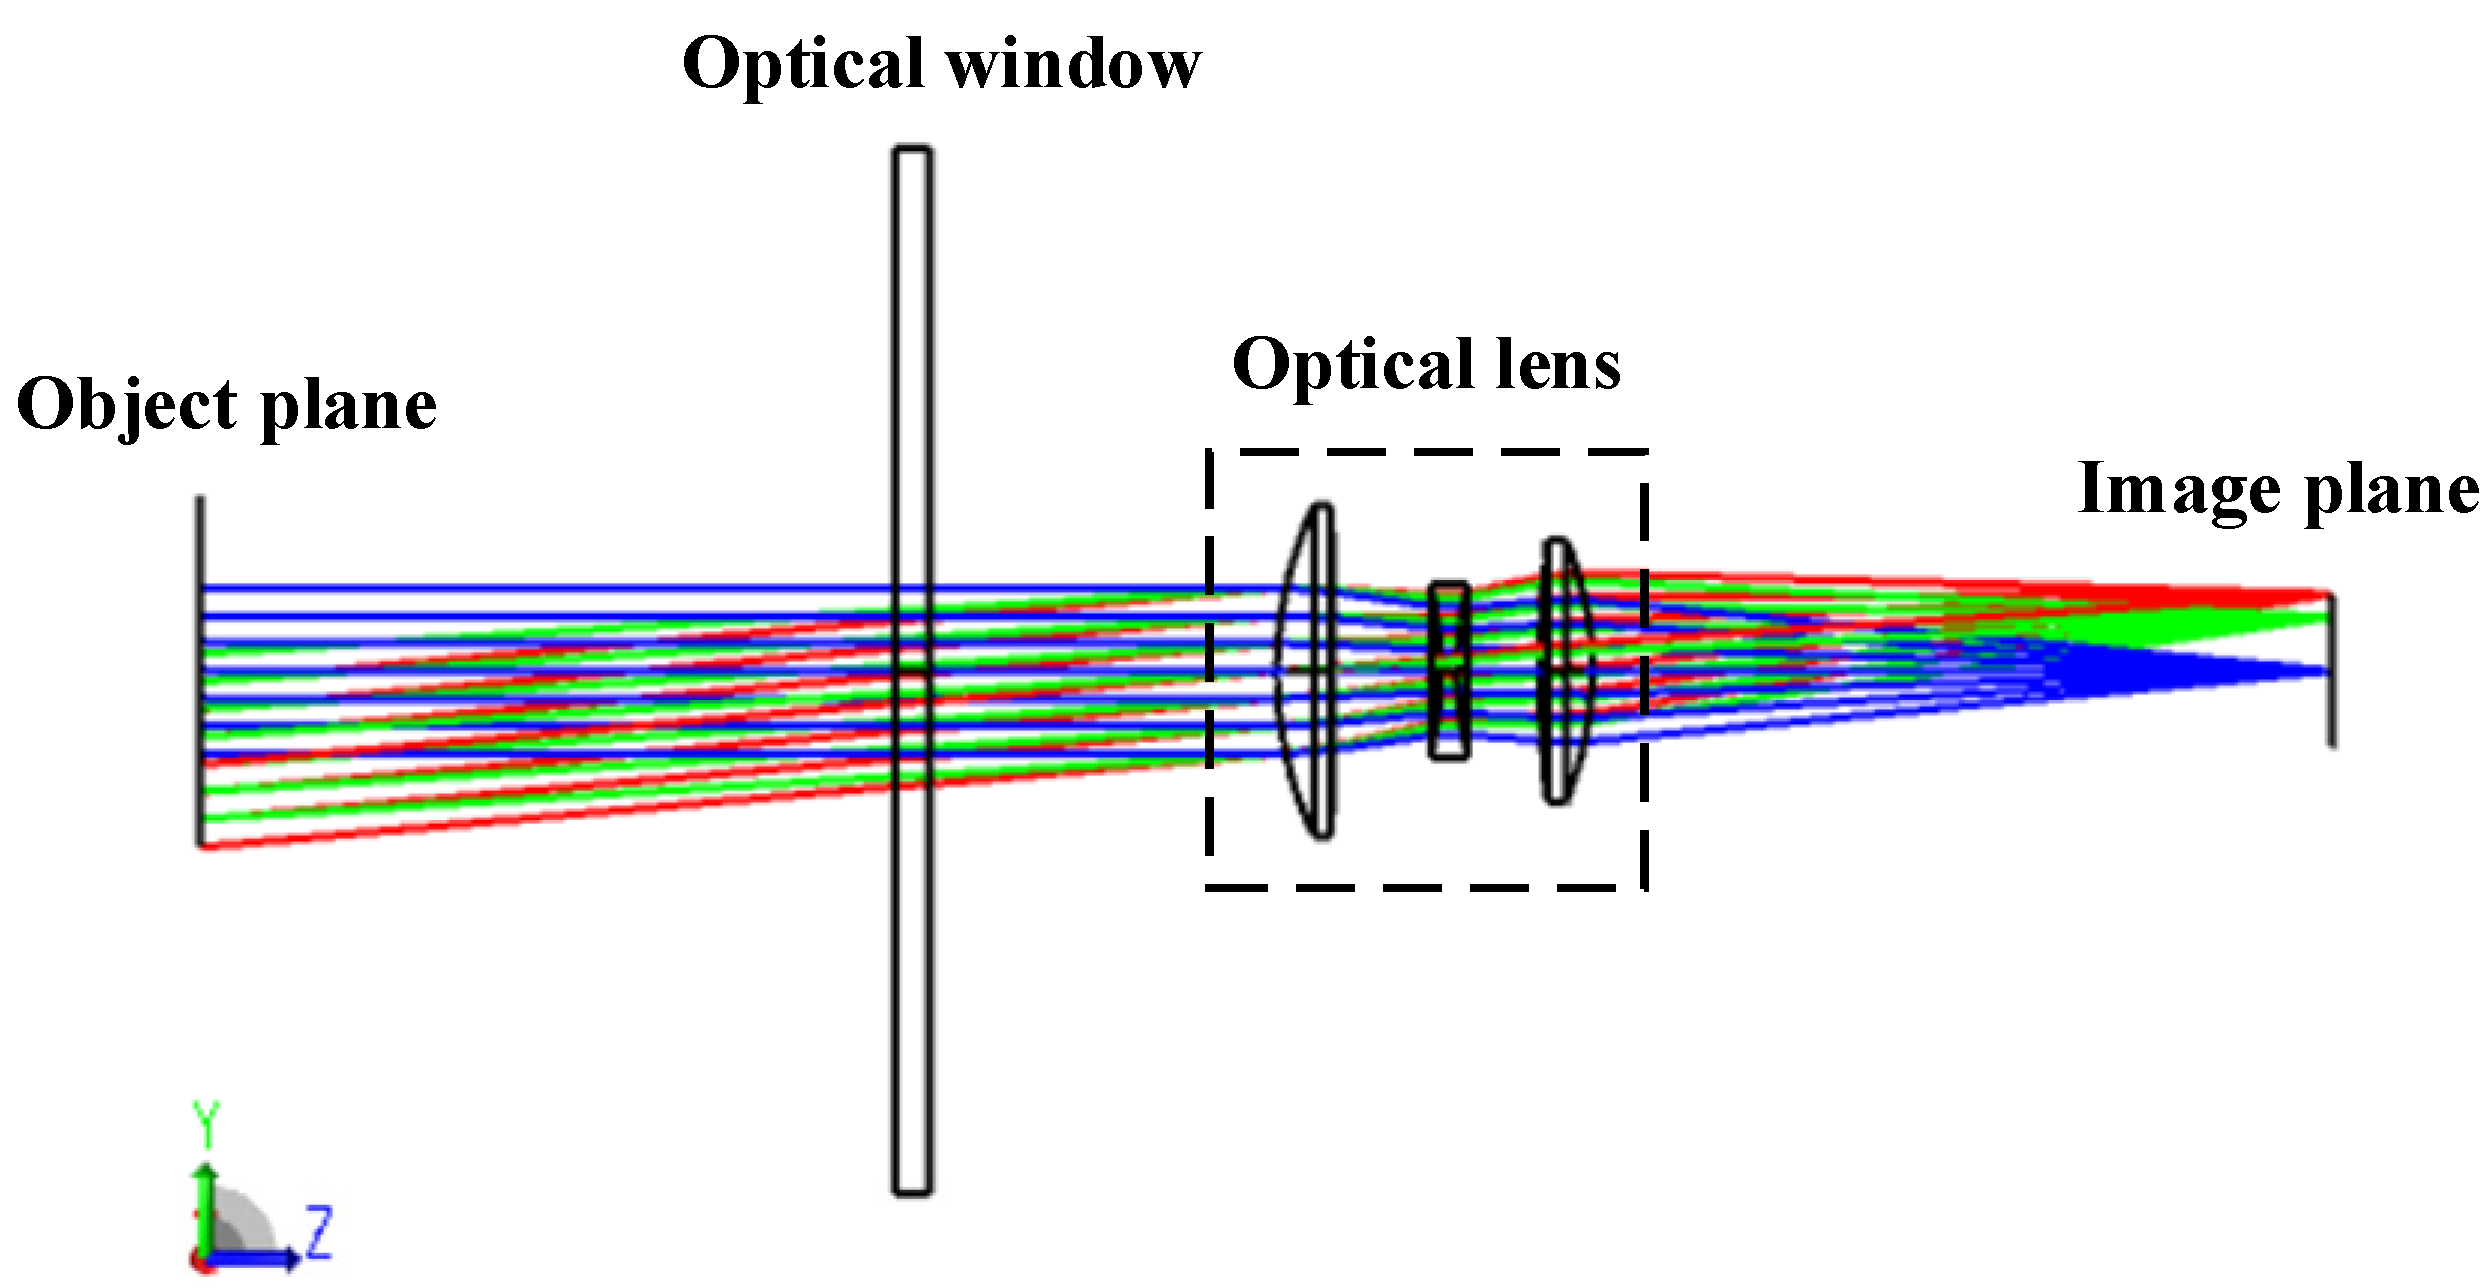
The surface quality of optical components plays a decisive role in the performance of optical systems. Under certain vibration conditions, the surface of an optical window will experience deformation. As mentioned earlier, the vibration response analysis of optical windows with different isolation devices provides data on the surface deformation of the optical glass. Based on the imaging quality analysis process of optical systems, the maximum change in the surface nodes of the optical glass is extracted after the harmonic response analysis. Then, Zernike polynomials are used to fit the surface node changes, and the Zernike coefficients that represent the surface change in the optical glass are obtained and input into the Zemax optical design software. Using a laser wavelength of 632.8 nm and a Cooke triplet optical system as the analysis object, as shown in Figure 10, optical system performance evaluation is performed, including wavefront error and the MTF curve.
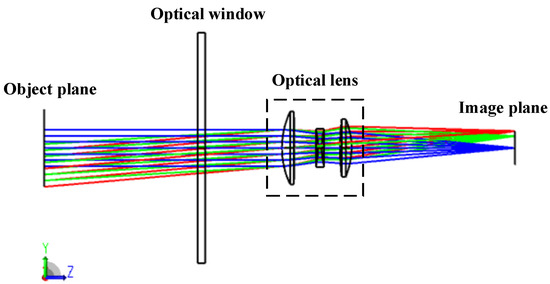
Figure 10.
Optical window and optical system.
4.1. Wavefront Error
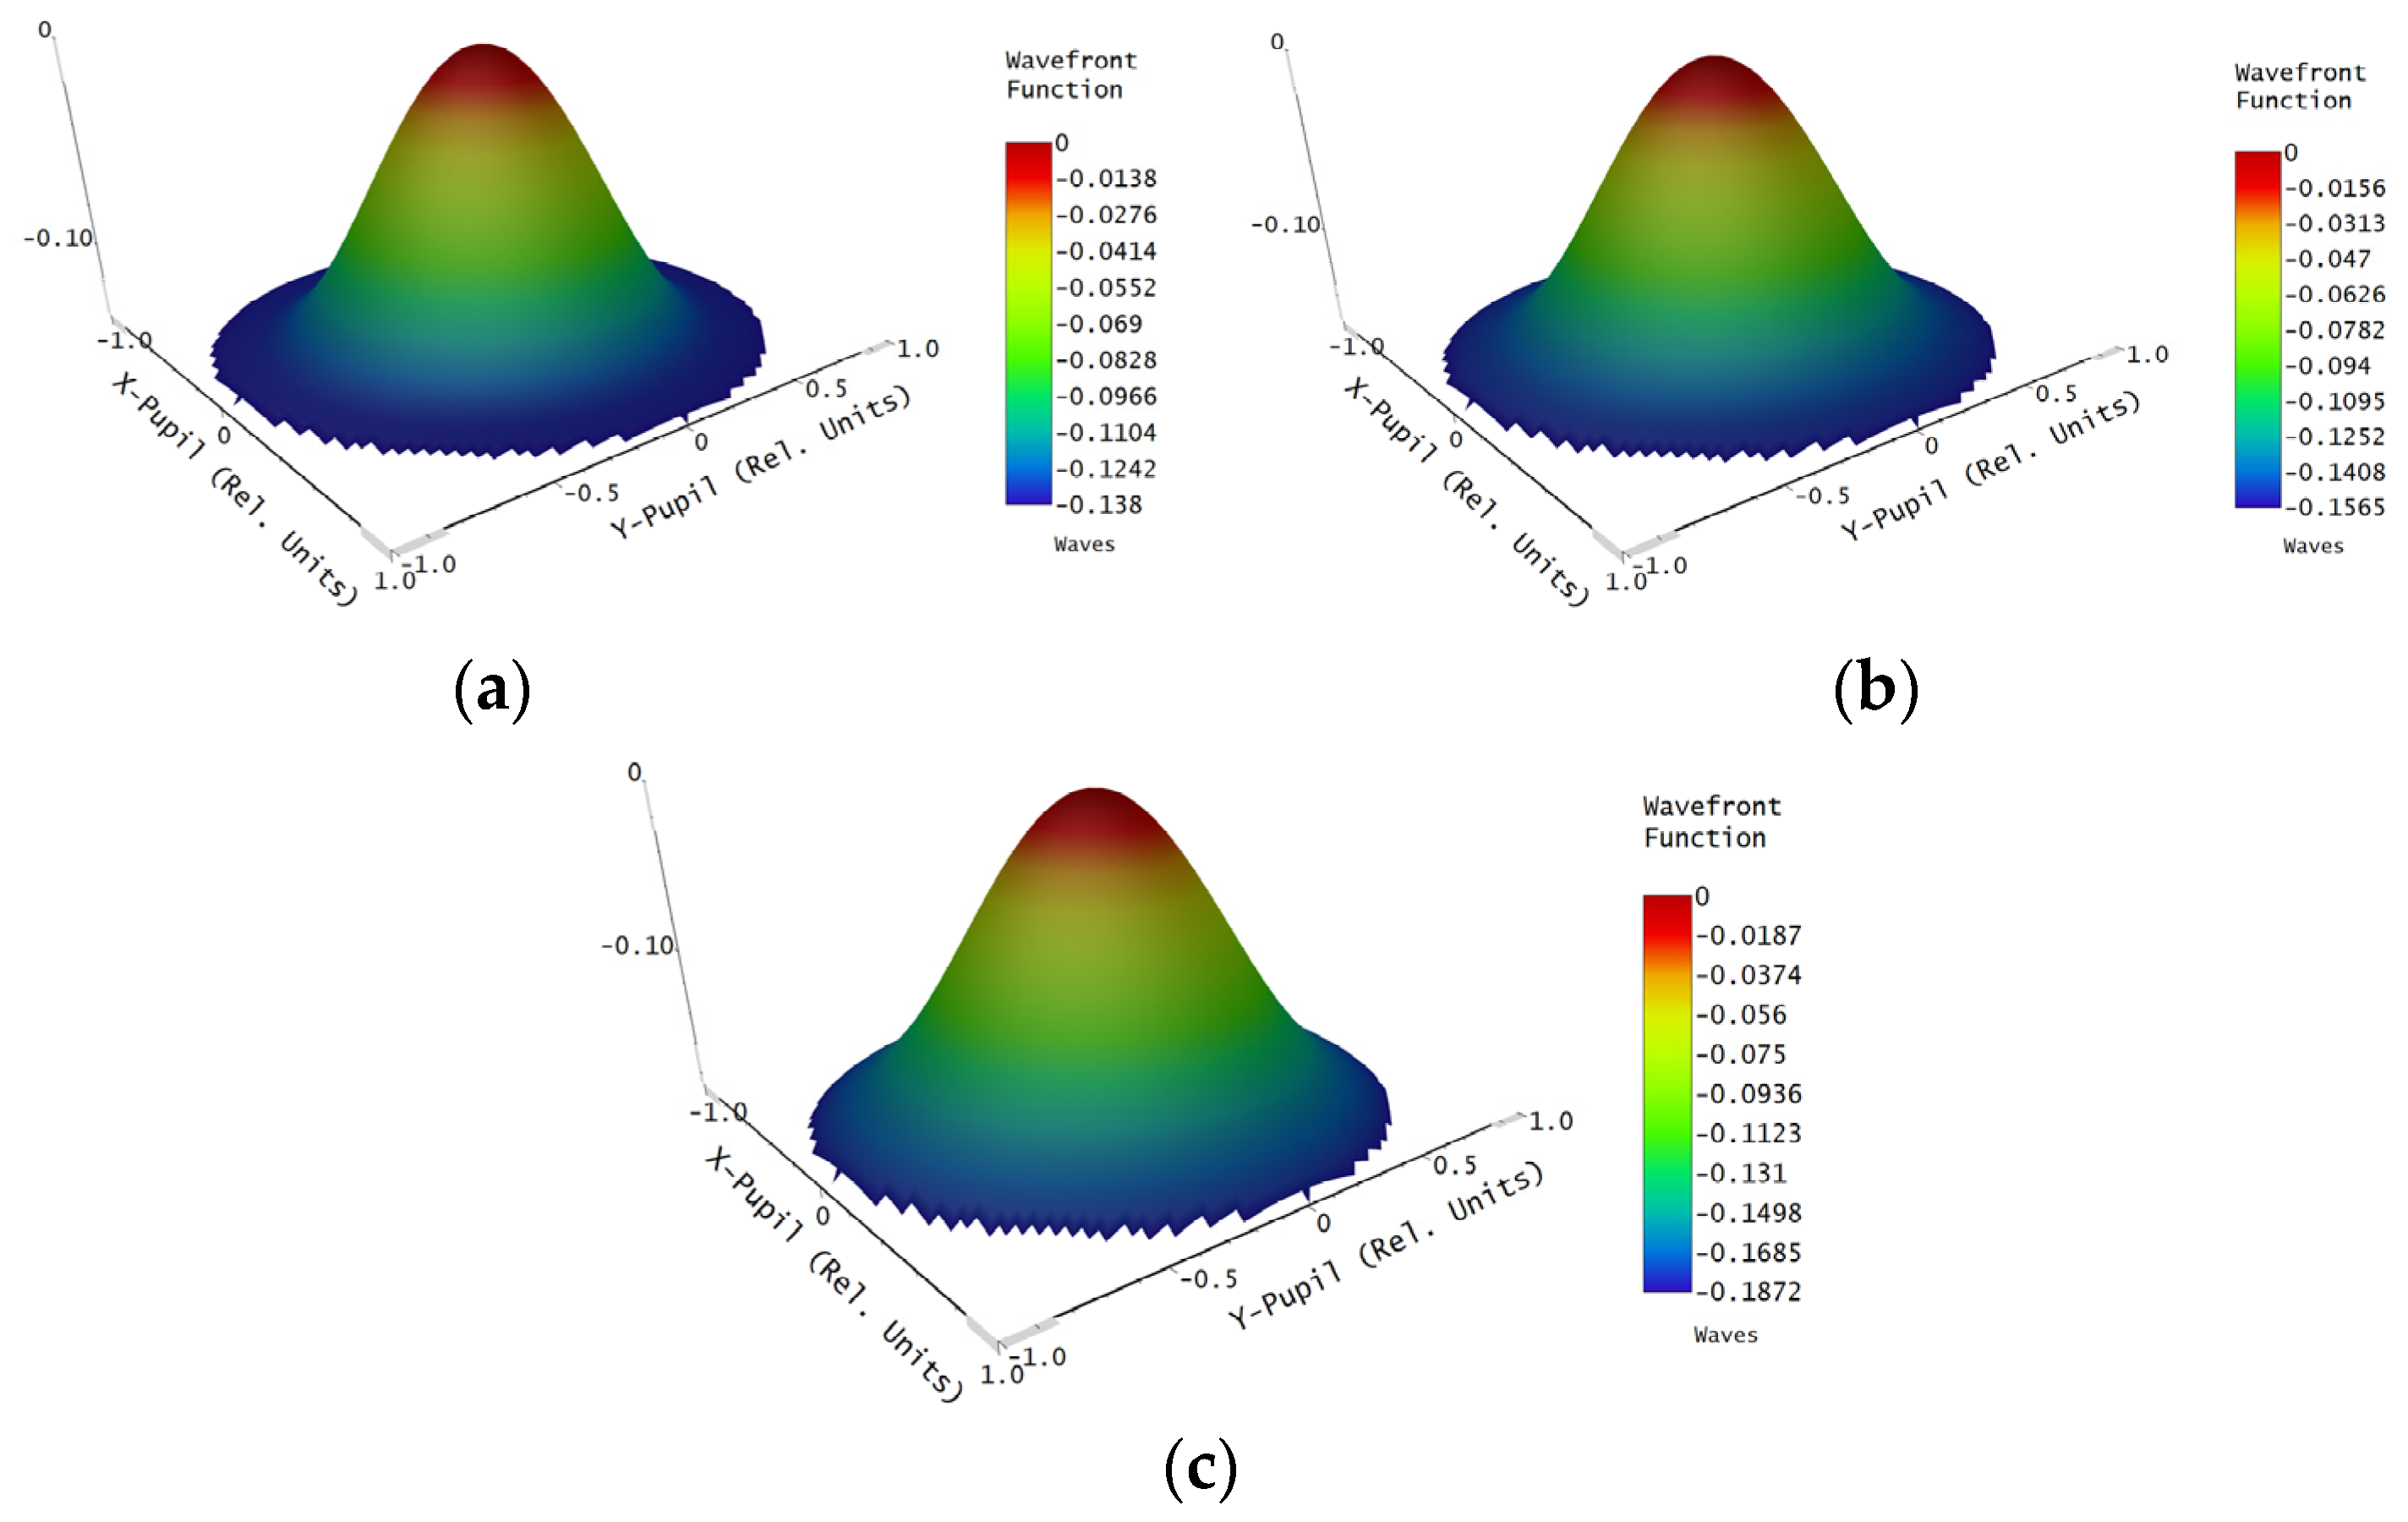
When the surface of an optical window deforms, the wavefront will change and cause wavefront aberration when the beam passes through the deformed optical window. By fitting the surface deformation data of the optical window obtained from finite element analysis with Zernike polynomials and importing the obtained Zernike coefficients into Zemax optical design software, the wavefront aberration of the optical window with different isolation devices can be calculated, as shown in Figure 11.
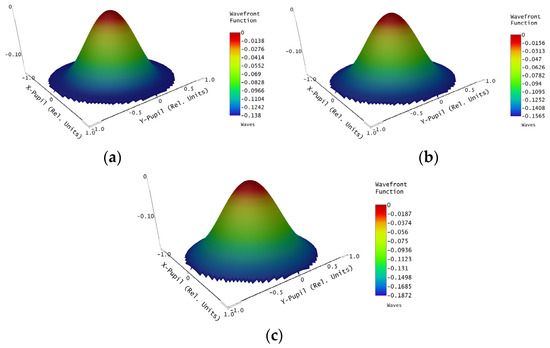
Figure 11.
Wavefront error of different vibration isolation devices: (a) circular rubber pad, (b) rectangular rubber pad, and (c) without rubber pad.
In optical imaging quality evaluation, the peak-to-valley (PV) and root-mean-square (RMS) values of the wavefront are commonly used to quantify the degree of wavefront distortion. Smaller PV and RMS values indicate less wavefront distortion and more uniformity, resulting in better overall imaging quality of the optical system. Table 2 lists the wavefront PV and RMS values of optical windows with different vibration isolation devices. As shown in Table 2, the optical window with a circular rubber pad vibration isolation device has significantly lower wavefront PV and RMS values compared to the optical window with a rectangular rubber pad vibration isolation device and the one without any vibration isolation device, indicating that the former has less impact on the imaging quality of the optical window.

Table 2.
PV and RMS values of optical window with different isolation devices. PV refers to the peak value of wavefront change in the optical window, and RMS refers to the root-mean-square value of wavefront change in the optical window.
4.2. Modulation Transfer Function
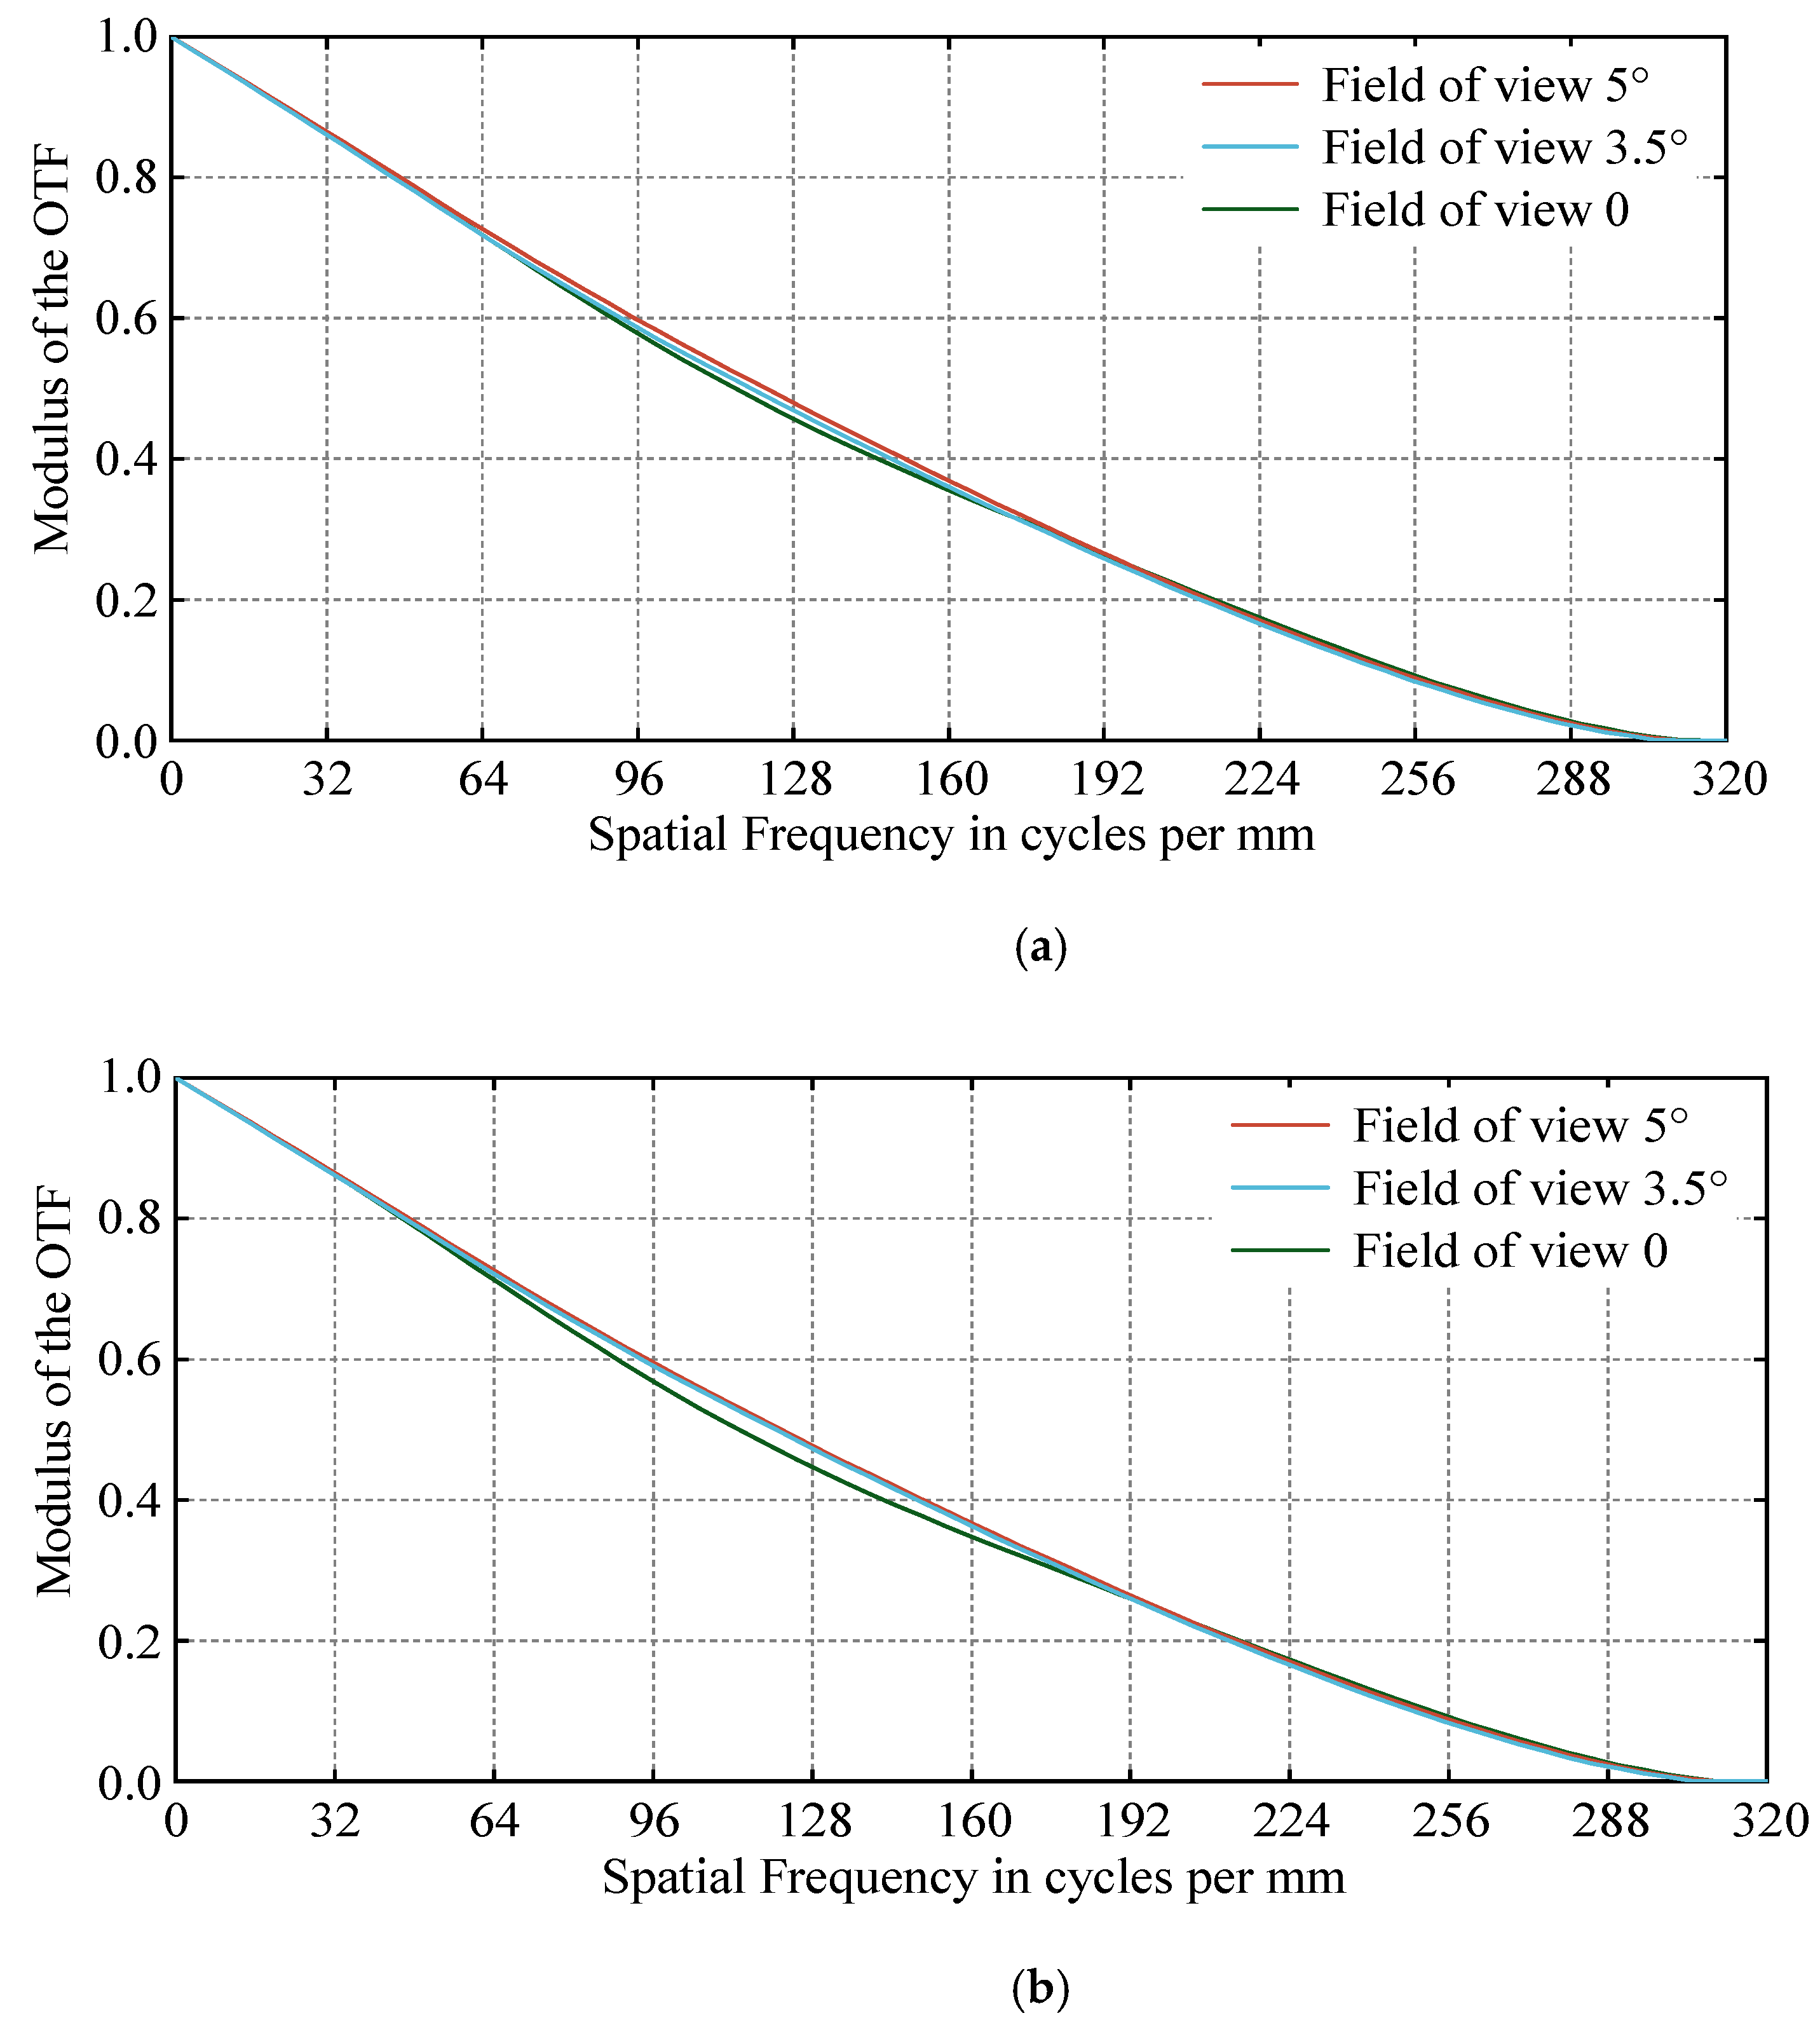
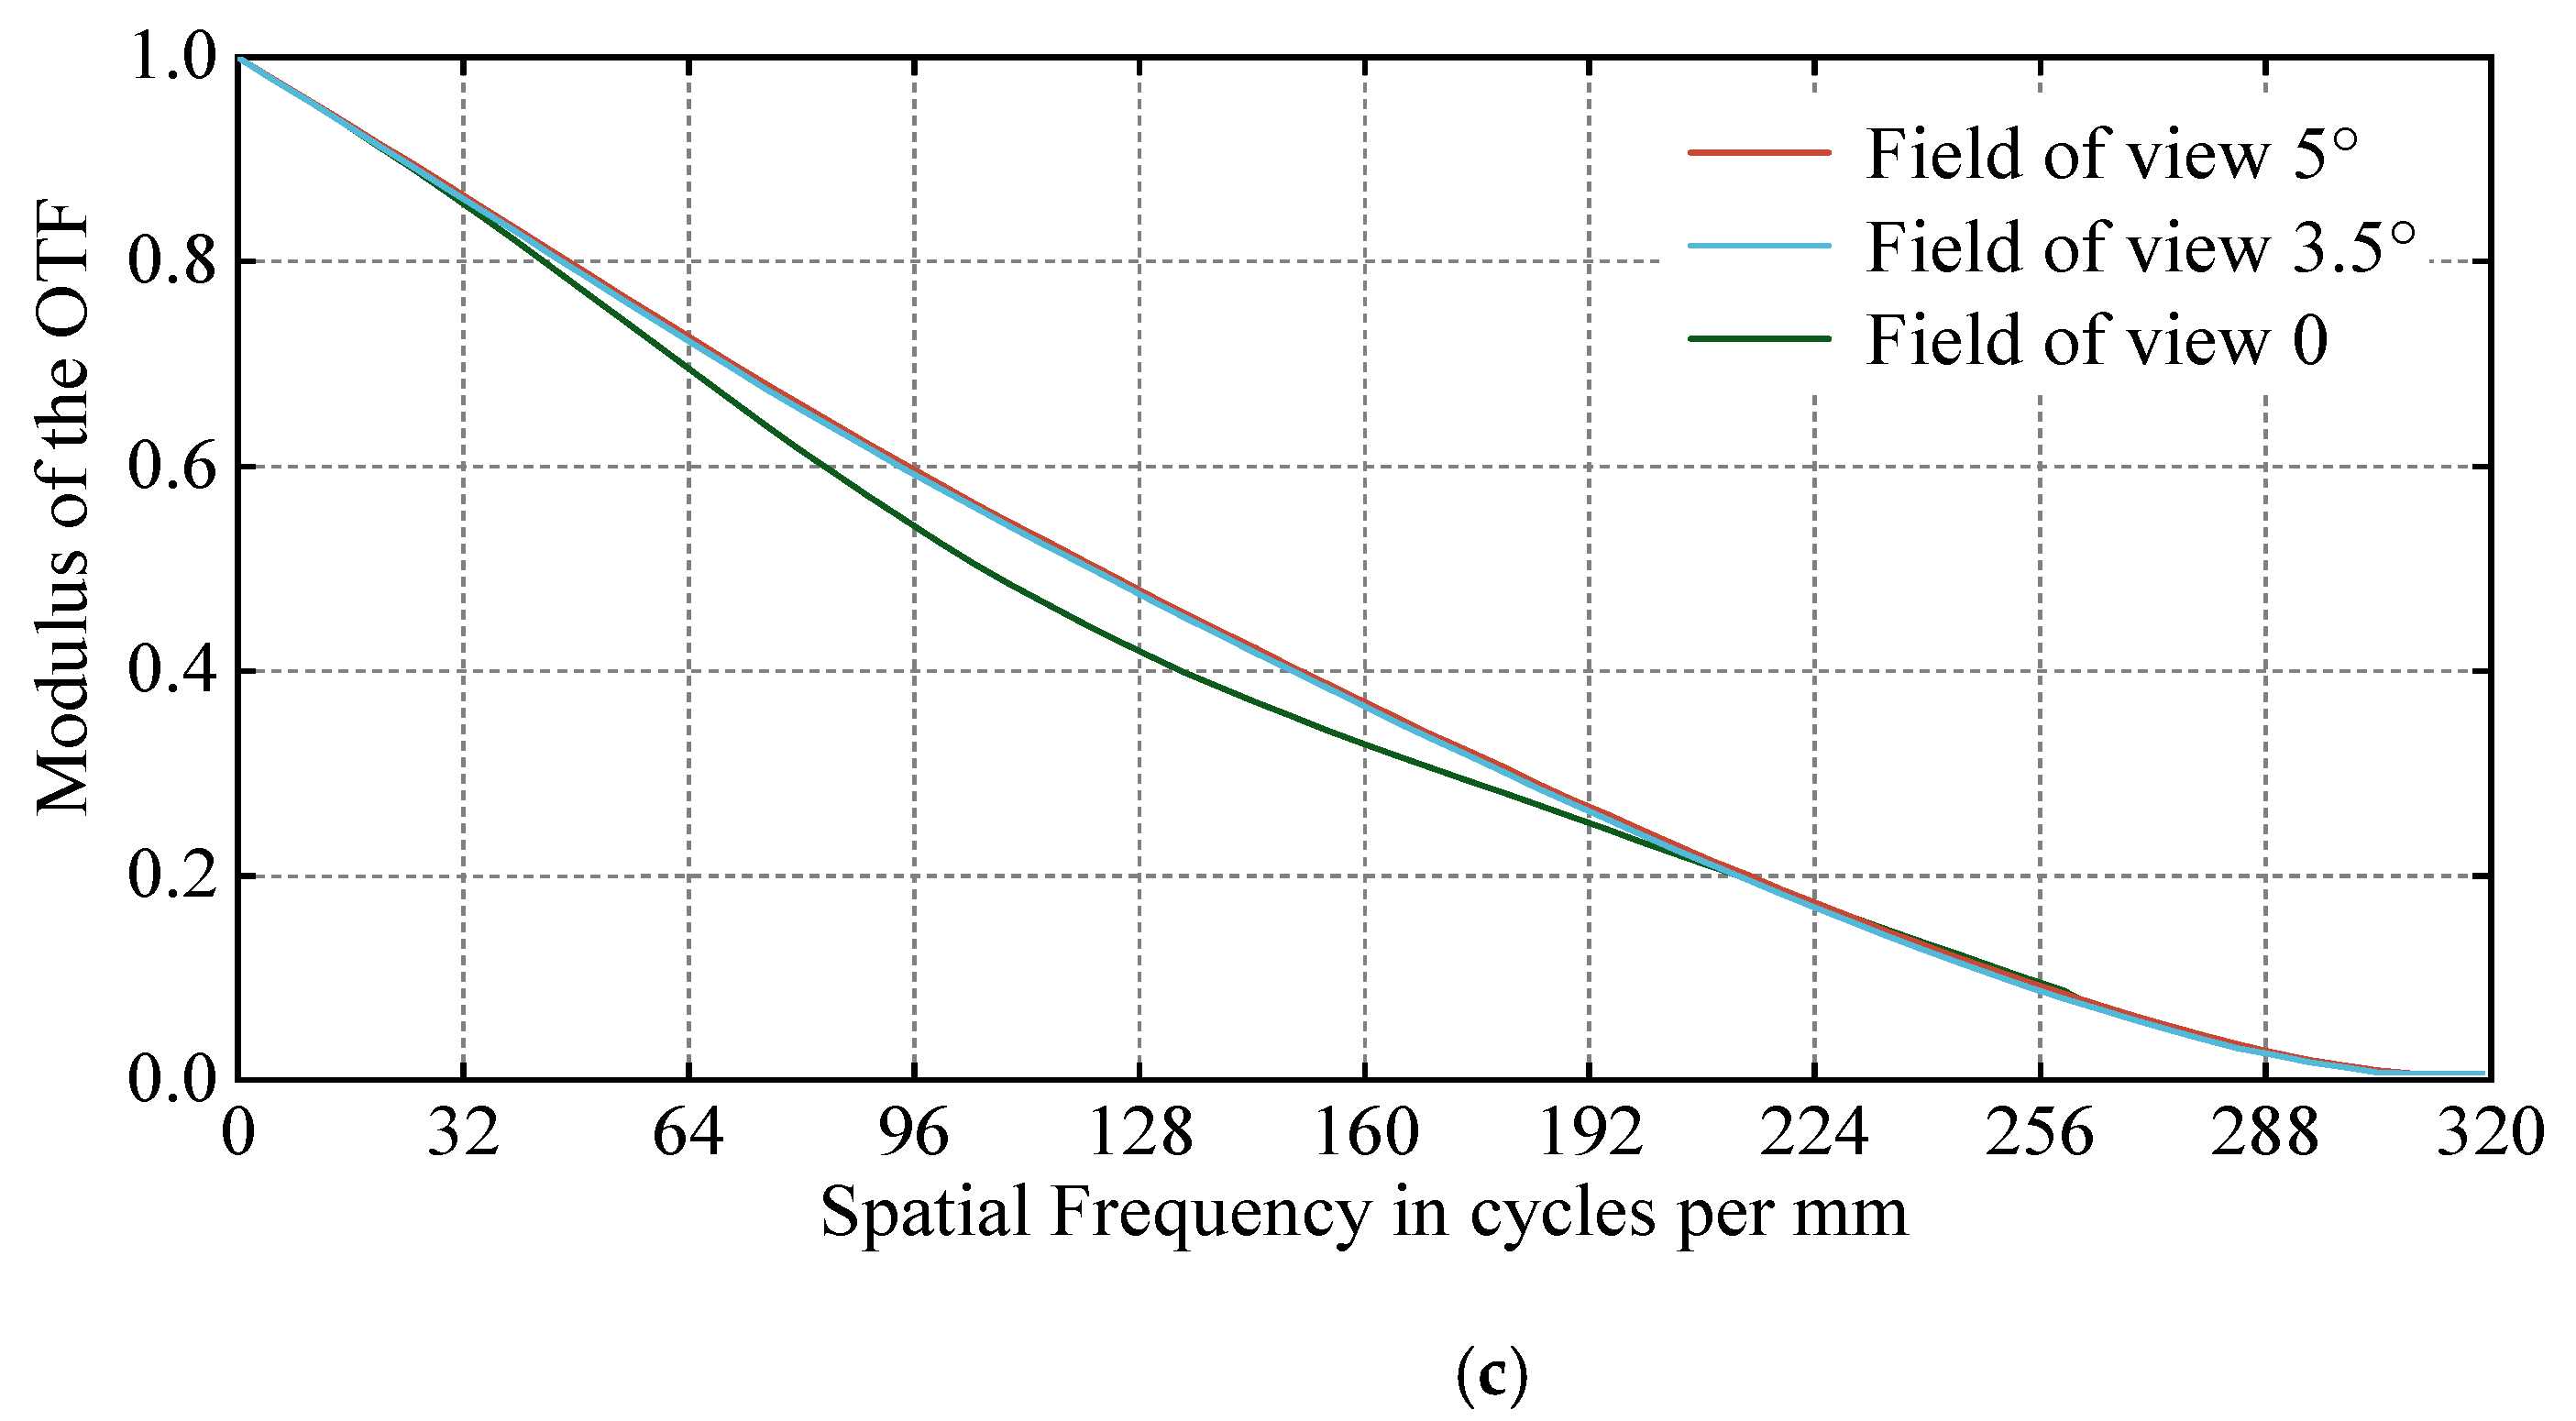
The modulation transfer function (MTF) can comprehensively evaluate the overall optical performance of an optical system and is applied to various systems with aberrations. Typically, the MTF can provide the propagation ability of an optical system for object images at various frequencies, where the low-frequency part reflects the contour of propagation quality, the mid-frequency part reflects the level of propagation quality, and the high-frequency part reflects the detail of propagation quality of an object. By fitting the surface deformation data of optical windows with different isolation devices obtained from finite element software using Zernike polynomials and importing the obtained Zernike coefficients into Zemax optical design software, the MTF curves of optical windows with different isolation devices can be calculated, as shown in Figure 12. The MTF values at a frequency of 56 lp/mm for two different optical windows with different isolation devices are statistically analyzed and presented in Table 3.
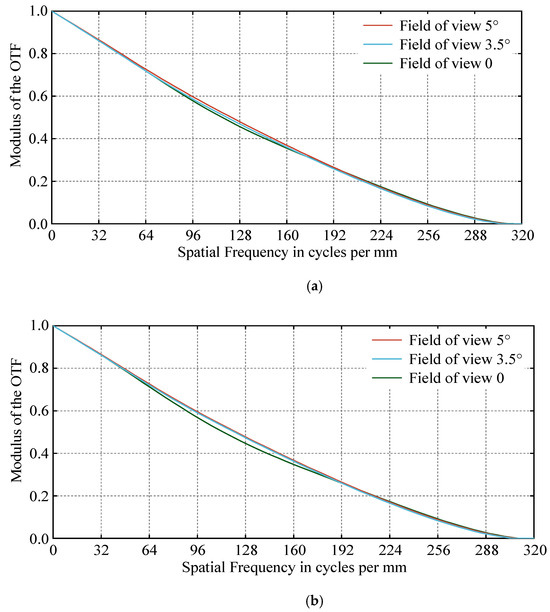
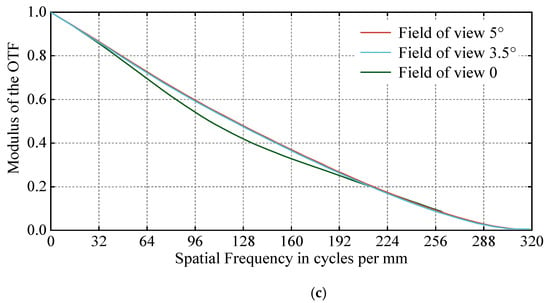
Figure 12.
MTF of different isolation devices: (a) circular rubber pad, (b) rectangular rubber pad, and (c) without rubber pad.

Table 3.
MTF of different isolation devices at 56 lp/mm.
From Figure 12 and Table 3, it can be observed that the modulation transfer function (MTF) decreases as spatial frequency increases, and the MTF value is still larger than 0.6 at a spatial frequency of 56 lp/mm, indicating that the deformation window has little effect on the optical system’s aberration when passing through the optical window. However, compared with the MTF curve of the optical window equipped with circular rubber pad isolators, the MTF curves of the optical window equipped with rectangular rubber pad isolators and without any isolators decrease more rapidly, suggesting the possible existence of field curvature and image distortion in the optical system which could reduce the imaging quality of the optical system. In summary, the optical window meets the requirements of the optical system when equipped with different types of isolators, but the vibration environment has a lower impact on the imaging quality of the optical window with circular rubber pad isolators compared to the optical window with rectangular rubber pad isolators and without any isolators.
5. Conclusions
Based on the passive isolation principle, this paper establishes a vibration model for the optical window and calculates the damping ratio relationship between the isolation device and the system mass to propose a vibration reduction solution using circular and rectangular rubber pads as isolation devices. Finite element analysis software is used to calculate the modes of optical windows with different isolation devices, and the surface deformation of the two types of optical windows is obtained after harmonic response analysis. The corresponding spatial optical system model is designed to fit the surface deformation of the optical window using Zernike polynomials, and the Zernike coefficients are imported into the optical system software to analyze the influence of optical windows with different isolation devices on imaging quality. The results show that the isolation effect of optical windows with circular rubber pads is better than those with rectangular rubber pads or without any isolation devices, and its impact on the imaging quality of the optical system is less than the others. The analysis process provides a solution to the blind engineering design problem of isolation devices for precision equipment such as optical windows and makes the design of optical windows more reasonable and reliable.
Author Contributions
Conceptualization, Y.L.; methodology, Y.L.; software, Y.L. and R.Z.; validation, Y.L.; formal analysis, Y.L.; investigation, Y.L.; resources, Y.L.; data curation, Y.L.; writing—original draft preparation, X.H.; writing—review and editing, Y.L. and X.H.; visualization, Y.L.; supervision, Y.L.; project administration, Y.L.; funding acquisition, Q.W. All authors have read and agreed to the published version of the manuscript.
Funding
This research was funded by the National Natural Science Foundation of China (No. 42074039) and the National Key Research and Development Program of China (2020YFB1600102).
Institutional Review Board Statement
Not applicable.
Informed Consent Statement
Not applicable.
Data Availability Statement
The data that support the findings of this article are not publicly available due to privacy and ethical concerns. They can be requested from the author at 230228958@seu.edu.cn.
Acknowledgments
We would like to thank the reviewers and the Applied Sciences team for their support.
Conflicts of Interest
The authors declare no conflicts of interest.
References
- Schwabe, R. Squeezed states of light and their applications in laser interferometers. Phys. Rep. 2017, 684, 1–51. [Google Scholar] [CrossRef]
- Pant, P.; Heikkinen, V.; Korpela, I. Evaluation of simulated bands in airborne optical sensors for tree species identification. Remote Sens. Environ. 2013, 138, 27–37. [Google Scholar] [CrossRef]
- Tan, C.; Mohseni, H. Emerging technologies for high performance infrared detectors. Nanophotonics 2017, 7, 169–197. [Google Scholar] [CrossRef]
- Xu, Y.; Wang, N.; Xu, Y. Design analysis of double optical window of high speed aerial remote sensor. Acta Optica Sinica. 2015, 35, 378–386. [Google Scholar]
- Fang, X.; Xiang, L.; Liu, Q. Design of optical window thickness and influence of its deformation on multi-spectral camera’s optical performance. Acta Optica Sinica. 2013, 33, 220–225. [Google Scholar] [CrossRef]
- Li, Q.; Yu, F. Optimization of optical window glass thickness based on the thermal optical analysis. Acta Optica Sinica. 2010, 30, 210–221. [Google Scholar] [CrossRef]
- Liu, X.; Gao, Y. Study of Large-Diameter Laser Emission Window Stitching Program. Acta Optica Sinica. 2014, 34, 243–248. [Google Scholar] [CrossRef]
- Marren, D. Aero-Optical Demonstration Test in the AEDC Hypervelocity Wind Tunnel 9. 1999. Available online: https://apps.dtic.mil/sti/citations/ADA370537 (accessed on 29 November 2023).
- Pearson, D.; Hardy, J.; Lysek, M. Verification facility for cryogenic optics, mechanisms, and structures for the SIRTF telescope. Infrared Spaceborne Remote Sens. VIII SPIE 2000, 4131, 250–254. [Google Scholar] [CrossRef]
- Fanson, J.; Fazio, G.; Houck, J.R. Space infrared telescope facility (SIRTF). In Proceedings of the SPIE-The International Society for Optical Engineering, Kona, HI, USA, 20–28 March 1998; Volume 3356, pp. 478–491. [Google Scholar] [CrossRef]
- Zhang, Y.; Fan, Z. Study on the optical path difference of aero-optical window. Opt.-Int. J. Light Electron Opt. 2007, 118, 557–560. [Google Scholar] [CrossRef]
- Luo, C.; Chang, W. Analysis of aerodynamic pressure loading for supersonic aircraft optical window. Infrared Laser Eng. 2011, 40, 4–8. [Google Scholar] [CrossRef]
- Crahan, G.; Rennie, M.; Rapagnani, L. Aerodynamic Shaping of Spherical Turrets to Mitigate Aero-Optic Effects. In Proceedings of the American Institute of Aeronautics and Astronautics, Nashville, TN, USA, 9–12 January 2012. [Google Scholar] [CrossRef]
- Lucca, D.; Gordeyev, S.; Jumper, E. The study of aero-optical and mechanical jitter for flat window turrets. In Proceedings of the 50th AIAA Aerospace Sciences Meeting including the New Horizons Forum and Aerospace Exposition, Nashville, TN, USA, 9–12 January 2012. [Google Scholar] [CrossRef]
- Zhang, Q.; Tan, Y. Technology for the structure and supporting form of large aperture optic window. High Power Laser Part. Beams 2018, 30, 1210031–1210037. [Google Scholar] [CrossRef]
- Bhowmick, M.; Basset, W.; Matveev, S. Optical windows as materials for high-speed shock wave detectors. AIP Adv. 2018, 8, 123–125. [Google Scholar] [CrossRef]
- Tahir, A.; Priyanto, I.; Arifin, B. Optical window design for MWIR camera. J. Phys. Conf. Ser. 2018, 1130, 12–21. [Google Scholar] [CrossRef]
- Liu, Y.; Song, Z.; Zhao, Y. Analysis of the influence of thermal and mechanical load on combined optical window. J. Opt. 2022, 51, 943–949. [Google Scholar] [CrossRef]
- Sun, C.F.; Zhang, X.D. Antivibration structure optimization of the optical window. Laser Infrared 2015, 45, 307–310. [Google Scholar] [CrossRef]
- Stetson, K.; Sawyer, F. A comparison of hypersonic wind tunnel data obtained by static and free oscillation techniques. In Proceedings of the 10th Fluid and Plasmadynamics Conference, Albuquerque, NM, USA, 27–29 June 1977; Volume 690. [Google Scholar] [CrossRef]
- Song, M.; Li, D.; Wang, H. Investigation about transonic wind tunnel test section noise mechanism based on experimental. Acta Aerodyn. Sinica 2014, 32, 488–492. [Google Scholar] [CrossRef]
- Regodic, D.; Samard, M.; Grubor, G. Review of the roll- damping, measurements in the T-38 wind tunnel. J. Sci. Res. Publ. 2013, 12, 1–6. Available online: https://citeseerx.ist.psu.edu (accessed on 3 February 2023).
- Huang, M.; Wang, Z. A Review of Wind Tunnel Based Virtual Flight Testing Techniques for Evaluation of Flight Control Systems. Int. J. Aerosp. Eng. 2015, 22, 672423. [Google Scholar] [CrossRef]
- Gu, W.; Yao, Z.; Liang, X. Material removal of optical glass BK7 during single and double scratch tests. Wear 2011, 270, 241–246. [Google Scholar] [CrossRef]
- Liu, H.; Zhang, C.; Liu, J. Research on grinding performance of micro-structured CVD diamond wheel for BK7 optical glass. In Proceedings of the 10th International Symposium on Advanced Optical Manufacturing and Testing Technologies: Advanced Optical Manufacturing and Metrology Technologies, Chengdu, China, 14–17 June 2021; Volume 120171, pp. 155–160. [Google Scholar] [CrossRef]
- Wang, Q.; Ma, G. Test and Analysis of Dynamic Sealing Performance of Large Size O-shaped Nitrile Rubber Ring. Lubr. Eng. 2022, 2, 47–51. [Google Scholar] [CrossRef]
- Mizuno, T. Vibration Isolation System Using Negative Stiffness. J. Jpn. Soc. Precis. Eng. 2004, 73, 418–421. [Google Scholar] [CrossRef][Green Version]
- Ibrahim, R. Recent advances in nonlinear passive vibration isolators. J. Sound Vib. 2008, 314, 371–452. [Google Scholar] [CrossRef]
- Zuo, L. Element and System Design for Active and Passive Vibration Isolation. Ph.D. Thesis, Massachusetts Institute of Technology, Massachusetts, UK, 2004. Available online: http://dspace.mit.edu/handle/1721.1/7582 (accessed on 29 November 2023).
- Beijers, C.; Noordman, B.; Boer, A. Numerical modelling of rubber vibration isolators: Identification of material parameters. In Proceedings of the 11th International Congress on Sound and Vibration, Stockholm, Sweden, 7–10 July 2003; Available online: https://research.utwente.nl (accessed on 5 April 2023).
- Du, H.; Yu, Y. Stiffness Calculation Model and Calculation of Rubber Damping Pad. Highway 2017, 62, 157–160. [Google Scholar] [CrossRef]
- Zuo, H.; Tan, J.; Wei, K. Effects of different poses and wind speeds on wind-induced vibration characteristics of a dish solar concentrator system. Renew. Energy 2021, 168, 1308–1326. [Google Scholar] [CrossRef]
- Li, B.; Yang, J.; Tang, Q. Influence of dynamic pressure on the optical window in laser interferometry. J. Vib. Shock 2020, 39, 126–131. Available online: http://jvs.sjtu.edu.cn/CN/Y2020/V39/I9/126 (accessed on 29 November 2023).
- Jia, E.; Liu, G.; Liu, T. Harmonic response analysis of a large dish solar thermal power generation system with wind-induced vibration. Sol. Energy 2019, 181, 116–129. [Google Scholar] [CrossRef]
- Shi, J.; Wu, Q. Thermal-Optical Analysis for Optical Window of High-Altitude and High-Speed Aerial Camera. Acta Optica Sinica. 2012, 32, 235–243. [Google Scholar] [CrossRef]
- Fan, D.; Ming, X. Thermal optical analysis and design of optical window in high-altitude and high-speed environment. Infrared Laser Eng. 2016, 45, 202–208. [Google Scholar] [CrossRef]
Disclaimer/Publisher’s Note: The statements, opinions and data contained in all publications are solely those of the individual author(s) and contributor(s) and not of MDPI and/or the editor(s). MDPI and/or the editor(s) disclaim responsibility for any injury to people or property resulting from any ideas, methods, instructions or products referred to in the content. |
© 2024 by the authors. Licensee MDPI, Basel, Switzerland. This article is an open access article distributed under the terms and conditions of the Creative Commons Attribution (CC BY) license (https://creativecommons.org/licenses/by/4.0/).

