Article

Research on the Fabrication and Parameters of a Flexible Fiber Optic Pressure Sensor with High Sensitivity

1
Key Laboratory of Micro/nano Devices and Systems, Ministry of Education, North University of China, Taiyuan 030051, China
2
State Key Laboratory of Electronic Testing Technology, North University of China, Taiyuan 030051, China
*
Author to whom correspondence should be addressed.
Photonics 2024, 11(10), 919; https://doi.org/10.3390/photonics11100919
Submission received: 16 August 2024 / Revised: 18 September 2024 / Accepted: 26 September 2024 / Published: 28 September 2024
(This article belongs to the Special Issue Optical Sensors and Devices)

Abstract

:
In recent years, flexible pressure sensors have garnered significant attention. However, the development of large-area, low-cost, and easily fabricated flexible pressure sensors remains challenging. We designed a flexible fiber optic pressure sensor for contact force detection based on the principle of backward Rayleigh scattering using a single-mode optical fiber as the sensing element and polymer PDMS as the encapsulation material. To enhance the sensor’s sensitivity and stability, we optimized its structural design, parameters, and fabrication process and measured the fiber strain using an optical frequency domain reflectometer (OFDR). The results showed that the sensor achieved a high sensitivity of 6.93247 με/kPa with a PDMS concentration ratio of 10:1, a curing time of 2 h, and a substrate thickness of 5 mm. The sensor demonstrated excellent linearity and repeatability in static performance tests and was successfully used to monitor the plantar pressure distribution in real time. This flexible fiber optic pressure sensor can be developed via a simple fabrication process, has a low cost, and has high sensitivity, highlighting its potential applications in smart wearables and medical diagnostics.

1. Introduction

Flexible pressure sensors are widely used in aerospace, medical devices, smart wearables, human–computer interactions, and robotics due to their thinness, portability, high sensitivity, and ability to detect pressure on irregular surfaces [1,2,3,4,5,6,7]. However, most flexible pressure sensors rely on capacitive, piezoelectric, or piezoresistive mechanisms, which are prone to electromagnetic interference and require arrays for large-area measurements. This increases the fabrication complexity, introduces numerous wires, and leads to the uneven distribution of current, creating safety hazards and high costs [8,9,10,11,12]. In contrast, fiber optic pressure sensors offer high sensitivity, a small size, and strong resistance to electromagnetic interference. The most widely used fiber optic pressure sensors are Fabry–Perot and fiber Bragg grating sensors, which require the complex and expensive micromachining of optical fibers. The delicate nature of optical fibers makes this process challenging, and even minor structural differences can significantly impact the measurement results, hindering their mass production [13,14,15,16,17,18]. Therefore, developing a flexible pressure sensor with high sensitivity, a low cost, and a simple structure is crucial.
In 2022, Cui Kai et al. from the University of Macau proposed a low-cost OFDR sensor and pressure measurement method, utilizing a flexible PDMS material to encapsulate a standard single-mode optical fiber. The results showed that the fabricated sensor exhibited good linearity and repeatability. However, the article did not provide specific details regarding the sensor’s fabrication process, and the sensor’s measurement range was limited; they also did not propose suitable engineering applications [19]. In the same year, Ni Yao et al. from Zhejiang University proposed a tactile sensor based on an optical microfiber, leveraging the waveguiding properties of microfibers to sense temperature and pressure through changes in the light intensity at different wavelengths. This sensor was found to have high sensitivity and a fast pressure response, making it suitable for the real-time monitoring of humans’ skin temperature and pulse, particularly in the fields of healthcare monitoring and robotics [20].
In 2023, Liangye Li et al. from Huazhong University of Science and Technology introduced an optical-fiber-sensor-assisted smartwatch for the precise and continuous monitoring of blood pressure. The design included a fiber adapter for detecting pulse wave signals and a liquid capsule for enhancing the consistency of the sensor’s coupling with the body, showing the potential to be applied in digital health [21]. That same year, Lei Hou et al. developed a distributed fiber optic sensor using tapered optical fibers and deep learning algorithms; this sensor was capable of sensing high-resolution position and force information. The tapered fiber’s non-uniform structure provided rich wavelength information, achieving a position accuracy of up to 7.6 μm and a force accuracy of 0.02 N. The experimental results demonstrated the sensor’s ability to perform the distributed sensing of position and force on a two-dimensional plane [22].
This paper presents a flexible fiber optic pressure sensor for contact force testing, featuring a “sandwich” structure and using PDMS as the elastic encapsulation material. The relationship between pressure and strain was established through experimental testing and the characterization of the PDMS matrix with different thicknesses, ratios, and curing times. The resulting sensor demonstrated high sensitivity, linearity, and repeatability. Static analysis and experimental validation confirmed that the sensor provides a good response output and the accurate localization of the application point; the sensor was therefore used to successfully monitor the distribution of plantar pressure in real time. The sensor holds scientific significance and practical value in human motion recognition, health monitoring, and pressure monitoring on flexible curved surfaces.

2. Theory and Methods

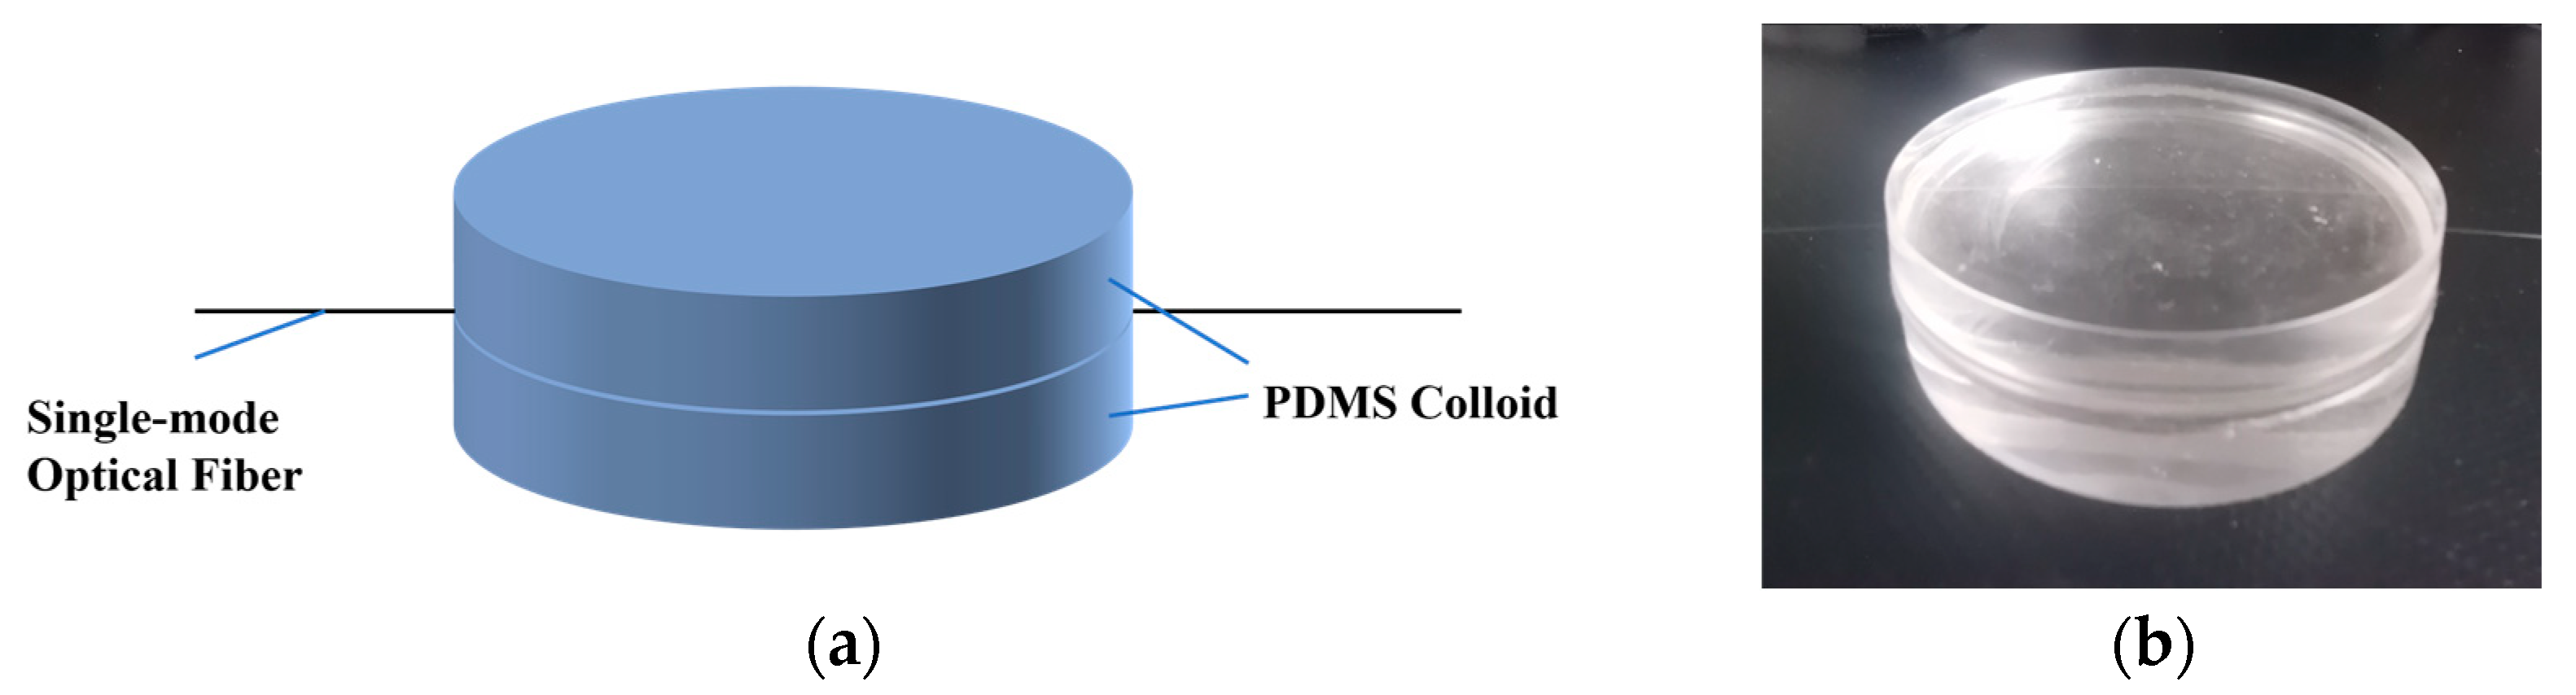
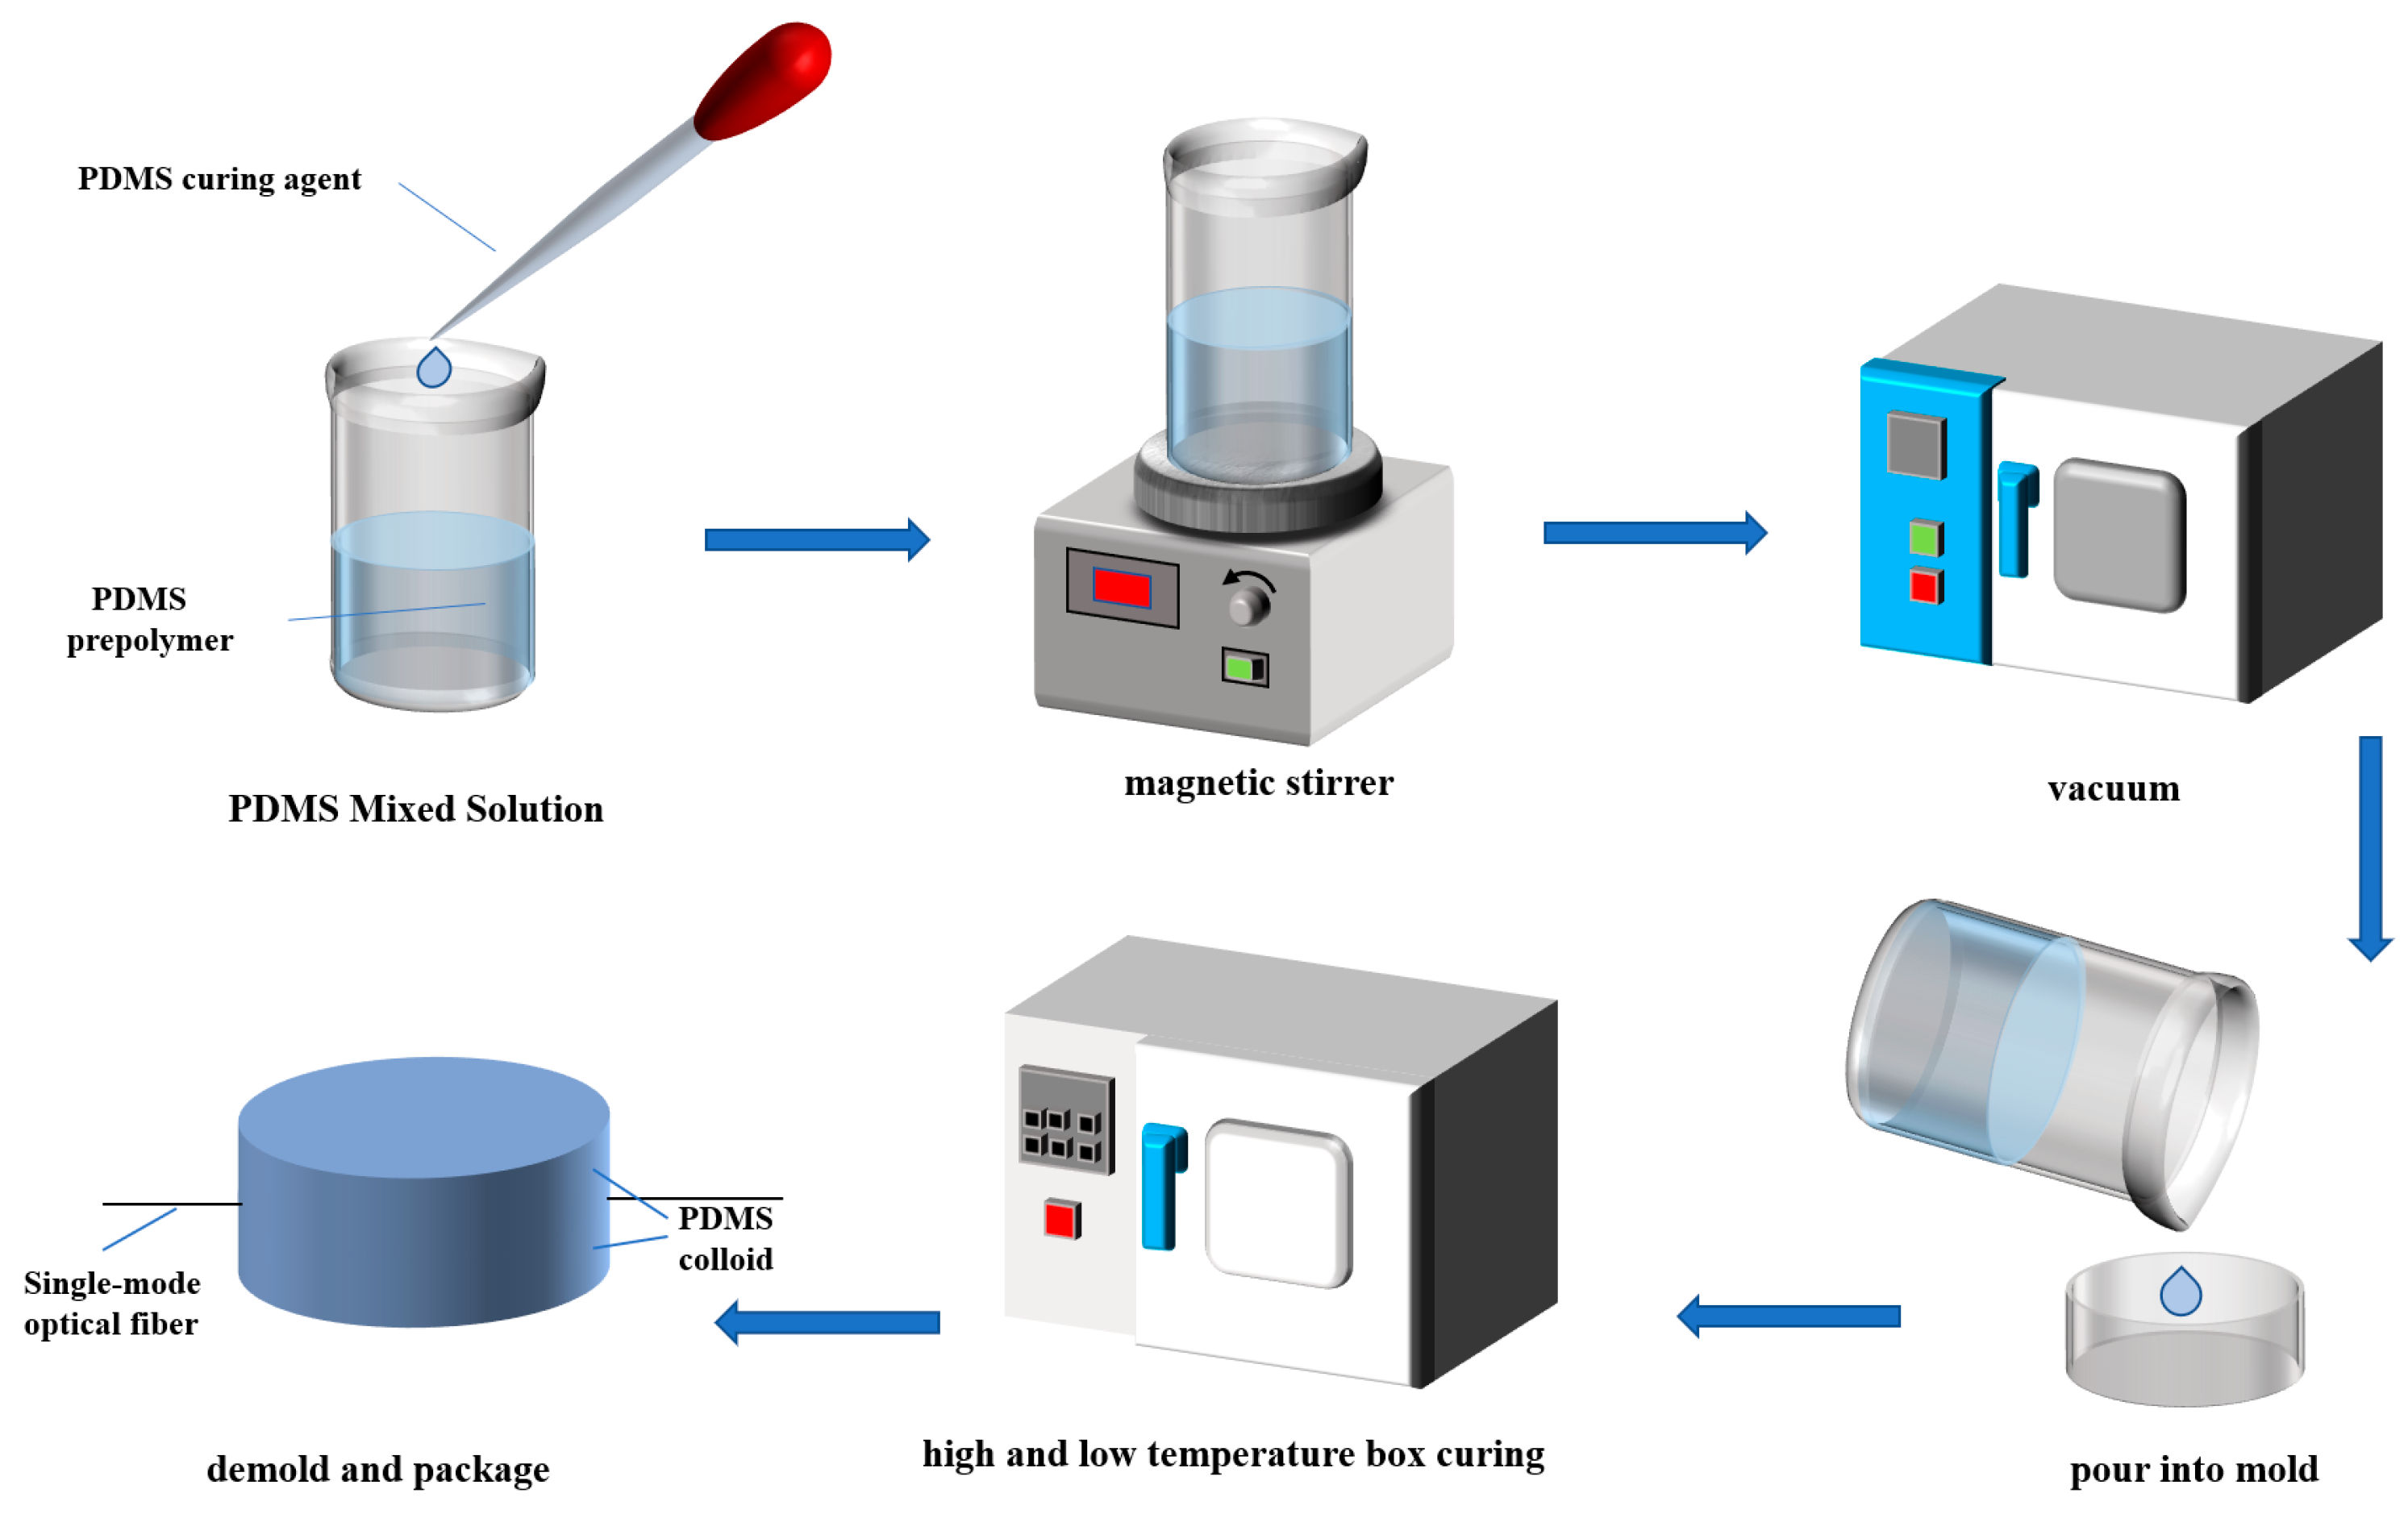
2.1. Sensor Structure Design

The three-dimensional structure and physical prototype of the sensor are shown in Figure 1a,b. The upper and lower layers are substrate contact surfaces made from PDMS, with an untreated single-mode bare fiber embedded inside.
The single-mode bare optical fiber is mainly composed of core, cladding, and coating layers, as shown in Figure 2a,b. To meet the conditions required for total internal reflection, the fiber core and cladding are made of glass with different refractive indices. The core is made of germanium-doped silica with a high refractive index, while the cladding is made of pure silica with a lower refractive index. Due to the material characteristics of the core and cladding, the fiber cannot easily be bent and is fragile. Therefore, the outside coating layer and the cladding serve to protect the fiber from external damage and increase its flexibility. The coating is typically made of acrylic resin. In the experiment, the single-mode fiber G.657A2(Yangtze Optical Fiber and Cable Co., Ltd, Wuhan, China), was selected as the sensing fiber. The specific parameters are shown in Table 1 [23].
The main component of both the core and the cladding is silica, and their mechanical properties are essentially the same, allowing us to consider the core and cladding as a single entity. Therefore, the structure of the single-mode optical fiber can be simplified into two coaxial cylindrical structures. According to Lame’s equations, when a multi-layered slender cylindrical structure is subjected to an externally applied radial pressure, the expressions for the radial, axial [24], and circumferential stresses and strains in each cylindrical layer are given by the following:
σ r ( n ) σ θ ( n ) σ z ( n ) = λ ( n ) + 2 μ ( n ) λ ( n ) λ ( n ) λ ( n ) λ ( n ) + 2 μ ( n ) λ ( n ) λ ( n ) λ ( n ) λ ( n ) + 2 μ ( n ) × ε r ( n ) ε θ ( n ) ε z ( n )
In the equations, n represents the n-th layer of the optical fiber; σ r n ,   σ θ n , and σ z n are the radial, circumferential, and axial stresses experienced by the n-th layer structure, respectively; ε r ( n ) , ε θ ( n ) , and ε z ( n ) are the radial, circumferential, and axial strains experienced by the n-th layer structure, respectively; and λ(n) and μ(n) are Lame’s first parameter and Lame’s second parameter for the material of the n-th layer, respectively. The specific method used to calculate these parameters is as follows:
λ n = v n × E n 1 + v n 1 2 v n      
μ ( n ) = E n 2 1 + v n
Here, E n and v n represent the elastic modulus and Poisson’s ratio of the n-th layer material, respectively.
According to Equation (1), the radial, circumferential, and axial strains of each layer of the optical fiber material can be obtained as follows.
ε r ( n ) ε θ ( n ) ε z ( n ) = λ ( n ) + 2 μ ( n ) λ ( n ) λ ( n ) λ ( n ) λ ( n ) + 2 μ ( n ) λ ( n ) λ ( n ) λ ( n ) λ ( n ) + 2 μ ( n ) 1 × σ r ( n ) σ θ ( n ) σ z ( n )
Therefore, the axial strain generated in the optical fiber core and cladding under the applied pressure P can be obtained as follows:
ε Z ( 1 ) = 2 v 1 p E 1
The process of fabricating the sensor with a “sandwich” structure is shown in Figure 3. First, process drawings of the semi-cylindrical sensitized structure were created using SolidWorks2022 software. A flip mold was then made using a 3D printer, and a layer of Vaseline was evenly applied to the internal walls of the mold to facilitate easy release. PDMS prepolymers (Sylgard 184, Dow Corning, Midland, MI, USA) were mixed with a curing agent in various ratios. The mixture was stirred using a magnetic stirrer until it became milky white, then left to stand at room temperature for 30 min before being vacuum-dried in an oven (vacuum < 133 Pa) for 30 min to remove air bubbles. Then, the single-mode optical fiber was embedded into the groove along the axis of the mold. It is important to apply a certain amount of pre-stress to the optical fiber during operation to keep it taut and reduce the number of errors caused by slack in the fiber during testing. Acrylic α-cyanoethyl acrylate glue was then used to fix the optical fiber at the hole position to prevent the fiber bending due to the tension of the PDMS after pouring the PDMS mixture. After all the bubbles in the PDMS mixture dissipated, the mixed PDMS solution was poured into the mold and placed in a temperature-controlled chamber for pre-curing at 50 °C for 1 h. After pre-curing, it was removed and cooled at room temperature to form the first layer of the PDMS substrate. Then, the mixed PDMS was poured into the mold again to cover the optical fiber and form the second layer of the PDMS substrate, ensuring that the optical fiber was fully encapsulated in the PDMS. It was then placed in a temperature-controlled chamber and cured at 80 °C for 2 h to ensure the complete curing and firm bonding of the PDMS. Finally, it was demolded to complete the production of the flexible optical fiber sensor with a “sandwich” structure.

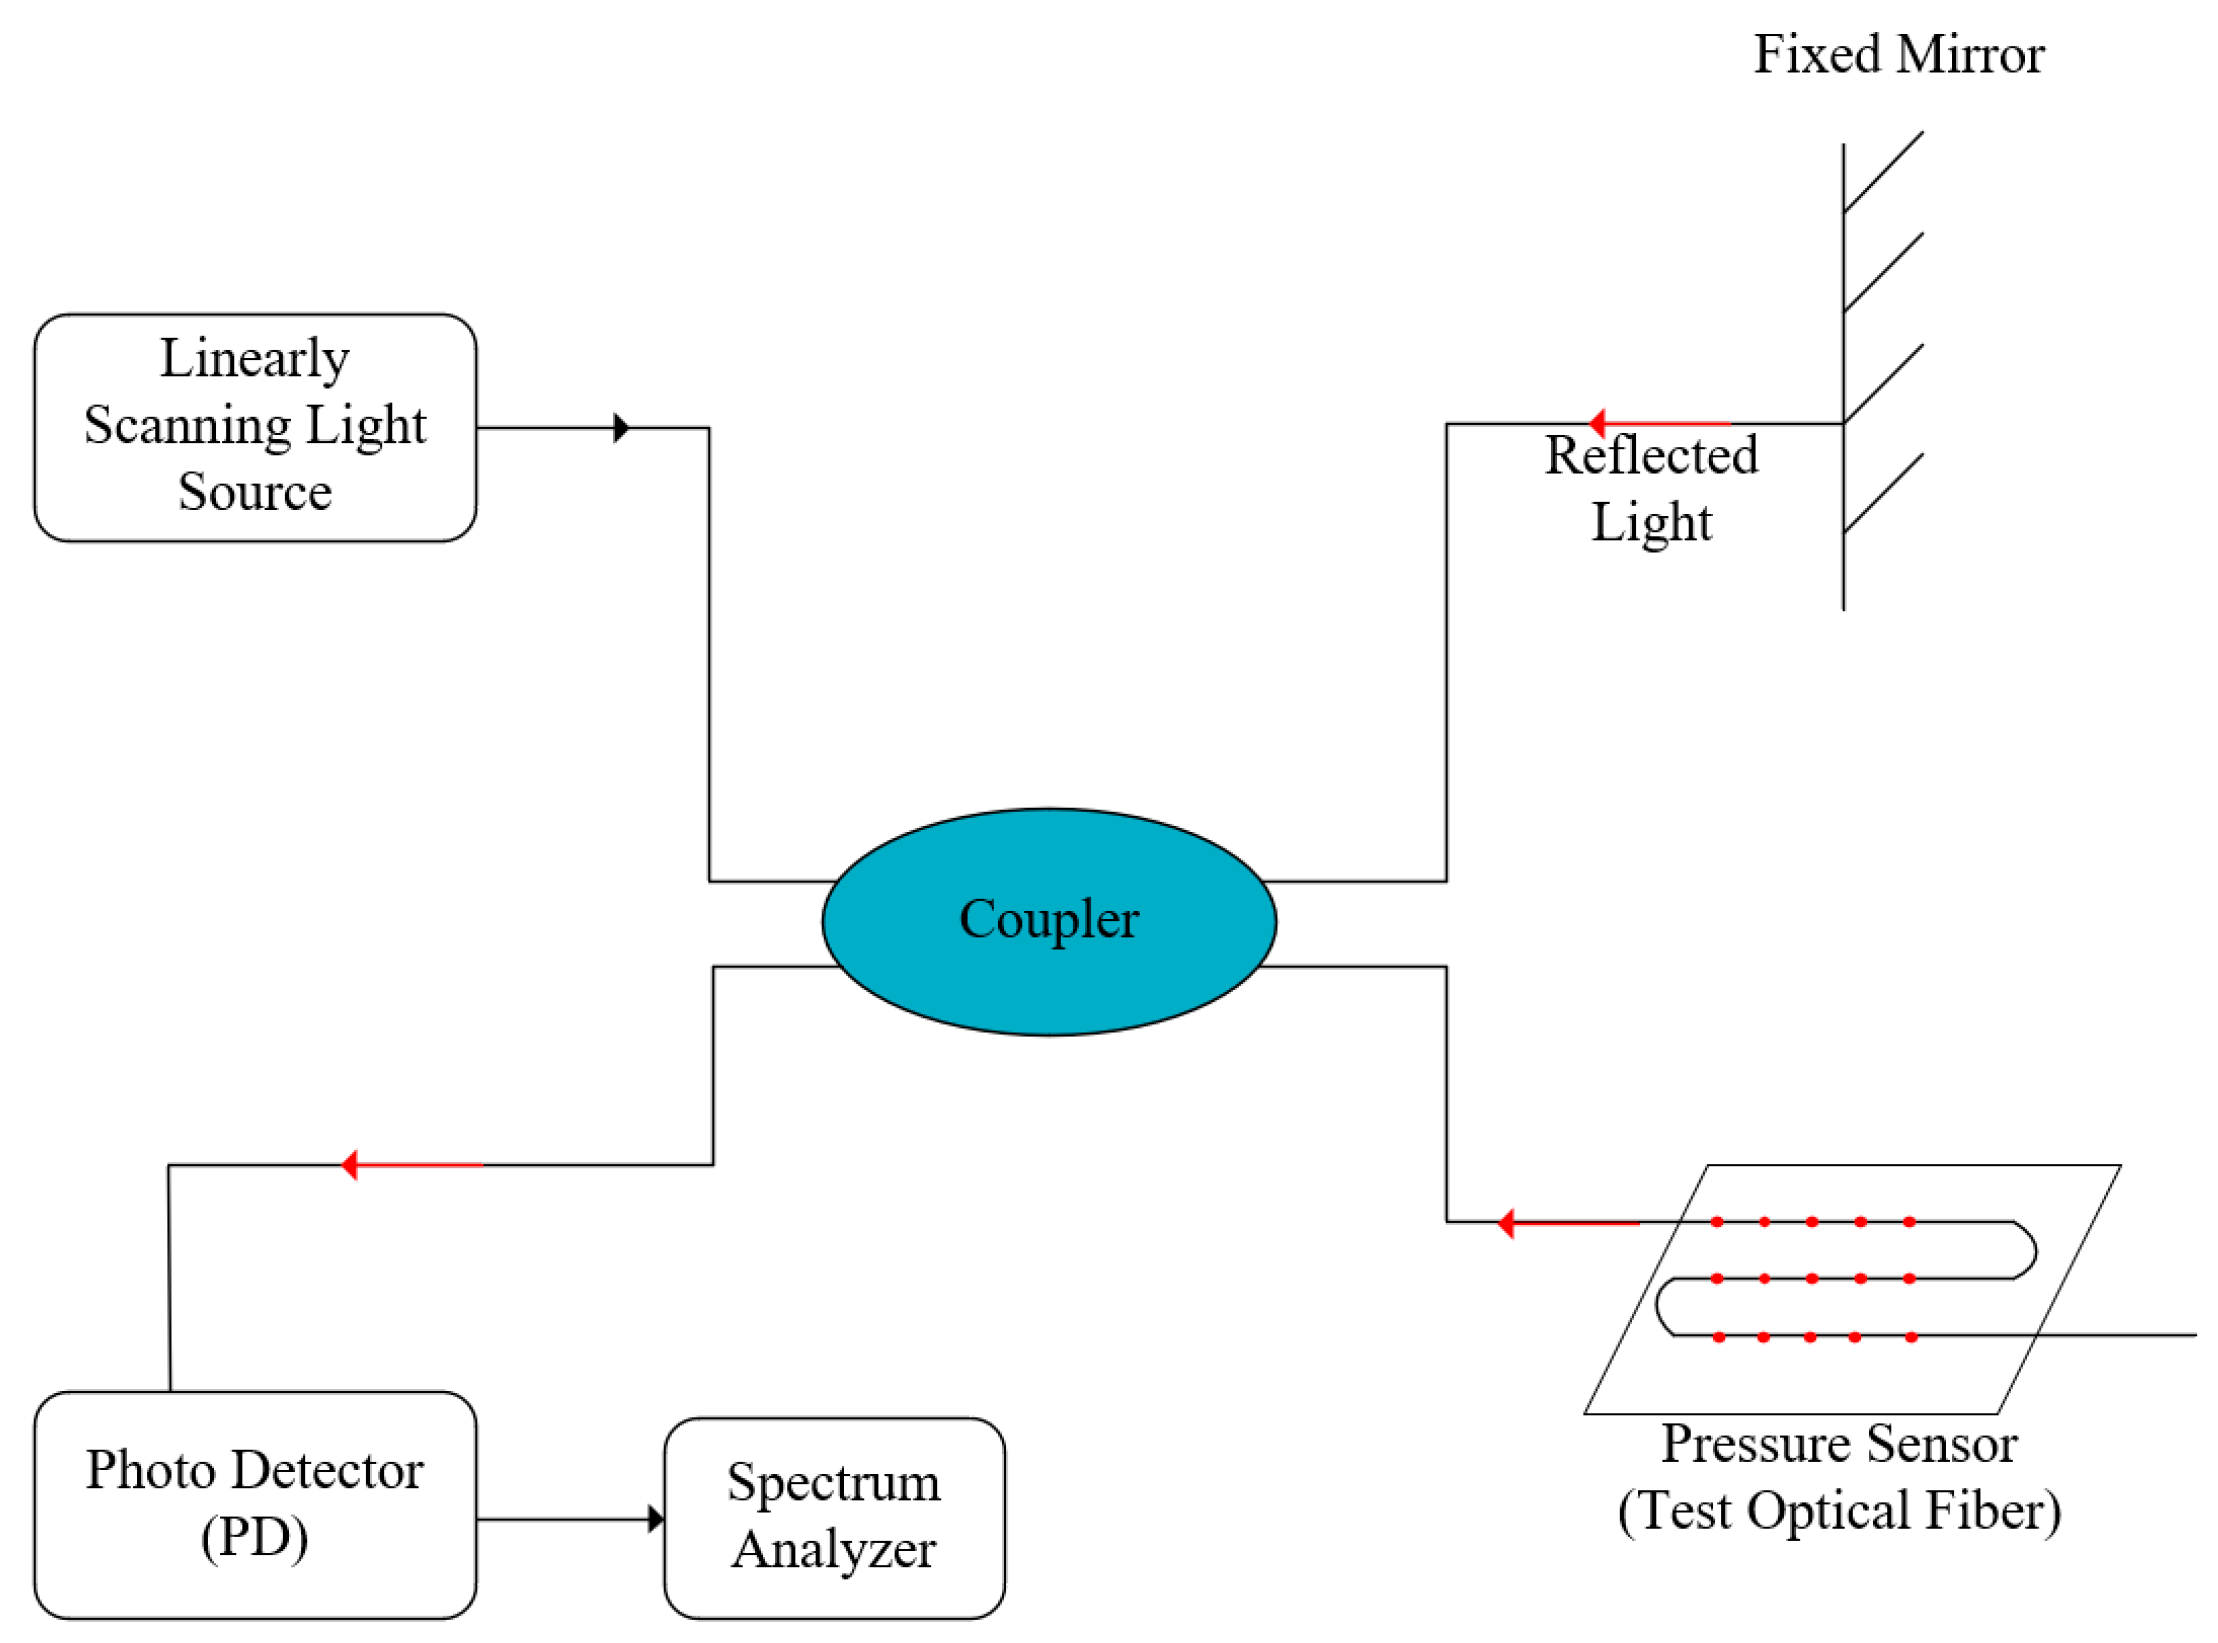
2.2. Theory of the Sensor Measurement

When pressure is applied to the PDMS material, the optical fiber embedded within it is axially strained, along with the deformation of the thin PDMS substrate. This strain leads to changes in the distribution of the refractive index of the fiber optic medium, altering the direction of the light signals and leading to Rayleigh scattering [25,26,27]. The backward-propagating light wave, known as backward Rayleigh scattered light, carries loss signals from various points along the fiber and is more readily detectable compared to other scattering techniques. Thus, we use the optical frequency domain reflection (OFDR) technique, which is based on backward Rayleigh scattering, to detect the optical signals in the fiber [28,29,30]. The working principle of OFDR measurement is illustrated in Figure 4.
A linear swept light source emits a swept laser beam, which is divided into two paths by a fiber coupler. One path enters the fiber optic device being tested as the signal arm, while the other enters a fixed-length fiber as the reference arm. The light in the reference arm, oscillating intrinsically, is reflected back by a tail mirror and combined with the Rayleigh backscattered light from the signal arm at the coupler, forming a typical Michelson interference pattern. The beat frequency, f b , is calculated using Fast Fourier Transform (FFT). Given the swept frequency of the linear swept light source γ, the refractive index of the fiber n, and the speed of light c, the position z of the Rayleigh backscattering in the fiber being tested can be determined [31].
z = c f b 2 n γ
When the fiber being tested is subjected to external pressure at position z, the frequency of the backward Rayleigh scattering signal will shift, and this spectral shift is proportional to the strain on the fiber. The magnitude of the spectral shift can be determined by correlating the signals from the reference and signal arms. The spectral shift due to strain ϵ is given by the following:
Δ λ λ = Δ ν ν = K s ε
where λ and Δλ represent the average optical wavelength and the wavelength shift of the light, respectively, and ν and Δν represent the average optical frequency and the frequency shift of the light, respectively. K s is the strain calibration constant, which, for germanium silicate glass-core fibers, is typically given by the following [32]:
K s = 0.78
K s is primarily determined by the doping type and concentration of the fiber core, and to a lesser extent, by the composition of the cladding and coating. Using the calculated fiber frequency offset, the fiber strain can be determined as follows:
ε = λ ¯ c K ε
where λ ¯ is the center wavelength of the scan; c is the speed of light, and K ε is the strain induction factor.
Therefore, by combining the strain coefficient of the fiber with the frequency shift of the backward Rayleigh scattering signal, the strain information of the fiber can be obtained. In practical applications, the sensing fiber is first calibrated, and the measured strain data are then fitted using the least squares method to establish the relationship between the strain and applied external force. This process ultimately determines the true value of the applied force, which is the sensing principle of the flexible fiber optic pressure sensor based on the backward Rayleigh scattering technique [33].

3. Experimental Testing and Results

As shown in Figure 5, the measurement system consists of the flexible fiber optic pressure transducer fabricated earlier, a rack-mounted push-pull meter (SUNDOO, SH-50), which provides uniform and stable radial pressure to the fiber optic pressure sensor and the effective force area of the applied load is 180.26 mm2, and a backscatter reflectometer (LUNA, OBR 4600, LUNA, Roanoke, VA, USA). To set up the test equipment, a fusion splicer was used to connect the flexible pressure sensor to a fiber optic patch cord. The patch cord end was then cleaned with a fiber optic wiper and connected to the Luna OBR 4600 fiber demodulator. A knot was tied at the end of the fiber to minimize the influence of end effects, and the sensitive portion of the fiber, with its flexible encapsulation, was positioned at the force application point of the push-pull meter. All experiments were conducted by applying a uniform and stable radial pressure to the fiber using the push-pull meter. The output data obtained from the backscatter reflectometer were stored in real-time on a computer for subsequent analysis.
Before starting the formal experiment, a pressure calibration test needed to be performed on the experimental setup. The flexible optical fiber pressure sensor fabricated in the previous section, with a width of 15 mm and a thickness of 5 mm, was selected for loading and unloading calibration. Considering the pre-stress present in the experimental setup itself, at least three pre-pressures needed to be applied without recording the data. Then, pressure was applied to the sensor; after the application of each pressure, we waited 3 min for the pressure to stabilize before taking measurements to ensure that the pressure applied was in a steady state. The LUNA OBR 4600 backscatter reflectometer was used for data collection. To avoid randomness and reduce experimental error, the entire loading and unloading process of the sensor was repeated three times, and the average of the three measurements was used as the initial calibration value for the subsequent experiments.
In order to ensure the stability and efficiency of transmission or the sensing performance, the key parts of the optical fiber needed to be spatially positioned. Here, we used localized heating to finely adjust the path of the fiber. Compared to traditional mechanical methods such as bending or stretching, which may introduce unnecessary stress that affect the performance of the fiber or even damage it, localized heating is a non-contact method that enables the precise control of fiber deformation without introducing additional stress. The specific implementation method involves using an infrared laser to heat a localized area of the fiber. The infrared laser can penetrate the transparent coating layer and directly heat the fiber core, making the heating range very precise. Once the desired deformation is achieved, heating is stopped, and after the fiber cools, the deformation is fixed in the target position.

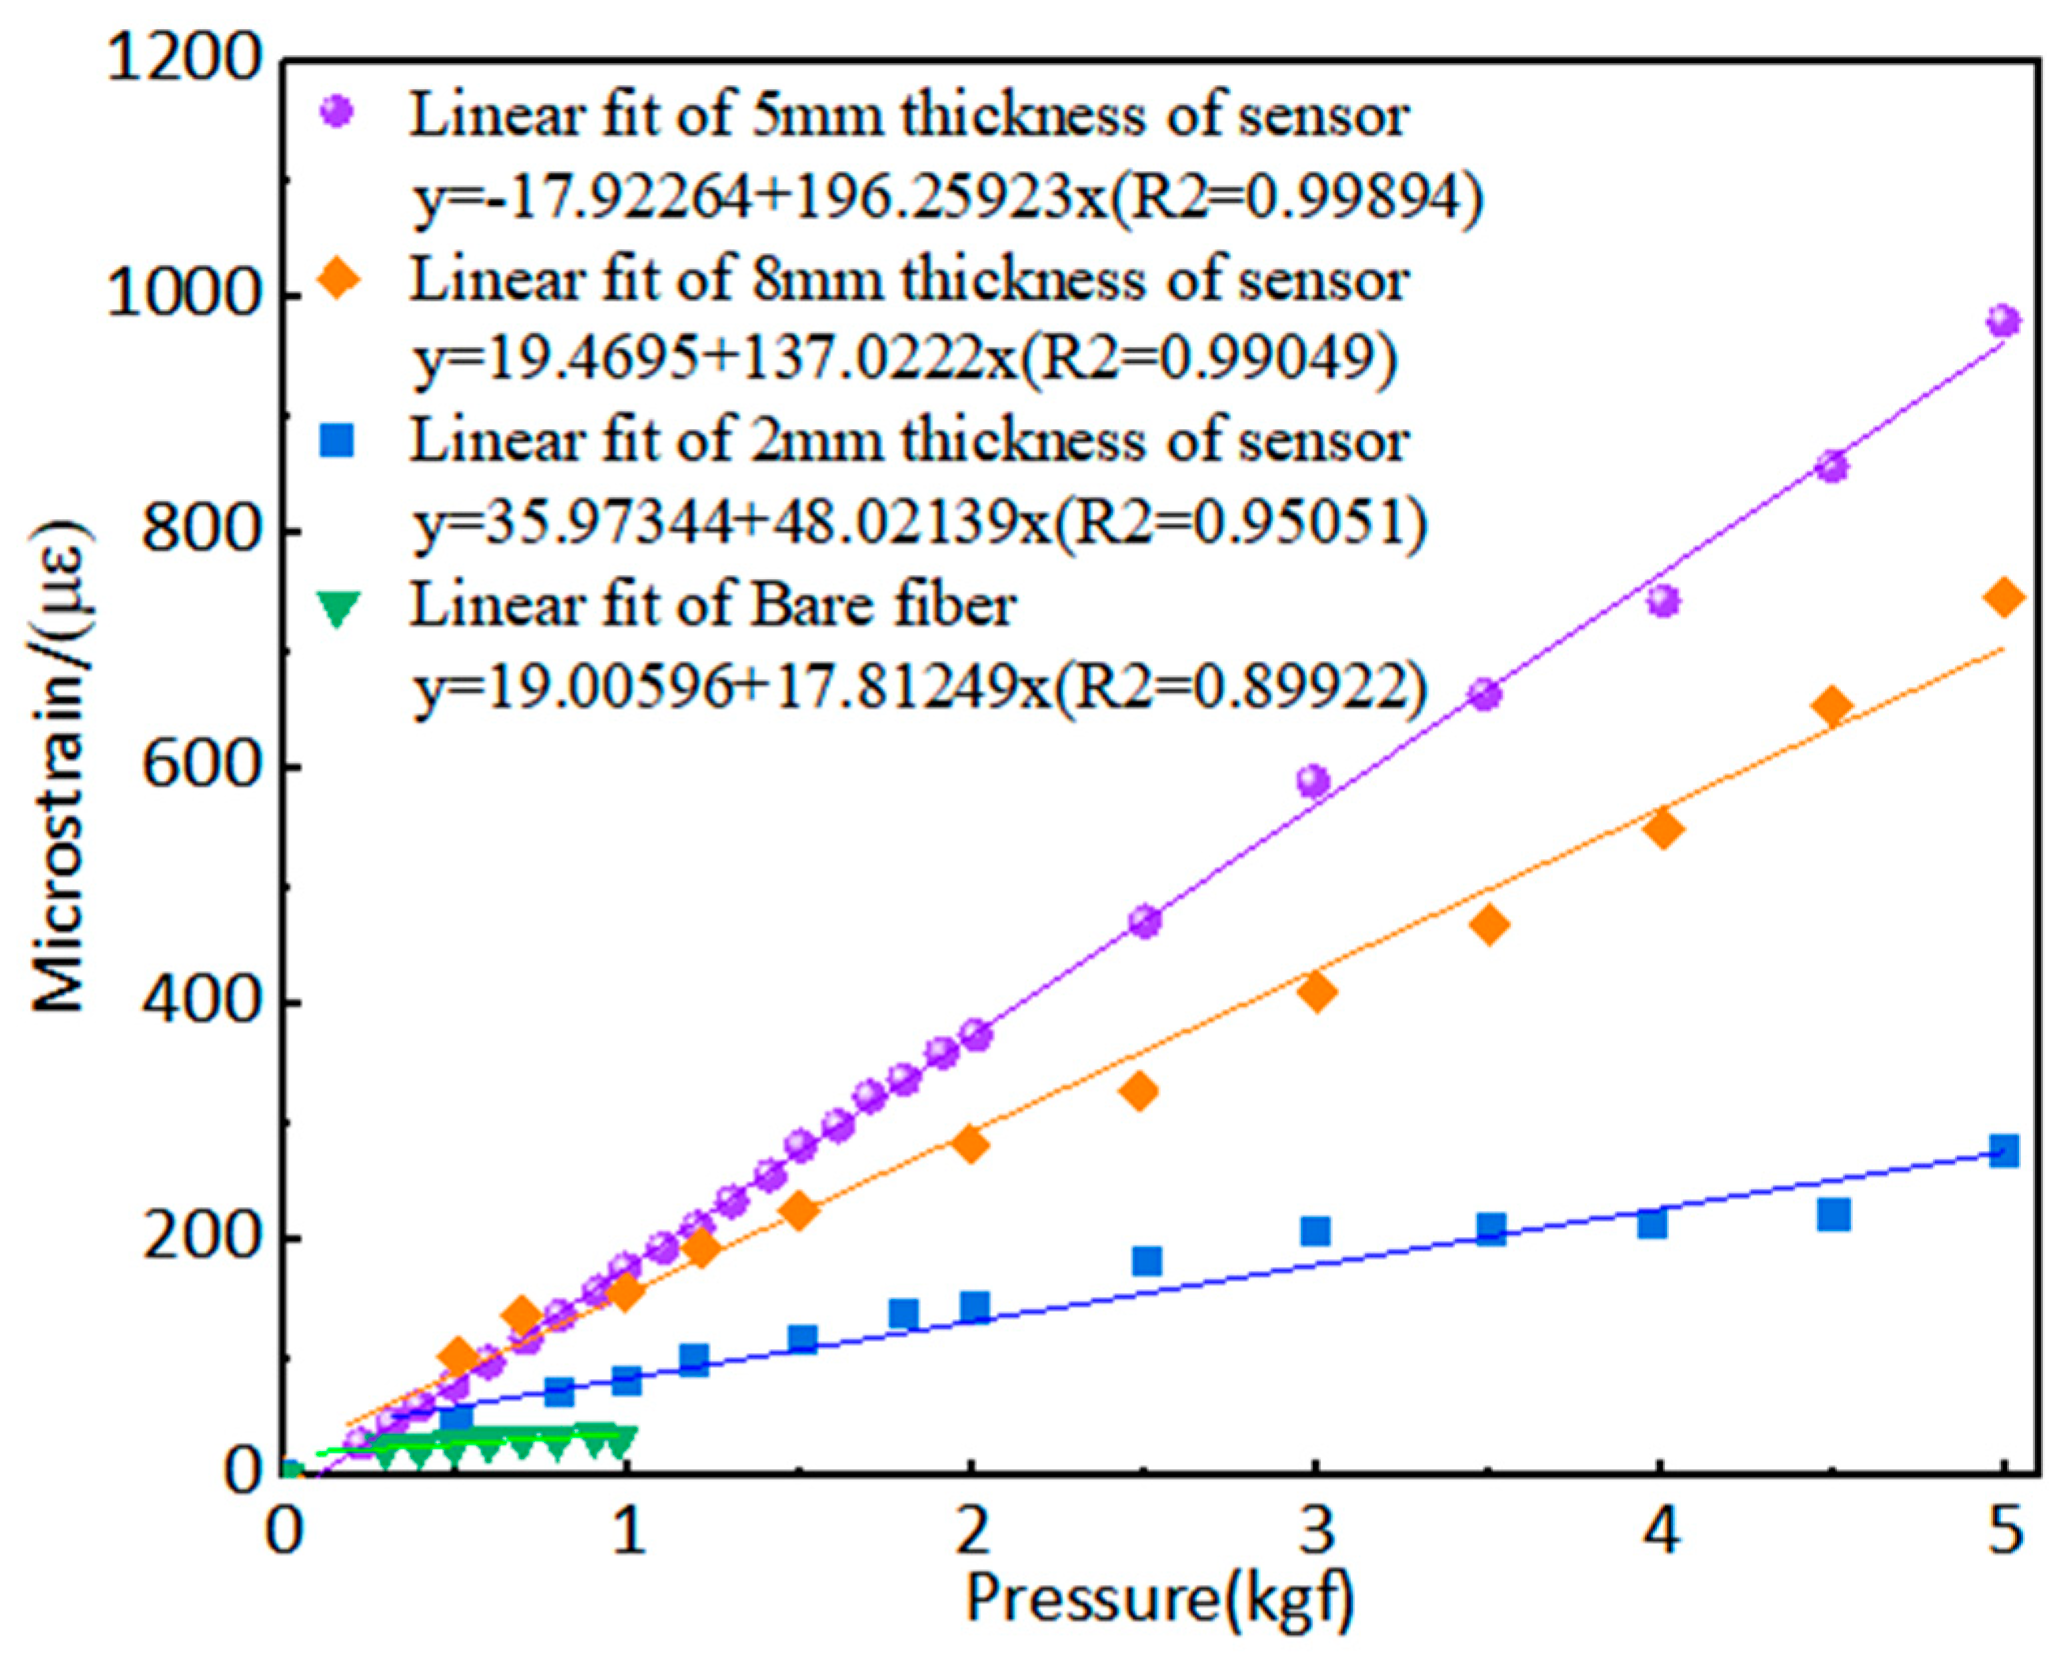
3.1. Effect of Different Thickness of PDMS Substrate on Sensor Sensitivity

In this section, we kept the thickness of the lower substrate film constant and varied the thickness of the upper PDMS film, setting it to bare fiber, 2 mm, 5 mm, and 8 mm. Pressure was applied from 0 N to 50 N using the force platform. By converting between pressure, force, and the force area, the applied pressure range was determined to be 0–276.2 kPa, as shown in Figure 6. The sensitivity of the bare fiber and the 2 mm film was relatively low, with a limited measurement range. During the measurement process, it was difficult to apply pressure directly to the sensitive region of the fiber (the core), resulting in a weaker response to pressure and reduced measurement sensitivity. However, for fibers encapsulated in flexible materials with a thickness greater than 5 mm, the flexible matrix can evenly transmit the external pressure to the fiber. The flexible material has a certain degree of deformability, allowing the sensitive part of the fiber to experience greater deformation, which increases the effective area under pressure and enhances the force transmission efficiency. As a result, the measurement sensitivity is higher, and the measurement range is larger. In contrast, the 5 mm and 8 mm films performed better, with the sensor that used the 5 mm film showing superior linearity and sensitivity. The coefficient of determination of the fitted curve was 0.99894, with a sensitivity of 6.93247 με/kPa; this is 11.53 times more sensitive than the bare fiber.
The figure shows that the linear fit of the bare fiber is approximately fitted as a horizontal line, indicating that the strain of the optical fiber has reached saturation and that the material may not deform further. In contrast, the linear fit of the sensor with a 5 mm thickness exhibits a good linear relationship, demonstrating that the PDMS flexible matrix remained in the elastic stage throughout the loading experiment, without experiencing plastic deformation. To ensure the accuracy of the experiment, multiple repeated tests were conducted at different pressure points for both the bare fiber and the fiber pressure sensor encapsulated in a 5 mm-thick matrix. The overall deviation remained within 3.33%, eliminating the influence of accidental errors. This indicates that the measurement range of the fiber pressure sensor encapsulated in 5 mm thick PDMS is at least five times greater than that of the bare fiber.

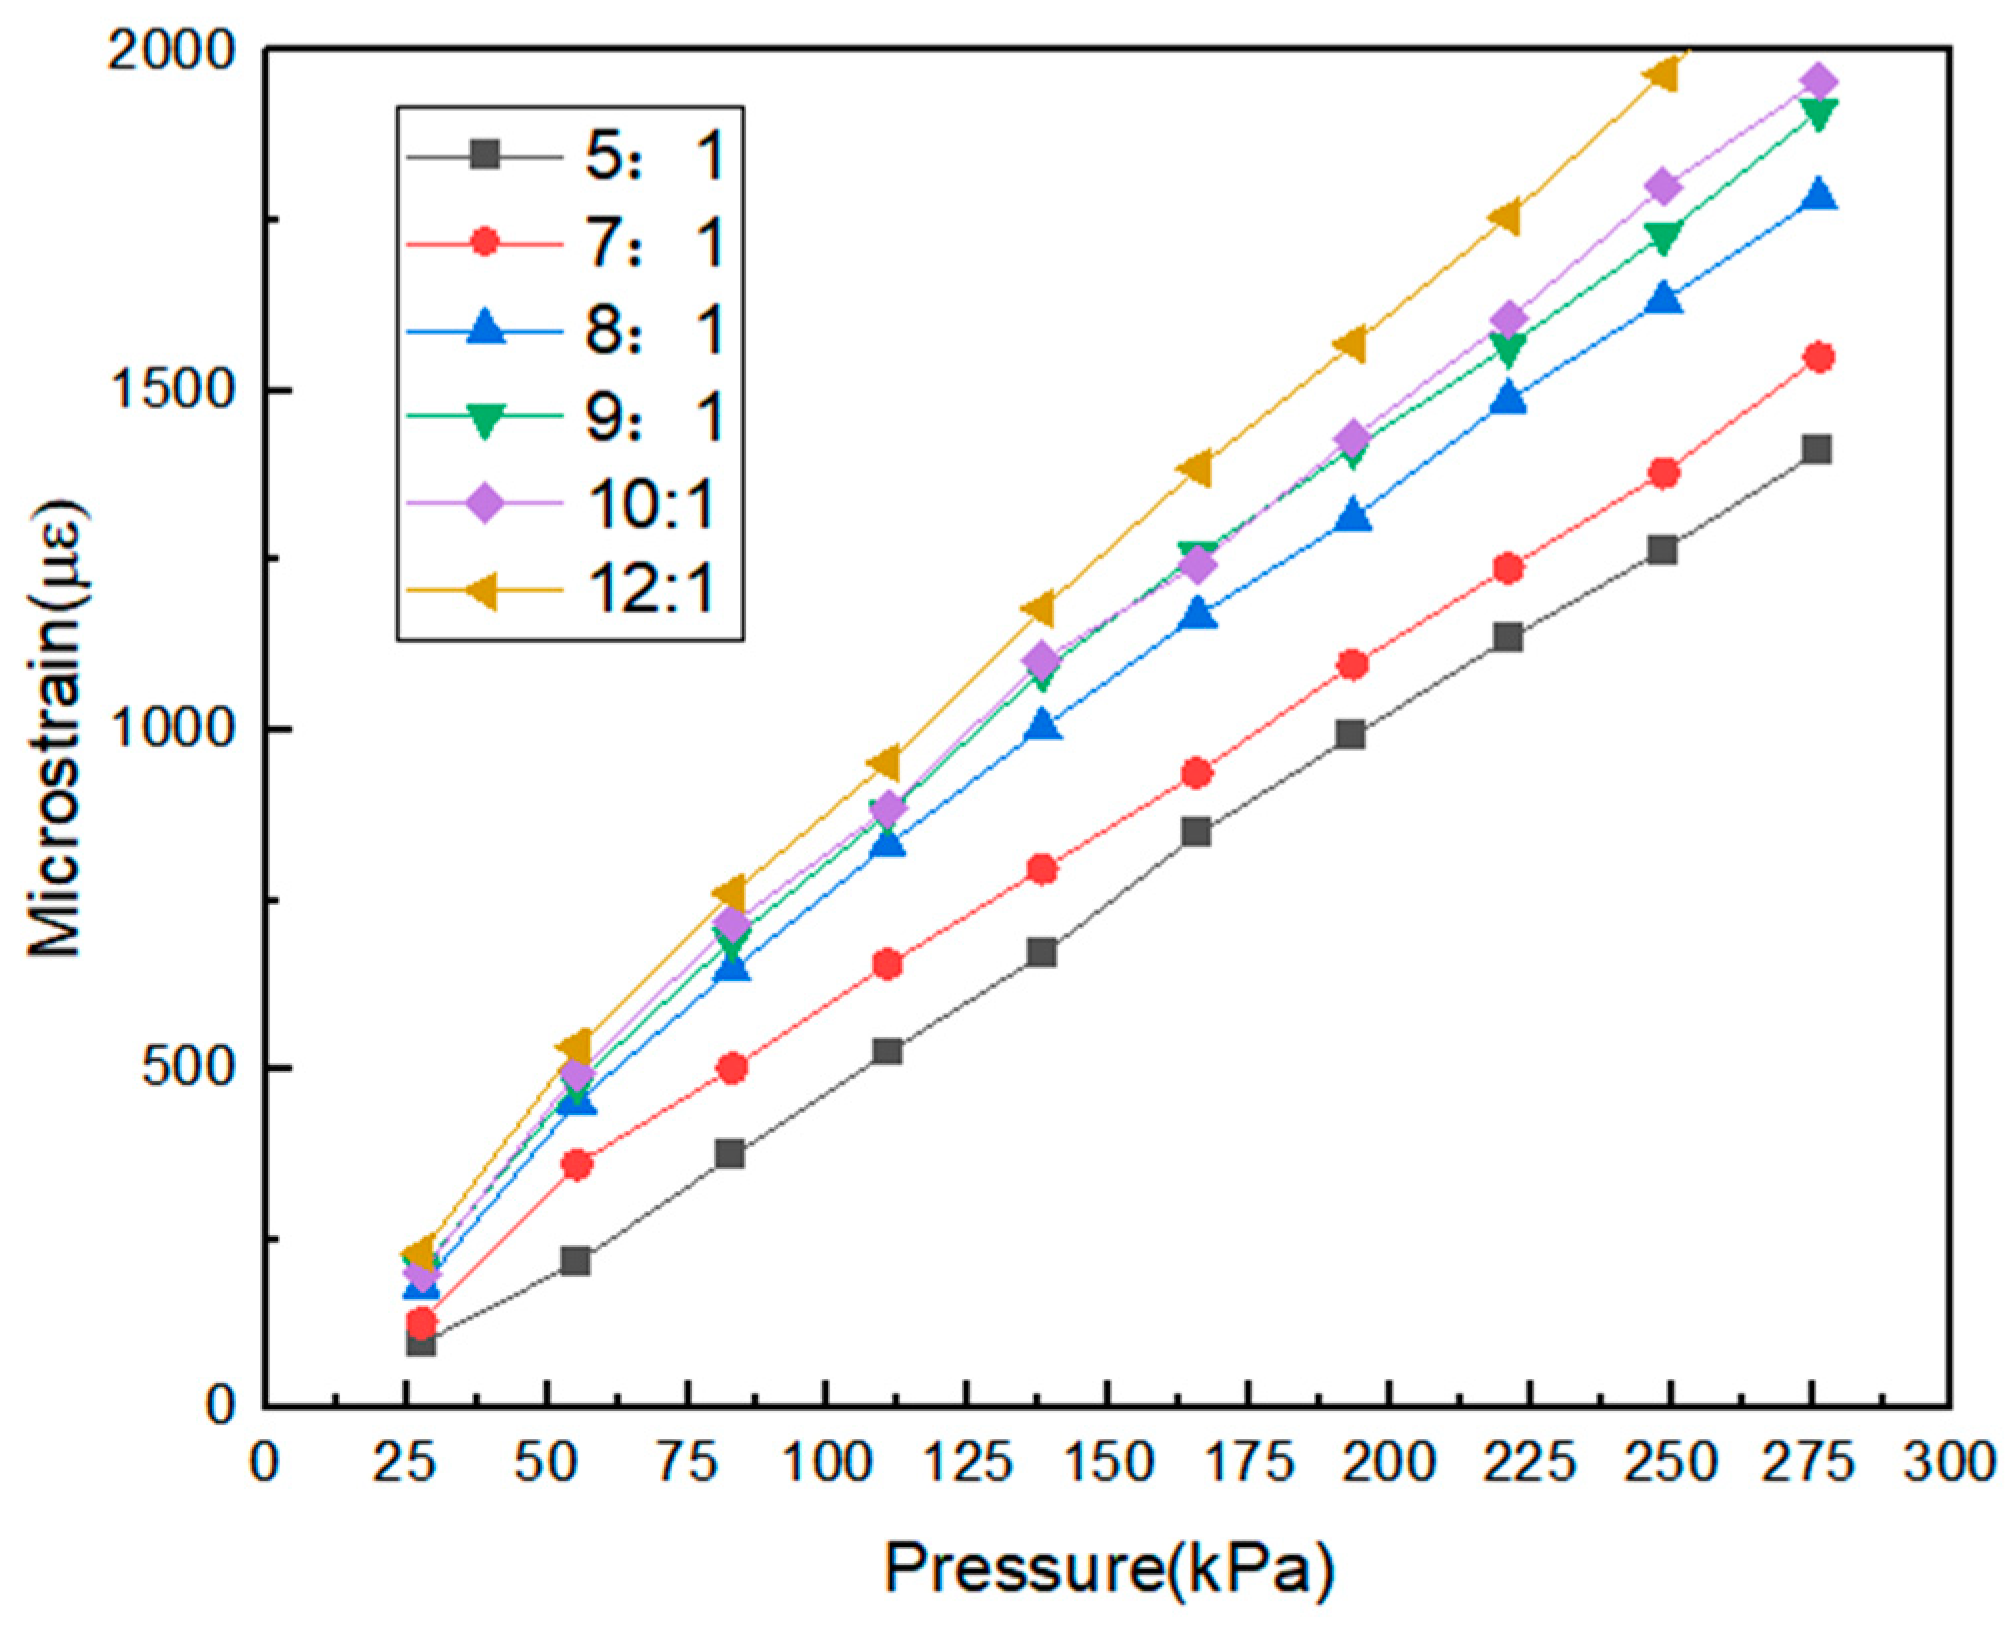
3.2. Effect of Different Ratio of PDMS on Sensor Sensitivity

In this section, we used PDMS substrates with prepolymer/curing agent ratios of 5:1, 7:1, 8:1, 9:1, 10:1, and 12:1 to fabricate sensors. These sensors were used to study the effect of different PDMS ratios on the sensitivity of the sensors. Each sensor has the same dimensions: a width of 15 mm and a thickness of 5 mm. Starting from 0 N, the force was increased in increments of 5 N up to a maximum of 50 N. By converting between pressure, force, and the force area, the applied pressure range was determined to be 0–276.2 kPa, with a step size of 27.6 kPa. The test results were recorded and plotted to show the relationship between the strain and pressure for sensors with different PDMS ratio structures, as shown in Figure 7.
It can be observed that there is a strong linear relationship between the fiber strain and pressure for the fiber optic pressure sensors encapsulated using five different PDMS ratios. This indicates that the PDMS matrix remained in the elastic stage without undergoing plastic deformation during the loading test. The data points were fitted, and the slope of the fitted line was used to determine the sensitivity. The sensitivities of the fiber optic pressure sensors with PDMS ratios of 5:1, 7:1, 8:1, 9:1, 10:1, and 12:1, for a pressure range of 0 to 276.2 kPa, were found to be 5.04949 με/kPa, 5.50161 με/kPa, 6.25059 με/kPa, 6.8361 με/kPa, 6.93247 με/kPa, and 7.58062 με/kPa, respectively. The results show that the higher the PDMS ratio, the more sensitive the sensor is to pressure. However, the strain in the measurement data for the sensor with a 12:1 ratio exceeded 2000 microstrains, which is beyond the effective measurement range of the device. This ratio is more suitable for measuring small deformations. The other ratios are suitable for measuring larger forces within the test pressure range. Therefore, a PDMS ratio of 10:1, offering higher sensitivity, was selected as the encapsulating material for the fiber optic pressure sensor.

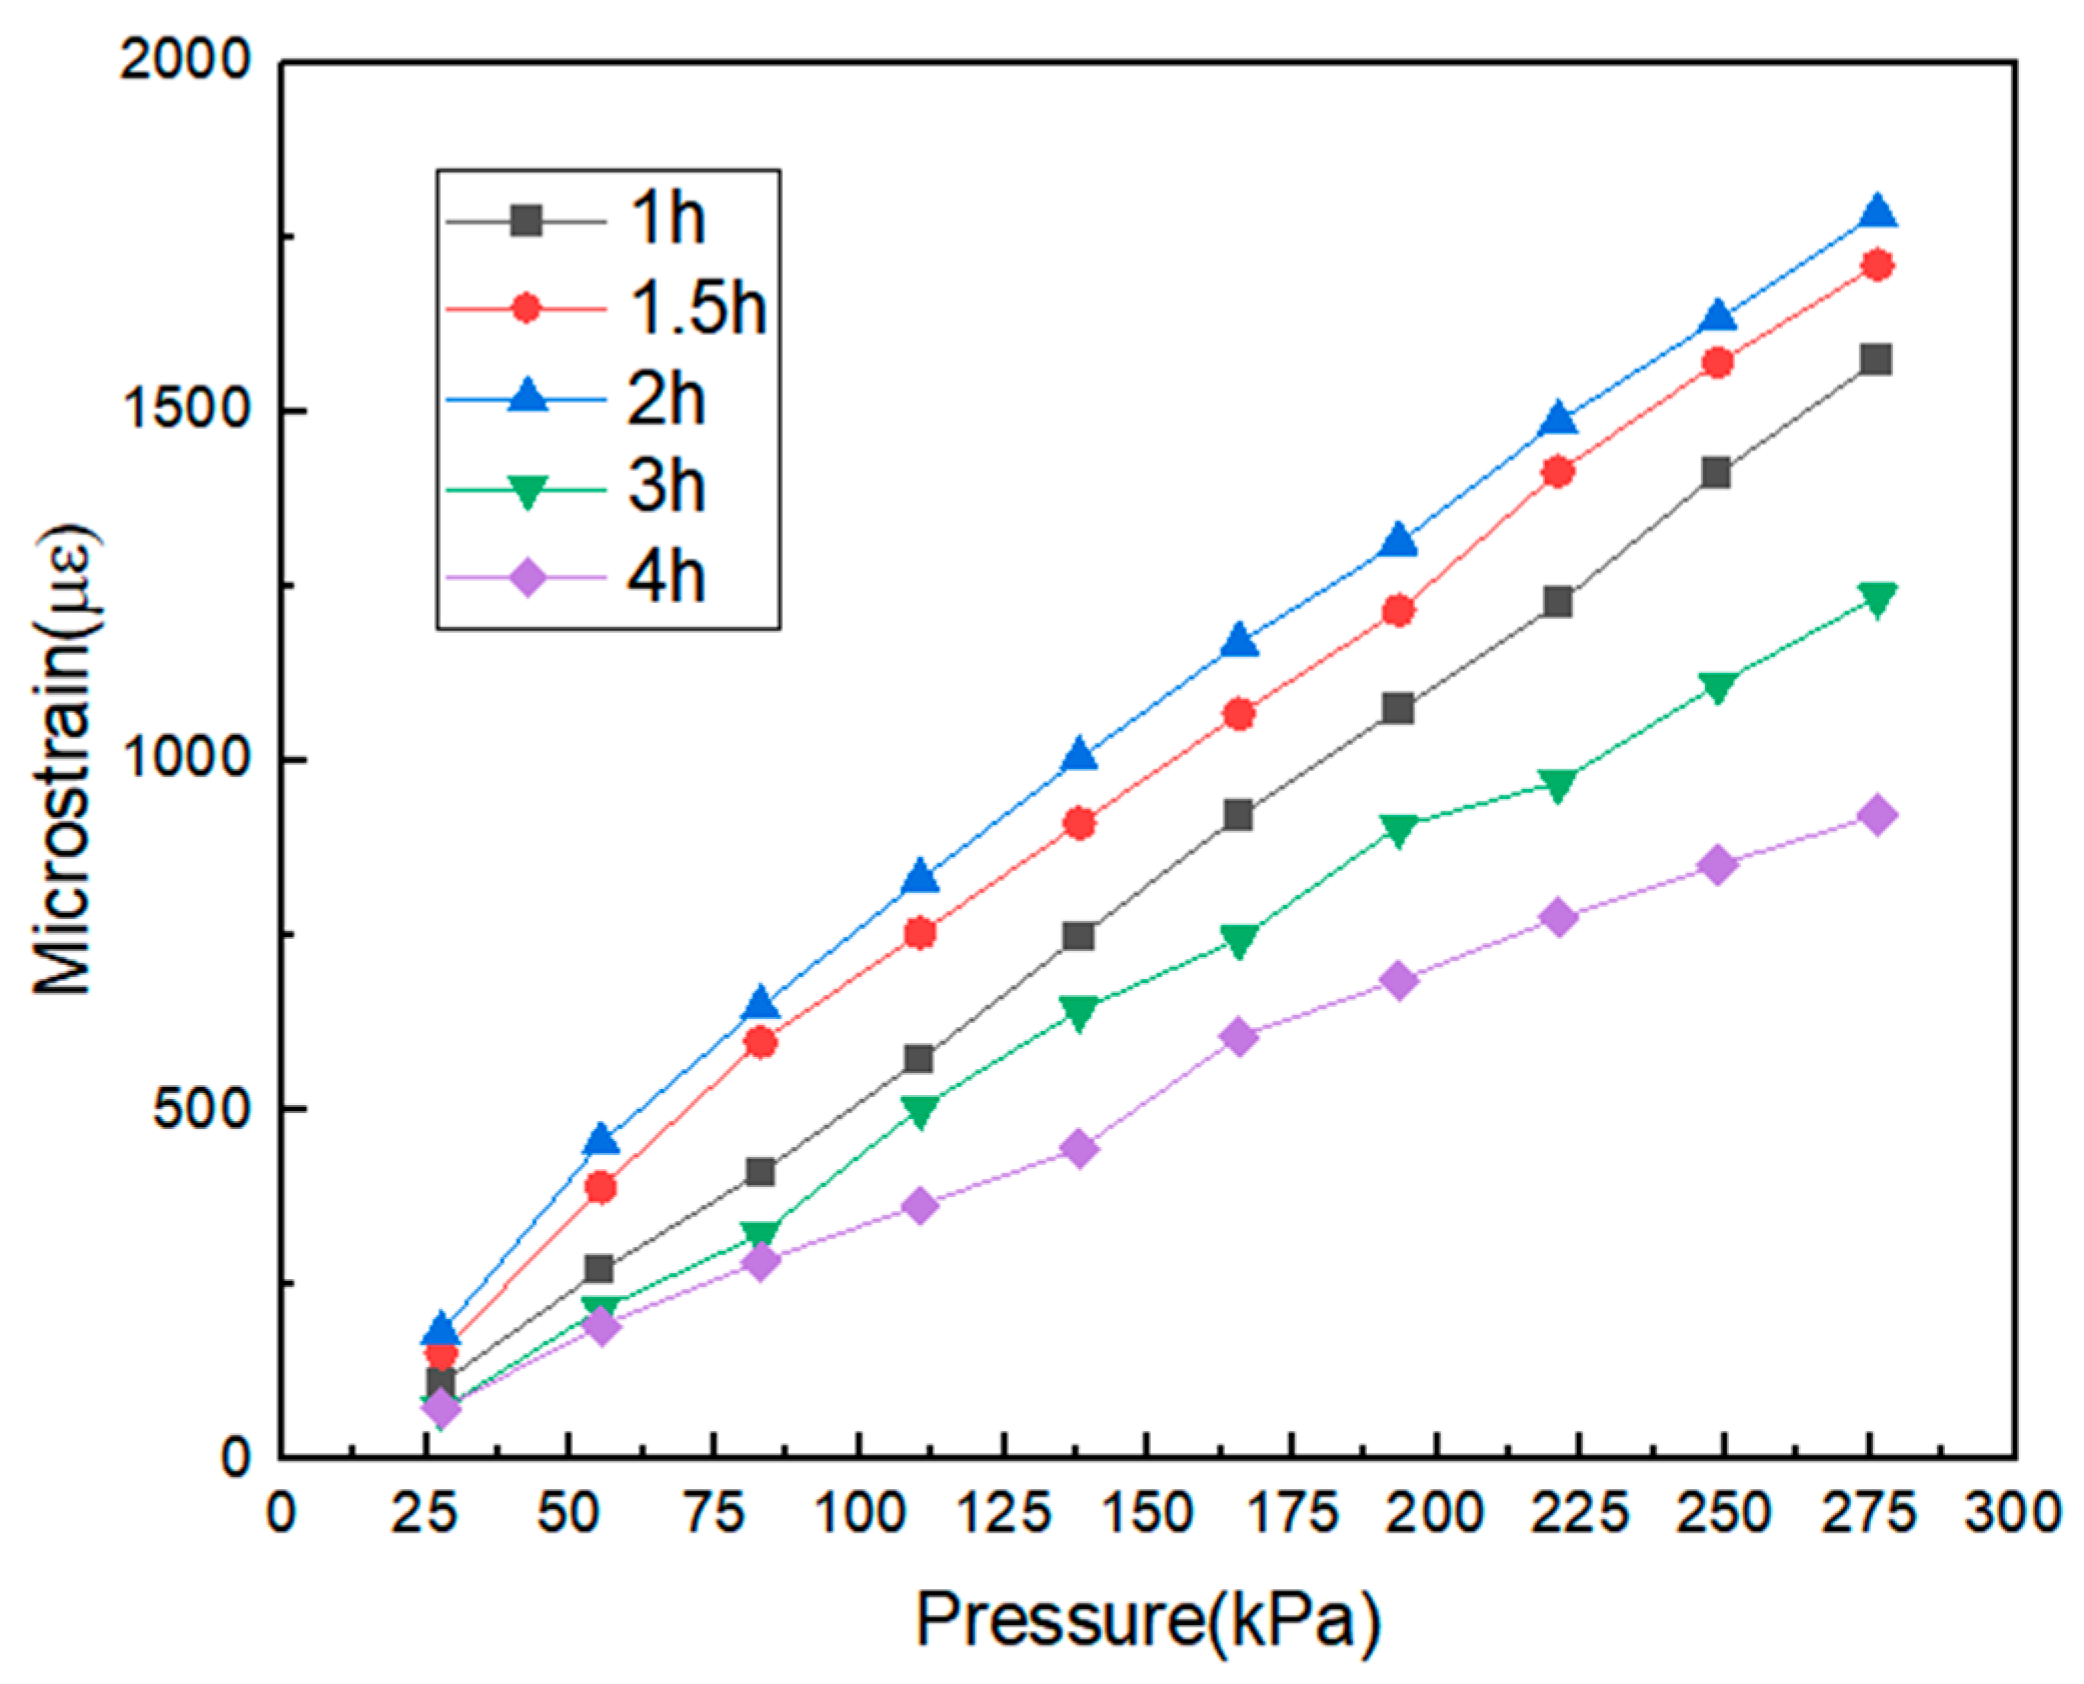
3.3. Effect of Different Curing Time on Sensor Sensitivity

Sensors encapsulated with PDMS substrates and cured for different durations were tested to observe how the curing time affects sensor sensitivity. A PDMS substrate with a 10:1 ratio was selected. Starting from 0 N and increasing in increments of 5 N, a load of up to 50 N was applied. By converting between pressure, force, and force area, the applied pressure range was determined to be 0–276.2 kPa, with a pressurization step of 27.6 kPa. The test results were recorded, allowing the relationship between the sensor strain and pressure for different PDMS curing times to be plotted, as shown in Figure 8.
The fiber strain and pressure of the five fiber optic pressure sensors encapsulated using PDMS and cured for different durations show a strong linear relationship, indicating that the PDMS matrix remained in the elastic stage without undergoing plastic deformation during the loading test. The data points were fitted, and the slope of the fitted line represents sensitivity. The sensitivities of the fiber optic pressure sensors with curing times of 1.0 h, 1.5 h, 2.0 h, 3.0 h, and 4.0 h, for a pressure range of 0 to 276.2 kPa, were found to be 5.90514 με/kPa, 6.12645 με/kPa, 6.93427 με/kPa, 4.66998 με/kPa, and 3.48014 με/kPa, respectively. The results show that the sensor has the highest sensitivity when the curing time is 2 h. The PDMS matrices cured for more than 3 h have a greater hardness and reduced elasticity, leading to lower sensor sensitivity. Conversely, the PDMS matrices cured for less than 1.5 h are incompletely cured, resulting in a relatively low sensor sensitivity. Therefore, a PDMS matrix with a curing time of 2 h offers optimal flexibility and a higher sensitivity for pressure measurements.

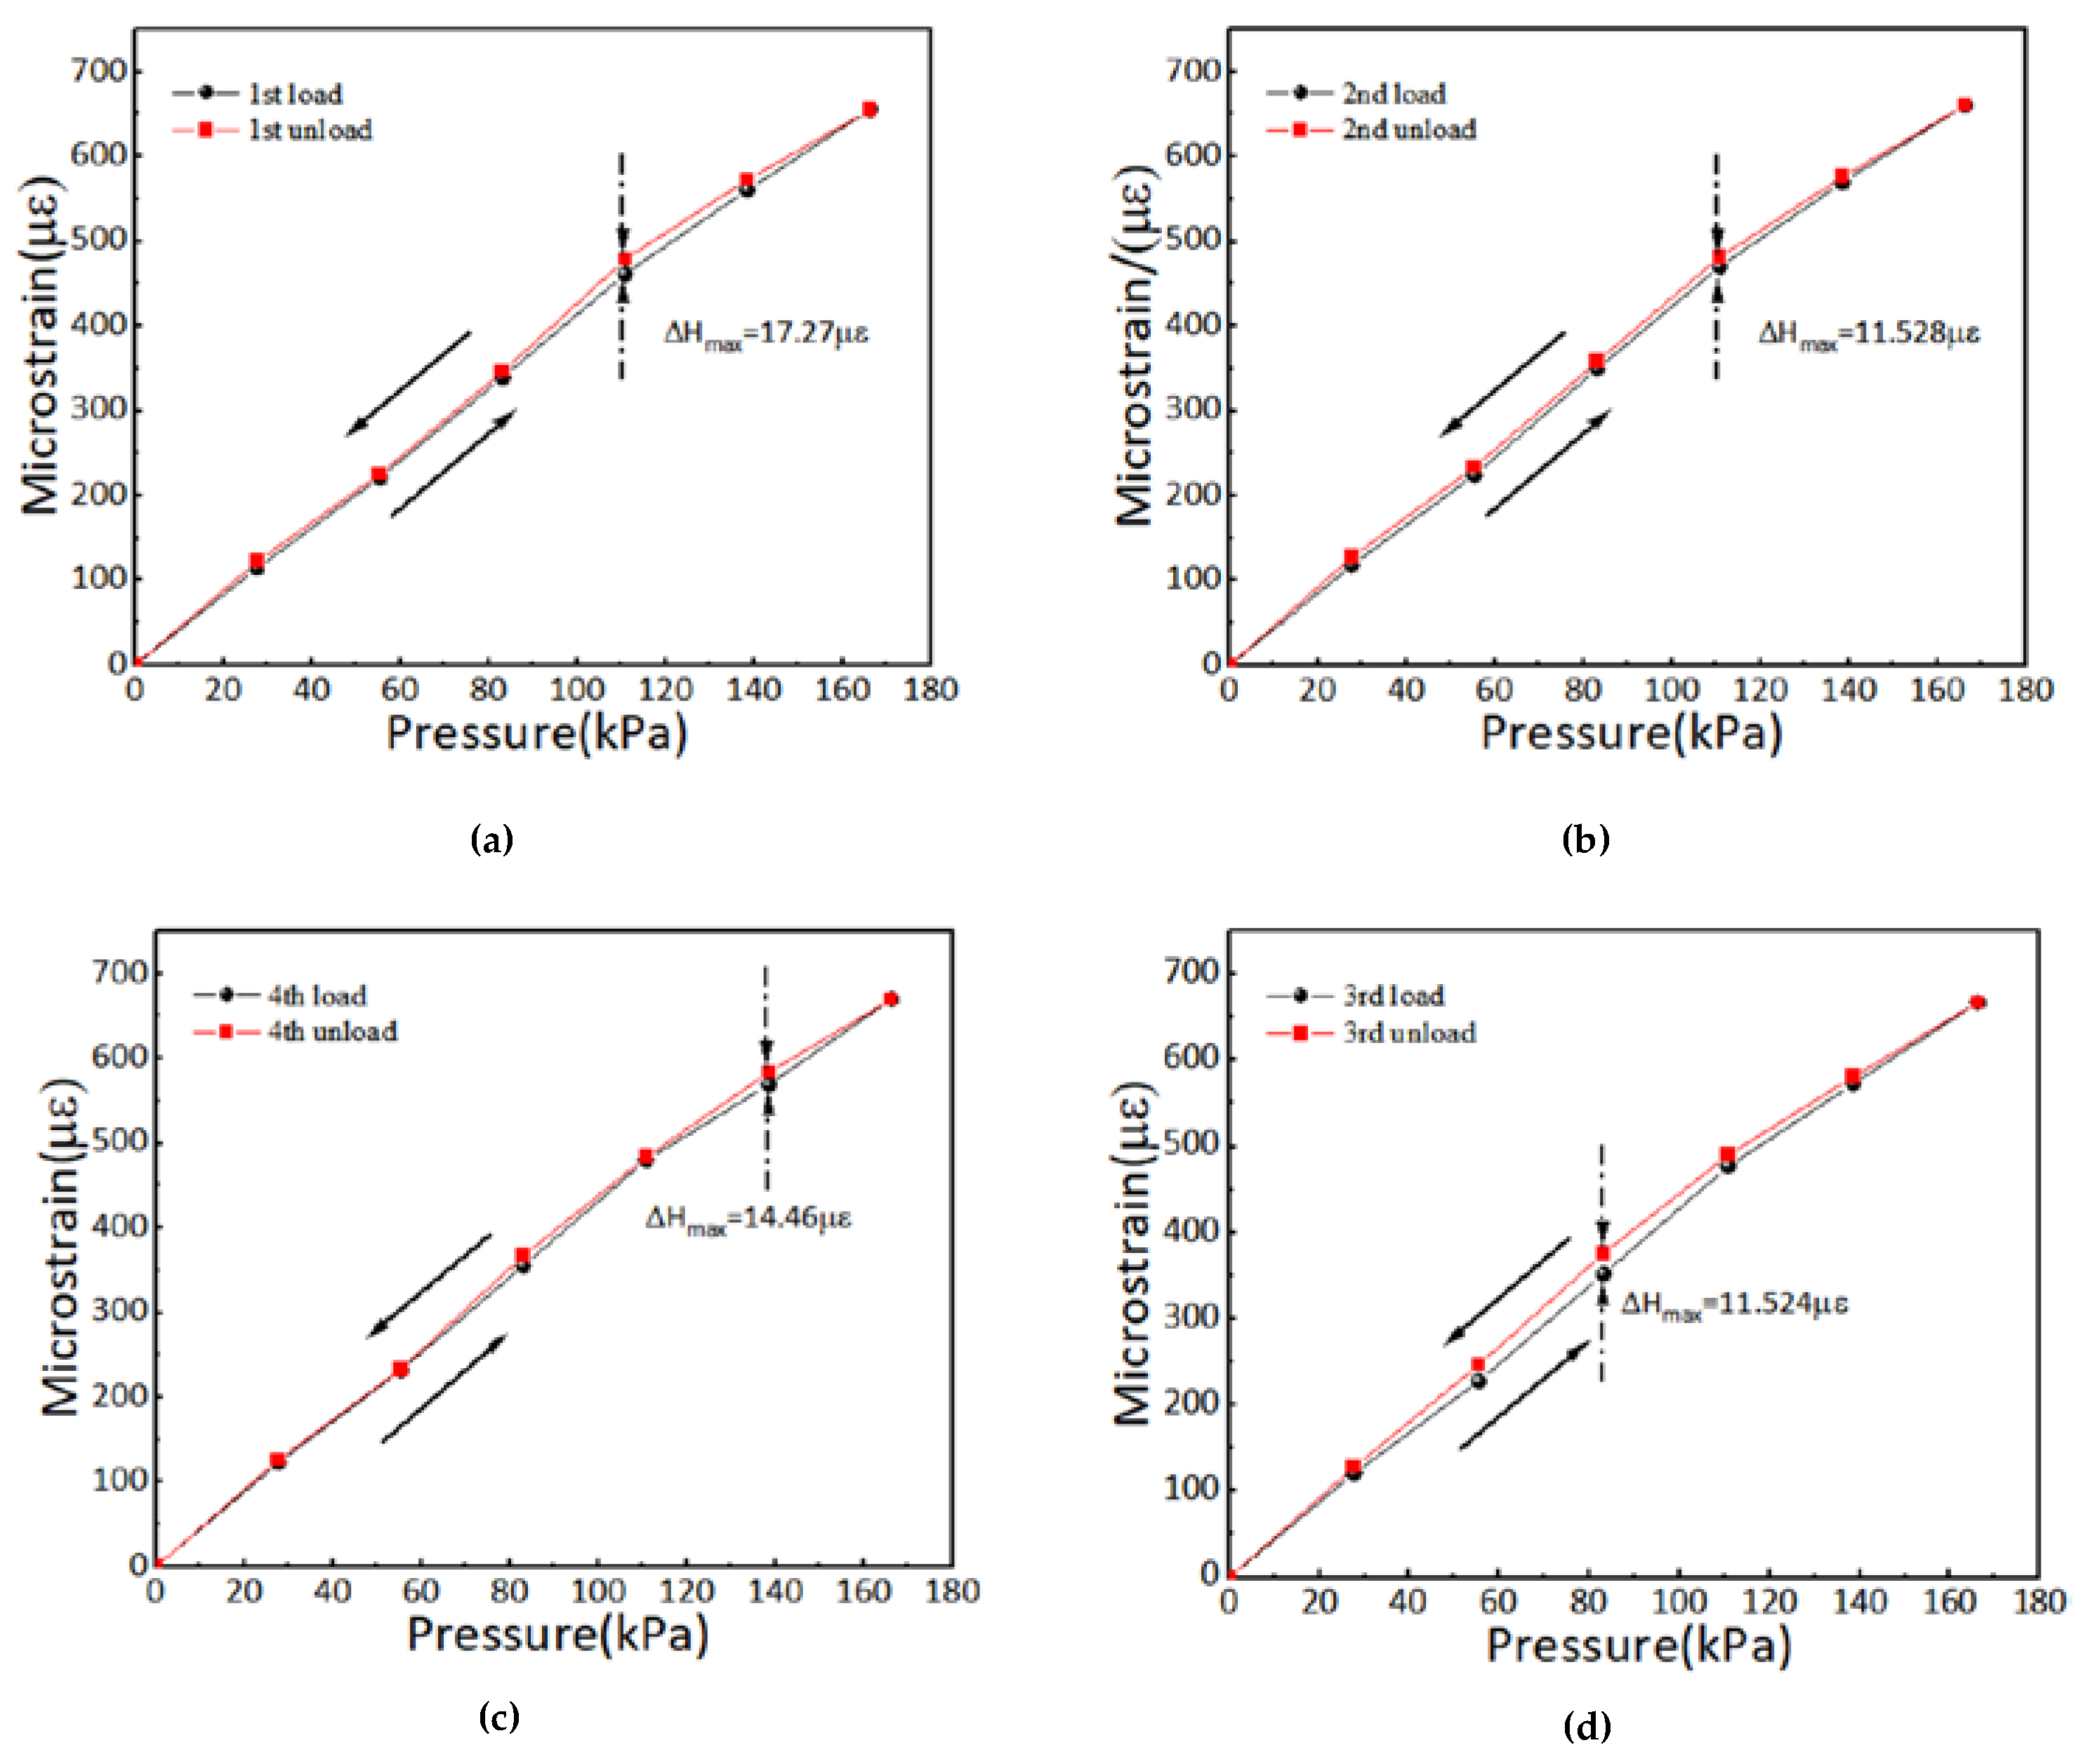
3.4. Reepeatability and Hysteresis of Flexible Fiber Optic Pressure Sensors

The flexible fiber optic pressure sensor was tested using a force application platform. Starting from 0 N, the load was increased by 5 N each time, with a total of six increments; this was followed by unloading using the same steps. The corresponding pressure ranged from 0 to 166.2 kPa, with a step size of 27.7 kPa. Four loading and unloading experiments were conducted, and the results are shown in Figure 9. The fiber microstrain exhibited a linear increase with a change in pressure, demonstrating the good repeatability of the measurements.
Due to the viscoelastic nature of flexible materials, a flexible pressure sensor exhibits different material states during loading (forward stroke) and unloading (reverse stroke). As a result, the output values during the ascent and descent phases for the same input value can differ. This phenomenon is known as hysteresis. The extent of hysteresis is quantified using the largest hysteresis value, which is calculated as follows:
δ R = ± Δ H m a x / Y × 100 %
where δ R is the hysteresis value of the sensor; Δ H m a x is the maximum deviation value between the forward and reverse travel outputs of the sensor; and Y is the full-scale output.
Figure 10 shows the strain versus pressure graph for each of the four loading and unloading processes, plotted separately as hysteresis curves for the pressure sensor.
From Figure 10, it can be observed that in the four cyclic tests, there is a maximum deviation value, Δ H m a x , between the forward and reverse stroke outputs of the sensor, and this value varies in each cycle. The possible reasons for this are as follows: (1) As a flexible material, PDMS may exhibit nonlinear elasticity under strain conditions, meaning that its ability to recover after strain may not be consistent at different pressure levels. This nonlinear elasticity may cause deviations during the loading and unloading process. (2) In the loading/unloading cyclic test, the PDMS material may show hysteresis, meaning that the unloading path does not completely overlap with the loading path, leading to deviations between the two. This hysteresis is related to the internal friction and viscoelasticity of the material. (3) After each loading in the experiment, residual stress may develop in the fiber optic sensor encapsulated in PDMS, especially at higher pressure levels; this causes the initial strain value to change in each cycle, which results in deviations. The hysteresis values for the four forward and reverse strokes are 2.64%, 1.74%, 1.73%, and 2.16%, respectively. The first stroke has the largest hysteresis, which is due to the presence of residual stresses in the pressure sensor’s flexible substrate during the calibration process. When pressure is applied and then reduced, the substrate takes time to return to its original state, causing the measured fiber optic strain during unloading to be slightly larger than that during loading.
Therefore, when using colloidal PDMS material for the sensitized encapsulation of ordinary single-mode optical fibers, ensuring the uniform adhesion of the cured PDMS to the fibers is challenging; this results in the generation of small air bubbles that cannot be removed and cause experimental errors. Additionally, the freshly prepared flexible fiber optic pressure sensor is initially soft and slightly sticky on the surface. It needs to be aged to improve its strength and elasticity, achieving a more stable state.

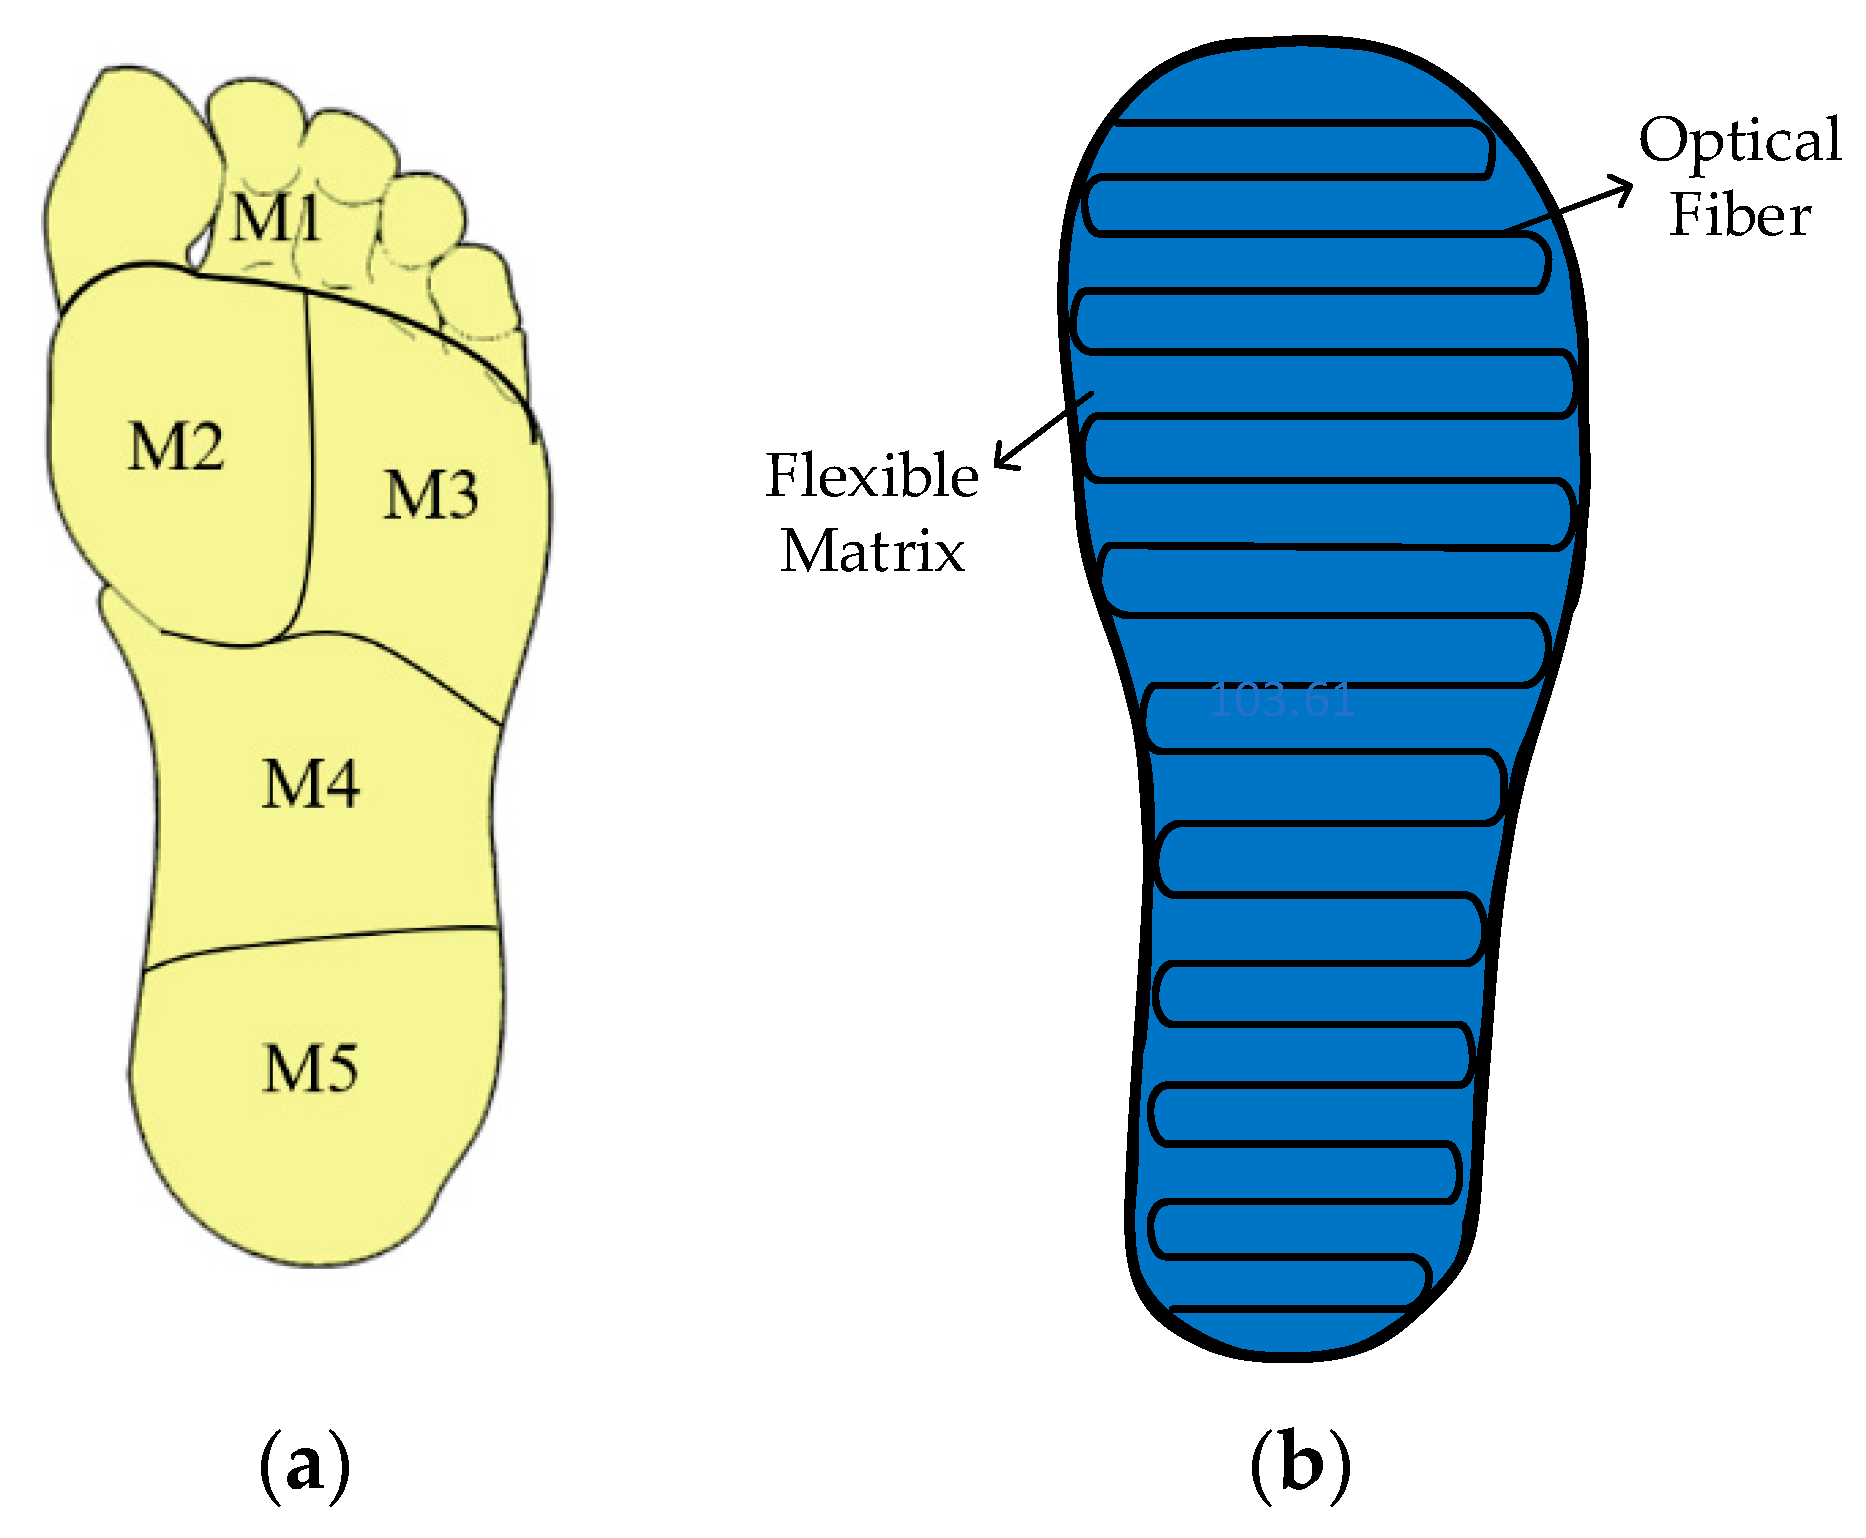
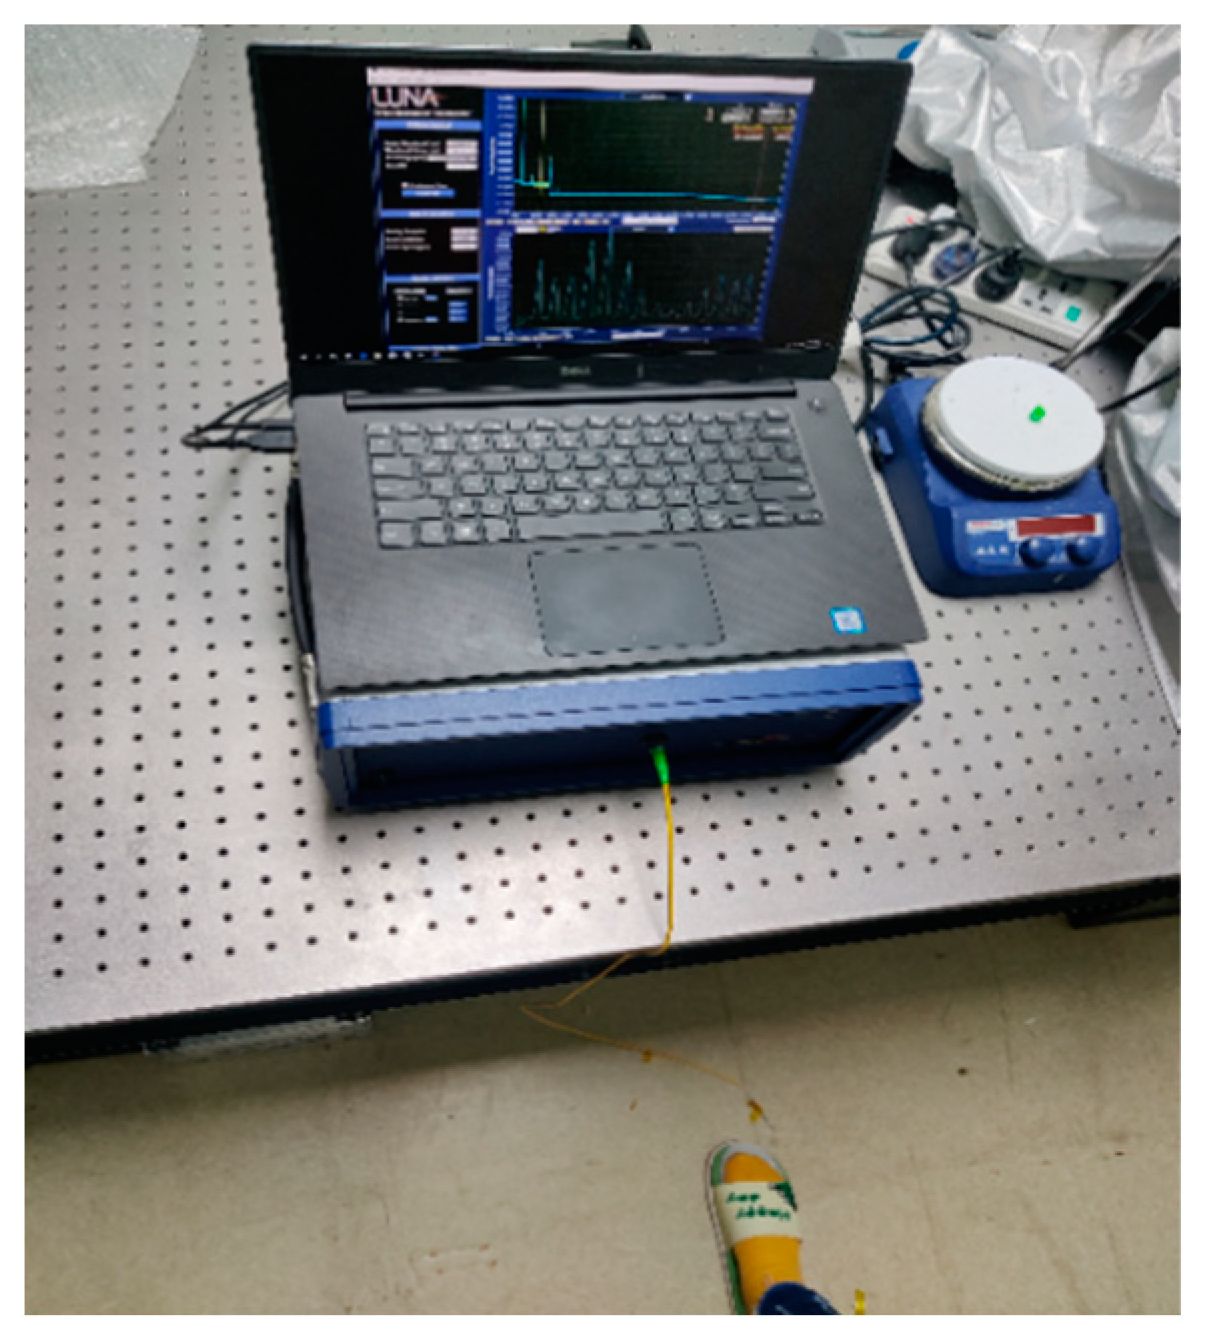
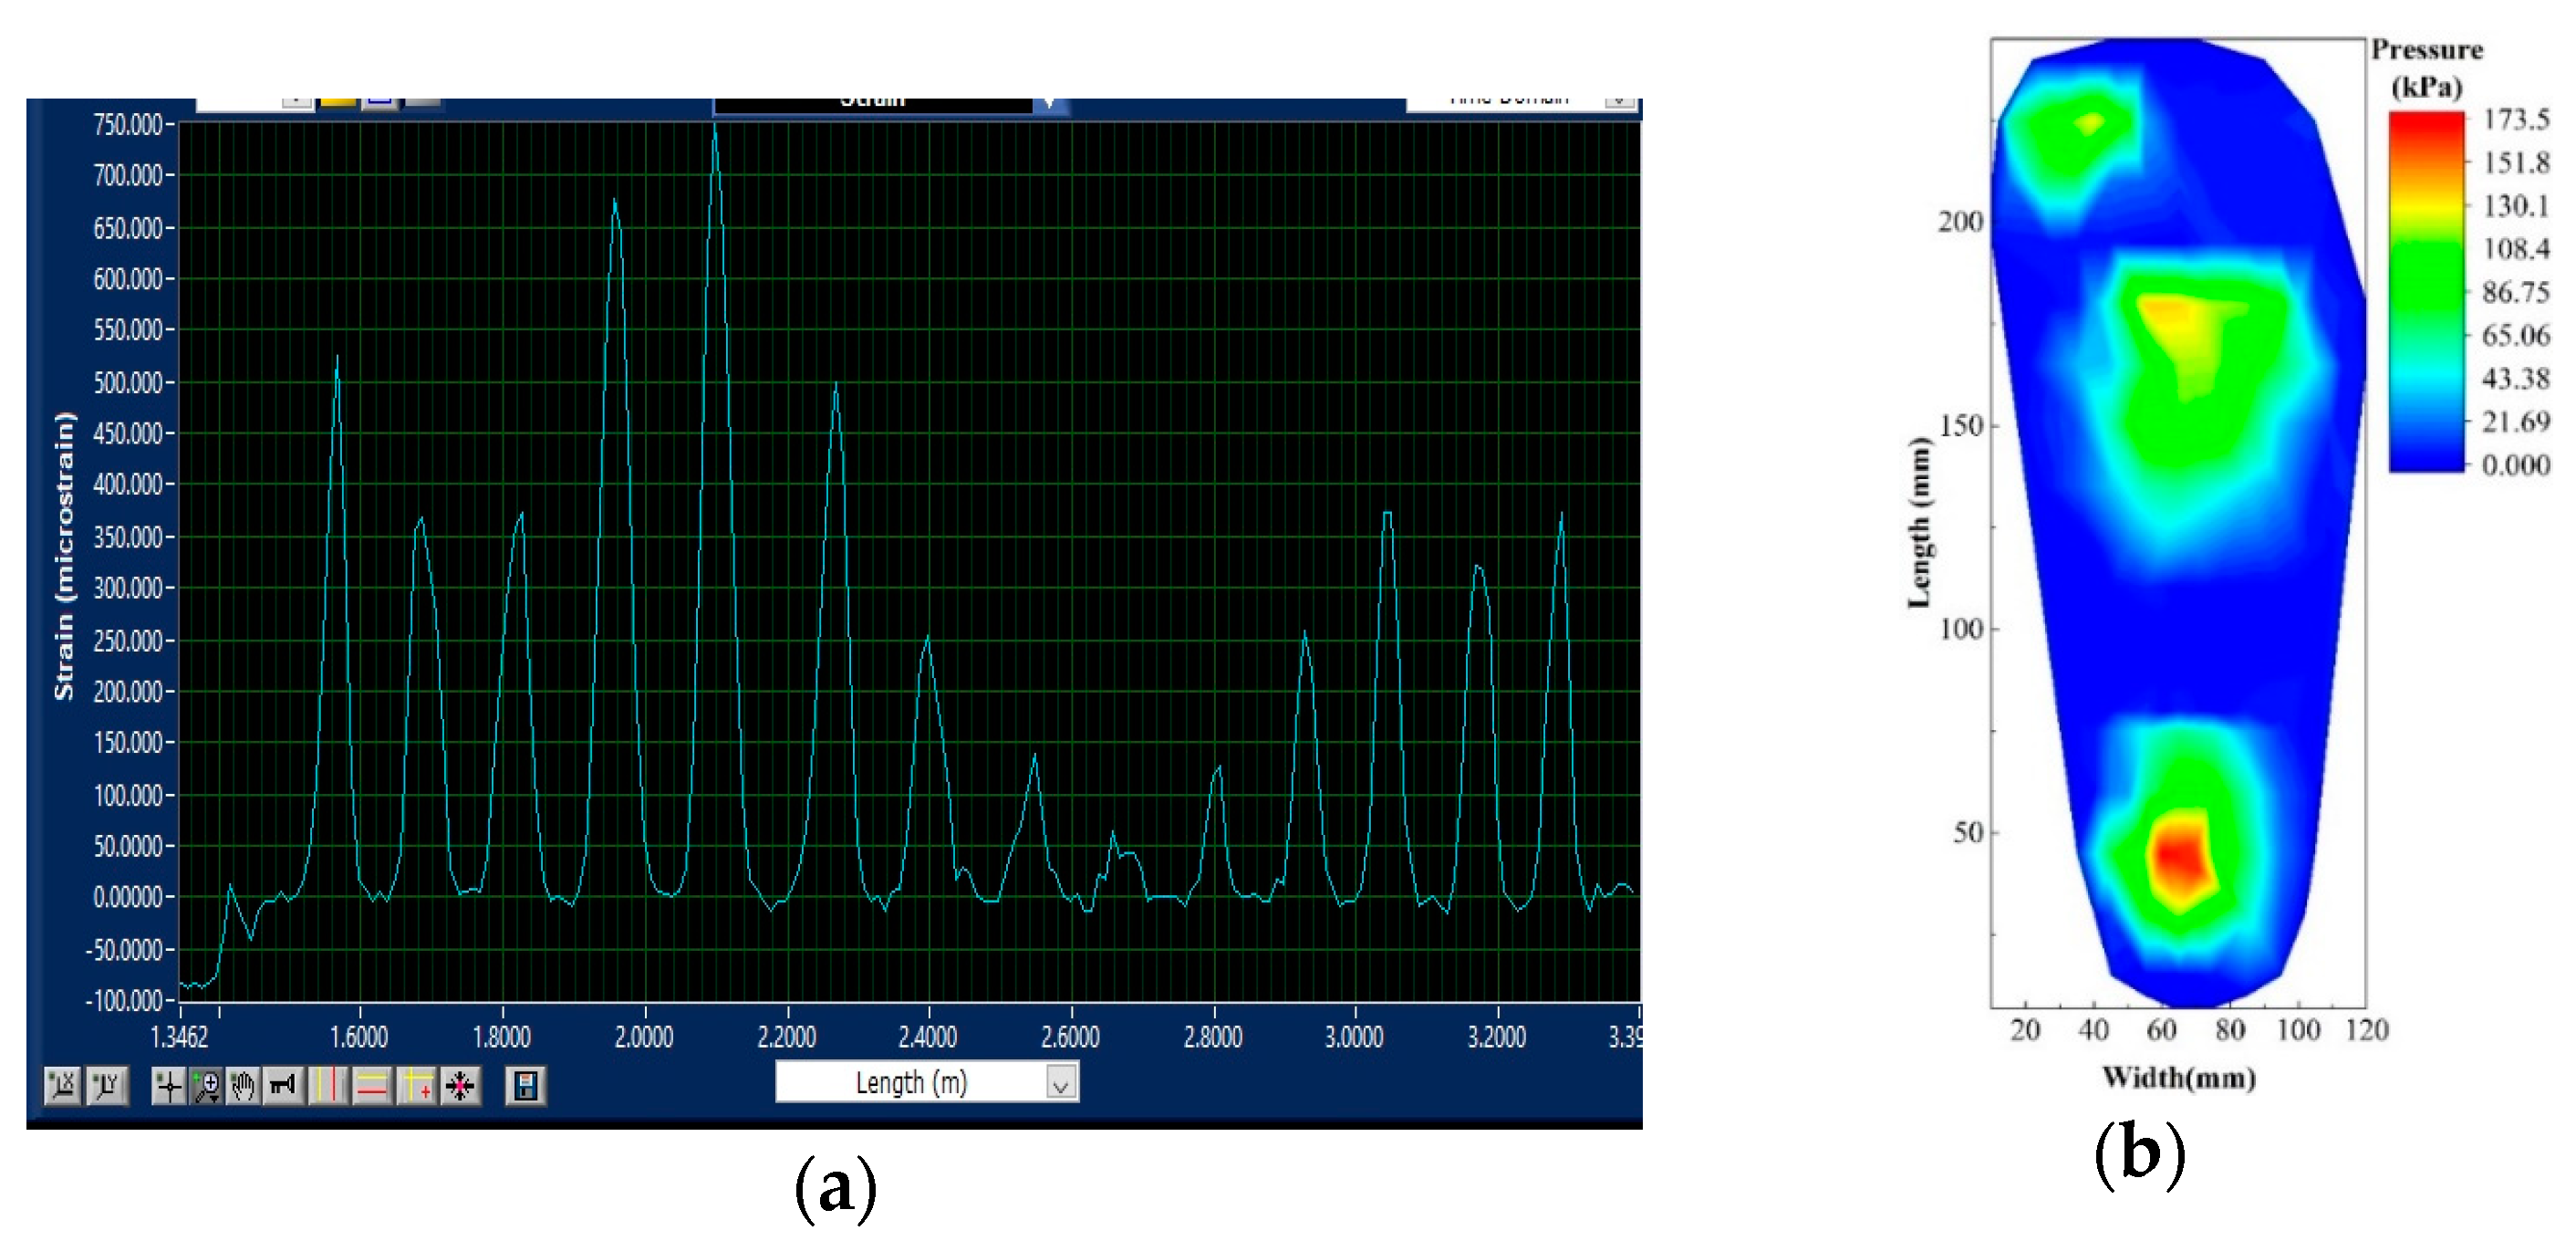
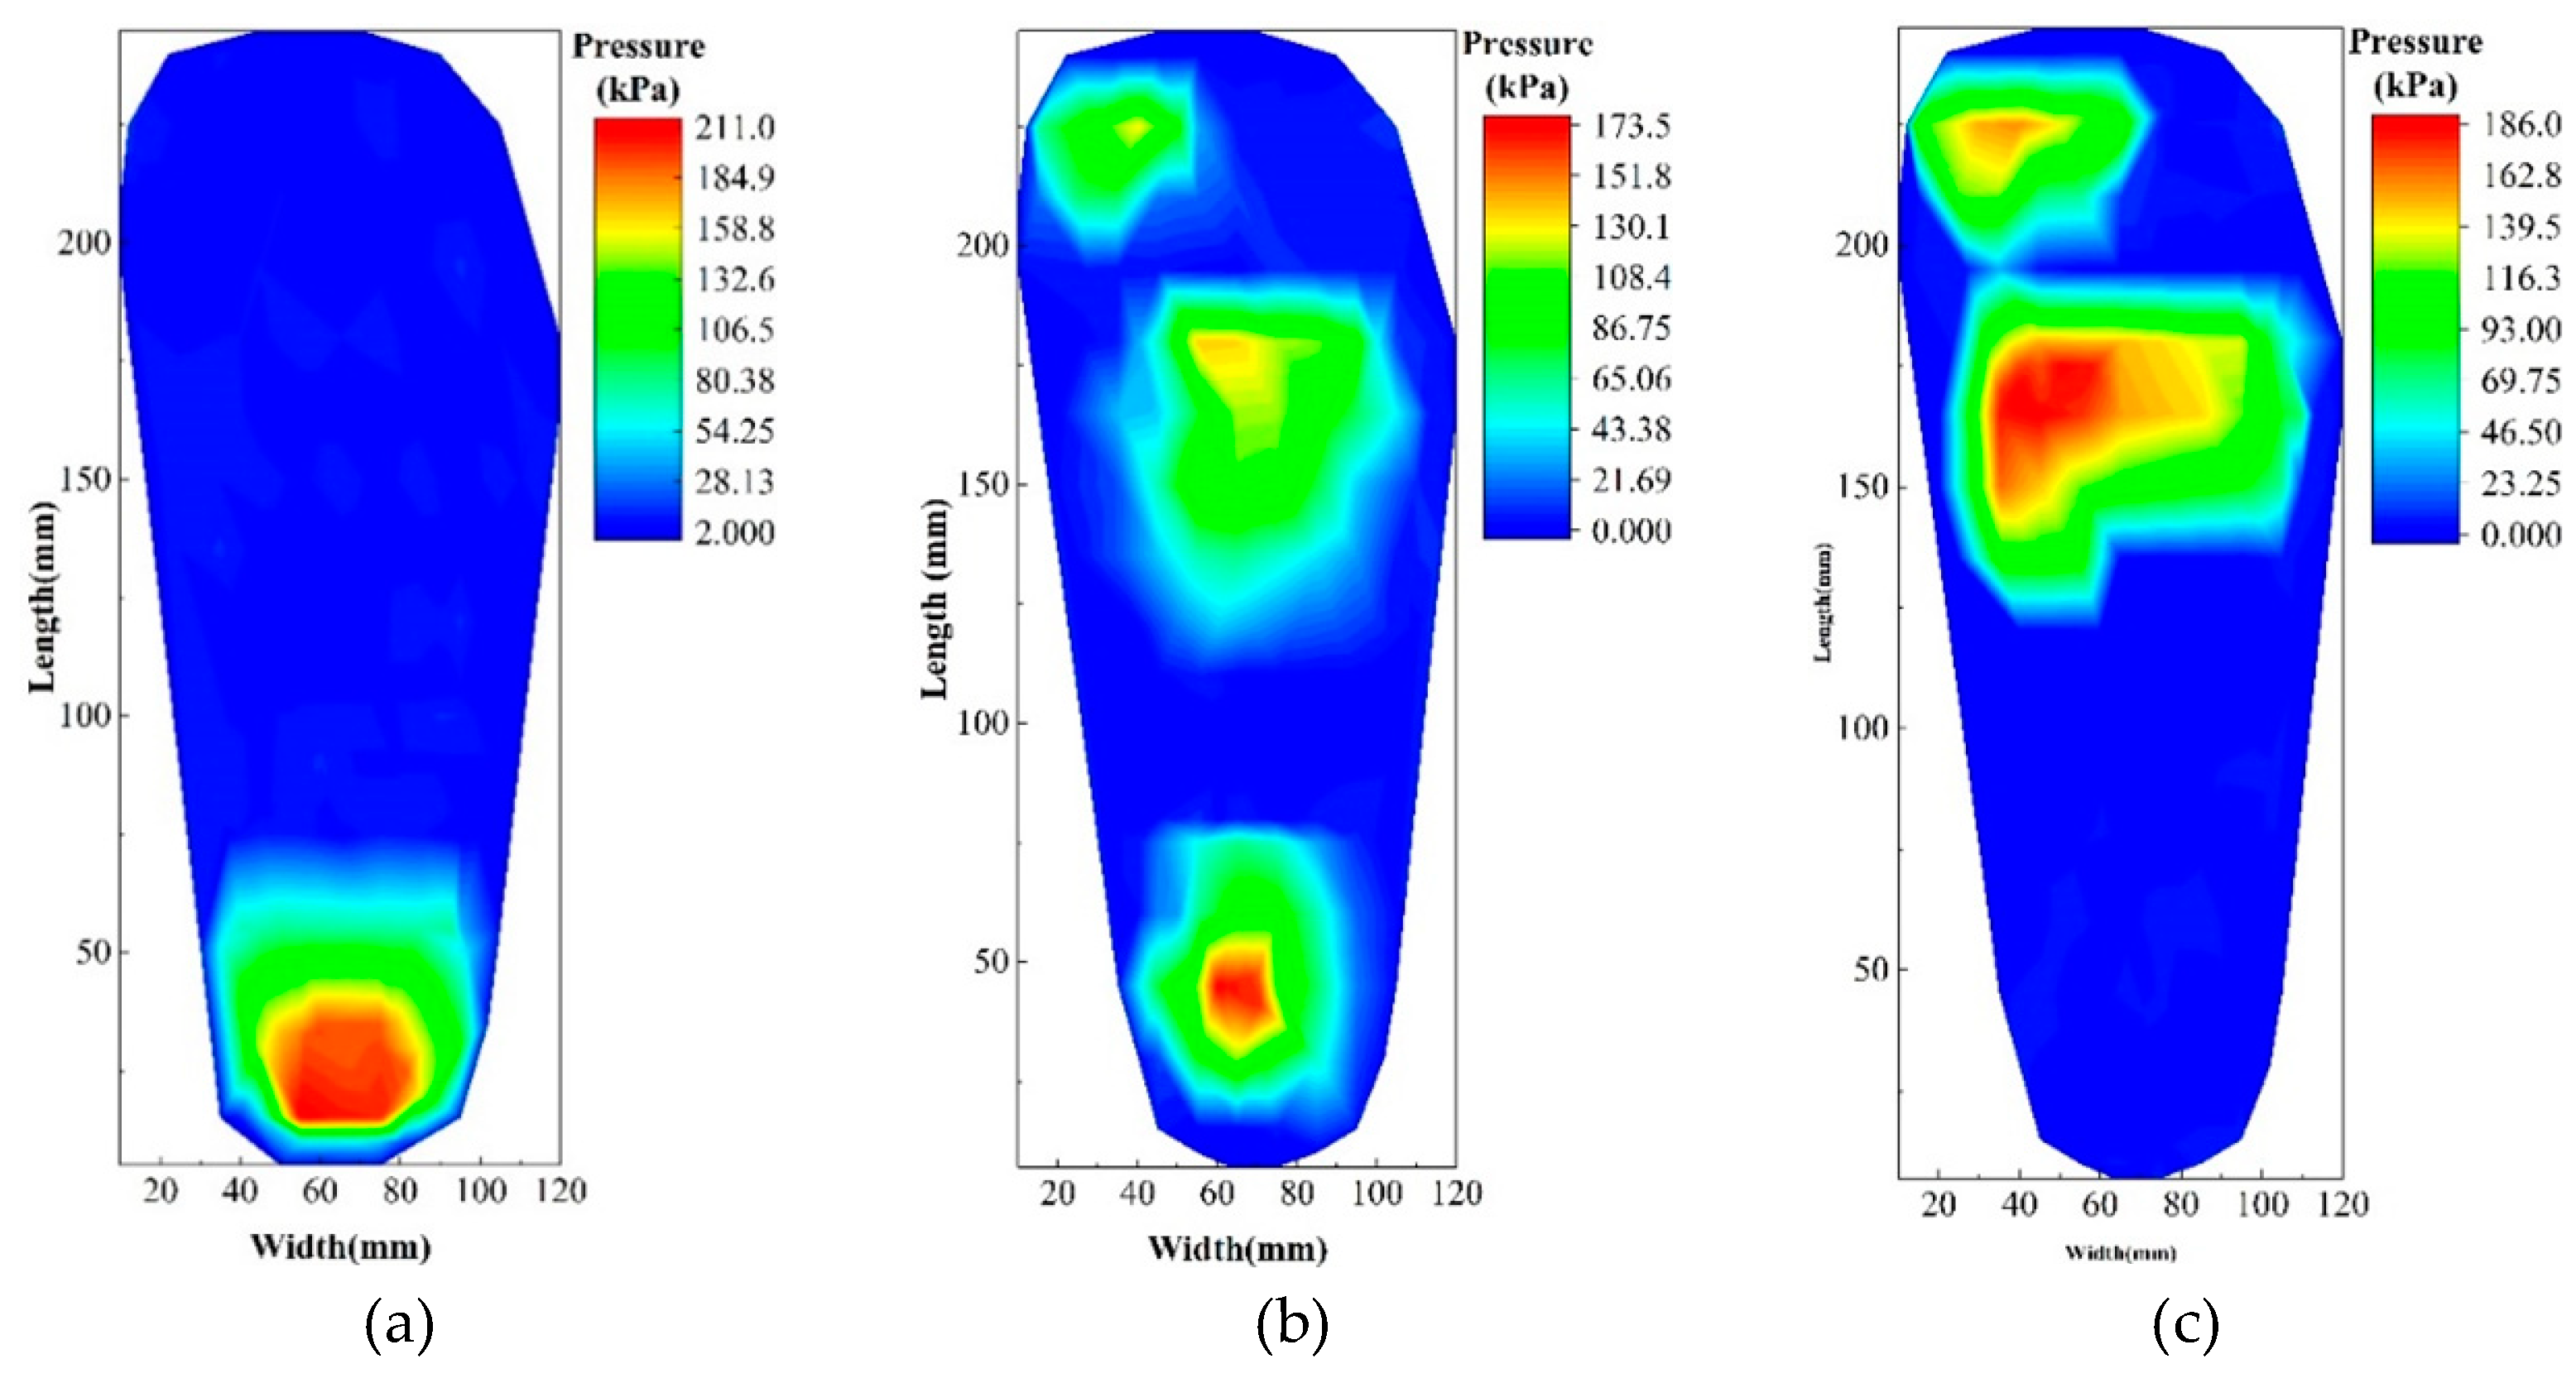
3.5. Plantar Distributed Pressure Measurement

In this section, the distributed plantar pressure is measured using flexible fiber optic pressure sensors fabricated in an insole-like style. These sensors are applied to shoes in order to monitor the distribution of plantar pressure. Based on the physiological characteristics and load-bearing properties of the foot, the plantar pressure region is divided into five areas: the toe (M1), the first and second metatarsals (M2), the third to fifth metatarsals (M3), the arch (M4), and the heel (M5); this is shown in Figure 11a. The sensor, shown in Figure 11b, is coiled and encapsulated in a flexible substrate at 1.5 cm intervals. Data on the distribution of plantar pressure were collected during various activities, including static standing and walking with three different points of impact.
The basic information of the test subject is shown in Table 2. The test was conducted while the subject was standing still, with the procedure outlined in Figure 12.
From Figure 13b, it is evident that when the tested person is standing still, the big toe area, the ball of the foot, and the heel are the main load-bearing regions. Since the tested person’s posture is slightly tilted backward, the heel bears the maximum load. The presence of the arch area connects the forefoot and heel in a half-arc, resulting in minimal force being exerted on the arch. Additionally, the pressure distribution map shows that this person has a normal foot shape and does not have flat feet.
The entire process of a person lifting their foot to landing their foot is shown in Figure 14. This process involves three successive stages: the heel contacting the ground, the whole foot contacting the ground, and finally the heel being lifted with only the forefoot in contact with the ground, initiating forward movement. The pressure distribution during each gait phase is shown in Figure 15. By using the output from the flexible fiber optic pressure sensor, we can monitor the walking process and the person’s gait in real time.
From the experiments conducted in this section, it is clear that the flexible fiber optic pressure sensor we developed can measure both the plantar pressure and the walking status of a person with good sensitivity. Therefore, our research is an important guide for the large-area monitoring of wearable sports and bionic and medical fields such as artificial skin.

4. Conclusions

We developed a flexible fiber optic pressure sensor for the detection of contact force, encapsulated it within a PDMS structure for increased sensitivity, and investigated the sensor’s preparation process and parameters. Through experimental testing and analysis, we determined that a 10:1 PDMS ratio and a package thickness of 5 mm provided the best linearity, The performance of the fiber optic pressure sensors was tested under loads ranging from 0 to 276.2 kPa in 27.6 kPa increments over four cycles. The sensor exhibited a sensitivity of 6.93247 με/kPa and a hysteresis error of 2.64% and demonstrated good repeatability and high linearity. Finally, the sensor was used for the real-time monitoring of plantar pressure, yielding a positive output response; this indicates that the PDMS-based fiber optic pressure sensor has promising engineering applications.

Author Contributions

Conceptualization, H.Z. and J.W.; methodology, J.W.; software, C.G.; validation, J.W and C.G.; formal analysis, H.Z.; investigation, C.G.; resources, H.Z.; data curation, H.Z.; writing—original draft preparation, H.Z.; writing—review and editing, J.W.; visualization, H.Z.; supervision, H.Z; project administration, H.Z.; funding acquisition, H.Z. All authors have read and agreed to the published version of the manuscript.

Funding

National Natural Science Foundation of China (62203404), (62201523).

Data Availability Statement

Data underlying the results presented in this paper are not publicly available at this time but may be obtained from the authors upon reasonable request.

Conflicts of Interest

The authors declare no conflicts of interest.

References

  1. Wan, Y.; Wang, Y.; Guo, C.F. Recent progresses on flexible tactile sensors. Mater. Today Phys. 2017, 1, 61–73. [Google Scholar] [CrossRef]
  2. Andrews, J.; Cardenas, J.; Mullett, J.; Franklin, A.D. Fully printed and flexible carbon nanotube transistors designed for environmental pressure sensing and aimed at smart tire applications. In Proceedings of the IEEE SENSORS, Glasgow, UK, 29 October–1 November 2017; pp. 1–3. [Google Scholar]
  3. Yang, T.; Xie, D.; Li, Z.; Zhu, H. Recent advances in wearable tactile sensors: Materials, sensing mechanisms, and device performance. Mater. Sci. Eng. R: Rep. 2017, 115, 1–37. [Google Scholar] [CrossRef]
  4. Schwartz, G.; Tee, B.C.-K.; Mei, J.; Appleton, A.L.; Kim, D.H.; Wang, H.; Bao, Z. Flexible polymer transistors with high pressure sensitivity for application in electronic skin and health monitoring. Nat. Commun. 2013, 4, 1859. [Google Scholar] [CrossRef]
  5. Wang, K.; Lou, Z.; Wang, L.; Zhao, L.; Zhao, S.; Wang, D.; Han, W.; Jiang, K.; Shen, G. Bioinspired Interlocked Structure-Induced High Deformability for Two-Dimensional Titanium Carbide (MXene)/Natural Microcapsule-Based Flexible Pressure Sensors. ACS Nano 2019, 13, 9139–9147. [Google Scholar] [CrossRef]
  6. Qiu, Z.; Wan, Y.; Zhou, W.; Yang, J.; Yang, J.; Huang, J.; Zhang, J.; Liu, Q.; Huang, S.; Bai, N.; et al. Ionic Skin with Biomimetic Dielectric Layer Templated from Calathea Zebrine Leaf. Adv. Funct. Mater. 2018, 28, 1802343. [Google Scholar] [CrossRef]
  7. Chen, J.; Zheng, J.; Gao, Q.; Zhang, J.; Zhang, J.; Omisore, O.M.; Wang, L.; Li, H. Polydimethylsiloxane (PDMS)-Based Flexible Resistive Strain Sensors for Wearable Applications. Appl. Sci. 2018, 8, 345. [Google Scholar] [CrossRef]
  8. Zhang, Y.; Ye, J.; Lin, Z.; Huang, S.; Wang, H.; Wu, H. A Piezoresistive Tactile Sensor for a Large Area Employing Neural Network. Sensors 2018, 19, 27. [Google Scholar] [CrossRef]
  9. Larson, C.; Peele, B.; Li, S.; Robinson, S.; Totaro, M.; Beccai, L.; Mazzolai, B.; Shepherd, R. Highly stretchable electroluminescent skin for optical signaling and tactile sensing. Science 2016, 351, 1071–1074. [Google Scholar] [CrossRef]
  10. Lee, H.; Park, K.; Kim, Y.; Kim, J. Durable and Repairable Soft Tactile Skin for Physical Human Robot Interaction. In Proceedings of the Companion of the ACM/IEEE International Conference on Human-Robot Interaction, Vienna, Austria, 6–9 March 2017; ACM: New York, NY, USA, 2017; pp. 183–184. [Google Scholar]
  11. Park, Y.-L.; Ryu, S.C.; Black, R.J.; Chau, K.K.; Moslehi, B.; Cutkosky, M.R. Exoskeletal Force-Sensing End-Effectors with Embedded Optical Fiber-Bragg-Grating Sensors. IEEE Trans. Robot. 2009, 25, 1319–1331. [Google Scholar] [CrossRef]
  12. Saccomandi, P.; Caponero, M.; Polimadei, A.; Francomano, M.; Formica, D.; Accoto, D.; Tamilia, E.; Taffoni, F.; Taffoni, F.; Di Pino, G.; et al. An MR-compatible force sensor based on FBG technology for biomedical application. In Proceedings of the 2014 36th Annual International Conference of the IEEE Engineering in Medicine and Biology Society, Chicago, IL, USA, 26–30 August 2014; pp. 5731–5734. [Google Scholar]
  13. Chen, L.; Smith, M.R.; Hui, Y. Comparing the performance of two feedforward neural network training algorithms in MRI: Reconstruction. In Proceedings of the 1996 Canadian Conference on Electrical and Computer Engineering, Calgary, AB, Canada, 26–29 May 1996; Volume 1, pp. 362–364. [Google Scholar]
  14. Mingxin, J.I.A. Research on fiber-optic tactile sensors and their performance. J. Harbin Eng. Univ. 2002, 2, 78–81. [Google Scholar]
  15. Li, M. Research on Pressure Sensing Technology Based on Multimode Fiber Spot Analysis. Master’s Thesis, Beijing Jiaotong University, Beijing, China, 2020. [Google Scholar]
  16. Yu, X.; Zhang, S.; Olivo, M.; Li, N. Micro- and nano-fiber probes for optical sensing, imaging, and stimulation in biomedical applications. Photonics Res. 2020, 8, 1703–1724. [Google Scholar] [CrossRef]
  17. Giurgiutiu, V. Fiber-Optic Sensors. In Structural Health Monitoring of Aerospace Composites; Elsevier: Amsterdam, The Netherlands, 2016; pp. 249–296. [Google Scholar]
  18. Gianluca, G.; Mario, S.; Pietro, F.; Chehura, E.; Tatam, R.P.; Gangopadhyay, T.K.; Ballard, N.; Paz-Soldan, D.; Barnes, J.A.; Loock, H.P.; et al. Optical fiber sensing based on reflection laser spectroscopy. Sensors 2010, 10, 1823–1845. [Google Scholar] [CrossRef] [PubMed]
  19. Xu, Z.; Kai, C. Research on OFDR Pressure Sensor Based on PDMS. In Advances in Precision Instruments and Optical Engineering; Liu, G., Cen, F., Eds.; Springer Proceedings in Physics; Springer: Singapore, 2022; Volume 270. [Google Scholar]
  20. Yao, N.; Wang, X.; Ma, S.; Song, X.; Wang, S.; Shi, Z.; Pan, J.; Wang, S.; Xiao, J.; Liu, H.; et al. Single optical microfiber enabled tactile sensor for simultaneous temperature and pressure measurement. Photon. Res. 2022, 10, 2040–2046. [Google Scholar] [CrossRef]
  21. Li, L.; Sheng, S.; Liu, Y.; Wen, J.; Song, C.; Chen, Z.; Xu, W.; Zhang, Z.; Fan, W.; Chen, C.; et al. Automatic and continuous blood pressure monitoring via an optical-fiber-sensor-assisted smartwatch. PhotoniX 2023, 4. [Google Scholar] [CrossRef]
  22. Hou, L.; Jiang, T.; Yu, T.; Cao, C.; Tu, X.; Zhang, J.; Pan, J.; Wang, S.; Zhou, N.; Yao, N.; et al. Tapered Optical Fiber Enabled Distributed Sensors with High Spatial Resolution by Deep Learning. Adv. Opt. Mater. 2024, 12, 2303118. [Google Scholar] [CrossRef]
  23. Domingues, M.F.; Rodriguez, C.A.; Martins, J.; Tavares, C.; Marques, C.; Alberto, N.; André, P.; Antunes, P. Cost-effective optical fiber pressure sensor based on intrinsic Fabry-Perot interferometric micro-cavities—ScienceDirect. Opt. Fiber Technol. 2018, 42, 56–62. [Google Scholar] [CrossRef]
  24. Huang, R.; Lele, S.P.; Anand, L. Non-linear mechanical behavior of polydimethylsiloxane (PDMS): Application to the manufacture of microfluidic devices. Innov. Manuf. Syst. Technol. IMST 2004. Available online: http://hdl.handle.net/1721.1/3913 (accessed on 15 August 2024).
  25. Cui, K.; Hong, Y.; Sui, D.; Wenyi, L.; Huixin, Z. A Lossless Fiber Pressure Sensor Based on PDMS. IEEE Access 2020, 8, 189036–189042. [Google Scholar]
  26. Zhao, L.; Tang, F.; You, R.; Li, H.-N. A silicone rubber packaged distributed optical fiber sensing tape for strain-crack monitoring based on OFDR technique. Sens. Actuators A Phys. 2024, 372, 115383. [Google Scholar] [CrossRef]
  27. Huang, J.; Zhou, Z.; Wen, X.; Zhang, D. A diaphragm-type fiber Bragg grating pressure sensor with temperature compensation. Measurement 2013, 46, 1041–1046. [Google Scholar] [CrossRef]
  28. Li, J.; Gan, J.; Zhang, Z.; Heng, X.; Yang, C.; Qian, Q.; Xu, S.; Yang, Z. High spatial resolution distributed fiber strain sensor based on phase-OFDR. Opt. Express 2017, 25, 27913–27922. [Google Scholar] [CrossRef] [PubMed]
  29. Froggatt, M.; Gifford, D. Rayleigh Backscattering Signatures of Optical Fibers—Their Properties and Applications. In Proceedings of the Optical Fiber Communication Conference, Anaheim, CA, USA, 17–21 March 2013; pp. 1–3. [Google Scholar]
  30. Wang, C.Q.; Wu, L.W.; Liu, Y. Research progress of distributed optical fiber temperature and strain sensing system. Transducer Microsyst. Technol. 2017, 36, 1–4. [Google Scholar]
  31. Luo, M.; Liu, J.; Tang, C.; Wang, X.; Lan, T.; Kan, B. 0.5 mm spatial resolution distributed fiber temperature and strain sensor with position-deviation compensation based on OFDR. Opt. Express 2019, 27, 35823–35829. [Google Scholar] [CrossRef] [PubMed]
  32. Wada, D.; Igawa, H.; Murayama, H. Simultaneous distributed measurement of the strain and temperature for a four-point bending test using polarization-maintaining fiber Bragg grating interrogated by optical frequency domain reflectometry. Measurement 2016, 94, 745–752. [Google Scholar] [CrossRef]
  33. Yang, D.; Liu, T.; Ding, Z.; Han, Q.; Liu, K.; Jiang, J.; Chen, Q.; Feng, B. Cryogenic Temperature Measurement Using Rayleigh Backscattering Spectra Shift by OFDR. IEEE Photonics Technol. Lett. 2014, 26, 1150–1153. [Google Scholar] [CrossRef]
Figure 1. (a) Three-dimensional structure of the sensor; (b) physical drawing of the sensor.
Photonics 11 00919 g001
Figure 2. (a) Schematic diagram of the fiber optic structure; (b) physical drawing of the G.65A72.
Photonics 11 00919 g002
Figure 3. Schematic diagram of the sensor fabrication process.
Photonics 11 00919 g003
Figure 4. Working principle of OFDR.
Photonics 11 00919 g004
Figure 5. Test system.
Photonics 11 00919 g005
Figure 6. Stress–strain diagrams for PDMS substrates of different thicknesses.
Photonics 11 00919 g006
Figure 7. Stress–strain diagrams for different PDMS ratios.
Photonics 11 00919 g007
Figure 8. Stress–strain diagrams for different curing times.
Photonics 11 00919 g008
Figure 9. Relationship between the strain and pressure response of four-cycle loading.
Photonics 11 00919 g009
Figure 10. Relationship between the strain and pressure response of four loading/unloading cycles. (a) First loading/unloading cycle; (b) second loading/unloading cycle; (c) third loading/unloading cycle; (d) fourth loading/unloading cycle.
Photonics 11 00919 g010
Figure 11. (a) Pressure zoning of the soles of the feet; (b) insole-type fiber optic sensor structure.
Photonics 11 00919 g011
Figure 12. Test process.
Photonics 11 00919 g012
Figure 13. (a) Strain diagram of the output at static stand; (b) cloud view of distribution of plantar pressure during static standing.
Photonics 11 00919 g013
Figure 14. Gait analysis during walking: (a) heel on the ground; (b) full foot on the ground; (c) foot planted on the ground.
Photonics 11 00919 g014
Figure 15. The distribution of plantar pressure during walking: (a) heel on the ground; (b) full foot on the ground; (c) foot planted on the ground.
Photonics 11 00919 g015
Table 1. Parameters of the optical fiber’s mechanical performance.
NameRadius/(μm)Elastic Modulus/(Mpa)Poisson’s Ratio/(V)Coefficient of Thermal Expansion/( × 10 6 / ° C )
Core4.572,0000.170.55
Cladding62.572000.170.55
Coating layer12512000.4995150
Table 2. Subject information.
ParameterValue
Height (cm)161
Weight (kg)53 ± 2
Foot length (mm)245 ± 5
Foot width (mm)95 ± 5
Disclaimer/Publisher’s Note: The statements, opinions and data contained in all publications are solely those of the individual author(s) and contributor(s) and not of MDPI and/or the editor(s). MDPI and/or the editor(s) disclaim responsibility for any injury to people or property resulting from any ideas, methods, instructions or products referred to in the content.

