Article

Automated Characterization of Intrastromal Corneal Cuts Induced by Two Femtosecond Laser Systems Using OCT Imaging

1
SCHWIND Eye-Tech-Solutions, Biomedical Engineering Office, Mainparkstr. 6-12, 63801 Kleinostheim, Germany
2
Narayana Nethralaya Eye Hospital, Bengaluru 560010, India
*
Author to whom correspondence should be addressed.
Photonics 2024, 11(12), 1123; https://doi.org/10.3390/photonics11121123
Submission received: 15 October 2024 / Revised: 22 November 2024 / Accepted: 26 November 2024 / Published: 27 November 2024
(This article belongs to the Special Issue OCT Technology Advances and Their Applications in Disease Studies)

Abstract

:
Optical coherence tomography (OCT) has gained momentum on segmenting anterior corneal substructures, such as treatment-induced flaps and lenticule cuts created by femtosecond lasers. However, recent semi-automated methods rely on manual markers, which can introduce bias and variability. In this work, we present an automated algorithm designed to overcome the limitations in the geometric quantification of intrastromal cuts produced by two different femtosecond lasers, using a unique imaging system. Our analysis, conducted on peri-operative segmentations of goat eyes, aims to demonstrate the method’s potential for contributing to ongoing efforts and enhancing clinical outcomes in refractive surgery treatment.

1. Introduction

Optical coherence tomography (OCT) technologies have become increasingly prevalent in ophthalmology, particularly for corneal measurements. OCT is an optical imaging modality that utilizes low-coherence interferometry to generate detailed images of tissue microstructure in vivo [1,2,3,4,5,6]. It employs a near-infrared light beam to capture intensity variations and create a two- or three-dimensional representation of the sample’s morphology [7,8].
OCTs enable the segmentation of differential structures to accurately delineate the various sections of the scanned tissue. Recently, advancements in segmentation techniques and the resolution of anterior segment OCT (AS-OCT) systems have evolved, progressing to refined assessments, including epithelial characterization [9,10].
The emergence of femtosecond lasers has revolutionized vision science research. The unique combination of femtosecond lasers with optical coherence tomography (OCT) presents a promising avenue for innovation in ocular research [11,12]. Exploring this intersection could significantly advance the understanding and application of both technologies, enhancing the application of femtosecond lasers and OCT in ophthalmic research. Femtosecond lasers enabled creating corneal cuts such as optical-breakdown-induced surface flaps and volume lenticules. Additionally, surgical procedures aimed at correcting or improving refractive errors such as myopia (nearsightedness) with or without astigmatism have been vastly realized [13,14,15,16].
Complimentary, the OCT technology plays a crucial role in assessing intrastromal structures. This advanced imaging technique provides high-resolution, cross-sectional images of the corneal structure, allowing for precise visualization of the surgical site [17,18]. The characterization of those geometries is important for peri-, intra- and post-operative follow-ups. Specifically, the diameter of lenticule and flap cuts is directly linked to the surgeon’s ability to effectively remove the lenticule or lift the flap, while their thickness is vital for preserving corneal biomechanics post-surgery.
Intrastromal corneal layer segmentation has garnered significant attention in the field of ophthalmic imaging, particularly with the advent of OCT. Previous studies have explored various algorithms and methodologies for accurately segmenting the distinct layers of the cornea, which is essential for understanding corneal pathologies and guiding surgical interventions. For instance, Garcia et al. [19] reviewed the potential of automated approaches to perform anterior segmentation tasks. Furthermore, Nguyen et al. [20] provided an overture on deep learning frameworks that significantly improved the detection of intra-layer boundaries, demonstrating the potential of convolutional neural networks in automated corneal layer segmentation. Moreover, Luo et al. [21] developed iridocorneal angle imaging to segment intrastromal layers using the graph-based method in the spectral domain, which enables effective glaucoma inspections. These advancements highlight the ongoing efforts to refine segmentation techniques, facilitating better diagnostic and therapeutic outcomes in corneal treatments.
Despite these advancements, the segmentation of treatment-induced substructures remains a manual process, which is often dependent on markers placed along and across B-scans. the manual evaluation of these geometric parameters introduces variability due to human error, compromising the accuracy and consistency of assessments [22,23,24,25,26,27,28]. This variability highlights the necessity for an automated characterization tool that can analyze the geometry of lenticules and flaps without user induced errors. Semi-manual approaches, such as the SCHWIND MS-39 OCT system utilizing nine manual markers, have been introduced to facilitate the semi-quantitative characterization.
To address these limitations, we have developed a fully automated segmentation method with the goal of creating a universally applicable algorithmic pipeline for discerning treatment-induced substructures. This tool is intended for peri-operative and post-operative applications, enabling the accurate quantification of the geometry of corneal cuts and thereby improving clinical outcomes in ophthalmic procedures. This approach has been already successfully applied [29] to characterize intrastromal substructures from a single femtosecond system (SCHWIND ATOS) in two different clinical applications (flap and lenticules) captured with the B-scans obtained by Thorlabs OCT [30] and SCHWIND MS-39.
In this study, to address the applicability and generalization of our method, we report on quantifications of intrastromal cuts (ex vivo animal study in bovine eyes) created by VisuMax 500 (VS), Carl Zeiss Meditec, and SCHWIND ATOS (SA), SCHWIND eye-tech-solutions, imaged with a SCHWIND MS-39 OCT system. These systems are known for their distinct approaches to intrastromal tissue cutting, specifically in the creation of flaps and lenticules [31,32,33,34].
The developed image processing approach utilizes a bilateral filtering [35] as well as a 2D-signal convolution technique [36] to characterize peri-operative intrastromal cuts. Our approach requires only a single-step parameters’ tuning through a small dataset allowing for generalization in characterization. This work aims at introducing a generalized approach to be applied peri-operatively or post-operatively to quantify the actual geometry of intrastromal corneal cuts. By integrating advanced algorithms and systematic methodologies to improve the accuracy of flap and lenticule assessments, this work addresses a critical gap in current clinical practices. Such advancements are not merely beneficial; they are imperative in the ongoing quest to optimize surgical efficacy and enhance the overall quality of care within the ophthalmic community.
We emphasize that this study potentially highlights the advantages and feasibility of automated geometric characterization of intrastromal cuts, but it is not intended to draw definitive clinical conclusions from the presented statistics.
The experiment was conducted entirely on goat eyes. Since goats belong to the bovine family, we also partially referenced bovine eyes in subsequent analyses.

2. Materials and Methods

2.1. Experiment

We have assessed the generalizability of our method to intrastromal cuts created in bovine eyes by two different femtosecond systems (VS and SA) in two different clinical applications (flap and lenticules) applied to the B-scans obtained with one particular AS-OCT (SCHWIND MS-39).
The experiment was performed on goat eyes due to the similarity to a human eye, with a lens, cornea, iris and retina. A crucial difference, though, is that the retina is shaped like a rectangle. This offers these ungulates massive peripheral vision and a panoramic field of 320–340 degrees. The work of [37] tested the hypothesis that human, monkey, pig, sheep, cow, and goat eyes exhibit circumferential, radial, and interweaving collagen architecture in the posterior sclera.
The experiment was conducted at Narayana Nethralaya in Bangalore, India. All the treatments were performed on ex vivo goat eyes. The eyes were stored in normal saline solution at room temperature (≈23 °C) during transportation and before treatment, ensuring the cornea’s health and transparency. The system and treatment specifications for each test setting are presented in Table 1 and Table 2. For all treatments, the eyes were mounted on a holder and de-epithelized manually prior to treatments using an Amoils brush. Each parameter in Table 2 was repeated in different eyes to analyze repeatability.
Intraocular pressure was controlled using a specialised ex vivo eye holder to ensure consistent experimental conditions. Additionally, peri-operative OCT scans were conducted immediately after the laser treatment once the eyes had been released from the system but before any surgical manipulation. These performed scans for each eye using the SCHWIND MS-39 OCT system [38] provided unique imaging data for our analysis.
The MS-39 OCT device has a resolution of 3.6 μm in the vertical (axial) direction and 16.6 μm in the horizontal (lateral) direction. The applied field of view (FOV) was about 10 mm in our study, but it can cover up to 16 mm in the device. Each B-scan was averaged over five frames to enhance the contrast and the power SNR.
It is important to note that the vertical resolution is affected by the refractive index of the medium being imaged. For our study, we adjusted the vertical resolution to account for the refractive index of goat tissue which ensures that the thickness and depth measurements of the imaged structures remain accurate. The refractive index of goat corneal tissues is assumed to be 1.38 [39]. This refractive index is comparable to that of human corneal tissue and other mammalian tissues, making it a suitable adjustment for our measurements.
This diagnostics system provides high-resolution, cross-sectional B-scan images of the cornea, enabling detailed visualization of the anatomical layers and any surgical alterations. Utilizing advanced OCT technology, the system captures high-speed, non-invasive images, facilitating the assessment of corneal thickness, curvature, and the geometry of intrastromal cuts created by femtosecond lasers. The B-scan mode allows for the depth-resolved examination of corneal features, ensuring that even subtle changes in corneal morphology can be detected.
To maintain the integrity and consistency of the test conditions, identical parameters were utilized across both systems.

2.2. Image Processing

Data were collected using the SCHWIND MS-39 OCT, which utilizes spectral-domain OCT technology to provide high-resolution cross-sectional images. Overall, 120 high-quality OCT B-scans were analyzed (representing ten different goat eyes) encompassing both flap and lenticule cuts created by a skilled surgeon in a controlled environment (single centre). The ten treated eyes were categorized as VS:G1-G3 and SA:G1-G3 for flap cuts and VS:G4-G5 and SA:G4-G5 for lenticule cuts. We captured preoperative B-scans in 12 azimuthal steps, which were each separated by 15 degrees.
This advanced technology offers superior image quality compared to traditional time-domain OCT systems. Figure 1 illustrates examples of the lenticules and flaps created with the VS and SA systems. To minimize the influence of deeper posterior structures on the segmentation task, 500 pixels from the bottom of each raw image were automatically removed. This trimming process ensures that only the relevant anterior regions are analyzed, improving the accuracy of the segmentation by excluding unnecessary or potentially noisy posterior data.
Given the high signal-to-noise ratio (SNR) observed in the imaging data, we used bilateral noise filtering exclusively for image processing [40,41]. This choice is predicated on the effectiveness of bilateral filtering in preserving essential structural details while effectively reducing noise.

2.2.1. Bilateral Filtering

Bilateral filtering operates by considering both the spatial proximity of pixels and their intensity similarity, which allows to differentiate between true signal variations and noise artifacts. As a result, this method enhances image quality without eliminating the integrity of critical features, making it particularly suitable for our analysis where the clarity of the underlying data is paramount.
The bilateral filter can be expressed mathematically as follows [42]:
I filtered ( x ) = 1 W ( x ) y Ω G σ s ( x y ) G σ r ( I ( y ) I ( x ) ) I ( y )
where I filtered ( x ) is the filtered image at pixel x, I ( y ) is the intensity value at pixel y, Ω represents the neighborhood of pixel x, and G σ s is the spatial Gaussian kernel defined as
G σ s ( x y ) = exp | | x y | | 2 2 σ s 2
G σ r is the range Gaussian kernel defined as
G σ r ( I ( y ) I ( x ) ) = exp | | I ( y ) I ( x ) | | 2 2 σ r 2
W ( x ) is a normalization factor defined as
W ( x ) = y Ω G σ s ( x y ) G σ r ( I ( y ) I ( x ) )
The parameters σ s and σ r control the extent of smoothing in the spatial and intensity domains, respectively. A larger σ s results in a broader neighborhood for pixel selection, while a larger σ r allows pixels with greater intensity differences to contribute more significantly to the filtered value [43].

2.2.2. Peak Detection

To identify the significant peaks corresponding to the flap and lenticule cuts in the data, we initially employed a peak-finding algorithm (peak-finder [44]) implemented in Python. We used the peak prominence approach with a tuning strategy through iterative testing to achieve reliable peak detection, allowing simultaneously for the distinction between the corneal layer from intrastromal cuts [45]. The local baseline estimation was used as following,
l o c a l _ m e a n ( I ) = 1 N j n e i g h b o r h o o d I ( j )
where I stands for the gray-scale intensity representation of captured images, and N is the number of neighboring pixels considered.
Once the local baseline is determined, the prominence of a peak can be recalculated as
P a d a p t i v e = h p e a k l o c a l _ b a s e l i n e ( x , y ) .
Here, h p e a k is the height of the peak at coordinates ( x , y ) , while l o c a l _ b a s e l i n e ( x , y ) is the computed baseline value at that specific location.
Afterwards, images were scanned vertically, and the earliest identified peaks were recognized as the corneal layer. The search continued vertically, excluding previously detected peaks. Polynomial fitting was subsequently applied to segregate peaks (either flap or lenticule). R 2 score was calculated as [46]
R 2 = 1 i = 1 n ( y i y ^ i ) 2 i = 1 n ( y i y ¯ ) 2
where y ^ i is the fitted value and y ¯ is the mean of the height values, which particularly enabled the segregation.
An initial polynomials fit ( n f i t = 8 ; as the highest polynomial order) on detected peaks yielded an R 2 higher than 95% for flap instances while the measure significantly drops for lenticule cuts. Thus, an initial fit with an R 2 higher than 95% can here merely describe flaps, and no further discriminator is needed.
It is observed that the best-fit strategy was employed to model the corneal layer with the coefficient of determination ( R 2 ) indicating that n f i t [ 5 8 ] produces the optimal fit. Across the entire dataset (regardless of the treatment types), the median value of n f i t leans toward 8, which is similar to the level required to accurately describe substructures. However, while higher orders of fit may offer a more detailed description, they can introduce increased divergence due to the inherent irregularities present in the corneal peripheries. These irregularities, often pronounced toward the edges, make excessive fitting orders less reliable, as they tend to overemphasize peripheral distortions rather than improving overall accuracy.

2.2.3. Lenticule Cut Segregation

To segregate anterior and posterior layers of lenticule cuts, we defined a distance difference between the peaks and discriminator. Indeed, a polynomial fit (with n f i t = 8 ) through all detected peaks, including both the anterior and posterior segments, can serve as an effective discriminator. Since the least-square method minimizes the overall fit error, the polynomial fit tends to average peak heights of the detected peaks. This averaging effectively places the fit in the middle of the anterior and posterior, making it capable of distinguishing layers of even ultra-thin lenticules. Positive differences locate peaks belonging to the anterior layer, while negative differences identify those corresponding to the posterior layer.
However, a single-step discriminator (fit) might prevent recognizing the extent of posterior cuts correctly. To mitigate this issue, we implemented a multi-step signal processing pipeline designed to enhance precision in boundary detection. Initially, a sparse signal array was constructed, with discrete impulses placed at determined peaks, while all other signal values were set to zero. This sparse representation was subsequently convolved with a uniform kernel of width κ , effectively performing a moving average to smooth the signal and attenuate high-frequency noise without distorting the underlying structure [47].
Detecting small-scale features, such as peaks at boundaries, requires minimal smoothing to avoid blurring critical details, thus necessitating the use of small Gaussian kernels, generally with a size of 3 × 3 to 7 × 7 pixels [48,49]. For instance, in OCT images of the cornea, small-scale features correspond to the sharp boundaries between the anterior and posterior cuts, where excessive smoothing would obscure the precise location of these cuts.
Subsequently, boundaries were determined by identifying the regions where the smoothed signal crossed a predefined threshold, which was set at 0.6 to balance sensitivity and specificity. The left boundary was defined as the first index where the signal exceeded the threshold, and the right boundary was determined as the last index exceeding this value.
This threshold for boundary determination was chosen through an iterative testing through a small bunch of datasets to achieve an optimal performance and to avoid introducing artefacts. A smoothed signal crossing of 0.6 can represent a significant change in intensity or gradient, which could indicate the end of a particular region, such as edges. We emphasize that while the method is universal, the parameter values may require an optimization for the specific application based on a small bunch of data. These decisions may affect generalizability across different OCT systems or eye samples.
The proposed dual-boundary detection strategy provided a more reliable estimate of the posterior cut extent, minimizing the risk of erroneous boundary identification.

2.2.4. Interlayer Thickness Calculation

The algorithm determines the thickness between each pair of layers by calculating the Euclidean distance along the normal to the chord line connecting the two boundaries—either the intrastromal flap or the lenticule cut. This approach accounts for the tilt in the ex vivo OCT measurements, which may arise from tissue deformation or varying imaging angles. By measuring perpendicularly to the boundaries, the algorithm ensures that thickness estimates accurately represent the true structural distances, which were unaffected by any tilt.
The lenticule, cap, and flap thicknesses were calculated as the average within a central region of ten pixels (toward both sides). This approach ensures a more reliable estimation by smoothing out local variations and potential noise in the calculations. Unlike manual measurements, which often focus on a single point and may be prone to localized inaccuracies, the automatic method captures a broader region. By covering a range of pixels, it more effectively accounts for fluctuations in thickness.
Figure 2 illustrates the definition of key geometric parameters.
  • where FT(D), CT(D) and LT(D) stand for flap, lenticule and cap thicknesses (diameters). ( x , y ) c , ( x , y ) a and ( x , y ) p specify the cornea, anterior and posterior segments.
The local thickness is estimated by calculating the Euclidean distance between two corresponding points on the two segments. These pairs of points are identified as the cross-sections along a line perpendicular to the cord that intersects both segments. Consequently, the following thicknesses can be determined:
F T = | | C ( x c , y c ) A ( x a , y a ) | | f l a p L T = | | A ( x a , y a ) P ( x p , y p ) | | , C T = | | A ( x a , y a ) C ( x c , y c ) | | l e n t i c u l e
The lenticule, cap and flap diameters (LD, CD, FD) are measured as the straight line from both boundaries of the effectively segmented substructure (i.e., the cord length). Computationally, in terms of image processing, the following definitions were applied:
  • Flap and Cap
    (a)
    Diameter: as straight line from both ends of the effectively segmented substructure (irrespective of whether this is complete or incomplete);
    (b)
    Thickness: as the distance measured along the normal to the straight line from both ends of the effectively segmented substructure (irrespective of whether this is complete or incomplete).
  • Lenticule:
    (a)
    Diameter: as straight line from both ends of the effectively segmented substructure (i.e., the cross over or junction between the posterior substructure and the anterior substructure as of the cap);
    (b)
    Thickness: as the distance measured along the normal to the straight line from both ends of the effectively segmented substructure (i.e., the crossover or junction between the posterior substructure and the anterior substructure as of the cap).

3. Results and Discussion

Considering the signal quality in Figure 1, the OCT scans reveal a denser signal at the cut regions for the SA compared to the VS. This observation suggests that the SA system invested more energy per pulse in generating intrastromal cuts (suggesting a lower laser-induced optical breakdown for the SA system) despite both systems being set to the identical targeted energy level.
Given that the imaged maintained a high SNR of approximately 40 dB, we applied only a mild filter to avoid over-smoothing and ensure that critical edges and structures were retained. For the spatial Gaussian kernel, we chose a standard deviation σ s of approximately 1–2 pixels, corresponding to a very localized neighborhood, thereby limiting the influence of distant pixels. This ensures that smoothing only occurs in the immediate vicinity of each pixel, maintaining the integrity of sharp boundaries. The intensity domain Gaussian kernel σ r was set to a relatively low value, between 5% and 10% of the overall intensity range, reflecting the high contrast and minimal noise levels present in the data. This limited range allows the filter to perform minimal smoothing in homogeneous regions while avoiding the excessive blurring of edges. These parameter were specifically chosen to preserve the high SNR of the images, ensuring that the quality of data remains intact while minimizing any residual noise, as shown in Figure 3. Due to the high-quality scanning system of the SCHWIND MS-39, applying the Sobel gradient operator to enhance intrastromal substructures was unnecessary: a step that is typically required when using the Thorlabs OCT system [29]. Additionally, the image processing pipeline for analyzing substructures captured by Thorlabs OCT requires applying Non-Local Means (NL Means) denoising. However, the parameters for the bilateral noise filtering remain largely consistent across different OCT systems.
Figure 4a demonstrates the use of a discriminator to initially separate the posterior and anterior layers of the lenticule cuts. Discriminators with n f i t > 8 are extremely sensitive to the noise [50] and may diverge when applied for generalized segmentations. Therefore, we chose the highest tolerable value for n f i t as 8.
The zoom-in panel shows the optical breakdown process within the instrastromal layers, where the generated bubbles extend over a range based on the laser parameters. Consequently, vertical peak-finding scans may resolve multiple peaks over the extent of bubbles even when a prominence threshold is applied. To handle this, the algorithm positions the peak at the center of the bubble cluster, which is aligned with conventional manual measurement practices. This approach ensures consistency between automated and manual methods, as manual measurements typically aim to place the peak in the middle of the bubble formation. This adjustment improves the accuracy of peak detection in challenging imaging conditions.
To optimize the boundary detection for lenticule cuts, we empirically evaluated the kernel width κ within a range of 3 to 6 pixels. Considering stable characteristics of OCT images, we determined that a fixed κ = 4 would suffice for the boundary detection that balances the need for sensitivity in boundary detection and minimizes the interference from noise as shown in Figure 4b. Additionally, due to the high SNR, no further (Bayesian) optimization algorithm was needed to identify the boundaries of lenticule cuts.
With the proposed image preprocessing applied to the data, both the flap and lenticule regions are consistently and clearly identified across different systems (Figure 5). This accuracy and clarity of segmentation holds true whether the VS or SA system is used, demonstrating the robustness of the methods employed. The same set of parameters–for the denoising as well cut segregation was applied to the algorithm for characterizing intrastromal cuts across both systems.
Figure 5 illustrates the characterization of the flap and lenticule intrastromal cuts. In all cases, the thickness of these cuts is approximately 100 μm, which poses a challenge for the segmentation process due to its high sensitivity to user measurement errors. As demonstrated in [29], accurately measuring thicknesses of this scale or smaller has proven particularly difficult. Despite utilizing a straightforward algorithmic approach, the developed method has demonstrated the stable performance of such complex characterizations. The thicknesses were determined normal to the cord lines (represented by the white solid lines in the flap and purple lines in the lenticule panel), accounting for external tilts of eyes. Although setting the same parameters in both systems, the instances in Figure 5 show a thicker flap generated by the SA compared to the VS. Conversely, the created lenticule by the VS shows higher thickness. Intriguingly, the lenticule diameters are comparable in both cases. Nevertheless, due to the denser signal at intrastromal lenticule created by the SA, the boundaries were more accurately identified compared to the VS correspondences. However, this shortening, according to the manual measurements, always falls short of 450 μm.
The deterministic nature of the developed approach ensures that the algorithm consistently produces a unique solution for each output for a given set of input parameters. The initial parameters required for image denoising and boundary detection were determined through preliminary analysis of a subset of the data including both lenticule and flap intrastromal cuts. These parameters were set to optimize performance across the entire dataset for both systems.
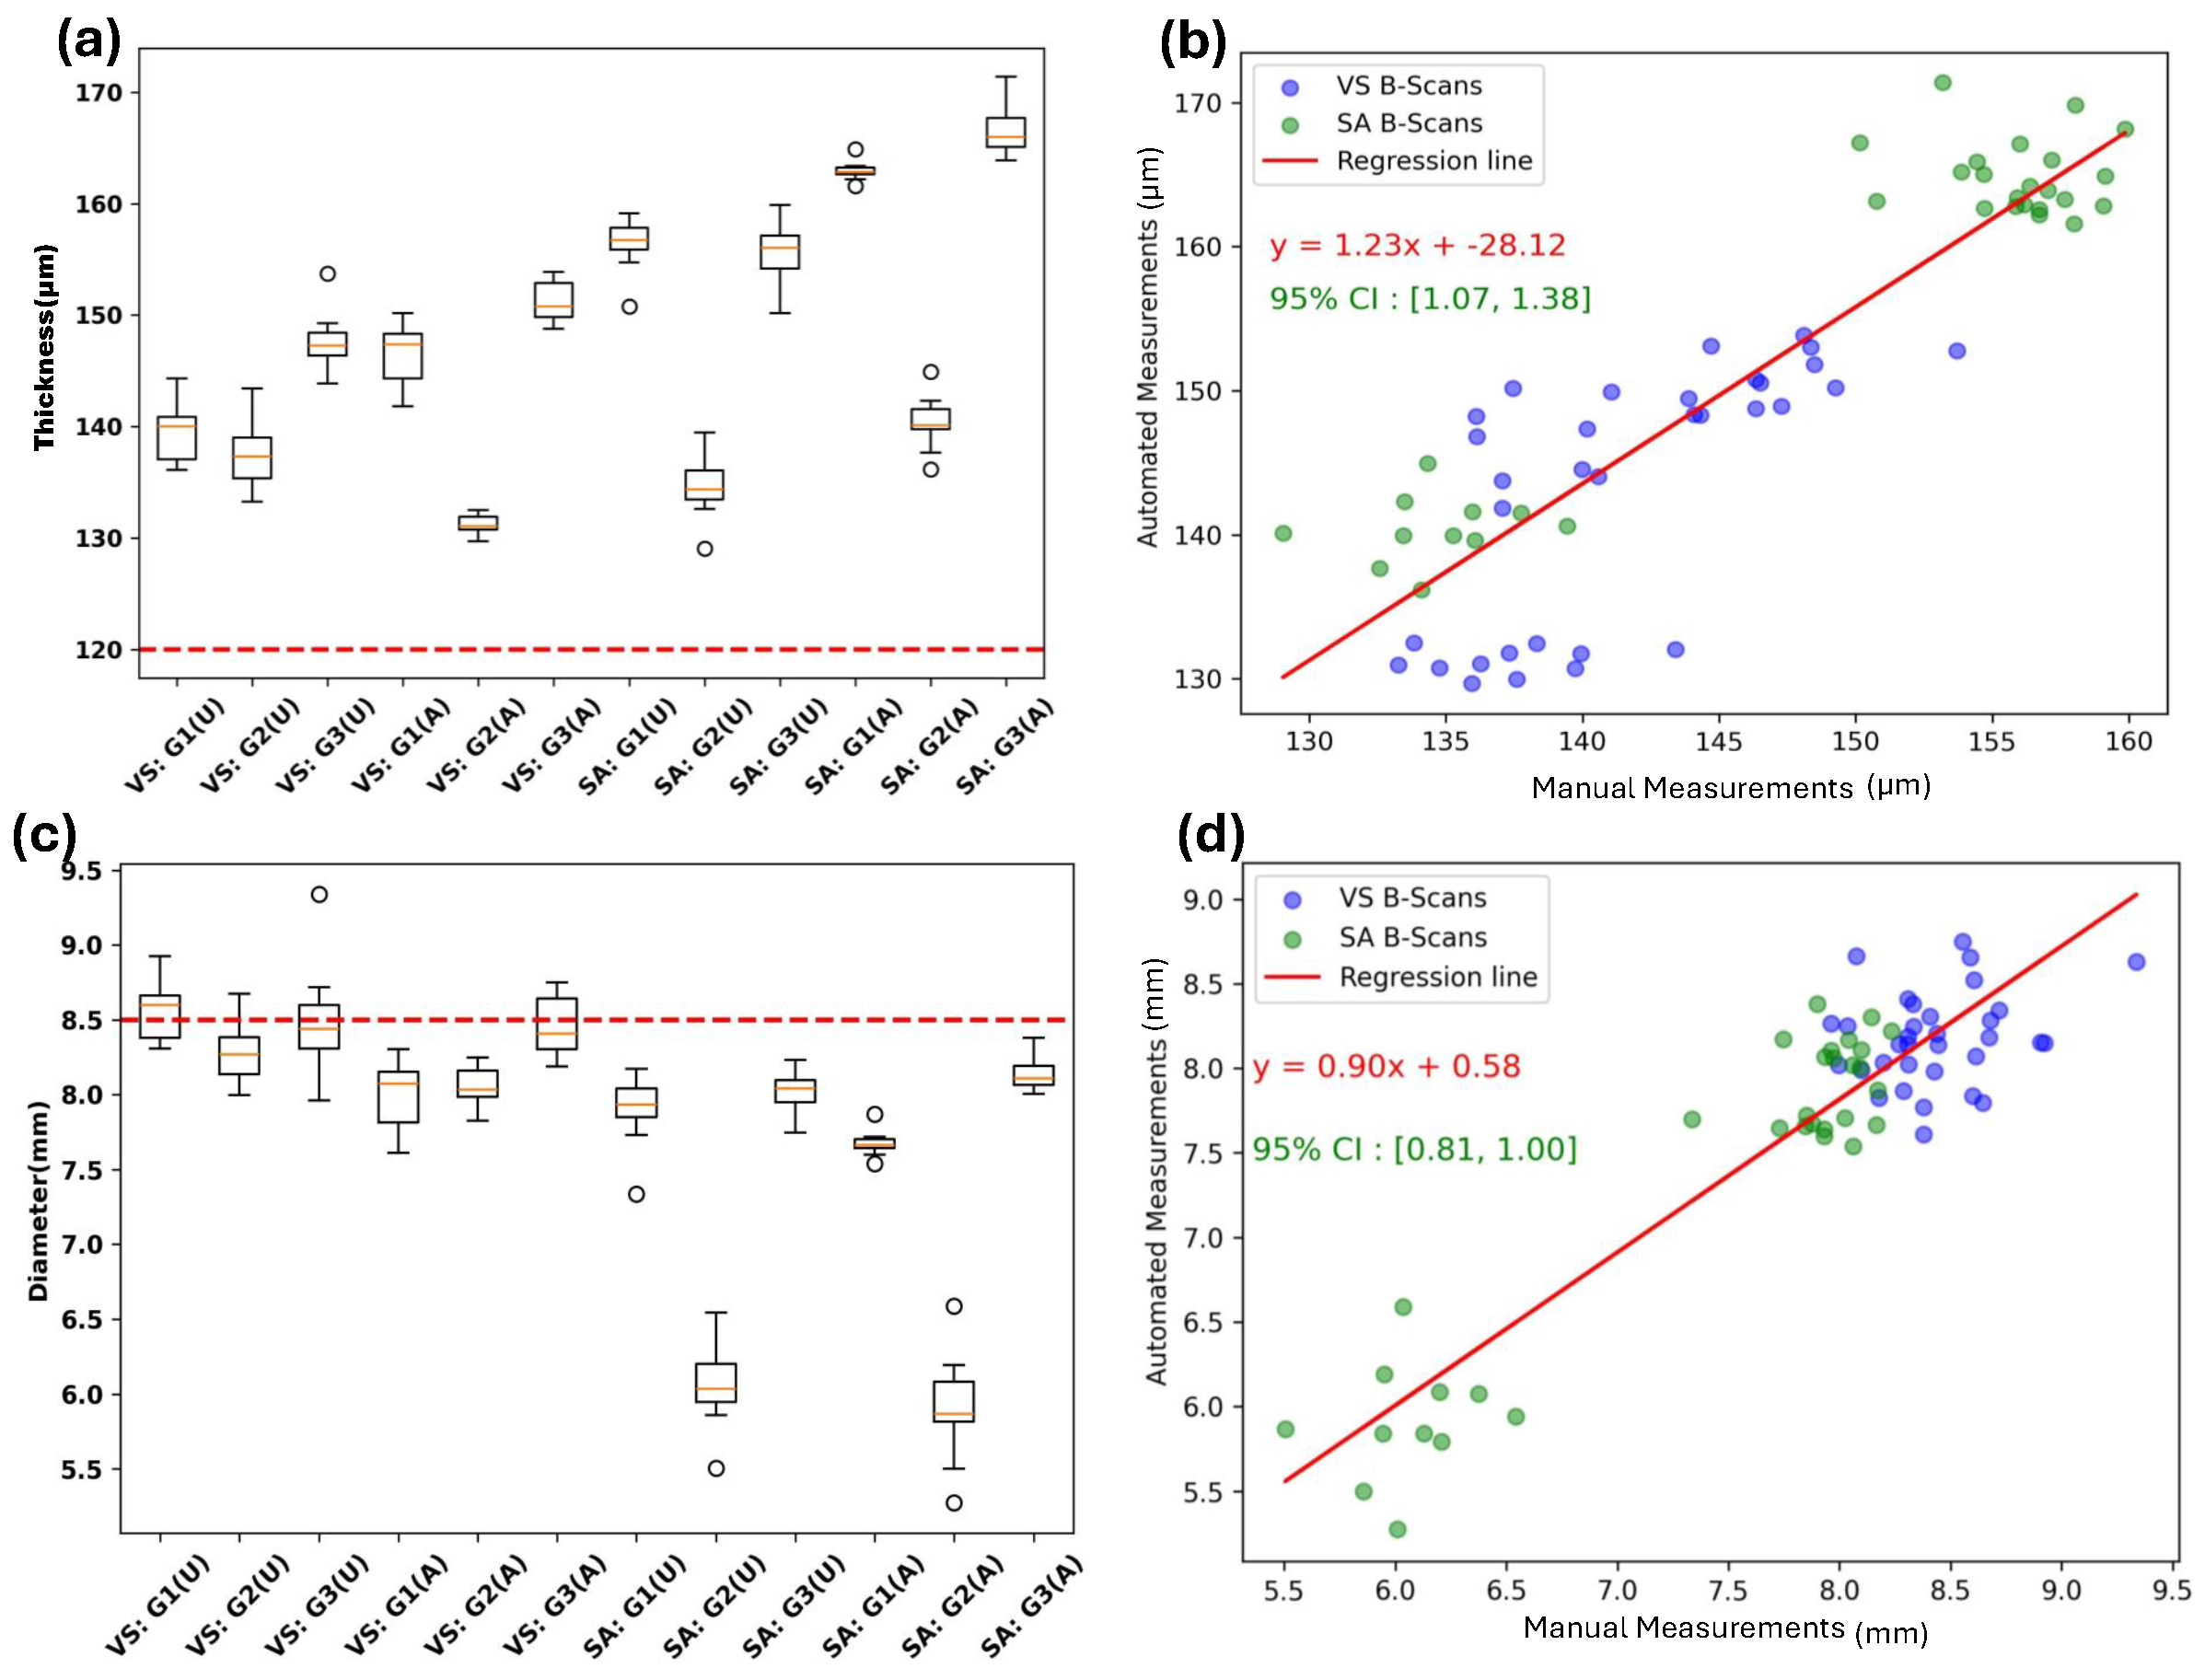
Figure 6a,c illustrate the comparison of (peri-operative) intrastromal flap diameters and thicknesses between the two systems, the VS and SA, across six treated eyes, using the manual and automated approaches. Each measurement ran over 10–12 available B-scans on each eye.
For each eye in Figure 6a, regardless of the given system, the manual and automated measurements approximately determine the comparable values considering a Standard Deviation StD of 10 μm. Considering a shortening of 450 μm ascribed to the VS measurements, Figure 6c suggests a strong correlation between the automated and manual measurements given a S t D of 500 μm when the manual and the corresponding automated data points are compared.
Notably, both automated and manual measurements indicate a significantly shorter diameter in S A : G 2 . This observation overlap precludes the off-axis performance of the automated approach and addresses the presence of another systematic issue.
When the datasets are combined (including all B-scans from both systems), the regression analysis reveals a coherent and strong relationship between the automated and manual measurements, as shown in Figure 6b,d, potentially supporting the observations in Figure 6a,c. In both Figure 6b,d, the slope of the regression falls within the 95% confidence interval, indicating a negligible degree of uncertainty in the estimates. Within this interval, Figure 6b indicates that the automated approach results in flaps approximately 5 mm thicker than those measured manually, while Figure 6d shows that the automatically measured diameters are approximately 250 μm shallower compared to the manual measurements.
Markedly, the measured thicknesses consistently exceed the intended value of 120 μm across all datasets. The calibration of the lasers may be attributed to the production of thicker flaps than intended. It is important to emphasize that the model introduced in [51] was employed to calibrate the obtained thicknesses and diameters a priori, aligning them more closely with the intended values established for human eyes.
Additionally, a repeat of the manual measurements by another independent user may yield varying results, as demonstrated in [22], whereas the automated measurements remain consistent due to the deterministic nature of the algorithms.
In Figure 7a–d, the geometries of the lenticule substructure are presented. The measurements were performed over available captured B-scans on each goat eye. Within a tolerance range of 650 μm ( S t D ), both manual and automated determinations show reasonable correlation. However, the agreement between the two approaches appears more consistent across the SA illustrated in Figure 7a,c,e,g.
An optical zone diameter of 6.3 mm translates to a total zone diameter of 7.1 mm for the SA and 6.4 mm for the VS. This means, for this particular experiment, the extremities of the lenticules created by the SA are located at a slight radial distance of approximately 200 μm from the cap’s borders, whereas the VS lenticules leave a relatively wider radial clearance of around 500 μm. Figure 7a illustrates that across both systems, the majority of diameter measurements—whether manual or automated—fall short of the expected values by about 500 μm. In Figure 7b, overall, the automatic approach resulted in ≈0.3 mm shallower lenticule diameter.
Overall, the regression analysis of combined B-scans, for both lenticule diameter and thickness, as seen in Figure 7b,d, demonstrates a reliable relationship between the automated and manual approaches.
The regression slopes rely on the 95% confidence interval where Figure 7d implies a stronger relationship between the manual and automated approaches. A higher degree of scattering is observed in the analysis of the VS B-scan, which may be attributed to the lower density of substructure formations in the VS system. The uncertainties in boundary identification, whether performed manually or automatically, likely contributed to the greater variability in the determinations. Previous reports have indicated that the VS system exhibits greater variation between intended and achieved lenticule thickness [52,53,54].
Considering Figure 7e,g, the characterization of cap thickness and diameter closely resembles the results in Figure 6. The dashed red line indicates the intended cap diameter target, and most measurements fall below this threshold. The cap thickness (via both approaches) deviations from the intended value are evident across all groups with some groups showing considerable variability and outliers. Figure 7f,h indicate poor correlation within both individual groups as well as when the data are combined. The regression in diameter falls strongly within the confidence interval across all B-scans, although approximately 750 μm variations from the regression can be seen in Figure 7f.
Figure 7h suggests that a linear relationship may not adequately capture the underlying correlation, particularly for the VS B-Scans (blue dots), where greater scatter is observed at higher values. However, considering the measurement uncertainty of approximately 20 μm due to bubbles’ extent, an overlap between the two approaches can be perceived. Statistically, these results underscore the necessity for additional experiments to more comprehensively elucidate the underlying correlations. The variability observed across the groups highlights the difficulty in achieving consistent outcomes.
Associating to all measurements, biological variability such as edema stages further complicates OCT analysis and may lead to variability on assessments. Corneal edema, which varies between instances and even across different time points for the same instance, can alter the cornea’s (intrastromal) properties and reduce the clarity of the scanned image. This swelling can obscure landmarks, leading to the inaccurate identification of boundaries.
Moreover, the variability between ophthalmic femtosecond laser systems is another critical aspect to consider. These systems, though instantiated with similar parameters, differ in laser delivery and pulse frequency, which can lead to differences in how the cuts are created and recognized. For example, variations in how the laser interacts with the corneal tissue can affect the precision of cuts, particularly at the extremities. Even minor discrepancies in how these lasers operate may result in subtle yet significant differences in the dimensions and geometry. Despite these challenges, the algorithm demonstrates robustness and universality across both systems.
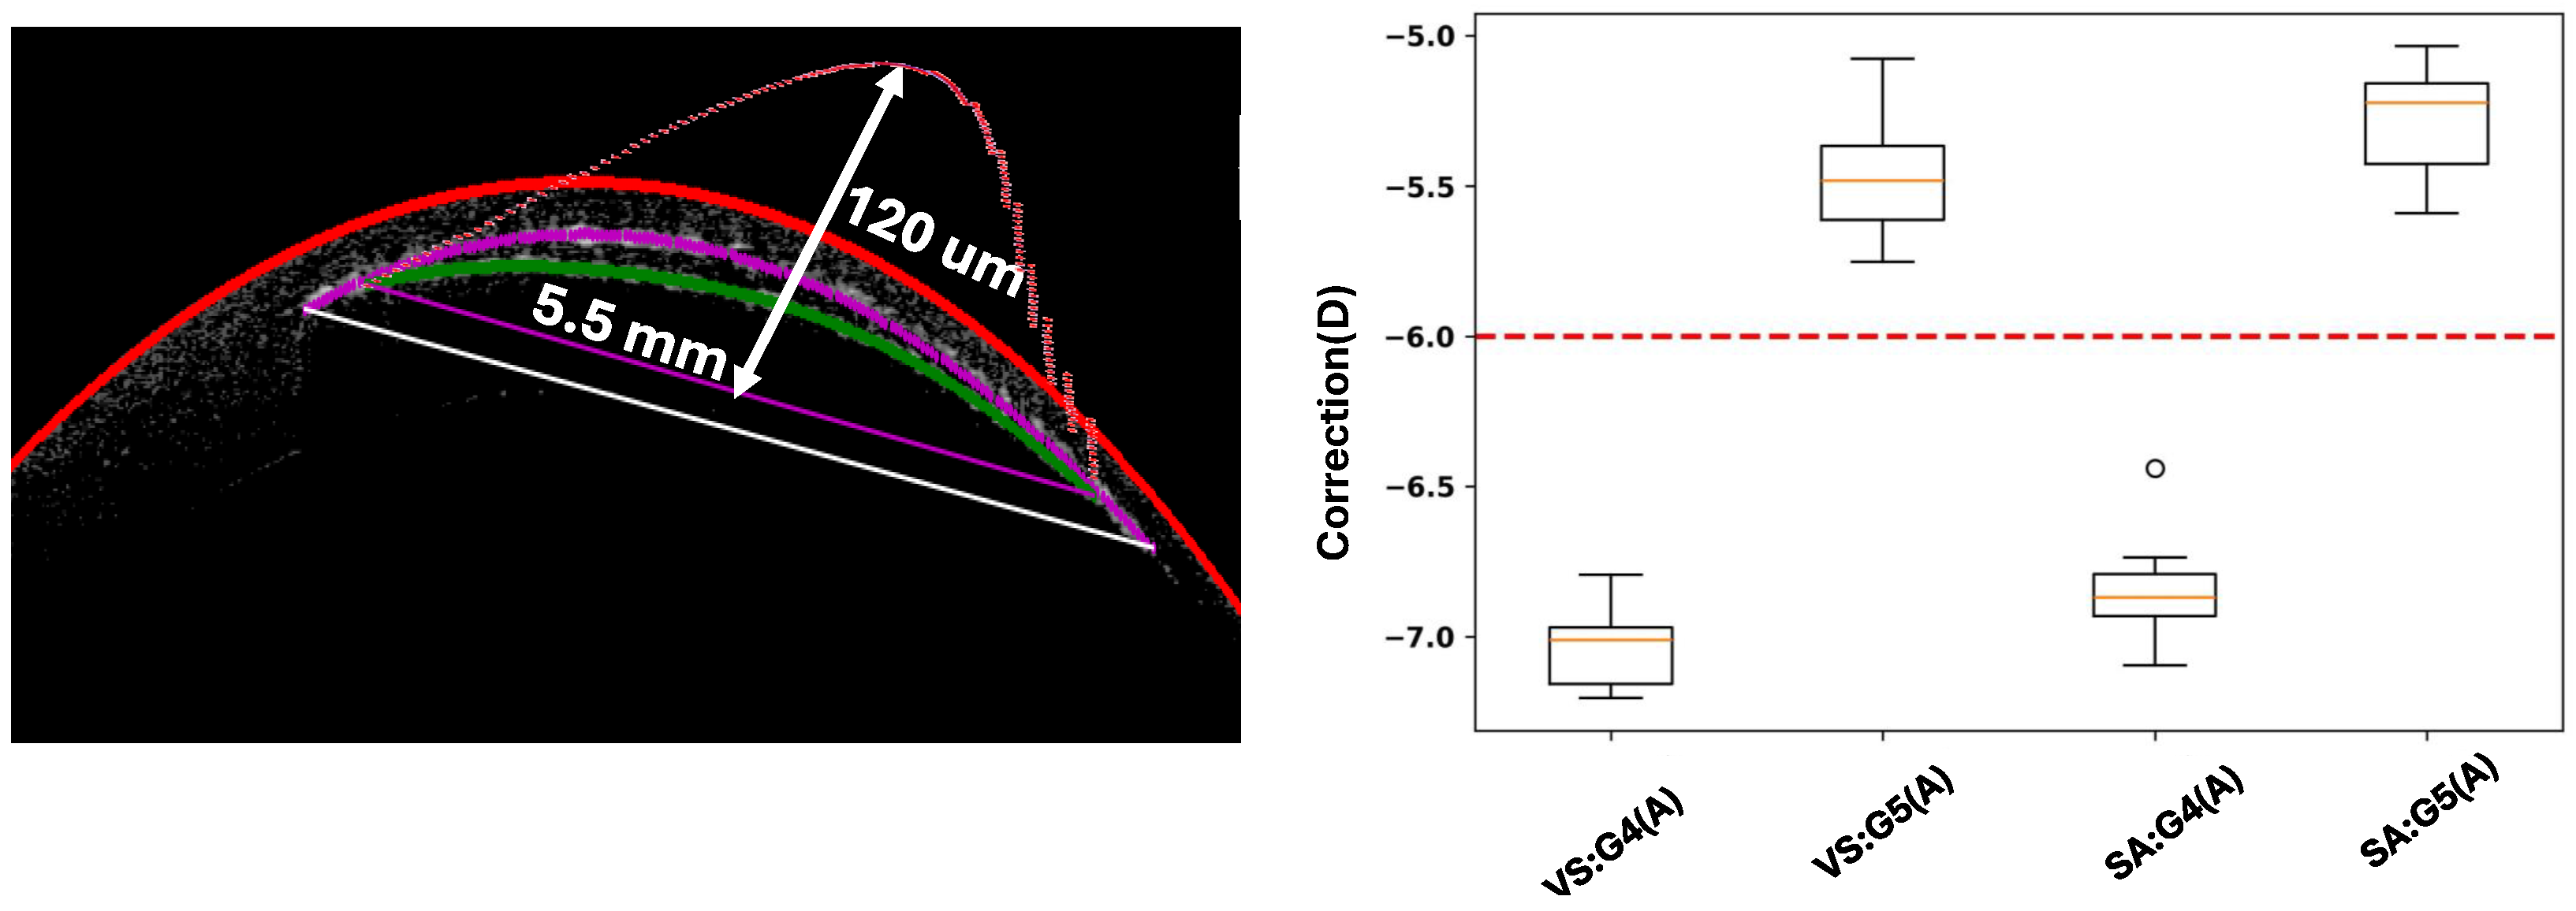
Since the automated approach can scan the thickness profile across the entire extent of the lenticule, the lenticule power can be calculated as follows,
O p t i c a l   P o w e r ( C o r r e c t i o n ) = ( n m e d i u m 1 ) · T e f f 2 · R e f f 2
where n m e d i u m is the refractive index of the goat eye, and T e f f and R e f f are the effective lenticule thickness and radius. The restriction of the semi-automated approach to the central points hinders the calculation of the optical powers. The automated thickness profile scanning offers a significant advantage by enabling a canonical modeling of the thickness profile, which provides the effective thickness ( T e f f ). Utilizing the effective thickness and diameter results in a more reliable determination of the lenticule optical power (correction).
Both datasets for lenticule cuts exhibited nearly identical refractive corrections with an approximate 1 D over-correction observed in the first dataset of each system. Meanwhile, a 0.6 D under-correction was noted in the other groups across both systems (see Figure 8). This consistency was not achieved through manual measurements despite using an identical system setup and ambient conditions. The coincidence observed in Figure 8 is likely attributed to the small cohort size and does not indicate systematic observations. To draw definitive conclusions about the presence of a stronger correlation or the repeated emergence of this coincidence, a larger cohort is essential.
The observations in Figure 6 and Figure 7 potentially support the generalization of the proposed approach, across different laser systems, to characterize intrastromal substructures within a clinically reliable confidence interval.
Advanced OCT optical systems [55] have the potential to enable wide-area segmentation. However, commercial OCTs often do no provide reliable automated segmentation, which is likely due to the complexity and variability of treatment-induced structures that must be accounted for. Semi-manual approaches, such as those used in MS-39 devices, are at best semi-quantitative, relying heavily on large-scale interpolation, which limits their precision and consistency.
Our proposed method has already been applied to intrastromal cuts generated by a single femtosecond system (ATOS) in two distinct clinical applications—flaps and lenticules—analyzed using B-scans from two different AS-OCT systems (Thorlabs OCT MS-39) [29]. This work extends the application to cuts produced by two different femtosecond systems (Visumax 500 and ATOS) in bovine corneas, also for both flap and lenticule procedures, which were analyzed using B-scans from a specific AS-OCT system (MS-39). This further supports the robustness and universal applicability of the algorithm pipeline. By incorporating multiple factors to characterize intrastromal cuts, whether created by different femtosecond lasers or captured using various AS-OCT imaging systems, the proposed approach demonstrates its broad clinical relevance.
Additionally, since our approach realizes the characterization of 2D OCT image stacks, 3D models of intrastromal substructures as well as complementary determinations like corneal anterior K-reading can be investigated. Also, different models of polynomials such as [56,57,58,59] can be employed to thoroughly describe the anterior surfaces and associated aberrations.
It is important to recognize that while the current analysis reveals distinct trends in the regression coefficients, the available dataset is limited. During the preprocessing phase, partial incompleteness and faint traces of intrastromal cuts—both flaps and lenticules—were observed. These discrepancies are likely due to variability in the femtosecond laser performance, which may have resulted in inconsistencies in the precision and depth of the cuts. Such issues additionally prompted the exclusion of certain data points, as illustrated in Figure 9.
To quantify the adequateness of sample size, a statistical power analysis was conducted using a two-sample t-test design. Assuming a medium effect size of 0.7 (medium Cohen’s d), a significance level of α = 0.05 , and a desired power of 0.70, the analysis indicated that 25 images per group would be required. Including this statistical power analysis clarifies that the sample size is nearly sufficient for minimizing the risk of Type I I errors (i.e., failing to detect a reality). The power analysis follows standard methods as detailed by [60,61,62]. Even so, this study particularly targets the generalizability of the algorithm across two different femtosecond lasers and does not draw a borderline to differentiate between these two systems.
Additional data, which will be the focus of future studies, are necessary to provide a more robust statistical foundation and to uncover any potential subtleties in the measurement relationships. Expanding the dataset will potentially validate the observed trends and improve the generalizability of the conclusions.
We note that this level of analysis, whether through limited datasets or not, was not achievable using current semi-automated approaches due to restriction to the central point measurements and the challenges of characterizing treatment-induced substructures. However, computational–deterministic methods can overcome the time-consuming barriers of manual measurements, offering new insights for analysis and delivering reliable results across a range of versatile instruments.
Despite observing that the agreement between the automated and manual measurements falls within an acceptable threshold, it is crucial to highlight that the automated determination remains inherently more reliable. The automated measurements exhibit no variation due to subjective factors, and the absence of operator bias ensures consistent precision. This stands in contrast to manual measurements, which are prone to human error, variability in interpretation, and slight deviations that can affect reproducibility. Thus, while both methods achieve comparable outcomes, the automated system provides a more robust and unbiased approach, which is particularly valuable in high-stakes clinical environments where precision is of importance.
Considering the inherent advantages of automated systems, it becomes evident that for even more reliable and consistent results, an optimized OCT capture routine must be established. As with any advanced technological tool, the precision of the automated system is closely tied to the quality and consistency of the data it receives. A standardized OCT acquisition protocol would not only minimize variabilities caused by factors but would also enhance the ability to deliver more stable outcomes. As the learning curve with such approach flattens, the introduction of a uniform capture routine would further elevate the reliability of automated measurements, ensuring the highest level of clinical accuracy and operational efficiency.
Although the algorithm has demonstrated reliable performance in diverse case analysis, it is important to note that clinical cases with highly irregular surfaces or age-related phenomena may introduce challenges. These changes may necessitate the tuning or recalibration of algorithmic parameters, including filtering thresholds and peak detection sensitivities.
A more comprehensive experimental setting, including simulations or tests of the algorithm on artificially swollen tissue, could provide valuable insights into its robustness against physiological variations. Although swelling predominantly affects the epithelium or anterior stroma, the present work focuses on intrastromal structures, such as lenticule cut segmentation, which are less susceptible to the impact of tissue swelling. While this investigation extends beyond the current scope, future studies will aim to explore these factors to further improve the algorithm’s adaptability to physiological variations.
Complementarily, as a laboratory study, the primary focus is on validating the geometry of corneal cuts prior to surgical intervention. By doing so, we can assess the isolated laser geometry without the influence of confounding factors related to surgical manipulation. The direct applications of our findings encompass the design and calibration of systems, as well as the evaluation of repeatability and reproducibility (accuracy and precision) of laser-generated substructures. This approach exploits the potential of OCT systems and extends the concepts presented in [22], moving beyond the 1 D single-point analysis to a more comprehensive evaluation in 2 D .

4. Conclusions

An universally applicable algorithm pipeline has been developed to discern treatment-induced substructures.
The proposed computational algorithm significantly speeds up characterizations, narrowing down processing time from several minutes to just a few seconds while maintaining high accuracy and delivering consistent results. After fine tuning the parameters on a small batch, the algorithm operates unsupervised across the entire dataset, effectively minimizing output variability.
This study highlights the potential benefits and feasibility of automated, deterministic geometric characterization of intrastromal cuts. However, it is not designed to provide definitive clinical conclusions based on the statistics presented.
By enhancing its ability to function across different femtosecond systems and imaging devices, this algorithm has the potential to streamline clinical workflows and improve the accuracy of substructure detection in various ophthalmic treatments. As the scope of future work, alongside sample size enrichment, further elaboration of the clinical feasibility, such as the robustness of the algorithm under different clinical conditions, and specific challenges of clinical application would reflect the practical impact of our proposed approach.
The adaptability of the pipeline makes it a valuable tool for future applications in refractive surgery and corneal imaging.

Author Contributions

Conceptualization, S.A.M. and M.M.; methodology, M.M., S.D. and S.A.M.; data preparation, S.V., P.K. and R.S.; investigation, P.K. and S.V.; writing, M.M. and S.D., review and editing, M.M., S.D., P.K., R.S. and S.A.M. All authors have read and agreed to the published version of the manuscript.

Funding

This research received no external funding.

Institutional Review Board Statement

Not applicable.

Informed Consent Statement

Not applicable.

Data Availability Statement

Data are contained within the article.

Guidelines and Standards Statement

Specimens used in this study were procured as a by-product from a local approved slaughter house, and the handling of these specimens were not part of the study, since eyes were enucleated post-mortem. The handling of the eyes followed the internal guidelines of the Institution reflecting Animal Care and Use. The study did not involve any live animal experimentation and used the ex vivo eyes as a suitable animal model. All procedures adhered to the principles of minimal impact on the animals.

Acknowledgments

Francesco Versaci from CSO, Italy is acknowledged for the invaluable contributions on data processing.

Conflicts of Interest

The authors declare no conflicts of interest.

Abbreviations

The following abbreviations are used in this manuscript:
OCToptical coherent tomography
SASCHWIND ATOS
VSZeiss VisuMax 500
CIconfidence interval
LDlenticule diameter
FDflap diameter
LTlenticule thickness
CTcap thickness
FTflap thickness

References

  1. Volkan Hurmeric, S.H.Y.; Mutlu, F.M. Optical coherence tomography in cornea and refractive surgery. Expert Rev. Ophthalmol. 2012, 7, 241–250. [Google Scholar] [CrossRef]
  2. Belin, M.W.; Khachikian, S.S.; McGhee, C.N.J.; Patel, D. New Technology in Corneal Imaging. Int. Ophthalmol. Clin. 2010, 50, 177–189. [Google Scholar] [CrossRef]
  3. Brass, R. Imaging for the Rest of Us OCT has many uses beyond imaging the macula, including following glaucoma patients and evaluating the anterior segment. Cataract. Refract. Surg. Today Eur. 2011, 79. Available online: http://crstodayeurope.com/wp-content/themes/crste/assets/downloads/crsteuro0511_tp_brass.pdf (accessed on 29 July 2024).
  4. Ventura, B.V.; Moraes, H.V., Jr.; Kara-Junior, N.; Santhiago, M.R. Role of Optical Coherence Tomography on Corneal Surface Laser Ablation. J. Ophthalmol. 2012, 2012, 676740. [Google Scholar] [CrossRef]
  5. Sridhar, M.S.; Martin, R. Anterior segment optical coherence tomography for evaluation of cornea and ocular surface. Indian J. Ophthalmol. 2018, 66, 367–372. [Google Scholar] [CrossRef] [PubMed]
  6. Eguchi, H.; Hotta, F.; Kusaka, S.; Shimomura, Y. Intraoperative Optical Coherence Tomography Imaging in Corneal Surgery: A Literature Review and Proposal of Novel Applications. J. Ophthalmol. 2020, 2020, 1497089. [Google Scholar] [CrossRef]
  7. Marschall, S.; Sander, B.; Mogensen, M.; Jørgensen, T.M.; Andersen, P.E. Optical coherence tomography—Current technology and applications in clinical and biomedical research. Anal. Bioanal. Chem. 2011, 400, 2699–2720. [Google Scholar] [CrossRef]
  8. Valdes, G.; Romaguera, M.; Serramito, M.; Cerviño, A.; Carracedo, G.G. OCT applications in contact lens fitting. Contact Lens Anterior Eye 2022, 45, 101540. [Google Scholar] [CrossRef]
  9. Alió, J.; Barrio, J. Atlas of Anterior Segment Optical Coherence Tomography; Essentials in Ophthalmology; Springer International Publishing: Cham, Switzerland, 2020. [Google Scholar]
  10. Chong, Y.; Azzopardi, M.; Hussain, G.; Recchioni, A.; Gandhewar, J.; Loizou, C.; Giachos, I.; Barua, A.; Ting, D. Clinical Applications of Anterior Segment Optical Coherence Tomography: An Updated Review. Diagnostics 2024, 14, 122. [Google Scholar] [CrossRef]
  11. Luo, S.; Holland, G.; Mikula, E.; Bradford, S.; Khazaeinezhad, R.; Jester, J.V.; Juhasz, T. Dispersion compensation for spectral domain optical coherence tomography by time-frequency analysis and iterative optimization. Opt. Contin. 2022, 1, 1117–1136. [Google Scholar] [CrossRef]
  12. Luo, S.; Mikula, E.R.; Khazaeinezhad, R.; Bradford, S.M.; Zhang, F.; Jester, J.V.; Juhasz, T. Evaluating the effect of pulse energy on femtosecond laser trabeculotomy (FLT) drainage channels in human cadaver eyes. Lasers Surg. Med. 2024, 56, 382–391. [Google Scholar] [CrossRef] [PubMed]
  13. Han, S.B.; Liu, Y.C.; Mohamed-Noriega, K.; Mehta, J.S. Application of Femtosecond Laser in Anterior Segment Surgery. J. Ophthalmol. 2020, 2020, 8263408. [Google Scholar] [CrossRef]
  14. Steinberg, J.; Mehlan, J.; Mudarisov, B.; Katz, T.; Frings, A.; Druchkiv, V.; Linke, S.J. Safety and Precision of Two Different Flap-morphologies Created During Low Energy Femtosecond Laser-assisted LASIK. J. Ophthalmic Vis. Res. 2023, 18, 3–14. [Google Scholar] [CrossRef]
  15. Gabric, I.; Bohac, M.; Gabric, K.; Arba Mosquera, S. First European results of a new refractive lenticular extraction procedure—SmartSight by SCHWIND eye-tech-solutions. Eye 2023, 37, 3768–3775. [Google Scholar] [CrossRef]
  16. Pradhan, K.R.; Arba Mosquera, S. Twelve-month outcomes of a new refractive lenticular extraction procedure. J. Optom. 2023, 16, 30–41. [Google Scholar] [CrossRef]
  17. Gurnani, B.; Kaur, K. Recent Advances in Refractive Surgery: An Overview. Clin. Ophthalmol. 2024, 18, 2467–2472. [Google Scholar] [CrossRef]
  18. Zeppieri, M.; Marsili, S.; Enaholo, E.S.; Shuaibu, A.O.; Uwagboe, N.; Salati, C.; Spadea, L.; Musa, M. Optical Coherence Tomography (OCT): A Brief Look at the Uses and Technological Evolution of Ophthalmology. Medicina 2023, 59, 2114. [Google Scholar] [CrossRef]
  19. Garcia Marin, Y.F.; Alonso-Caneiro, D.; Vincent, S.J.; Collins, M.J. Anterior segment optical coherence tomography (AS-OCT) image analysis methods and applications: A systematic review. Comput. Biol. Med. 2022, 146, 105471. [Google Scholar] [CrossRef]
  20. Nguyen, T.; Ong, J.; Masalkhi, M.; Waisberg, E.; Zaman, N.; Sarker, P.; Aman, S.; Lin, H.; Luo, M.; Ambrosio, R.; et al. Artificial intelligence in corneal diseases: A narrative review. Contact Lens Anterior Eye 2024, 47, 102284. [Google Scholar] [CrossRef]
  21. Luo, S.; Holland, G.; Khazaeinezhad, R.; Bradford, S.; Joshi, R.; Juhasz, T. Iridocorneal angle imaging of a human donor eye by spectral-domain optical coherence tomography. Sci. Rep. 2023, 13, 13861. [Google Scholar] [CrossRef]
  22. Lwowski, C.; Voigt, A.; Van Keer, K.; Kohnen, T. Corneal Lenticule Creation Using a New Solid-State Femtosecond Laser Measured by Spectral Domain OCT in a Porcine Eye Model. Transl. Vis. Sci. Technol. 2022, 11, 20. [Google Scholar] [CrossRef] [PubMed]
  23. Latz, C.; Asshauer, T.; Rathjen, C.; Mirshahi, A. Femtosecond-Laser Assisted Surgery of the Eye: Overview and Impact of the Low-Energy Concept. Micromachines 2021, 12, 122. [Google Scholar] [CrossRef] [PubMed]
  24. Heisterkamp, A.; Mamom, T.; Kermani, O.; Drommer, W.; Welling, H.; Ertmer, W.; Lubatschowski, H. Intrastromal refractive surgery with ultrashort laser pulses: In vivo study on the rabbit eye. Graefe’s Arch. Clin. Exp. Ophthalmol. 2003, 241, 511–517. [Google Scholar] [CrossRef] [PubMed]
  25. Reinstein, D.Z.; Archer, T.J.; Randleman, J.B. Small incision lenticule extraction (SMILE) history, fundamentals of a new refractive surgery technique and clinical outcomes. Eye Vis. 2014, 1, 3. [Google Scholar] [CrossRef]
  26. Vestergaard, A.H.; Ivarsen, A.; Asp, S.; Hjortdal, J. Femtosecond Lenticule Extraction (FLEx): Clinical Results, Interface Evaluation, and Intraocular Pressure Variation. Investig. Ophthalmol. Vis. Sci. 2017, 53, F327–F332. [Google Scholar] [CrossRef]
  27. Hjortdal, J.; Ivarsen, A. New Developments in the Lenticule Extraction Procedure. US Ophthalmic Rev. 2014, 7, 20–25. [Google Scholar] [CrossRef]
  28. Wexler, S.A.; Hall, B. The Accuracy of Flap Thickness and Diameter in LASIK Using a Femtosecond Laser. Clin. Ophthalmol. 2023, 17, 3877–3882. [Google Scholar] [CrossRef]
  29. Mehrjoo, M.; Pacuraru, A.; Krueger, L.; Beck, F.; Konrad, D. Perioperative Intrastromal Corneal Segmentation after creation of corneal cuts based on Laser Induced Optical Breakdown: A Perspective Study. Manuscript submitted for publication.
  30. Thorlabs China. GAN111, 2024. Available online: https://www.thorlabs.com/newgrouppage9.cfm?objectgroup_id=8214 (accessed on 29 July 2024).
  31. Arba Mosquera, S.; Naubereit, P.; Sobutas, S.; Verma, S. Analytical optimization of the cutting efficiency for generic cavitation bubbles. Biomed. Opt. Express 2021, 12, 3819–3835. [Google Scholar] [CrossRef]
  32. Dishler, J.; Ziebarth, N.M.; Spooner, G.J.R.; Hjortdal, J.; Yoo, S.H. Evaluating Corneal Cut Surface Quality in SMILE. In Small Incision Lenticule Extraction (SMILE): Principles, Techniques, Complication Management, and Future Concepts; Sekundo, W., Ed.; Springer International Publishing: Cham, Switzerland, 2015; pp. 169–177. [Google Scholar] [CrossRef]
  33. Kristan, J.; Kang, J.J. Neurotrophic keratopathy and refractive surgery. Curr. Opin. Ophthalmol. 2021, 32, 315–318. [Google Scholar] [CrossRef]
  34. Darzi, S.; Arba Mosquera, S.; Pradhan, K.; Forster, A.; Dick, B.; Taneri, S. Refractive Coupling Effects in Keratorefractive Lenticule Extraction Procedures: A Machine Learning-Assisted Approach. J. Refract. Surg. 2024, 40, e706–e715. [Google Scholar] [CrossRef]
  35. Tomasi, C.; Manduchi, R. Bilateral filtering for gray and color images. In Proceedings of the Sixth International Conference on Computer Vision (IEEE Cat. No.98CH36271), Bombay, India, 7 January 1998; pp. 839–846. [Google Scholar] [CrossRef]
  36. Tolimieri, R.; Lu, C.; An, M. Algorithms for Discrete Fourier Transform and Convolution; Springer: Cham, Switzerland, 1997. [Google Scholar]
  37. Gogola, A.; Jan, N.J.; Lathrop, K.L.; Sigal, I.A. Radial and Circumferential Collagen Fibers Are a Feature of the Peripapillary Sclera of Human, Monkey, Pig, Cow, Goat, and Sheep. Investig. Ophthalmol. Vis. Sci. 2018, 59, 4763–4774. [Google Scholar] [CrossRef] [PubMed]
  38. Vestri, G.; Versaci, F.; Savini, G. CSO MS-39: Principles and Applications. In Intraocular Lens Calculations; Aramberri, J., Hoffer, K.J., Olsen, T., Savini, G., Shammas, H.J., Eds.; Springer International Publishing: Cham, Switzerland, 2024; pp. 431–442. [Google Scholar] [CrossRef]
  39. LoPinto, A.; Pirie, C.; Bedenice, D.; Ayres, S. Corneal thickness of eyes of healthy goats, sheep, and alpacas manually measured by use of a portable spectral-domain optical coherence tomography device. Am. J. Vet. Res. 2017, 78, 80–84. [Google Scholar] [CrossRef] [PubMed]
  40. Radhika, R.; Mahajan, R. An adaptive optimum weighted mean filter and bilateral filter for noise removal in cardiac MRI images. Meas. Sens. 2023, 29, 100880. [Google Scholar] [CrossRef]
  41. Li, R. An optimal algorithm for bilateral filtering. J. Phys. Conf. Ser. 2023, 2634, 012030. [Google Scholar] [CrossRef]
  42. Paris, S. A gentle introduction to bilateral filtering and its applications. In Proceedings of the ACM SIGGRAPH 2007 Courses (SIGGRAPH ’07), San Diego, CA, USA, 5–9 August 2007; Association for Computing Machinery: New York, NY, USA, 2007; p. 3-es. [Google Scholar] [CrossRef]
  43. Gabiger-Rose, A.; Kube, M.; Schmitt, P.; Weigel, R.; Rose, R. Image denoising using bilateral filter with noise-adaptive parameter tuning. In Proceedings of the IECON 2011—37th Annual Conference of the IEEE Industrial Electronics Society, Melbourne, VIC, Australia, 7–10 November 2011; pp. 4515–4520. [Google Scholar] [CrossRef]
  44. SciPy. 2024. Available online: https://docs.scipy.org/doc/scipy/reference/generated/scipy.signal.find_peaks.html (accessed on 1 October 2024).
  45. Cox, B.; van der perre, L.; Wielandt, S.; Ottoy, G.; De Strycker, L. High precision hybrid RF and ultrasonic chirp-based ranging for low-power IoT nodes. EURASIP J. Wirel. Commun. Netw. 2020, 2020, 187. [Google Scholar] [CrossRef]
  46. Okoye, K.; Hosseini, S. Regression Analysis in R: Linear Regression and Logistic Regression. In R Programming: Statistical Data Analysis in Research; Springer Nature: Singapore, 2024; pp. 131–158. [Google Scholar] [CrossRef]
  47. Nair, P.; Chaudhury, K.N. Fast High-Dimensional Kernel Filtering. IEEE Signal Process. Lett. 2019, 26, 377–381. [Google Scholar] [CrossRef]
  48. Canny, J.F. A Computational Approach to Edge Detection. IEEE Trans. Pattern Anal. Mach. Intell. 1986, PAMI-8, 679–698. [Google Scholar] [CrossRef]
  49. Lindeberg, T. Scale-Space Theory in Computer Vision; The Springer International Series in Engineering and Computer Science; Springer: New York, NY, USA, 1994. [Google Scholar] [CrossRef]
  50. Wahba, G. Spline Models for Observational Data; CBMS-NSF Regional Conference Series in Applied Mathematics; Society for Industrial and Applied Mathematics (SIAM): Philadelphia, PA, USA, 1990; Volume 59, p. 169. [Google Scholar] [CrossRef]
  51. Kehrer, T.; Mosquera, S.A. A simple cornea deformation model. Adv. Opt. Technol. 2021, 10, 433–450. [Google Scholar] [CrossRef]
  52. Osman, I.M.; Madwar, A.Y. Scanning electron microscopy of human corneal lenticules at variable corneal depths in small incision lenticule extraction cases. Delta J. Ophthalmol. 2016, 17, 109–113. [Google Scholar] [CrossRef]
  53. Zhou, J.; Zhang, Y.; Li, M.; Sun, L.; Zhou, X. Predictability of the Achieved Lenticule Thickness in Small Incision Lenticule Extraction for Myopia Correction. Eye Contact Lens Sci. Clin. Pract. 2018, 44, S410–S413. [Google Scholar] [CrossRef]
  54. Bohač, M.; Gabrić, I.; Gabrić, K.; Jagić, M.; Arba Mosquera, S. Predictability of the Achieved Lenticule Thickness in Keratorefractive Lenticule Extraction for Myopia Correction. J. Refract. Surg. 2023, 39, 728–735. [Google Scholar] [CrossRef] [PubMed]
  55. Beer, F.; Wartak, A.; Pircher, N.; Holzer, S.; Lammer, J.; Schmidinger, G.; Baumann, B.; Pircher, M.; Hitzenberger, C.K. Mapping of Corneal Layer Thicknesses With Polarization-Sensitive Optical Coherence Tomography Using a Conical Scan Pattern. Investig. Ophthalmol. Vis. Sci. 2018, 59, 5579–5588. [Google Scholar] [CrossRef] [PubMed]
  56. Gatinel, D.; Rampat, R.; Dumas, L.; Malet, J. An Alternative Wavefront Reconstruction Method for Human Eyes. J. Refract. Surg. 2020, 36, 74–81. [Google Scholar] [CrossRef] [PubMed]
  57. Mehrjoo, M.; Gatinel, D.; Malet, J.; Arba Mosquera, S. A Closed-Form Analytical Conversion between Zernike and Gatinel–Malet Basis Polynomials to Present Relevant Aberrations in Ophthalmology and Refractive Surgery. Photonics 2024, 11, 883. [Google Scholar] [CrossRef]
  58. Langenbucher, A.; Szentmáry, N.; Cayless, A.; Wendelstein, J.; Hoffmann, P. Technical variability of cornea parameters derived from anterior segment OCT fitted with Fringe Zernike polynomials. Graefe’s Arch. Clin. Exp. Ophthalmol. 2024, 262, 505–517. [Google Scholar] [CrossRef]
  59. Wang, J.; Li, X.; Wang, Z.; Davey, P.G.; Li, Y.; Yang, L.; Lin, M.; Zheng, X.; Bao, F.; Elsheikh, A. Accuracy and reliability of orthogonal polynomials in representing corneal topography. Med. Nov. Technol. Devices 2022, 15, 100133. [Google Scholar] [CrossRef]
  60. Connor, R.J. Sample Size for Testing Differences in Proportions for the Paired-Sample Design. Biometrics 1987, 43, 207–211. [Google Scholar] [CrossRef]
  61. Cohen, J. Statistical Power Analysis for the Behavioral Sciences, 2nd ed.; Routledge: New York, NY, USA, 1988. [Google Scholar] [CrossRef]
  62. Gibson, E.; Hu, Y.; Huisman, H.J.; Barratt, D.C. Designing image segmentation studies: Statistical power, sample size and reference standard quality. Med. Image Anal. 2017, 42, 44–59. [Google Scholar] [CrossRef]
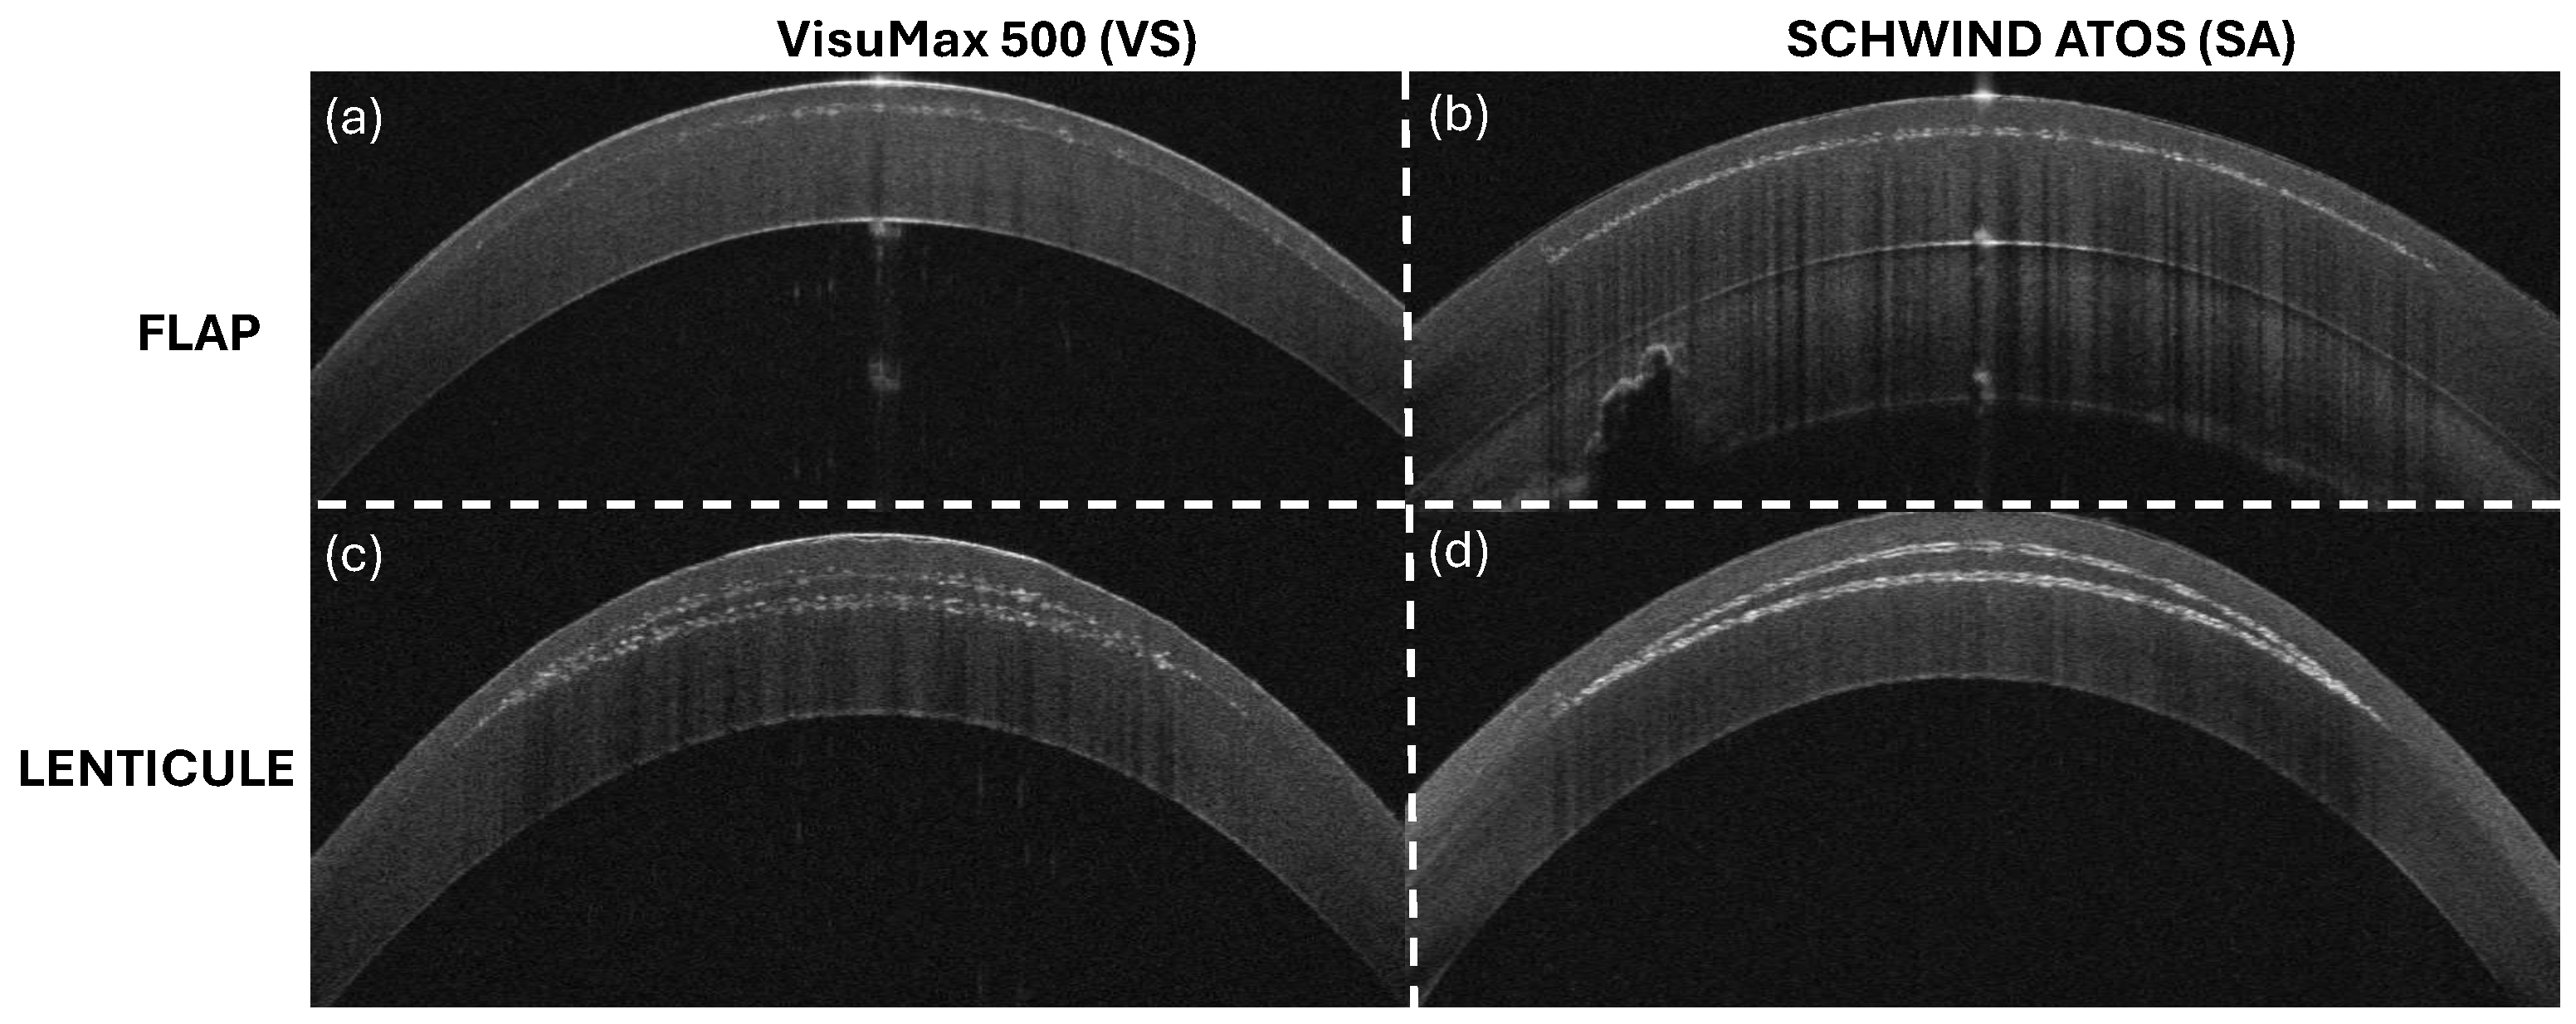
Figure 1. (a,c) Present intrastromal cuts created with VS and (b,d) are the SA counterparts.
Photonics 11 01123 g001
Figure 2. Geometric parameters of flap (left) and lenticule (right) cuts to measure manual and automated.
Photonics 11 01123 g002
Figure 3. (a) Raw OCT image of instrastromal lenticule OCT capture, and (b) corresponding image after applying the denoising filter on (a).
Photonics 11 01123 g003
Figure 4. (a) Discriminator (red solid line) used to separate anterior and posterior layers of lenticule cuts with detected peaks shown by blue dots. (b) Boundaries of posterior cuts are determined using a convolution kernel with κ = 4 and a threshold of 0.6 across all lenticule OCT images from both systems.
Photonics 11 01123 g004
Figure 5. Illustration of intrastromal cut segmentations (generated by the VS and SA) using the proposed method applied to the captured (ex vivo) OCT images using a SCHWIND MS-39 diagnostic device. White lines discern the extent of caps and purple lines the lenticules.
Photonics 11 01123 g005
Figure 6. (a,c) Provide an overview of flap diameter and thickness measurements obtained from both systems (VS−SA) applying the automated (A) and manual (U) approaches. The red dashed lines indicate the intended values of 8.5 mm for diameter and 120 μm for thickness. (b,d) illustrate the correlation between the automated and manual measurements across the entire dataset (combined data from both systems) represented in (a,c).
Photonics 11 01123 g006
Figure 7. (a,c) Represent the determined characteristics of the lenticule substructures across both systems through the manual and automatic approaches. (b,d) illustrate the global correlation between the manual and automated measurements across all B-scans corresponding to (a,c). (eh) represents the overview of cap thickness measurements and the underlying statistics. The red dashed lines are 7.5 mm and 120 μm for (e,g), correspondingly. Both measurement approaches reflect thicker caps and shorter diameters across all datasets.
Photonics 11 01123 g007
Figure 8. The automated approach allows obtaining a scan profile thickness which enables the calculation of lenticule optical power given the effective diameter (left panel). The red dotted line presents the thickness profile across the lenticule cord. The calculated spherical manifest reveals a ≈ 0.8 D discrepancy across both systems compared with the intended 6 D (right panel).
Photonics 11 01123 g008
Figure 9. Instances of OCT image exclusion from analysis due to weak trace (a) and incomplete cut (b).
Photonics 11 01123 g009
Table 1. Systems’ parameters.
ParametersVSSA
Energy (anterior and posterior cuts) [nJ]115115
Interspot distance [μm]4.54.5
Track distance [μm]4.54.5
Vacuum [mmHg]585250
Table 2. Intended geometries.
ParametersLenticuleFlap
Lenticule optical zone diameter [mm] 6.3
Cap diameter [mm] 7.5 8.5
Cap thickness [μm]120120
Spherical correction [D] 6
Disclaimer/Publisher’s Note: The statements, opinions and data contained in all publications are solely those of the individual author(s) and contributor(s) and not of MDPI and/or the editor(s). MDPI and/or the editor(s) disclaim responsibility for any injury to people or property resulting from any ideas, methods, instructions or products referred to in the content.