1. Introduction
Flow rate measurement in real time plays an important role in the field of biochemistry, vascular medicine, pipeline monitoring, etc. Recently, fiber-optic flow sensors [
1,
2,
3] based on various principles have been investigated owing to their distinctive advantages, such as tiny size, high sensitivity and accuracy, corrosion resistance, and, especially, immunity to electromagnetic interference. The multimode fiber detection method [
4,
5] achieves rapid measurements of flow through noninvasive detection. With its cost-effective hardware design (<2000 USD), the detection system will be tested in clinical studies in the near future. On the contrary, the system needs to improve the anti-environment disturbance ability, the time for generating output beam profile and flow resolution. The fiber-optic hot-wire anemometer (HWA) is one of the most well-known methods for sensing the flow rate, in which microfiber Bragg grating (μFBG) [
6], a pair of fiber Bragg gratings (FBGs) [
7], or tilted fiber Bragg grating (TFBG) [
8] are often applied and doped with high-light-absorption materials, which can enhance thermal conversion. However, a complex manufacturing system and high-power dissipation are regarded as the main drawbacks to be overcome in this method. In addition, the inhomogeneous thermal effect causing chirp [
9] and the cross-sensitivity of FBG also strongly hinder its development and application.
The fiber Fabry–Perot interferometer (FFPI) is an appropriate sensor, which has been widely developed to measure blood pressure [
10], displacement [
11], temperature [
12], liquid surface tension [
13], acoustic vibration [
14], refractive index [
15], and hydrogen detection [
16] in the physical and biochemical research fields. Presently, some researchers pay attention to flow-field sensing to extend the application fields of the fiber-optic FPI sensors [
17]. To achieve a precise flow rate signal directly, some FP-based mechanical flow sensors consisting of moving structures are made, such as a cantilever, spring, and diaphragm, which are essentially sensitive to pressure. C. Wang et al. embedded fiber-optical anemometers based on dual F-P sensors inside a designed cubic holder by 3D printing, with a streamlined upper surface, and proved an airflow velocity measurement range from 20.39 m
3/h to 209.03 m
3/h [
18]. Y. Liu et al. proposed a differential-pressure optical-fiber anemometer based on Fabry–Perot interferometry coupled with a Pitot tube for air flow velocity measurements over a range of 737.28∼43,956.66 m
3/h in a wind tunnel [
19]. Nevertheless, the complexity of real-time liquid flow detection has not been determined, limited by sensor size in the pipeline microchannel. To ensure the stability of the flow field, the size of implantable flowmeters is no more than one-tenth of the pipe inner diameter [
20]. The aforementioned FPI flow sensors are both millimeter size, and it is worth noting that FPI flowmeters in the hundreds of microns range are rarely mentioned. In addition, fiber-optic FPI sensors manufactured using the adhesive process have poor stability, possibly due to water penetration. Moreover, the flow rates measured by FPI flowmeters under variable temperature can be hugely problematic for signal decoupling.
In this study, we put forward a fiber-optic all-silica liquid flowmeter based on Fabry–Perot interferometry with a size of 140 µm. The FPI flowmeter can be developed to transduce flow rate, with an ultra-wide dynamic range from 0 mL/min to 90 mL/min and a resolution of 1.08 mL/min, which is 1.2% of the full scale, in hundreds of milliseconds as a quick response. The quadratic functional relation between dip wavelength shift and flow rate is verified by the flow calibration curves of the FPI flowmeter and the highest sensitivity of the FPI flowmeter with a 1.5 µm thick membrane is 87.95 pm/mL/min when the flow rate is 90 mL/min. Last, but not least, the effective temperature compensation is demonstrated by connecting an FBG temperature sensor for a variable temperature flow detection, and the measured error is reduced by nearly 25-times.
2. Sensor Design and Principle
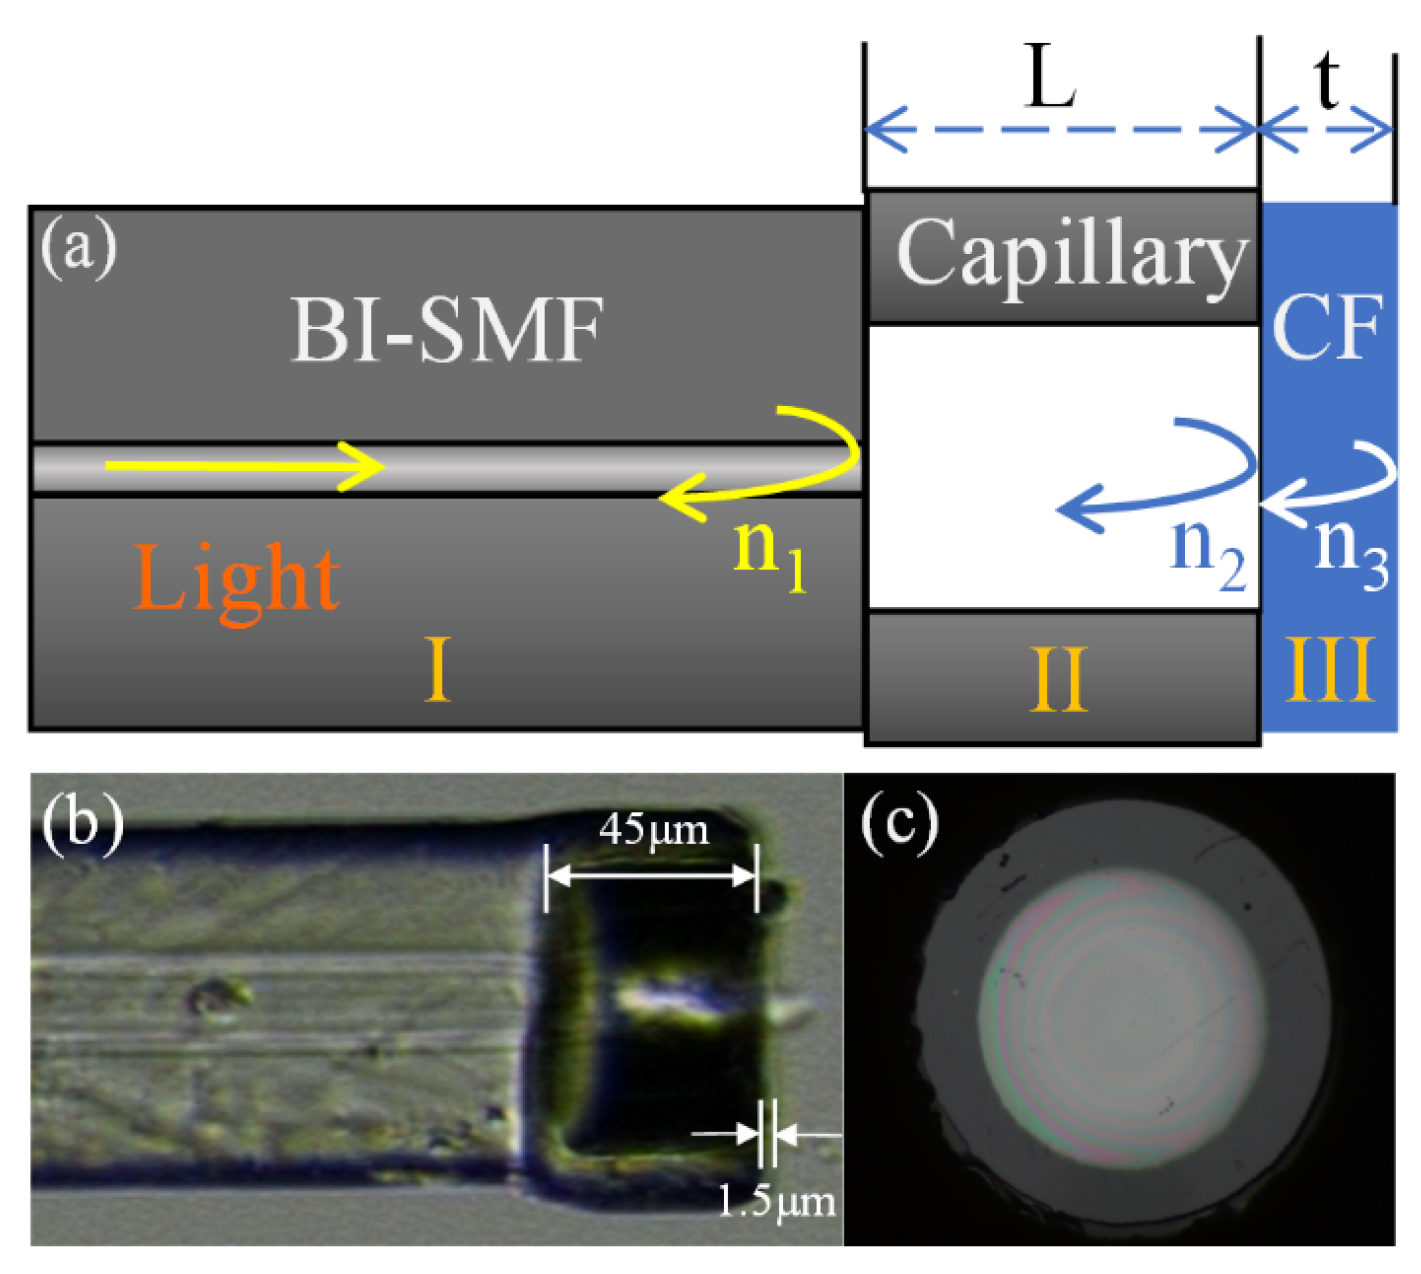
A schematic diagram and optical microscope images of the diaphragm-based optofluidic flowmeter are shown in
Figure 1. The sensor consists of a bend-insensitive single-mode fiber (BI-SMF), a standard fused-silica capillary, and a coreless fiber (CF). Compared to a single-mode fiber (SMF), the coreless fiber has more uniform distribution of silicon oxide without germanium doping, which can ensure a uniform reduction in the monoblock diaphragm during the polishing and etching processes. Primarily, a part of the fused-silica capillary with an inner diameter of 100 µm was fusion spliced with a bend-insensitive single-mode fiber with a core diameter of 8.9 µm. The outer diameter of the fused-silica capillary tube is 140 µm, which is larger than that of BI-SMF. Thus, instead of a commercial fusion splicer, a computer-controlled CO
2 laser system was used for fusion splicing. In the second step, to ensure the flatness of the capillary end face and the accuracy of the remaining capillary length, a multifunctional femtosecond laser platform was applied to cut off the capillary with a 50× microscope [
21]. Similarly, following the previous two steps, a fraction of the coreless fiber was fusion spliced with the remaining capillary, and the pigtail was cut off. Meanwhile, the FPI structure of an air cavity was constituted, and the coreless fiber was regarded as the end of FPI. In order to acquire a thin film of FPI, a self-developed fiber polishing machine was employed to reduce the diaphragm thickness. While the diaphragm thickness was gradually decreased to less than 3 µm by precise control and optimization of the polish parameters based on speed, pressure, and time, distinct concentric rings appeared, which are the interference fringes of the inner and outer membrane surfaces under illumination. As exhibited in
Figure 1c, the air gap is not uniform, but it will not significantly affect the reading and repeatability based on the measurement results. In the future, the quality of the air gap will be improved through low-power fusion splicing with rotating fibers. Then, through buffered hydrofluoric acid (BHF) etching, a thinner silica diaphragm can be formed [
22].
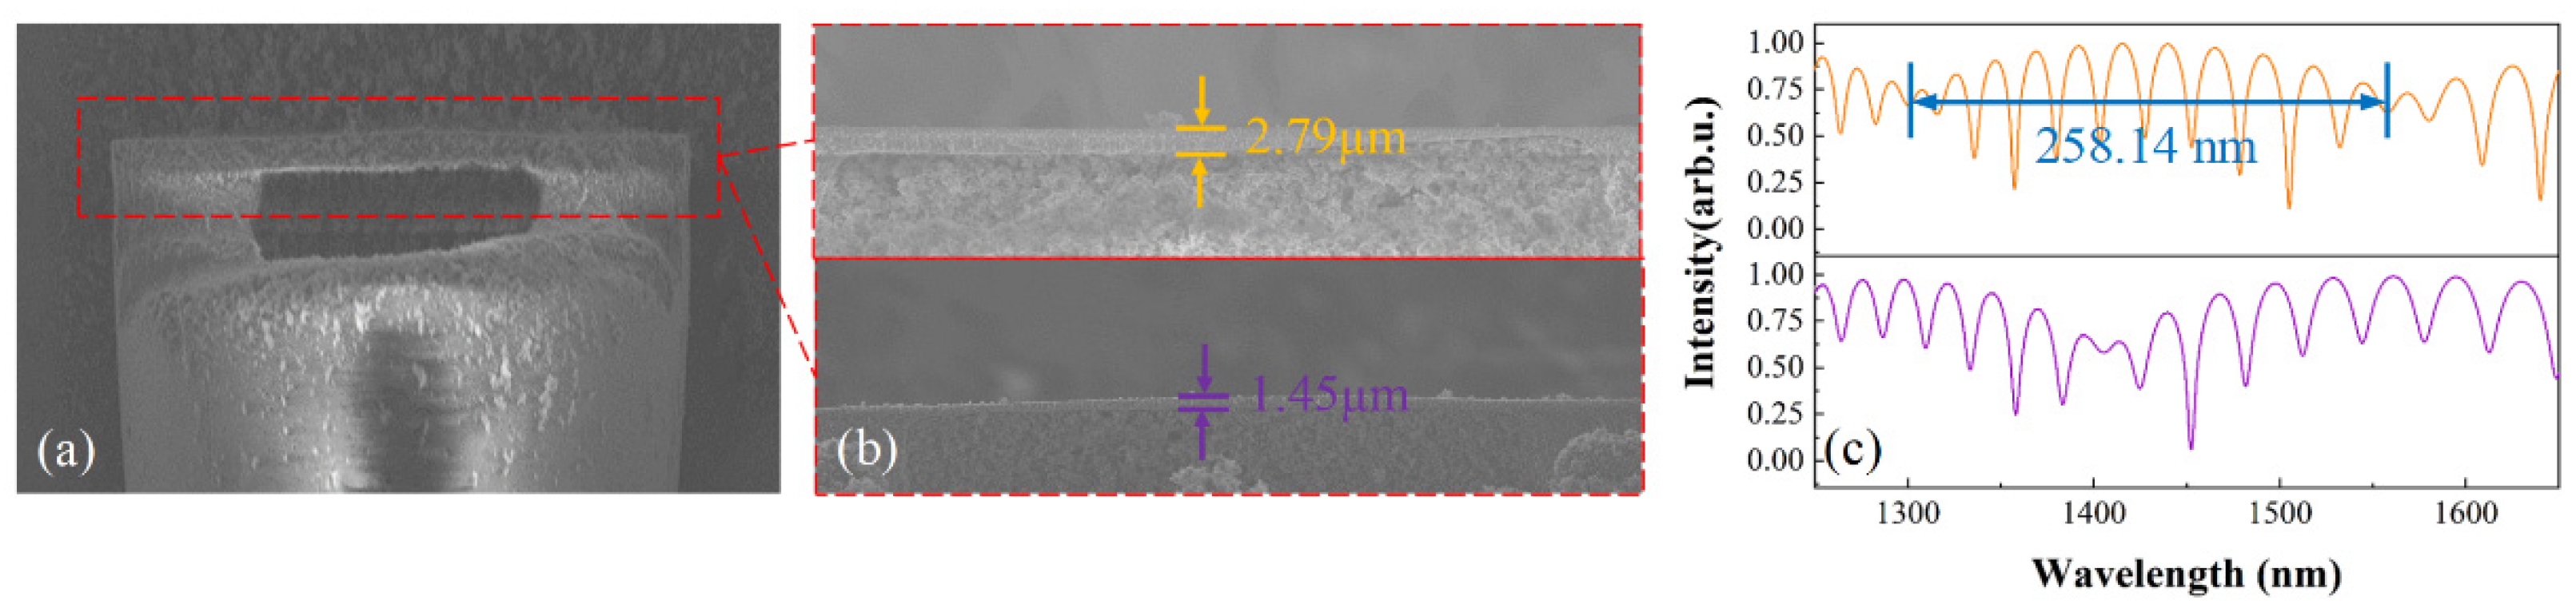
For the sake of sensor consistency, it is necessary to monitor its diaphragm thickness during the fabrication process. The FPI air cavity was cut open by a femtosecond laser to obtain a side-view scanning electron microscope (SEM) image of the silica film, as indicated in
Figure 2a. As displayed in
Figure 2b, and the enlarged image in
Figure 2a, the different thicknesses of the silica diaphragm are 2.79 μm and 1.45 μm, and the corresponding reflection spectra are shown in
Figure 2c. As can be clearly seen in the reflection spectrum, a tri-beam interference approximation causes continuous interference fringes, modulated by a large spectral envelope, corresponding to the interference of the inner and outer surfaces of the thin silica film. The total reflected intensity can be expressed as follows [
23]
where
E1,
E2,
E3 are the amplitudes of three reflected light, respectively.
L is the length of capillary air cavity,
t is the thickness of the silica film at the head of the fiber,
λ is the wavelength of incident light, and
nair and
nsilica indicate the refractive index of air and silica. The silica diaphragm thickness can be calculated by
where
λn is the dip wavelength of the spectral envelope. Using Equation (2) in
Figure 2c, the length of the spectral envelope is 258.14 nm, and the silica diaphragm thickness is shown to be 2.71 μm. As shown in
Figure 2b, the corresponding diaphragm thickness in the SEM diagram is 2.79 μm in accordance with the spectral calculation.
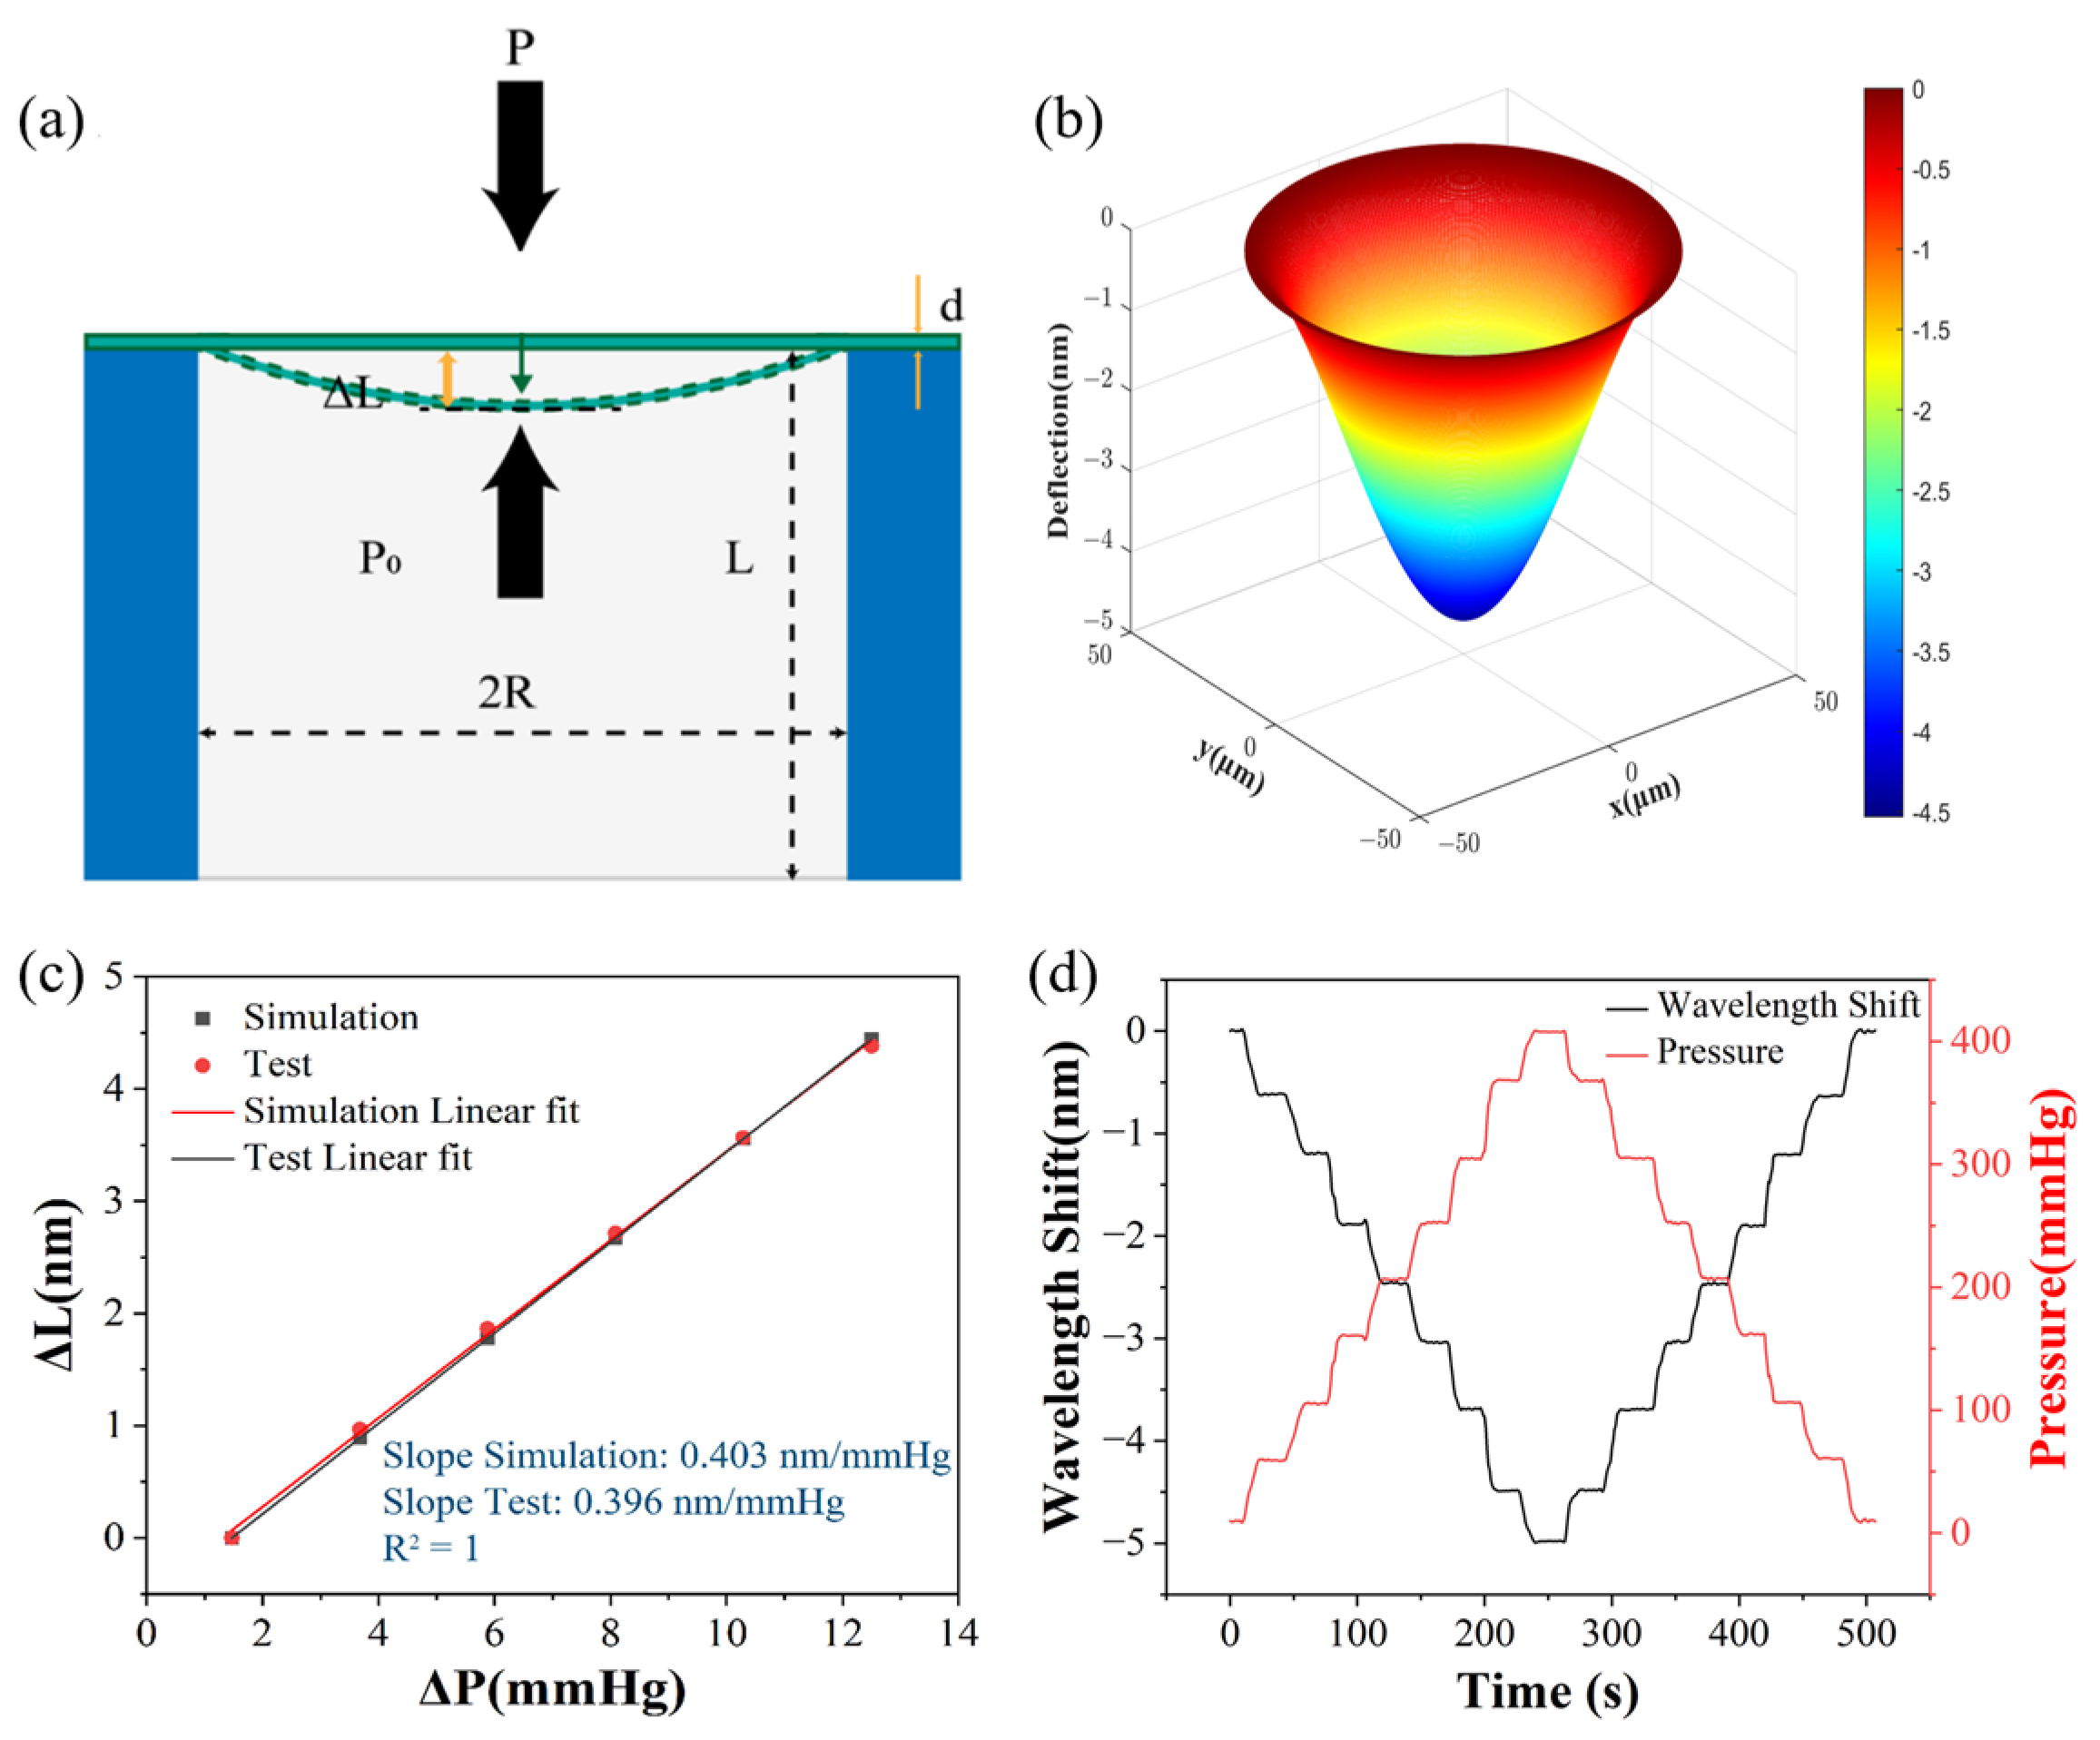
As a dynamic signal, the fluid flow rate needs to be converted into a detectable physical parameter. It can be seen from
Figure 3a that the diaphragm has a deformation when the continuous pressure caused by the hydraulic flow is loaded. Then, the deformation of the diaphragm is finally transformed into the change in the cavity length of FPI sensors. As depicted in
Figure 3b, the deflection increases with the decreasing radial distance. Generally speaking, the film based on the FPI structure always reaches maximum deformation, which is located at the central point. When the pressure is increasing, the cavity length decreases, and the FPI sensor spectrum shifts to shorter wavelengths. Accordingly, the pressure sensitivity of the FPI diaphragm can be expressed as [
24]
where
υ,
E, and
R represent the Poisson’s ratio, Young’s modulus, and radius of the diaphragm, respectively. In terms of the fused silica diaphragm,
υ,
E, and
R are 73 GPa, 0.17, and 50 μm, respectively. Consequently, the pressure sensitivity of the FPI sensor will improve by reducing the diaphragm thickness.
In the case of the deformation of the thin diaphragm, which does not exceed 30% of its thickness, the deformation of the fused silica diaphragm is linearly related to the external pressure. It is assumed that the limit of the sensing film thickness is about 1.5 μm, and the corresponding maximum deformation is less than 450 nm. The relationship between the different pressure and the cavity length change is presented in
Figure 3c. Similar to the method of determining the diaphragm thickness, the cavity length can be calculated by estimating the period of small envelopes in the reflection spectrum. It can be seen that the theoretical sensitivity of the proposed sensor is calculated as 0.403 nm/mmHg, which matches the sensitivity obtained from testing (0.396 nm/mmHg). The detectable pressure range is calculated to be 0∼1136 mmHg and can allow this flow pressure range in medical catheter testing.
In order to guarantee the stability and resilience of the sensor sample, an increase/decrease pressure cycle was conducted from 10 mmHg to 410 mmHg in a step of 50 mmHg, associated with the dip wavelength decreasing from 1541.156 nm to 1536.151 nm. As is clearly depicted in
Figure 3d, the shift in the output spectrum demonstrates that the external pressure changes with the deformation of the sensing diaphragm, and the spectrum of the sensor is simultaneously demodulated to pressure by tracking the dip wavelength in real time. The tracing of the wavelength shift at each pressure step was repeated with an acquisition rate of once per second, verifying no obvious hysteresis and good repeatability for pressure detection.
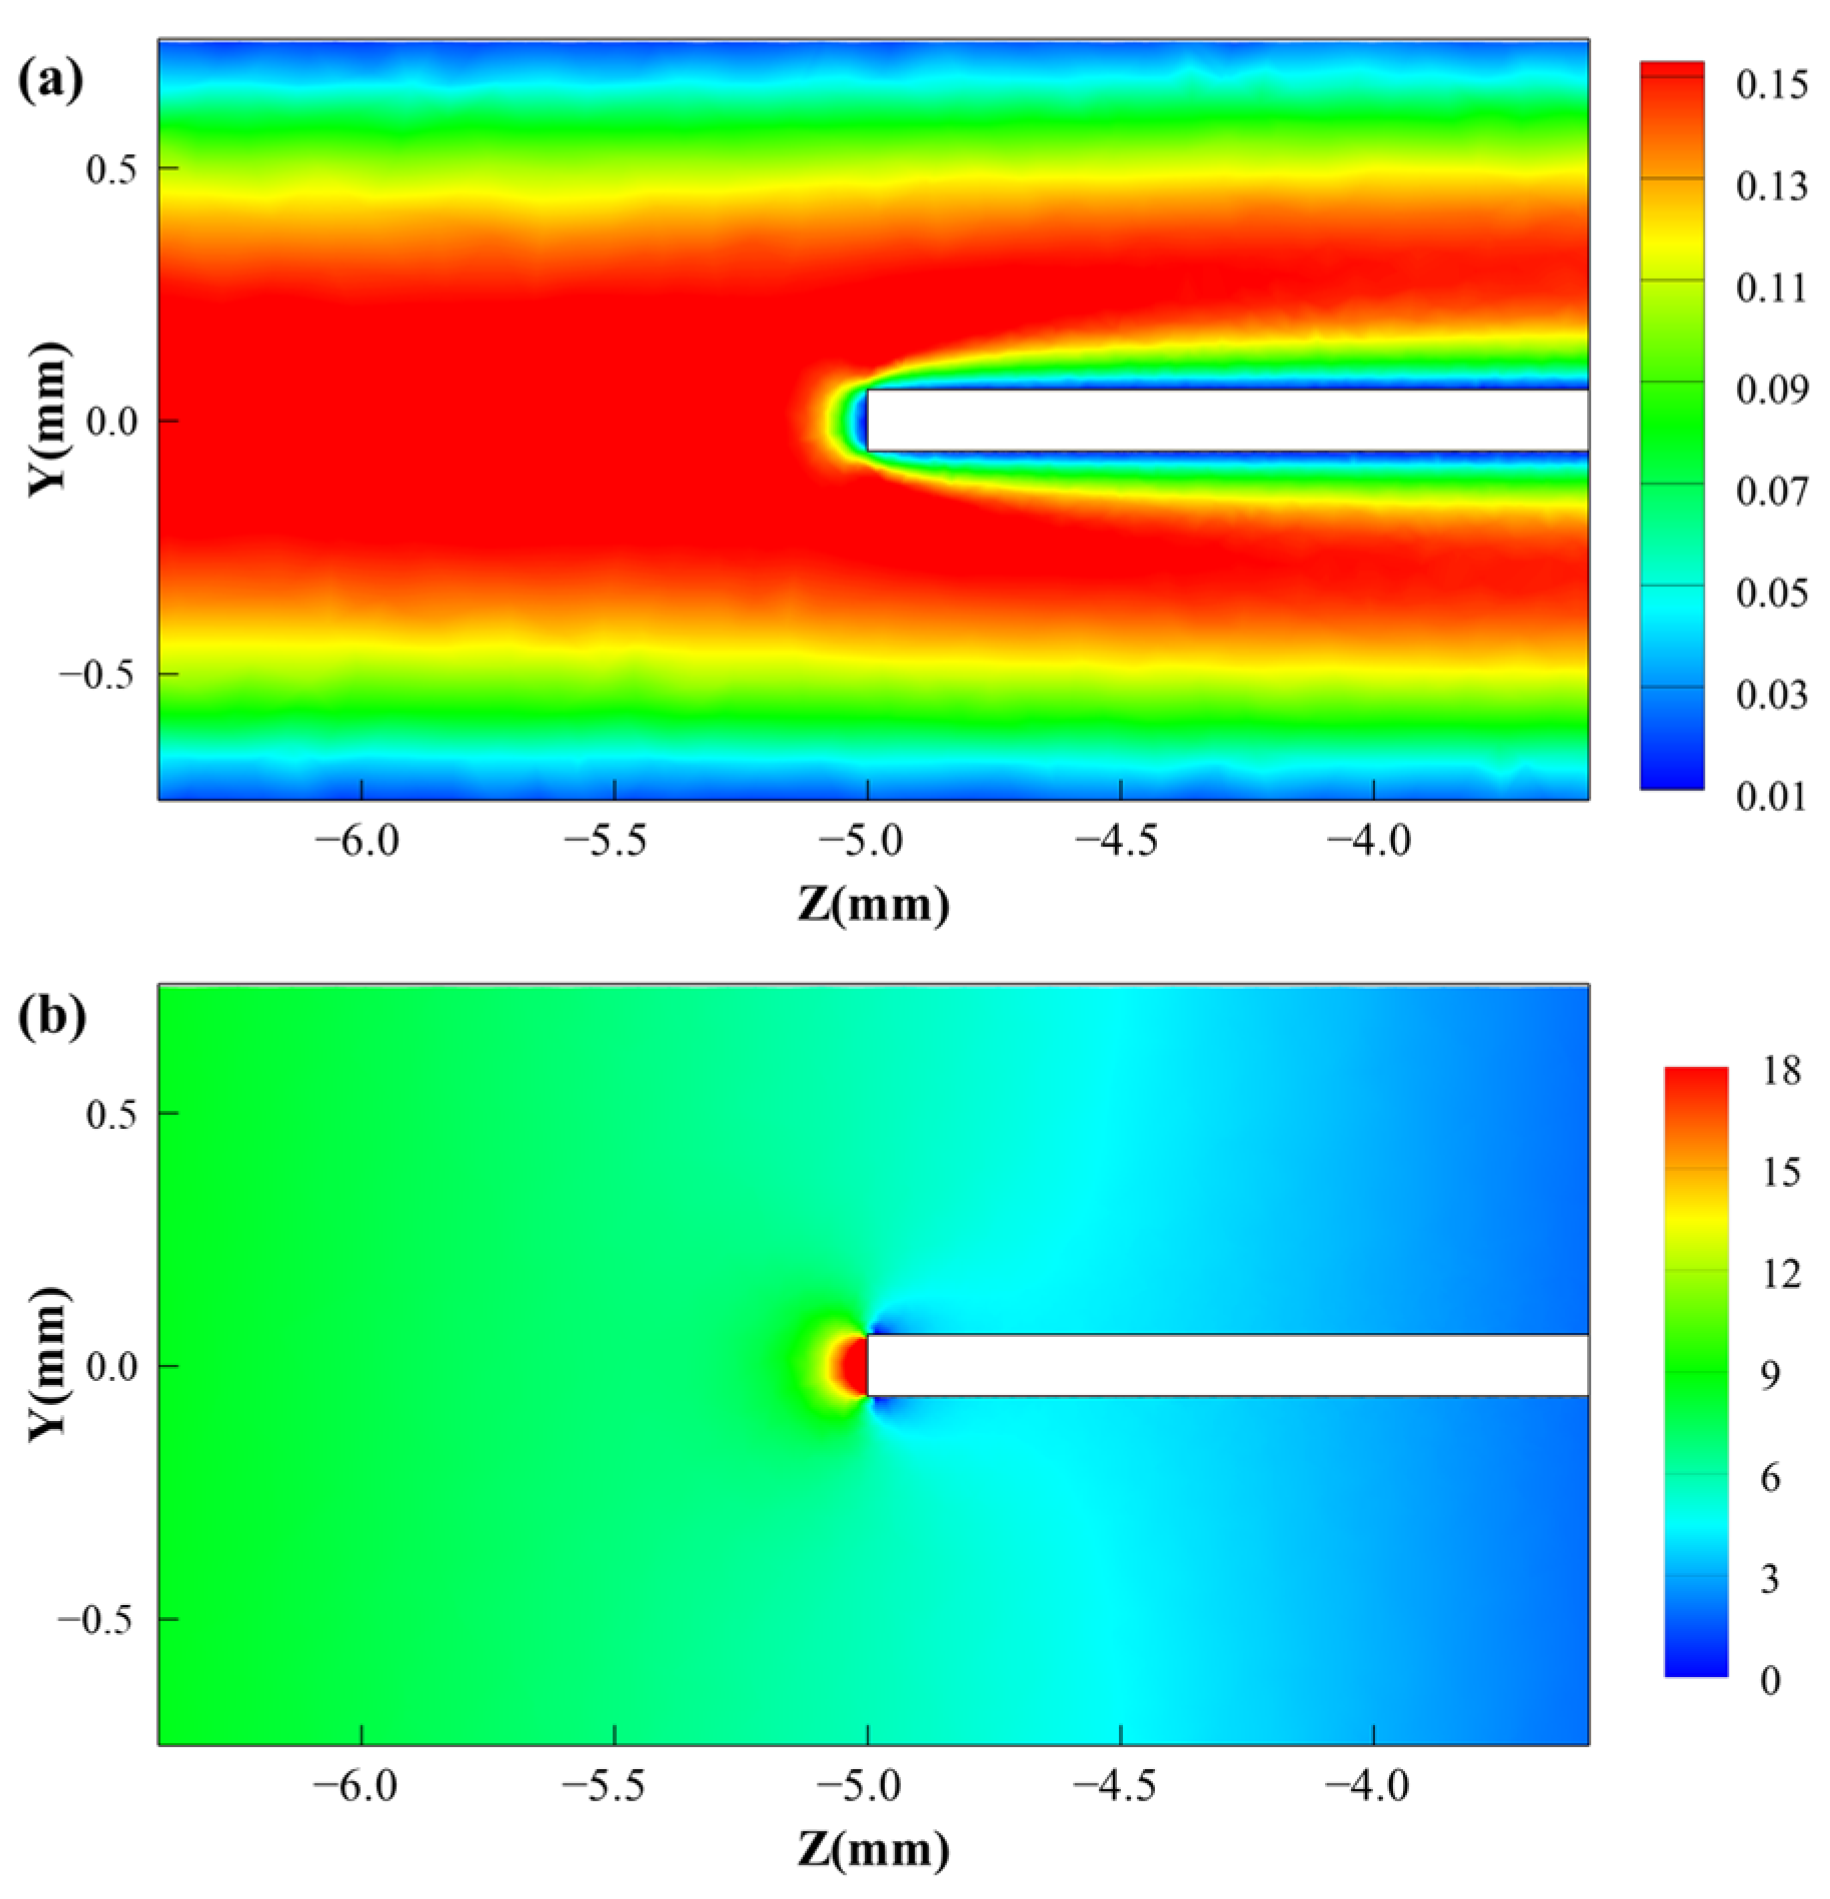
When the fluid flows into the pipelines, the dynamic pressure and viscous resistance of the fluid result in diaphragm deformation. In order to realize the behavior of the fused silica diaphragm soaked in a flow, a three-dimensional model of the FPI flowmeter in a laminar inflow was carried out using finite element method (FEM) analysis of computational fluid dynamics (CFD).
The flow channel is a cylindrical tube with an inner diameter of 1.5 mm.
Figure 4 shows the velocity and pressure distribution in the y–z plane for the FPI flowmeter at a flow rate of 10 (mL/min). The fluid dynamics problem in the tube is described by the incompressible Naiver–Stokes, and continuity equations are as follows [
25]
where
ρ,
u,
p, and
η are fluid density, velocity, pressure, and dynamic viscosity, respectively. Moreover,
I and
T represent unit diagonal matrix and transpose operator, respectively.
The fluid in the channel is the laminar flow with parabolic velocity at the input and zero-pressure conditions at the output, as shown in
Figure 4a. In the laminar characteristics, the velocity immediately against the wall is zero due to the primary viscous force, and the flow velocity reaches its maximum in the middle of the tube. The deformation extracted from the moving liquid of the sensor diaphragm depends on the pressure gradient resulting from the fluid simulation results, as seen in
Figure 4b, and the viscous drag force is related to the velocity and dynamic viscosity of the fluid. Based on the Bernoulli equation, the static pressure in the area close to the sensor end face is highest when the flow velocity is zero. The size of the FPI flowmeter has a negligible effect on the flow field distribution, on account of its dimensions of less than one-tenth of the inner diameter of the pipeline. Using UV glue and a manual stage to fix the FPI flowmeter and circular pipeline can maintain the stability of the flowmeter during the measurement process. The manual stage not only serves as a fixing device but also accurately adjusts the position of the optical fiber, making its end face strictly parallel to the film. In practical applications, Kapton tubing can be considered to cover the FPI flowmeter to protect it from the external force.
3. Experimental Results and Discussion
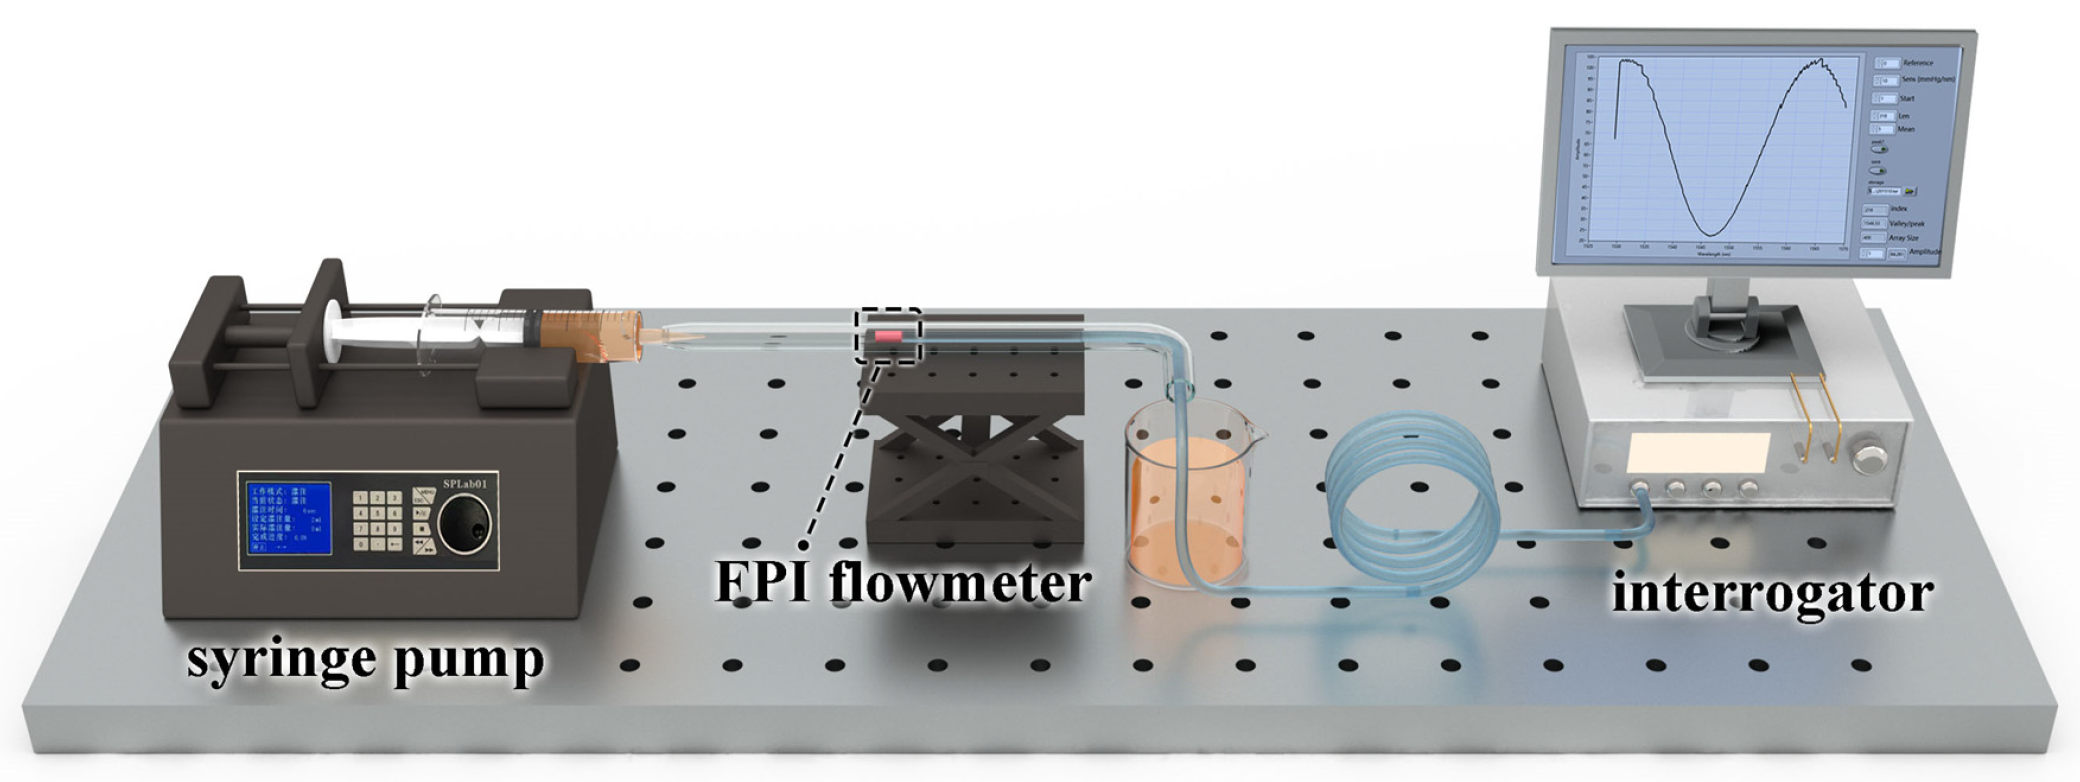
For the purpose of verifying the viability of various flow rate measurements by employing the FPI flowmeter, experimental analysis should be carried out to determine the relationship between the dip wavelength shift and the fluid flow rate. The experimental setup for flow-rate testing is indicated in
Figure 5. The fluid flowed into the inlet of the hollow rubber catheter by adopting the SPL01 micro flow injection pump from Baoding Shenchen Pump Industry Co., Ltd. (Baoding, China) to control the flow rate. By injecting different flow rates, the fluid loading deflects the sensing diaphragm and, thus, leads to a shift in the interference fringes by changing the cavity length. In order to achieve the measurement and analysis of the sensor spectrum shift, the reflected light from the deformation of the sensor diaphragm is sent to an interrogator (Smartfiber Technology Ltd., Guangdong, China), with a spectral region from 1528.670 nm to 1568.470 nm and a sampling interval of 100 pm. This interrogator is based on a broadly tunable laser, which achieves rapid scanning. The overall equipment for measurement could be expensive due to the high cost of lasers and wavelength sweep components. A potential solution to reduce the total cost of the flow measurement device is intensity demodulation.
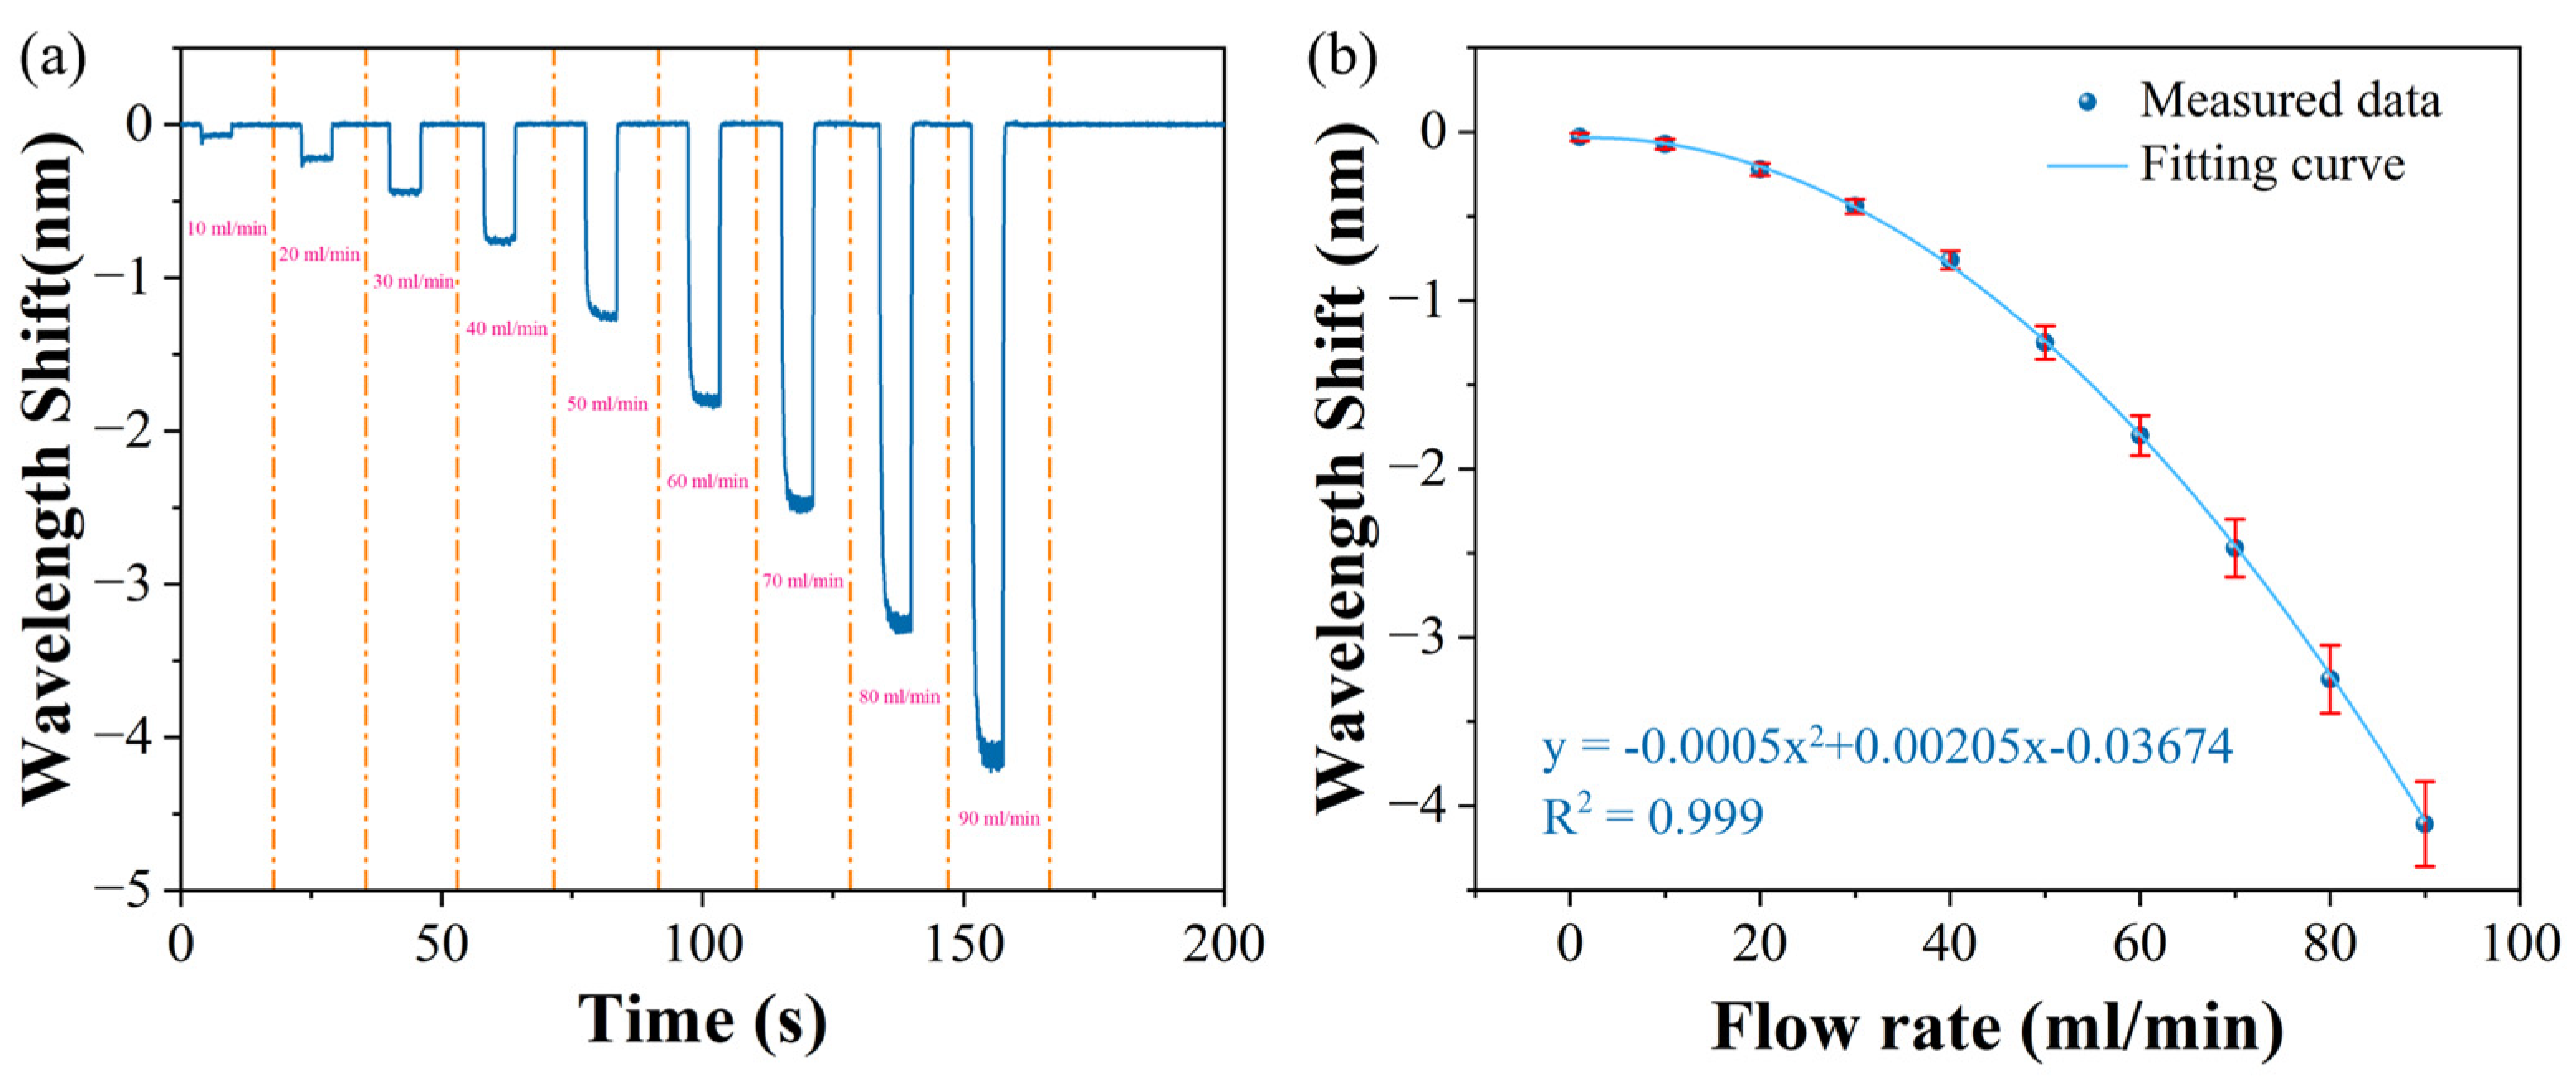
In order to measure the wavelength drift of FPI sensors at different flow rates in real time, Gaussian fitting is used to reproduce the FPI reflection spectrum to obtain the accurate crest/trough wavelengths for each frame. As clearly exhibited in
Figure 6a, the suggested sensor not only has a sensitive dynamic response from 10 mL/min to 90 mL/min in a step of 10 mL/min but also demonstrates good stability under liquid conditions. Due to its small size, the sensor can respond to very high speeds. However, there are 50 readings per second, limited by the interrogator used in the experiment. By using a faster interrogator, the measurement rate can be improved. Under different flow rates, a relatively steady flow field in the channel can be rapidly established within hundreds of milliseconds. It can be seen that the response time of the FPI flowmeter increases from 200 ms to 1380 ms, and the dip wavelength decreases from 0.07 nm to 4.1 nm, corresponding to the flow rate increasing from 10 mL/min to 90 mL/min.
The wavelength shift detected by the FPI flowmeter at flow rates from 0 to 90 mL/min was captured, and the standard deviation of the time-series signal was calculated. As plotted in
Figure 6b, the change in the dip wavelength is quadratically proportional to the flow rates, and the standard deviation is increased when the flow rate is increased because a greater flow rate results in greater fluctuation in the sensor film. Before the fluid flow-rate measurement, the pipeline was filled with deionized water, and the dip wavelength was recorded as a reference wavelength, which is 1563.48227 nm at a flow rate of zero. In the experiment, flow detection over a large range was obtained with the highest sensitivity of 87.95 pm/mL/min, and the flow rate resolution was determined by the standard deviation (SD) of 250 repeated measurements at each point, obeying the SD of 1.08 mL/min, which is 1.2% of the full scale (F.S., 0∼90 mL/min). It is worth noting that that by improving the sensitivity of the FPI flowmeter, flow rates in the range of tens of µL/min can be achieved.
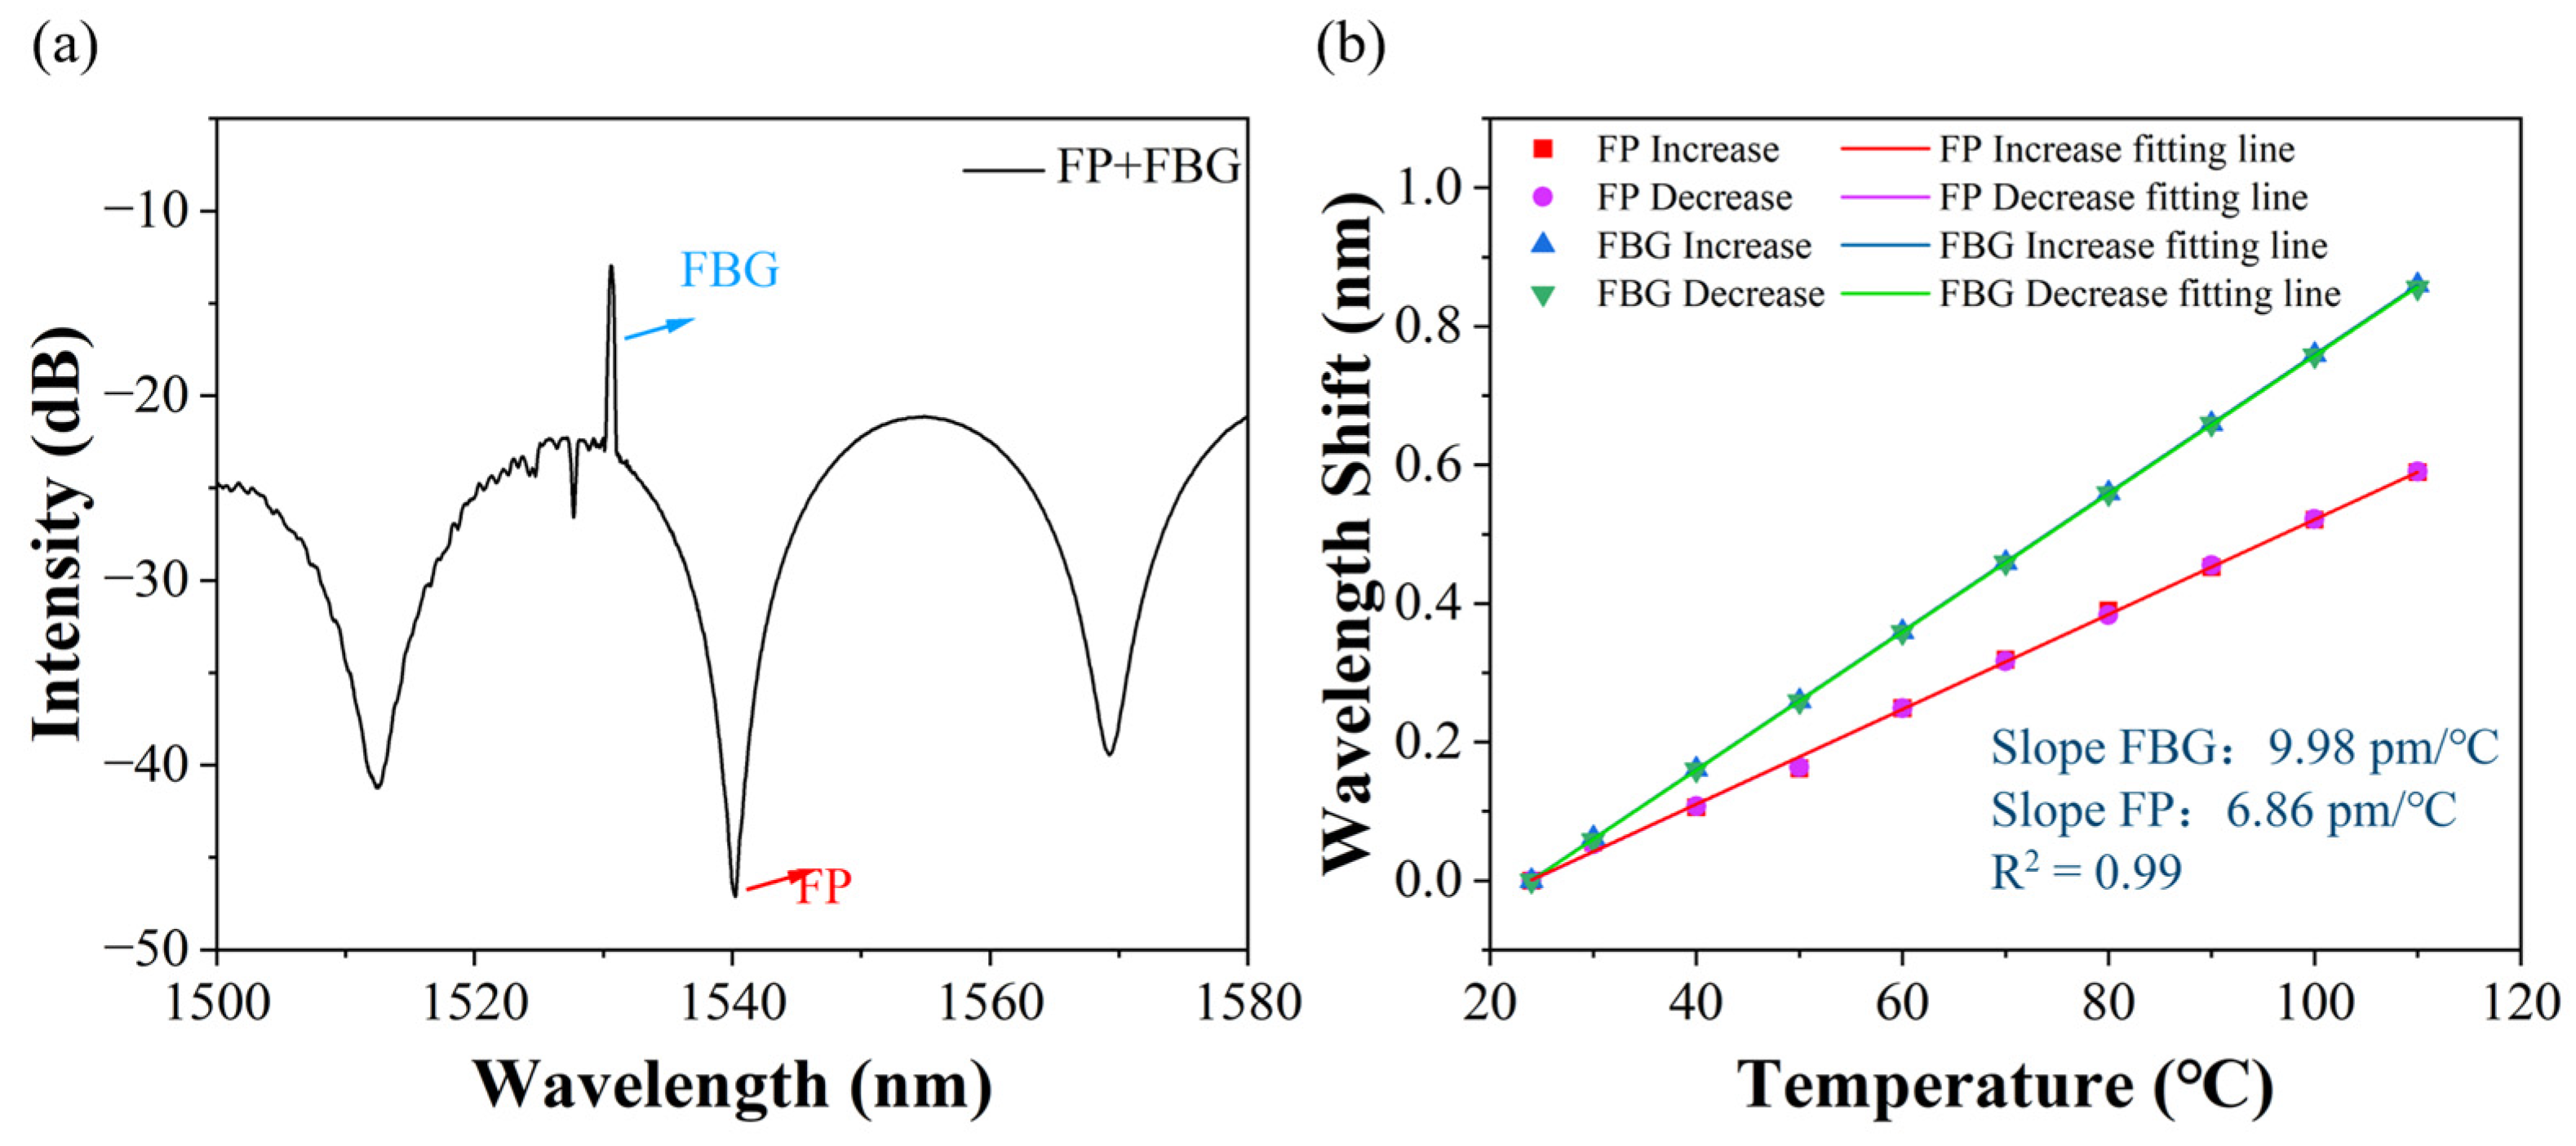
Considering that the temperature changes in fluids at various temperatures have an obvious influence on flow-rate detection, an effective temperature compensation needs to be performed for decoupling the relationship between flow rate and temperature. In order to eliminate the crosstalk between temperature and flow rate,
Figure 7a adopts a compensation strategy (the FPI flowmeter connected to an FBG fiber-optic temperature sensor). In this way, the fiber Bragg grating is written directly with a femtosecond laser at a distance of 4 mm from the head of the FPI flowmeter, and two sensor signals are demodulated simultaneously using wavelength division multiplexing technology. Firstly, the relationship of the FPI and FBG sensors between wavelength shift and temperature was calibrated by using a temperature control box. Two sensors with different sensitivities were coupled to the same optical fiber, as presented in
Figure 7b. With a rising set temperature in the range of 30∼110 °C (10 °C per step), the temperature responses of two sensors are both linear, and the FPI flowmeter with a temperature sensitivity of 6.86 pm/°C is applied with the FBG sensor, with a sensitivity of 9.98 pm/°C.
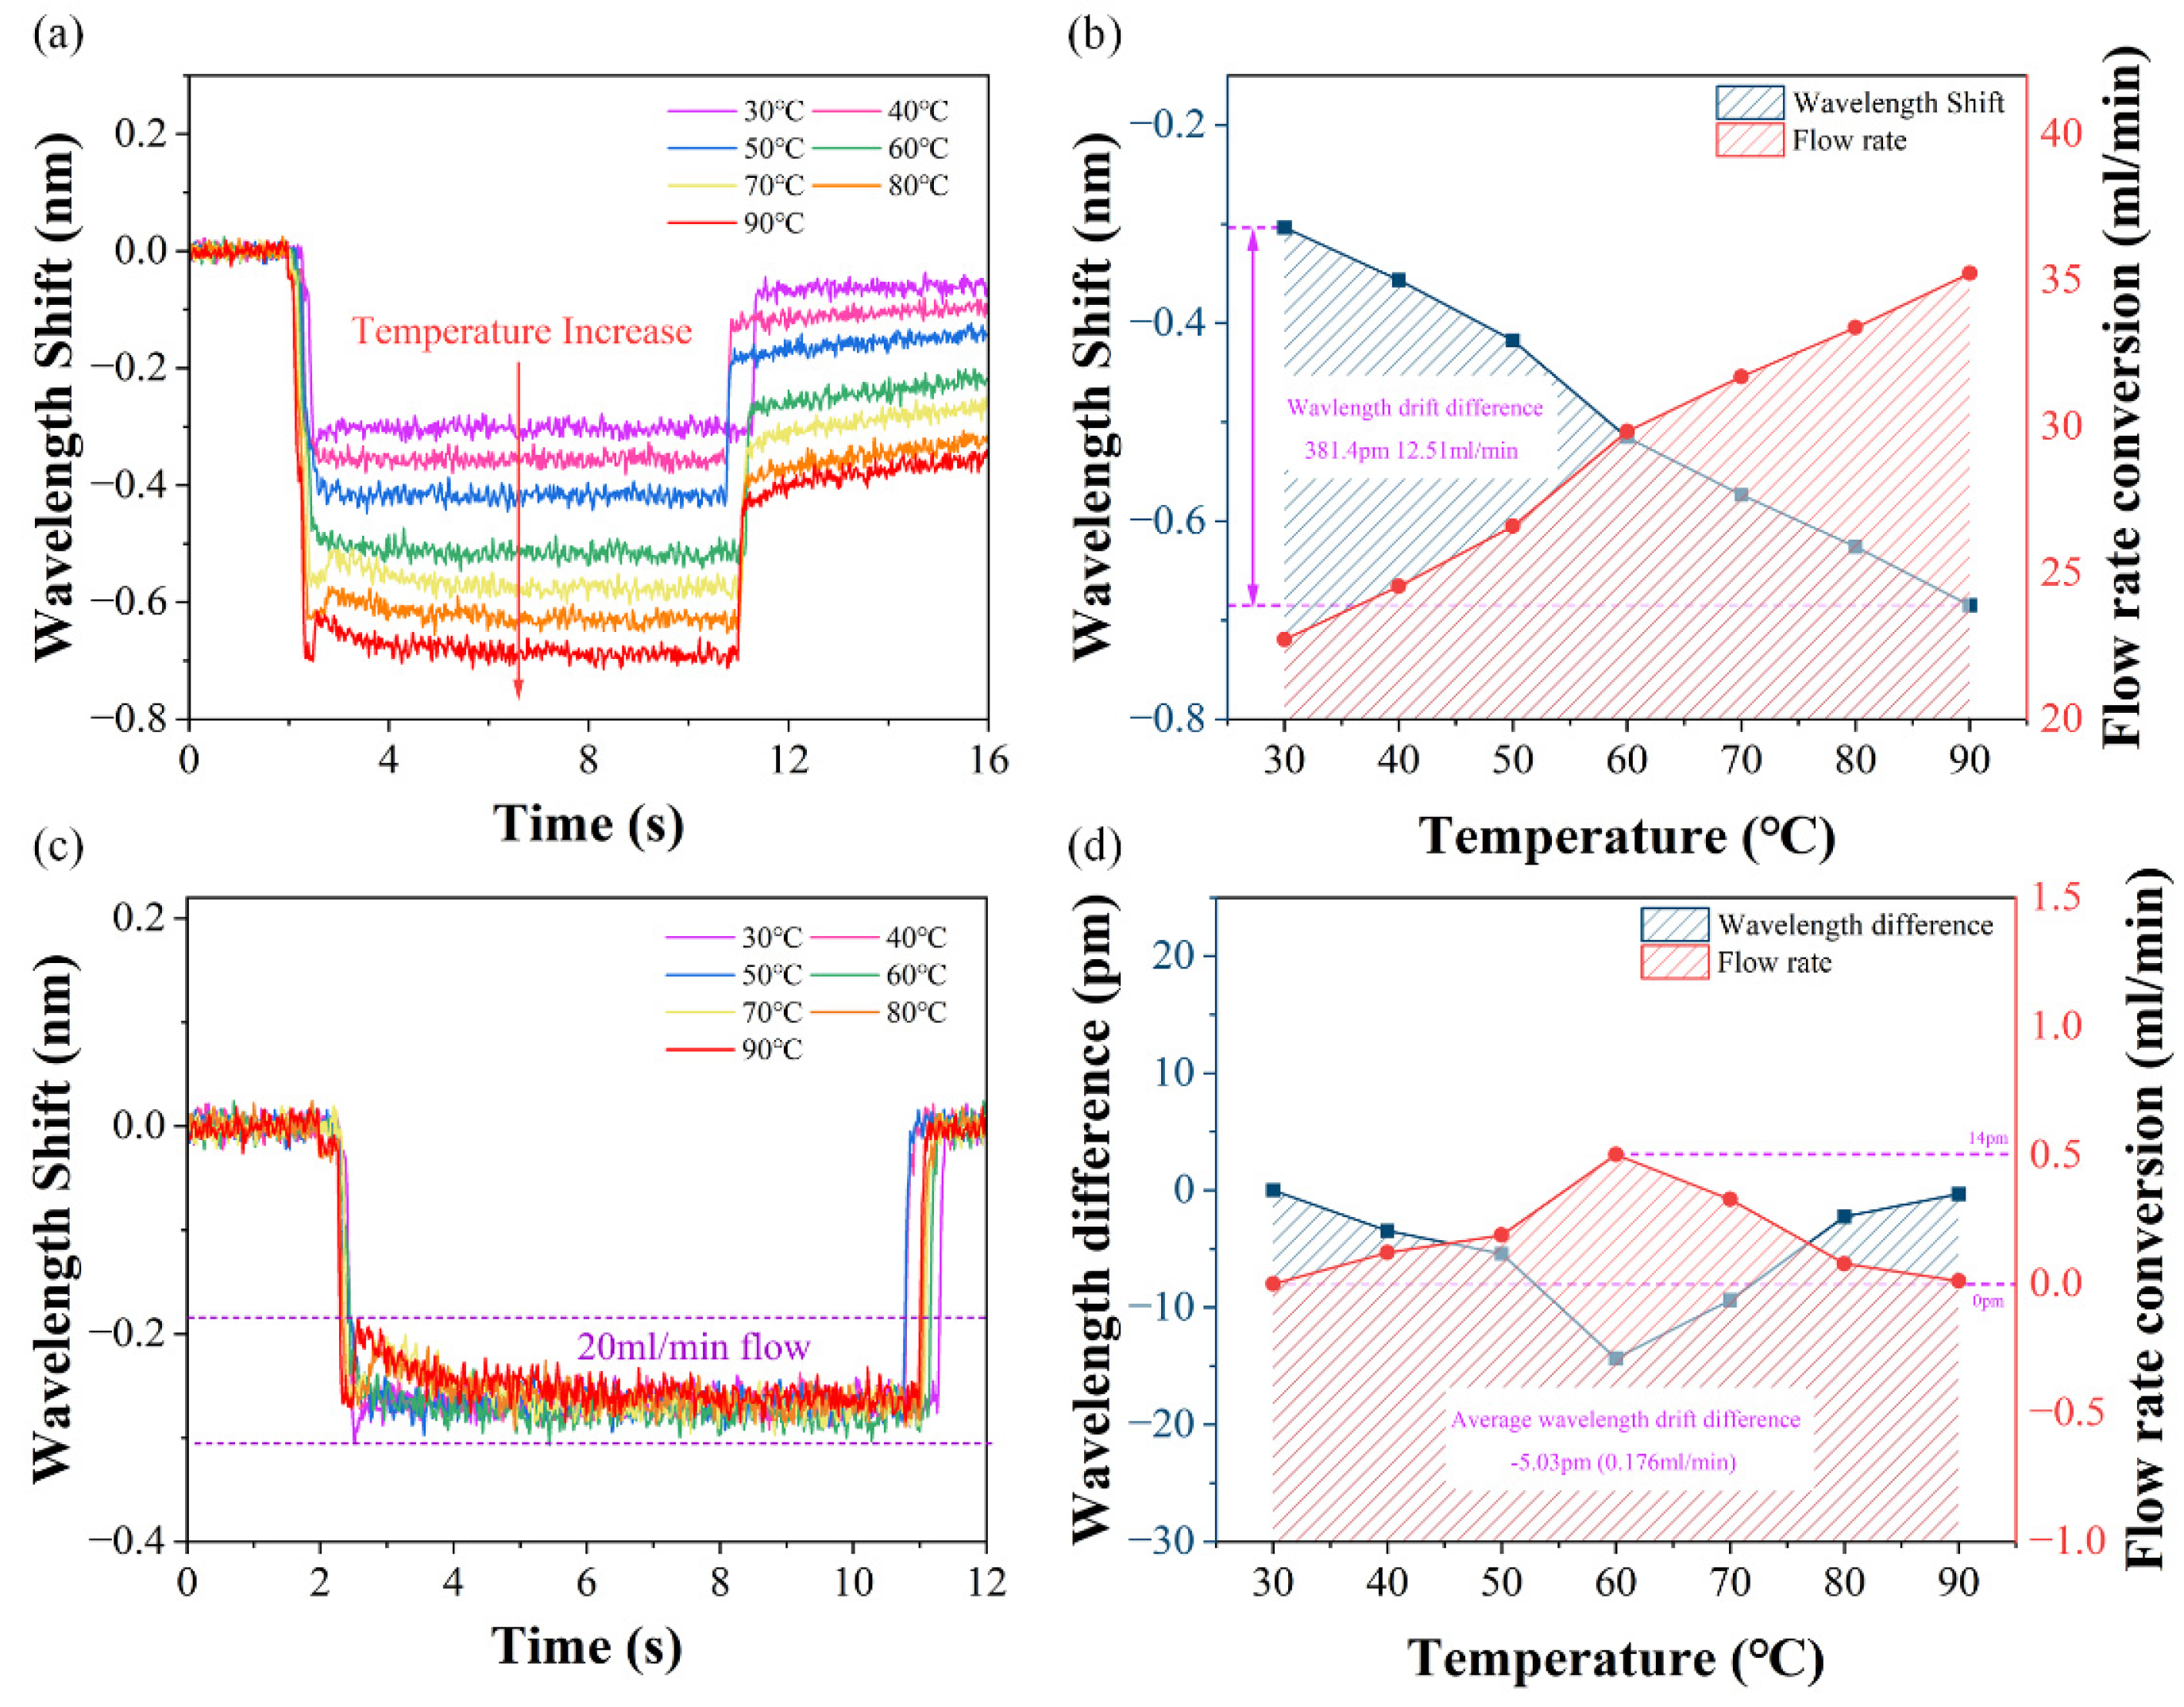
To verify the effectiveness of temperature compensation, a variable temperature flow test can be carried out by fixing a flow pipeline to a heating platform, and then deionized water will fill with the channel by providing the FBG-compensated FPI flowmeter.
Figure 8a visualizes the wavelength drift of the FPI flowmeter from stabilizing at a set temperature moment to injecting at a flow rate of 20 mL/min with the syringe pump. As shown in
Figure 8b, the wavelength drift difference in the FPI flowmeter is 381.4 pm, which converts to 12.51 mL/min at the same flow rate. This method leads to excessive flow measurement errors. The wavelength shift measured by the FPI flowmeter subtracts the spectral drift caused by temperature, which is measured by the FBG sensor, as demonstrated in
Figure 8c.
Through this method, the dip wavelengths almost maintain a constant value when the fluid flows into the channel with a flow rate of 20 mL/min. The accuracy of the FPI flowmeter for liquid flow-rate measurement is evaluated by yielding the maximal absolute error (MAE) of 14 pm equivalent to 0.5 mL/min, as manifested in
Figure 8d. On top of that, the average wavelength drift difference in the FPI flowmeter is 5.03 pm, converted to 0.176 mL/min under different temperature conditions, which is reduced by nearly 25-times. Therefore, the temperature change is calculated by converting the central wavelength shift of the FBG sensor to compensate the FPI flowmeter for variable temperature flow detection.


