Sensitive Detection of Silicon in Aqua Phase by Microwave-Assisted Laser-Induced Breakdown Spectroscopy


Abstract
1. Introduction
2. Materials and Methods
3. Results and Discussion


4. Conclusions
Author Contributions
Funding
Institutional Review Board Statement
Informed Consent Statement
Data Availability Statement
Acknowledgments
Conflicts of Interest
References
- Cremers, D.A.; Radziemski, L.J. Handbook of Laser-Induced Breakdown Spectroscopy, 2nd ed.; Wiley: London, UK, 2013. [Google Scholar]
- Wilschefski, S.C.; Baxter, M.R. Inductively coupled plasma mass spectrometry: Introduction to analytical aspects. Clin. Biochem. Rev. 2019, 40, 115. [Google Scholar] [CrossRef] [PubMed]
- Senesi, G.S.; Harmon, R.S.; Hark, R.R. Field-portable and handheld laser-induced breakdown spectroscopy: Historical review, current status and future prospects. Spectrochim. Acta Part B At. Spectrosc. 2021, 175, 106013. [Google Scholar] [CrossRef]
- Shah, S.K.H.; Iqbal, J.; Ahmad, P.; Khandaker, M.U.; Haq, S.; Naeem, M. Laser induced breakdown spectroscopy methods and applications: A comprehensive review. Radiat. Phys. Chem. 2020, 170, 108666. [Google Scholar] [CrossRef]
- Grebneva-Balyuk, O.; Kubrakova, I. Determination of platinum group elements in geological samples by inductively coupled plasma mass spectrometry: Possibilities and limitations. J. Anal. Chem. 2020, 75, 275–285. [Google Scholar] [CrossRef]
- Fernandes Andrade, D.; Pereira-Filho, E.R.; Amarasiriwardena, D. Current trends in laser-induced breakdown spectroscopy: A tutorial review. Appl. Spectrosc. Rev. 2021, 56, 98–114. [Google Scholar] [CrossRef]
- Galbács, G. A critical review of recent progress in analytical laser-induced breakdown spectroscopy. Anal. Bioanal. Chem. 2015, 407, 7537–7562. [Google Scholar] [CrossRef] [PubMed]
- Fu, X.; Li, G.; Dong, D. Improving the detection sensitivity for laser-induced breakdown spectroscopy: A review. Front. Phys. 2020, 8, 68. [Google Scholar] [CrossRef]
- Wang, Z.; Afgan, M.S.; Gu, W.; Song, Y.; Wang, Y.; Hou, Z.; Song, W.; Li, Z. Recent advances in laser-induced breakdown spectroscopy quantification: From fundamental understanding to data processing. TrAC Trends Anal. Chem. 2021, 143, 116385. [Google Scholar] [CrossRef]
- Li, Y.; Tian, D.; Ding, Y.; Yang, G.; Liu, K.; Wang, C.; Han, X. A review of laser-induced breakdown spectroscopy signal enhancement. Appl. Spectrosc. Rev. 2018, 53, 1–35. [Google Scholar] [CrossRef]
- Zheng, T.; Wang, L.; Liu, J.; Wang, J.; Jia, G. The corrosion inhibition effect of sodium silicate and Triton X-100 on 2024-T3 aluminum alloy in NaOH medium: Experimental and theoretical research. Colloids Surf. A Physicochem. Eng. Asp. 2021, 610, 125723. [Google Scholar] [CrossRef]
- Rushing, J.C.; McNeill, L.S.; Edwards, M. Some effects of aqueous silica on the corrosion of iron. Water Res. 2003, 37, 1080–1090. [Google Scholar] [CrossRef] [PubMed]
- Bahadori, A.; Vuthaluru, H.B. Prediction of silica carry-over and solubility in steam of boilers using simple correlation. Appl. Therm. Eng. 2010, 30, 250–253. [Google Scholar] [CrossRef]
- Sohail, M.A.; Mustafa, A.I. Concentration control of silica in water chemical regime for natural circulation high pressure drum boiler unit of thermal power station. Indian J. Chem. Technol. 2007, 14, 195–199. [Google Scholar]
- Nyongbela, G.N.; Johannsen, K. Laboratory-scale study on the effect of silicate on copper pipe corrosion. Mater. Corros. 2015, 66, 995–1000. [Google Scholar] [CrossRef]
- Butcher, D.J. Recent highlights in graphite furnace atomic absorption spectrometry. Appl. Spectrosc. Rev. 2017, 52, 755–773. [Google Scholar] [CrossRef]
- Kilmer, V.J. Methods of Soil Analysis: Part 2 Chemical and Microbiological Properties; Page, A.L., Ed.; American Society of Agronomy and Soil Science Society of America: Madison, WI, USA, 1983; Volume 9, pp. 263–273. [Google Scholar]
- Montaño, M.D.; Majestic, B.J.; Jämting, Å.K.; Westerhoff, P.; Ranville, J.F. Methods for the detection and characterization of silica colloids by microsecond spICP-MS. Anal. Chem. 2016, 88, 4733–4741. [Google Scholar] [CrossRef] [PubMed]
- Kozak, J.; Latocha, K.; Kochana, J.; Wieczorek, M.; Kościelniak, P. Simultaneous spectrophotometric flow injection determination of phosphate and silicate. Talanta 2015, 133, 150–154. [Google Scholar] [CrossRef] [PubMed]
- Trojanowicz, M.; Pyszynska, M. Flow-Injection Methods in Water Analysis—Recent Developments. Molecules 2022, 27, 1410. [Google Scholar] [CrossRef] [PubMed]
- Yu, X.; Li, Y.; Gu, X.; Bao, J.; Yang, H.; Sun, L. Laser-induced breakdown spectroscopy application in environmental monitoring of water quality: A review. Environ. Monit. Assess. 2014, 186, 8969–8980. [Google Scholar] [CrossRef] [PubMed]
- Sabsabi, M.; Cielo, P. Quantitative analysis of aluminum alloys by laser-induced breakdown spectroscopy and plasma characterization. Appl. Spectrosc. 1995, 49, 499–507. [Google Scholar] [CrossRef]
- Zheng, H.; Yueh, F.Y.; Miller, T.; Singh, J.P.; Zeigler, K.E.; Marra, J.C. Analysis of plutonium oxide surrogate residue using laser-induced breakdown spectroscopy. Spectrochim. Acta Part B At. Spectrosc. 2008, 63, 968–974. [Google Scholar] [CrossRef]
- De Souza, P.F.; Júnior, D.S.; de Carvalho, G.G.A.; Nunes, L.C.; da Silva Gomes, M.; Guerra, M.B.B.; Krug, F.J. Determination of silicon in plant materials by laser-induced breakdown spectroscopy. Spectrochim. Acta Part B At. Spectrosc. 2013, 83, 61–65. [Google Scholar] [CrossRef]
- Skrzeczanowski, W.; Długaszek, M. Al and Si quantitative analysis in aqueous solutions by LIBS method. Talanta 2021, 225, 121916. [Google Scholar] [CrossRef]
- Yaroshchyk, P.; Morrison, R.J.; Body, D.; Chadwick, B.L. Quantitative determination of wear metals in engine oils using LIBS: The use of paper substrates and a comparison between single-and double-pulse LIBS. Spectrochim. Acta Part B At. Spectrosc. 2005, 60, 1482–1485. [Google Scholar] [CrossRef]
- Zhang, W.; Zhou, R.; Liu, K.; Li, Q.; Tang, Z.; Zhu, C.; Li, X.; Zeng, X.; He, C. Silicon determination in steel with molecular emission using laser-induced breakdown spectroscopy combined with laser-induced molecular fluorescence. J. Anal. At. Spectrom. 2021, 36, 375–379. [Google Scholar] [CrossRef]
- Abdulmadjid, S.N.; Idris, N.; Pardede, M.; Jobiliong, E.; Hedwig, R.; Lie, Z.S.; Suyanto, H.; Tjia, M.O.; Kurniawan, K.H.; Kagawa, K. Sensitive analysis of carbon, chromium and silicon in steel using picosecond laser induced low pressure helium plasma. Spectrochim. Acta Part B At. Spectrosc. 2015, 114, 1–6. [Google Scholar] [CrossRef]
- Aragon, C.; Aguilera, J.A.; Penalba, F. Improvements in quantitative analysis of steel composition by laser-induced breakdown spectroscopy at atmospheric pressure using an infrared Nd: YAG laser. Appl. Spectrosc. 1999, 53, 1259–1267. [Google Scholar] [CrossRef]
- Ismail, M.A.; Cristoforetti, G.; Legnaioli, S.; Pardini, L.; Palleschi, V.; Salvetti, A.; Tognoni, E.; Harith, M.A. Comparison of detection limits, for two metallic matrices, of laser-induced breakdown spectroscopy in the single and double-pulse configurations. Anal. Bioanal. Chem. 2006, 385, 316–325. [Google Scholar] [CrossRef]
- Kasim, A.F.A.; Wakil, M.; Grant, K.; Hearn, M.; Alwahabi, Z.T. Aqueous ruthenium detection by microwave-assisted laser-induced breakdown spectroscopy. Plasma Sci. Technol. 2022, 24, 084004. [Google Scholar] [CrossRef]
- Ikeda, Y.; Soriano, J.K.; Wakaida, I. Signal-to-noise ratio improvements in microwave-assisted laser-induced breakdown spectroscopy. Talanta Open 2022, 6, 100138. [Google Scholar] [CrossRef]
- Viljanen, J.; Sun, Z.; Alwahabi, Z.T. Microwave assisted laser-induced breakdown spectroscopy at ambient conditions. Spectrochim. Acta Part B At. Spectrosc. 2016, 118, 29–36. [Google Scholar] [CrossRef]
- Wall, M.; Sun, Z.; Alwahabi, Z.T. Quantitative detection of metallic traces in water-based liquids by microwave-assisted laser-induced breakdown spectroscopy. Opt. Express 2016, 24, 1507–1517. [Google Scholar] [CrossRef] [PubMed]
- Wakil, M.; Alwahabi, Z.T. Microwave-assisted laser induced breakdown molecular spectroscopy: Quantitative chlorine detection. J. Anal. At. Spectrom. 2019, 34, 1892–1899. [Google Scholar] [CrossRef]
- Wakil, M.; Alwahabi, Z.T. Quantitative fluorine and bromine detection under ambient conditions via molecular emission. J. Anal. At. Spectrom. 2020, 35, 2620–2626. [Google Scholar] [CrossRef]
- Ikeda, Y.; Soriano, J.K. Microwave-enhanced laser-induced air plasma at atmospheric pressure. Opt. Express 2022, 30, 33756–33766. [Google Scholar] [CrossRef]
- Ikeda, Y. Atmospheric air plasma sustainment by semiconductor microwave for hydroxyl radical production and powder metal element analysis. Opt. Express 2022, 30, 29868–29884. [Google Scholar] [CrossRef] [PubMed]
- Cai, S.; Tang, Y.; Wang, F.; Xiong, Y.; Sun, X.; Ming, X. Investigation of the multi-elemental self-absorption mechanism and experimental optimization in laser-induced breakdown spectroscopy. J. Anal. At. Spectrom. 2020, 35, 912–926. [Google Scholar] [CrossRef]
- Tang, Y.; Li, J.; Hao, Z.; Tang, S.; Zhu, Z.; Guo, L.; Li, X.; Zeng, X.; Duan, J.; Lu, Y. Multielemental self-absorption reduction in laser-induced breakdown spectroscopy by using microwave-assisted excitation. Opt. Express 2018, 26, 12121–12130. [Google Scholar] [CrossRef] [PubMed]
- Fortes, F.J.; Moros, J.; Lucena, P.; Cabalín, L.M.; Laserna, J.J. Laser-induced breakdown spectroscopy. Anal. Chem. 2013, 85, 640–669. [Google Scholar] [CrossRef] [PubMed]
- Keerthi, K.; George, S.D.; Kulkarni, S.D.; Chidangil, S.; Unnikrishnan, V. Elemental analysis of liquid samples by laser induced breakdown spectroscopy (LIBS): Challenges and potential experimental strategies. Opt. Laser Technol. 2022, 147, 107622. [Google Scholar] [CrossRef]
- Neumann, W. Fundamentals of Dispersive Optical Spectroscopy Systems; SPIE Press: Bellingham, WA, USA, 2014. [Google Scholar]
- Ball, D.W. The Basics of Spectroscopy; SPIE Press: Bellingham, WA, USA, 2001; Volume 49. [Google Scholar]
- Chen, S.J.; Iqbal, A.; Wall, M.; Fumeaux, C.; Alwahabi, Z.T. Design and application of near-field applicators for efficient microwave-assisted laser-induced breakdown spectroscopy. J. Anal. At. Spectrom. 2017, 32, 1508–1518. [Google Scholar] [CrossRef]
- Al Shuaili, A.A.; Al Hadhrami, A.M.; Wakil, M.; Alwahabi, Z.T. Improvement of palladium limit of detection by microwave-assisted laser induced breakdown spectroscopy. Spectrochim. Acta Part B At. Spectrosc. 2019, 159, 105666. [Google Scholar] [CrossRef]
- Kramida, A.; Ralchenko, Y.; Reader, J.; Team, N.A. NIST Atomic Spectra Database (ver. 5.11). 2023. Available online: https://www.nist.gov/pml/atomic-spectra-database (accessed on 1 November 2023).
- Pearse, R.W.B.; Gaydon, A.G.; Pearse, R.W.B.; Gaydon, A.G. The Identification of Molecular Spectra; Chapman and Hall: London, UK, 1976; Volume 297. [Google Scholar]
- Lasheras, R.; Bello-Gálvez, C.; Anzano, J. Quantitative analysis of oxide materials by laser-induced breakdown spectroscopy with argon as an internal standard. Spectrochim. Acta Part B At. Spectrosc. 2013, 82, 65–70. [Google Scholar] [CrossRef]
- Yi, R.; Li, J.; Yang, X.; Zhou, R.; Yu, H.; Hao, Z.; Guo, L.; Li, X.; Zeng, X.; Lu, Y. Spectral interference elimination in soil analysis using laser-induced breakdown spectroscopy assisted by laser-induced fluorescence. Anal. Chem. 2017, 89, 2334–2337. [Google Scholar] [CrossRef] [PubMed]
- Jolivet, L.; Leprince, M.; Moncayo, S.; Sorbier, L.; Lienemann, C.-P.; Motto-Ros, V. Review of the recent advances and applications of LIBS-based imaging. Spectrochim. Acta Part B At. Spectrosc. 2019, 151, 41–53. [Google Scholar] [CrossRef]
- Tognoni, E.; Palleschi, V.; Corsi, M.; Cristoforetti, G. Quantitative micro-analysis by laser-induced breakdown spectroscopy: A review of the experimental approaches. Spectrochim. Acta Part B At. Spectrosc. 2002, 57, 1115–1130. [Google Scholar] [CrossRef]
- Palleschi, V. Avoiding Misunderstanding self-Absorption in laser-induced breakdown spectroscopy (LIBS) analysis. Spectroscopy 2022, 37, 60–62. [Google Scholar] [CrossRef]
- Alamri, A.M.; Viljanen, J.; Kwong, P.; Alwahabi, Z.T. Isotope Detection in Microwave-Assisted Laser-Induced Plasma. Plasma 2023, 6, 466–477. [Google Scholar] [CrossRef]
- Liu, Y.; Baudelet, M.; Richardson, M. Elemental analysis by microwave-assisted laser-induced breakdown spectroscopy: Evaluation on ceramics. J. Anal. At. Spectrom. 2010, 25, 1316–1323. [Google Scholar] [CrossRef]
- Iqbal, A.; Sun, Z.; Wall, M.; Alwahabi, Z.T. Sensitive elemental detection using microwave-assisted laser-induced breakdown imaging. Spectrochim. Acta Part B At. Spectrosc. 2017, 136, 16–22. [Google Scholar] [CrossRef]
- Ikeda, Y.; Soriano, J.K.; Kawahara, N.; Wakaida, I. Spatially and temporally resolved plasma formation on alumina target in microwave-enhanced laser-induced breakdown spectroscopy. Spectrochim. Acta Part B At. Spectrosc. 2022, 197, 106533. [Google Scholar] [CrossRef]
- Goueguel, C.; Laville, S.; Vidal, F.; Chaker, M.; Sabsabi, M. Resonant laser-induced breakdown spectroscopy for analysis of lead traces in copper alloys. J. Anal. At. Spectrom. 2011, 26, 2452–2460. [Google Scholar] [CrossRef]


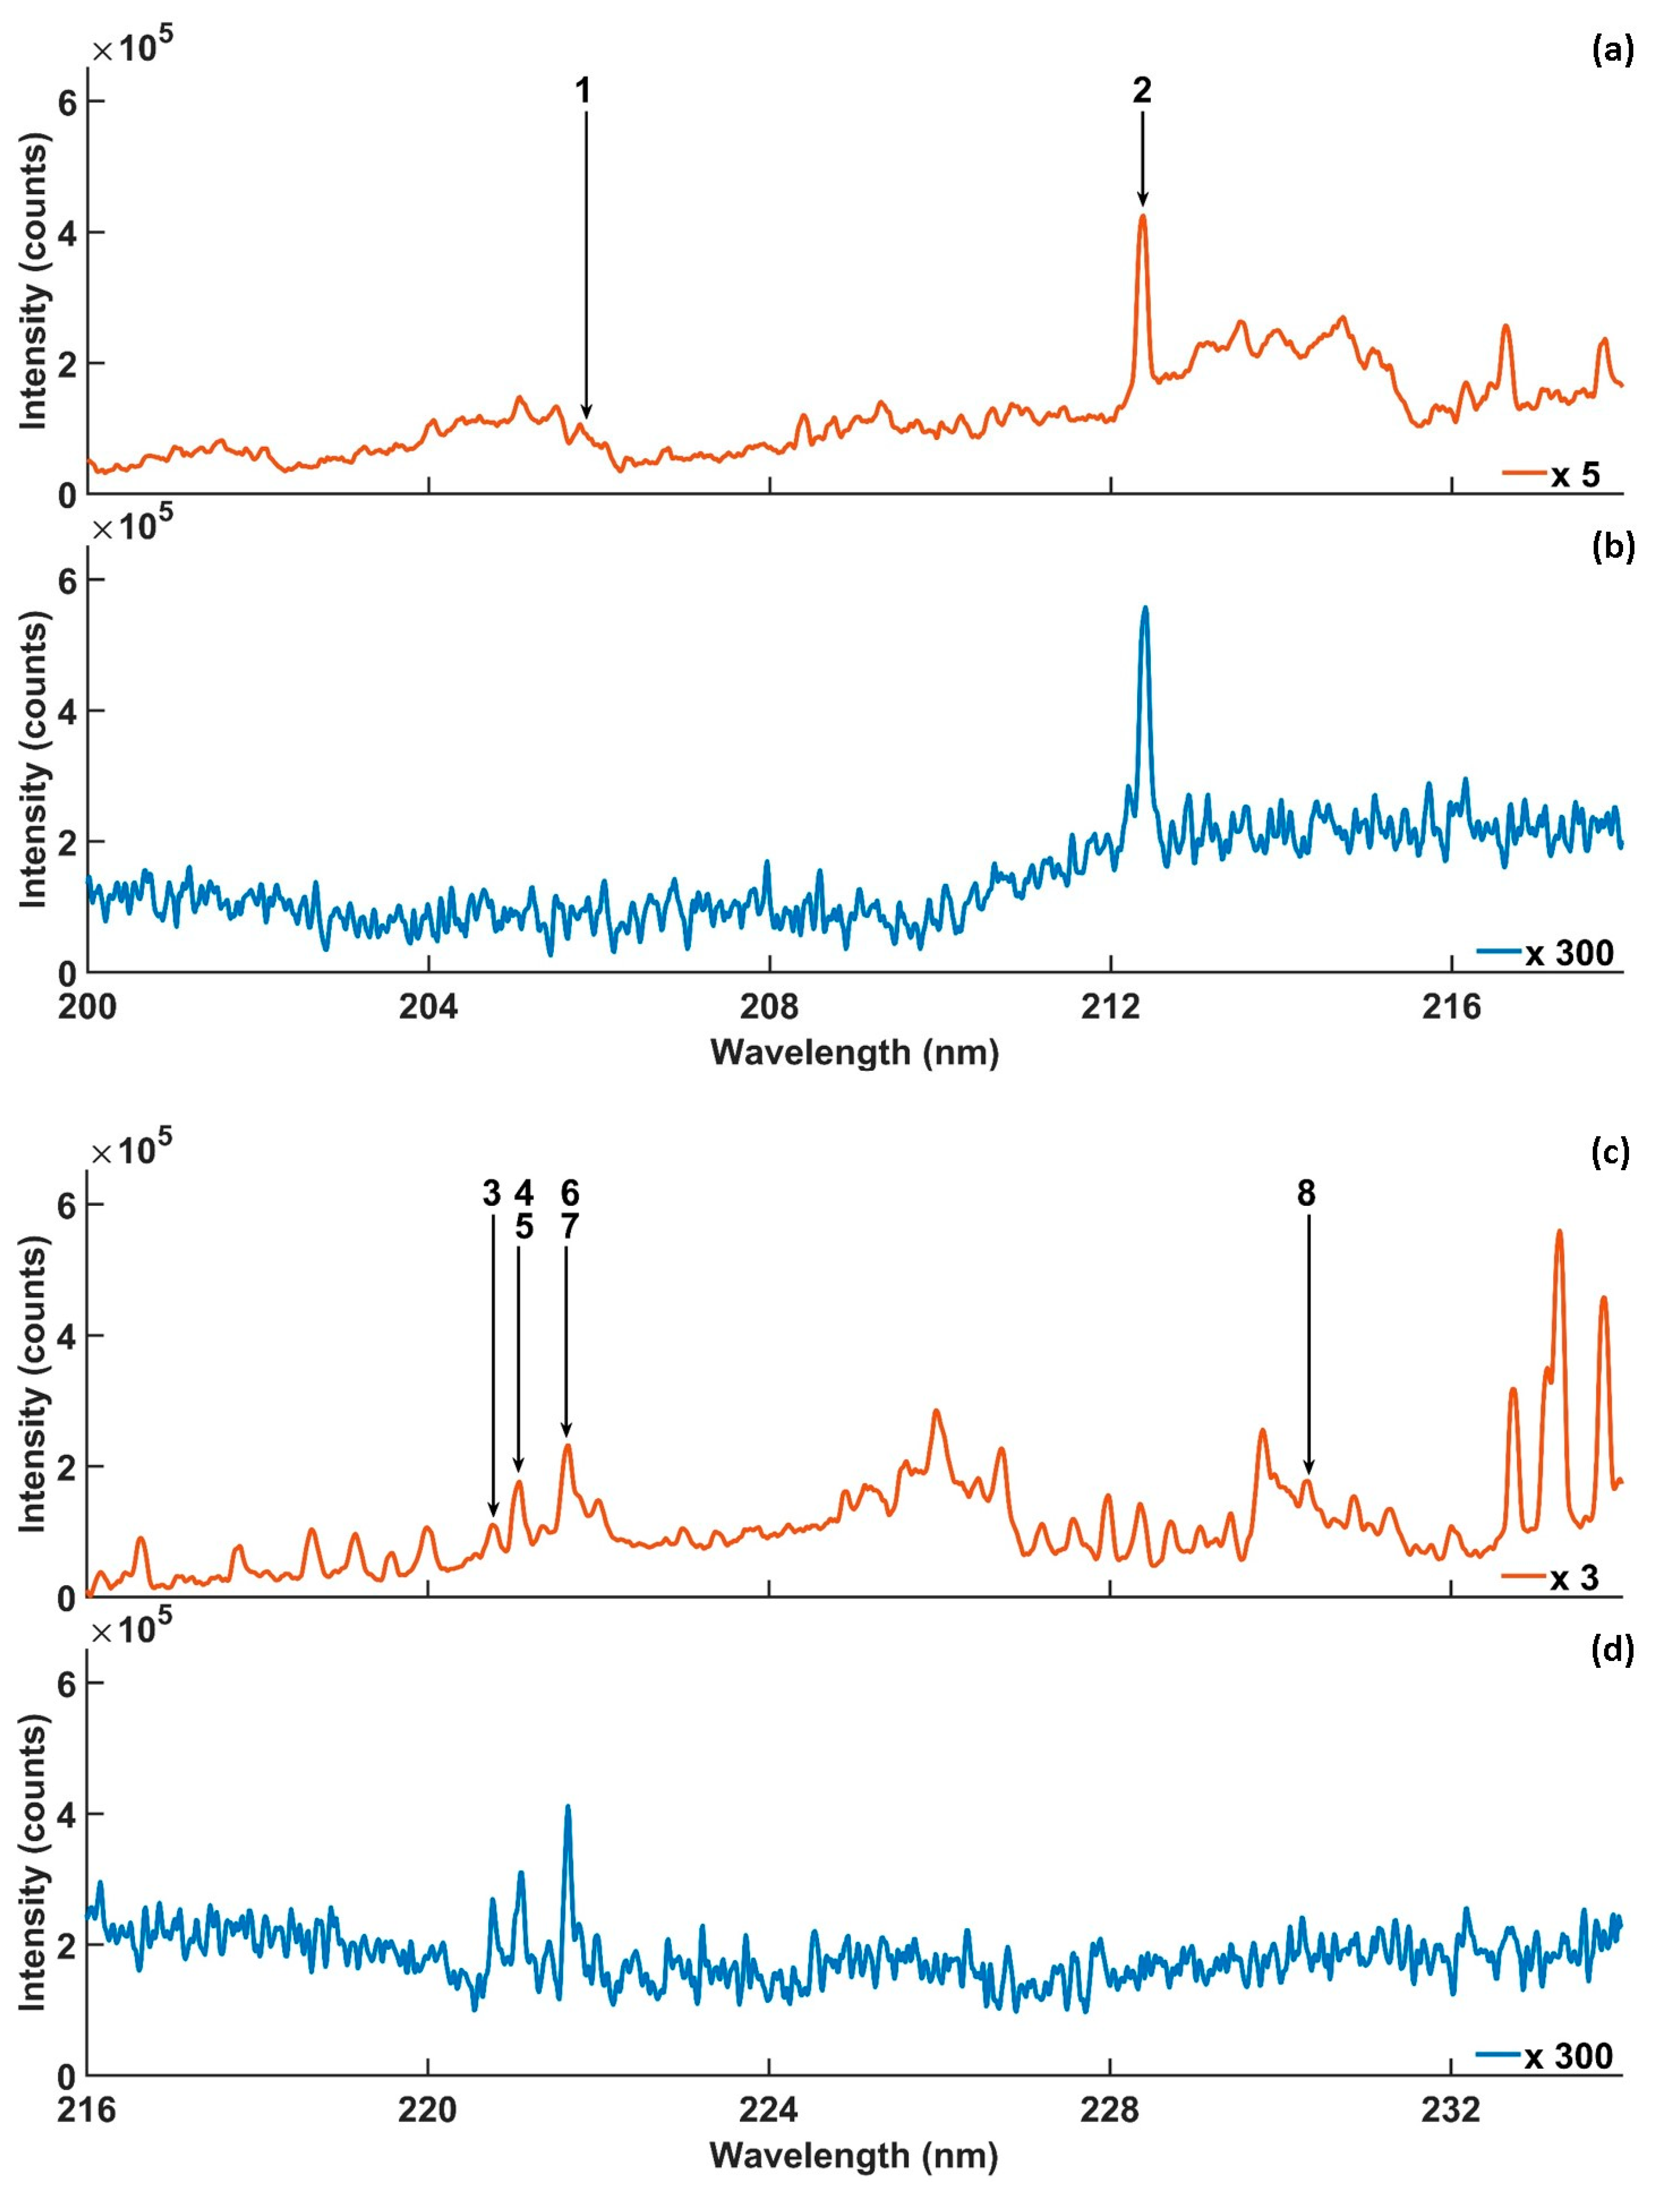
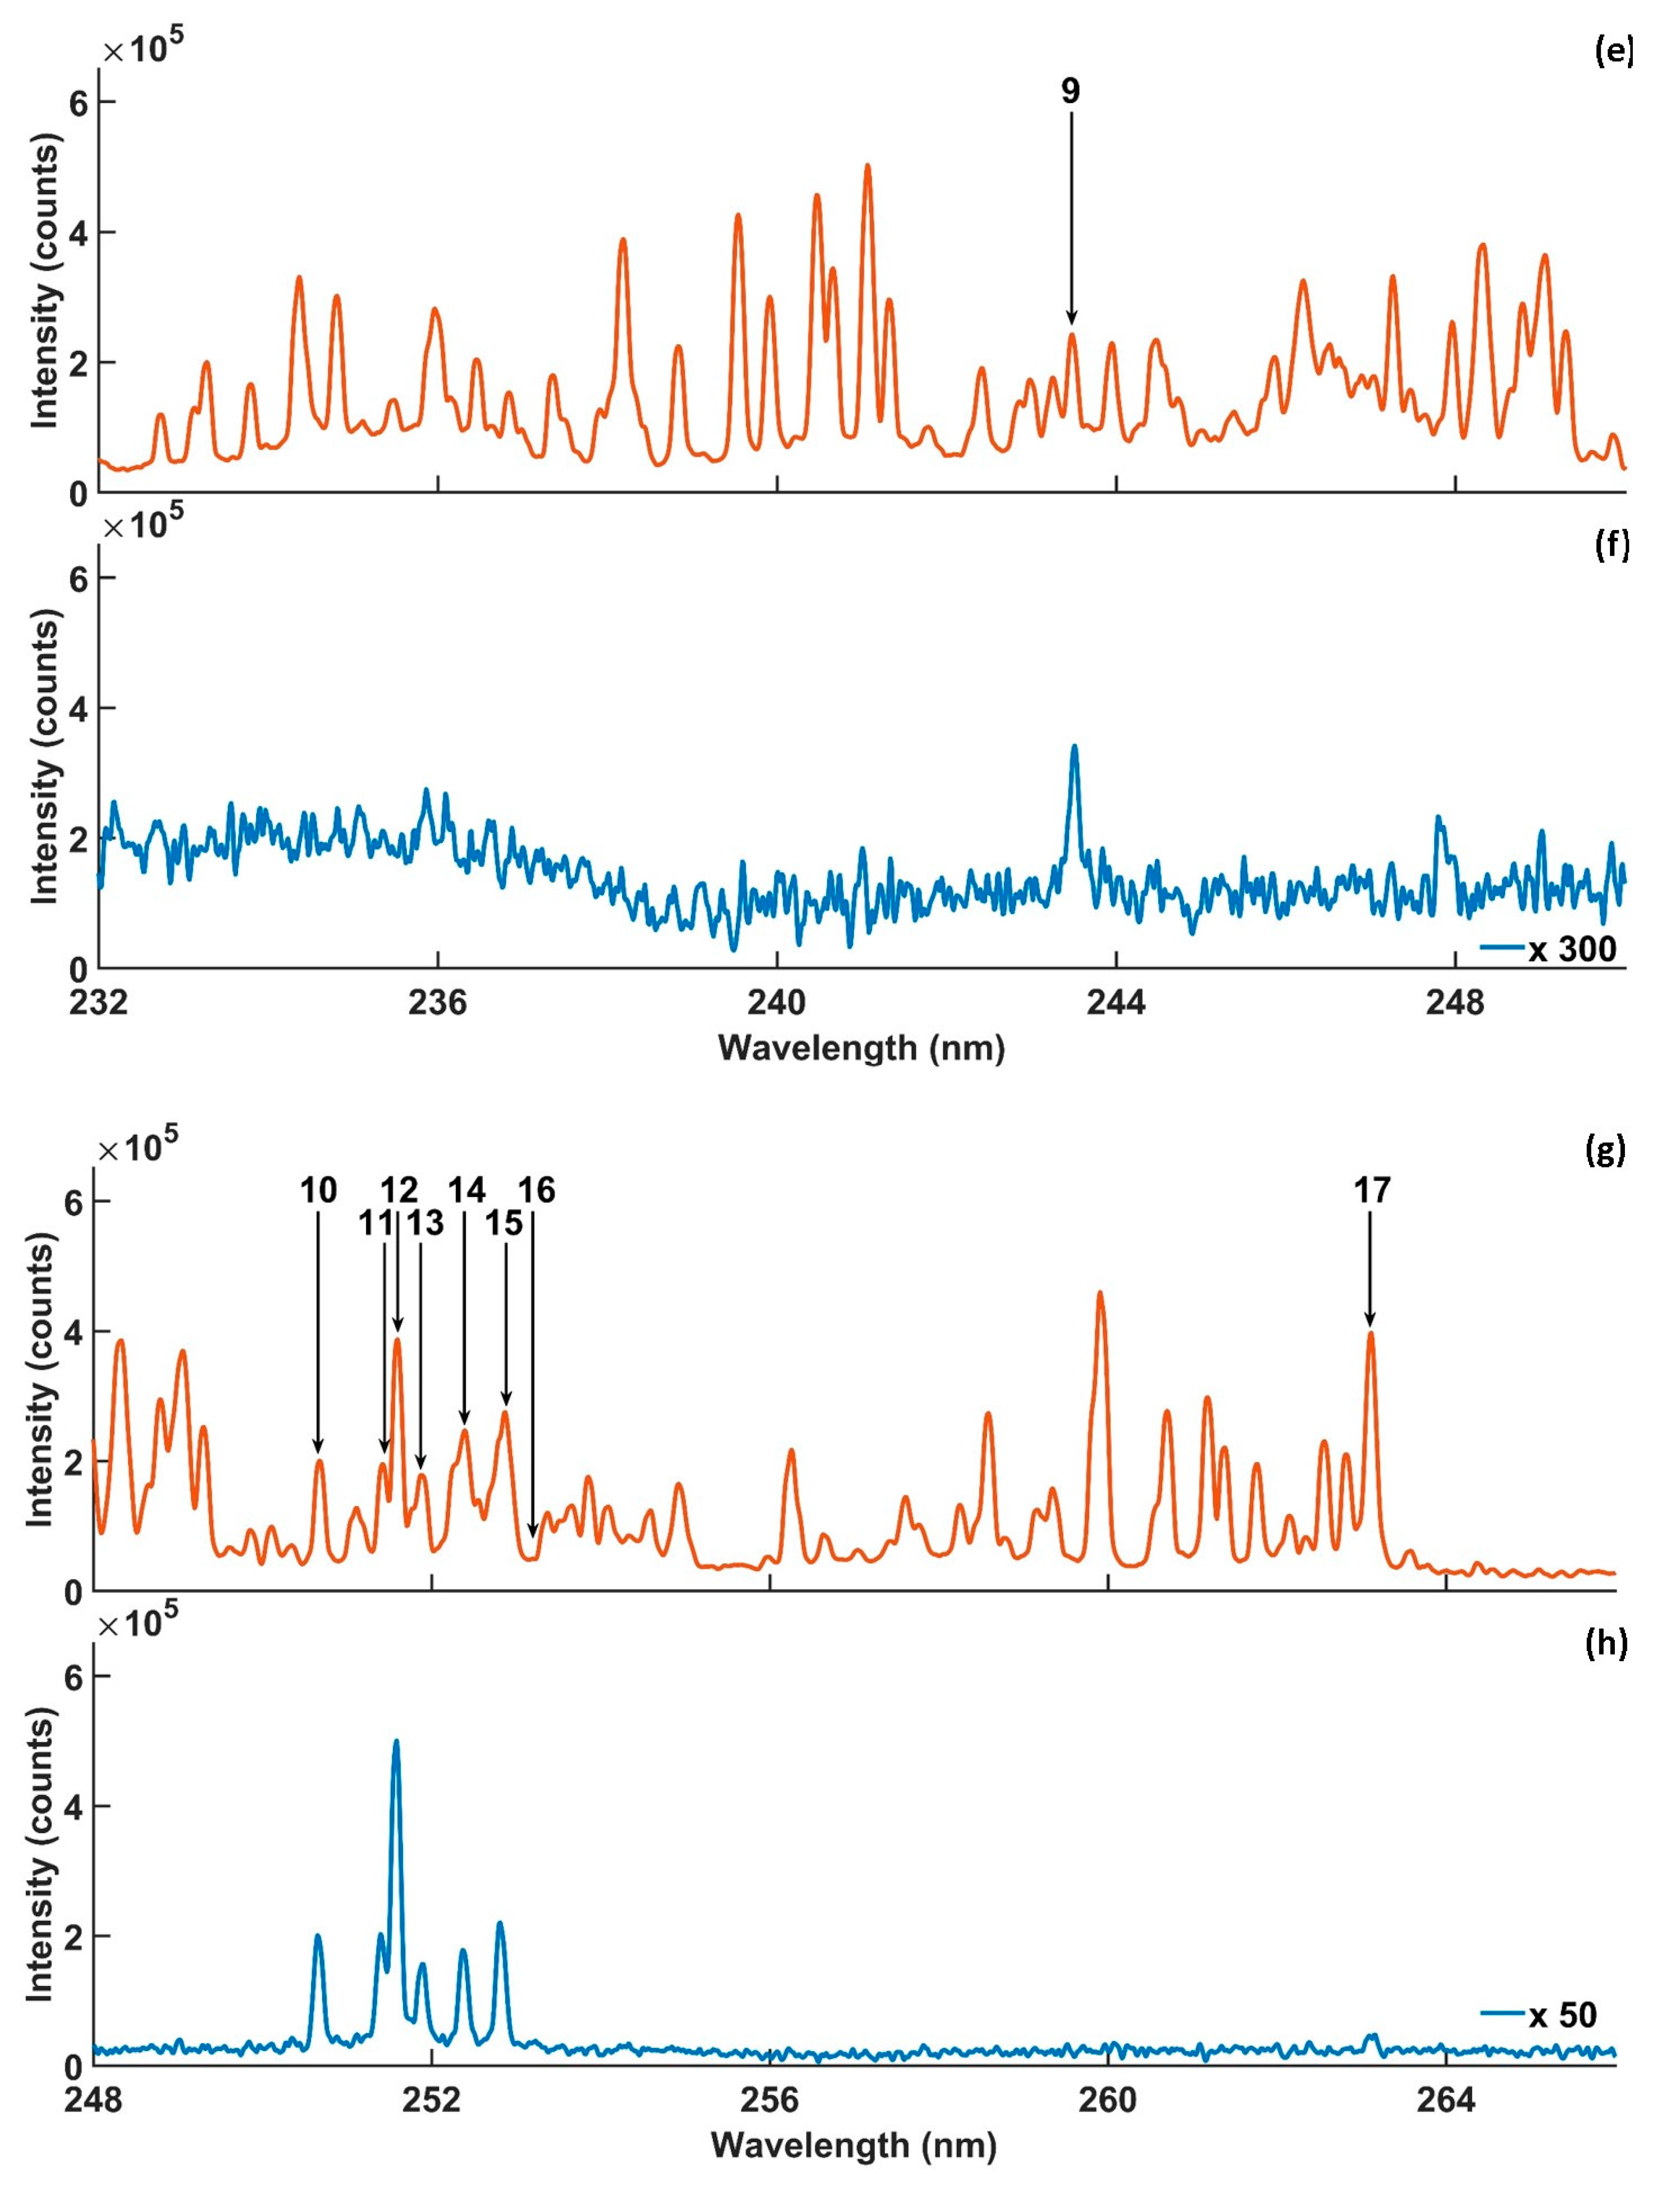
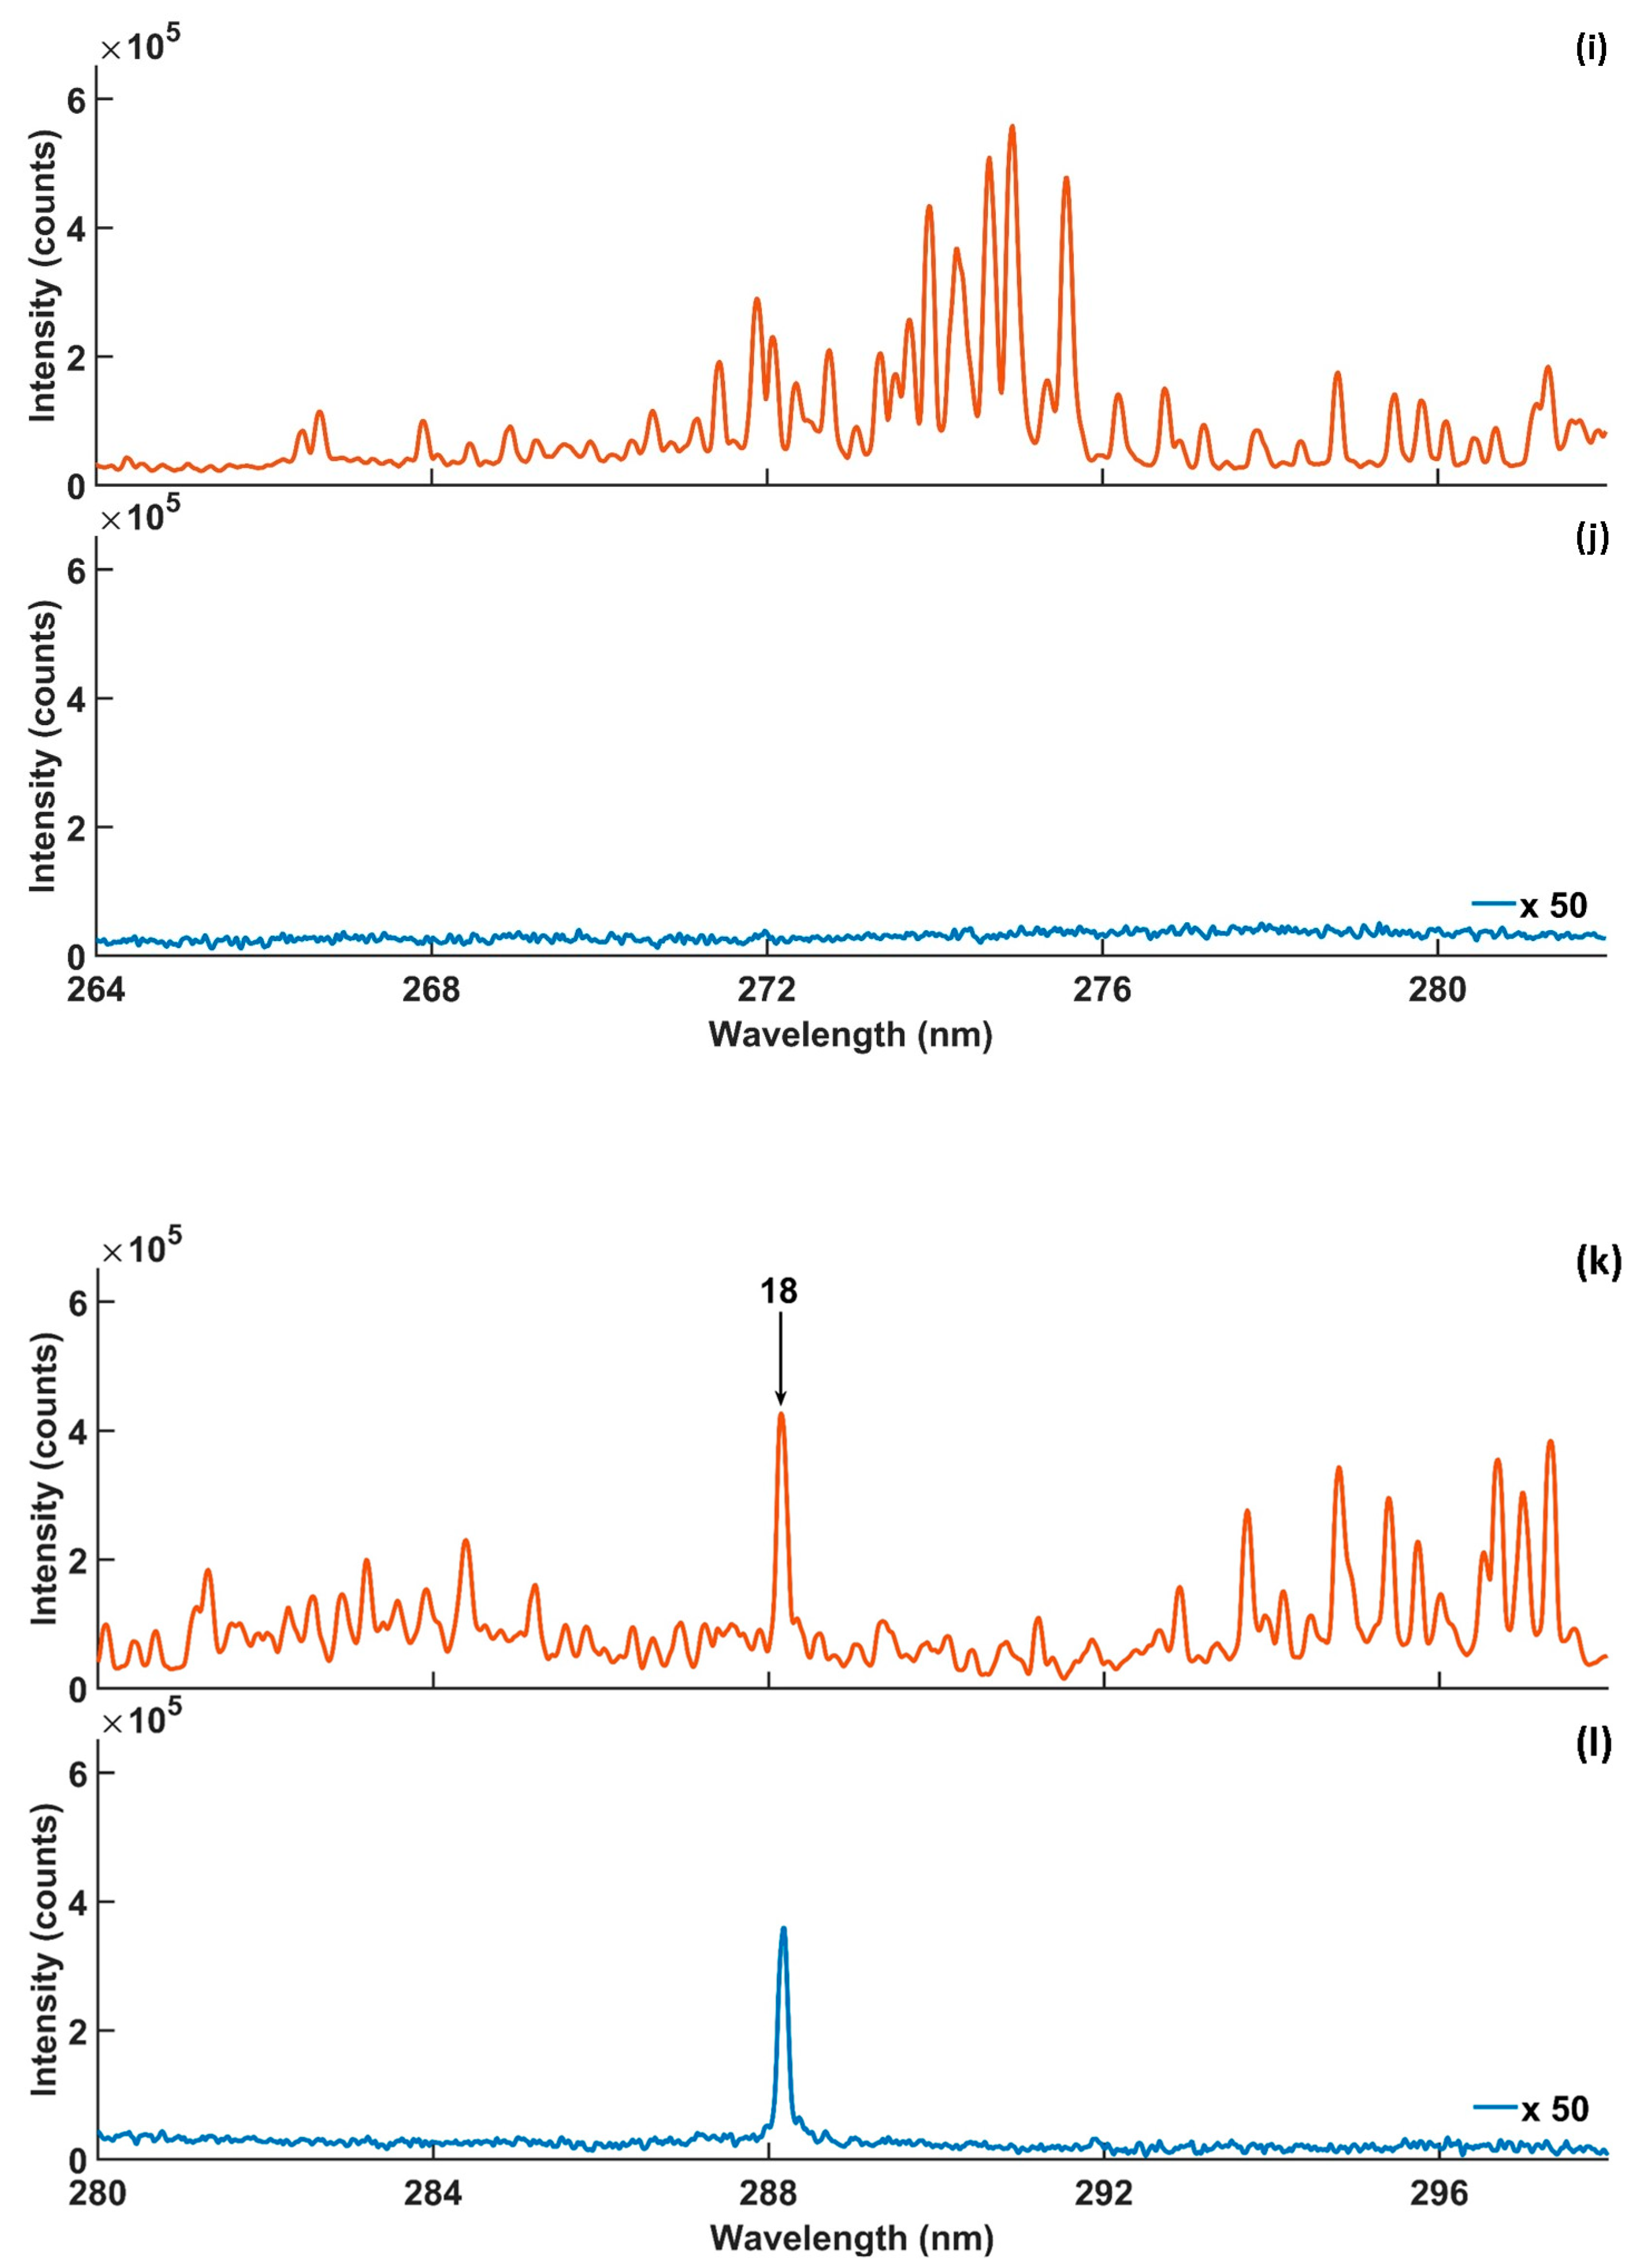
| No. | λ (nm) | Aki | Ek (eV) | Ei (eV) | Enhancement Factors |
|---|---|---|---|---|---|
| 1 | 205.81 | 7 × 10⁷ | 6.8 | 0.08 | Unresolved |
| 2 | 212.41 | 3 × 10⁸ | 6.6 | 0.78 | 30 |
| 3 | 220.8 | 2.6 × 10⁷ | 5.61 | 0.00 | Spectral interference |
| 4 | 221.1 | 3.5 × 10⁷ | 5.61 | 0.009 | Spectral interference |
| 5 | 221.17 | 1.8 × 10⁷ | 5.61 | 0.009 | Spectral interference |
| 6 | 221.67 | 4.5 × 10⁷ | 5.62 | 0.027 | Spectral interference |
| 7 | 221.8 | 1.1 × 10⁷ | 5.61 | 0.027 | Spectral interference |
| 8 | 230.3 | 3.5 × 10⁸ | 7.3 | 1.90 | Unresolved |
| 9 | 243.5 | 4.4 × 10⁷ | 5.87 | 0.78 | Unresolved |
| 10 | 250.7 | 5.5 × 10⁷ | 4.95 | 0.009 | 45.5 |
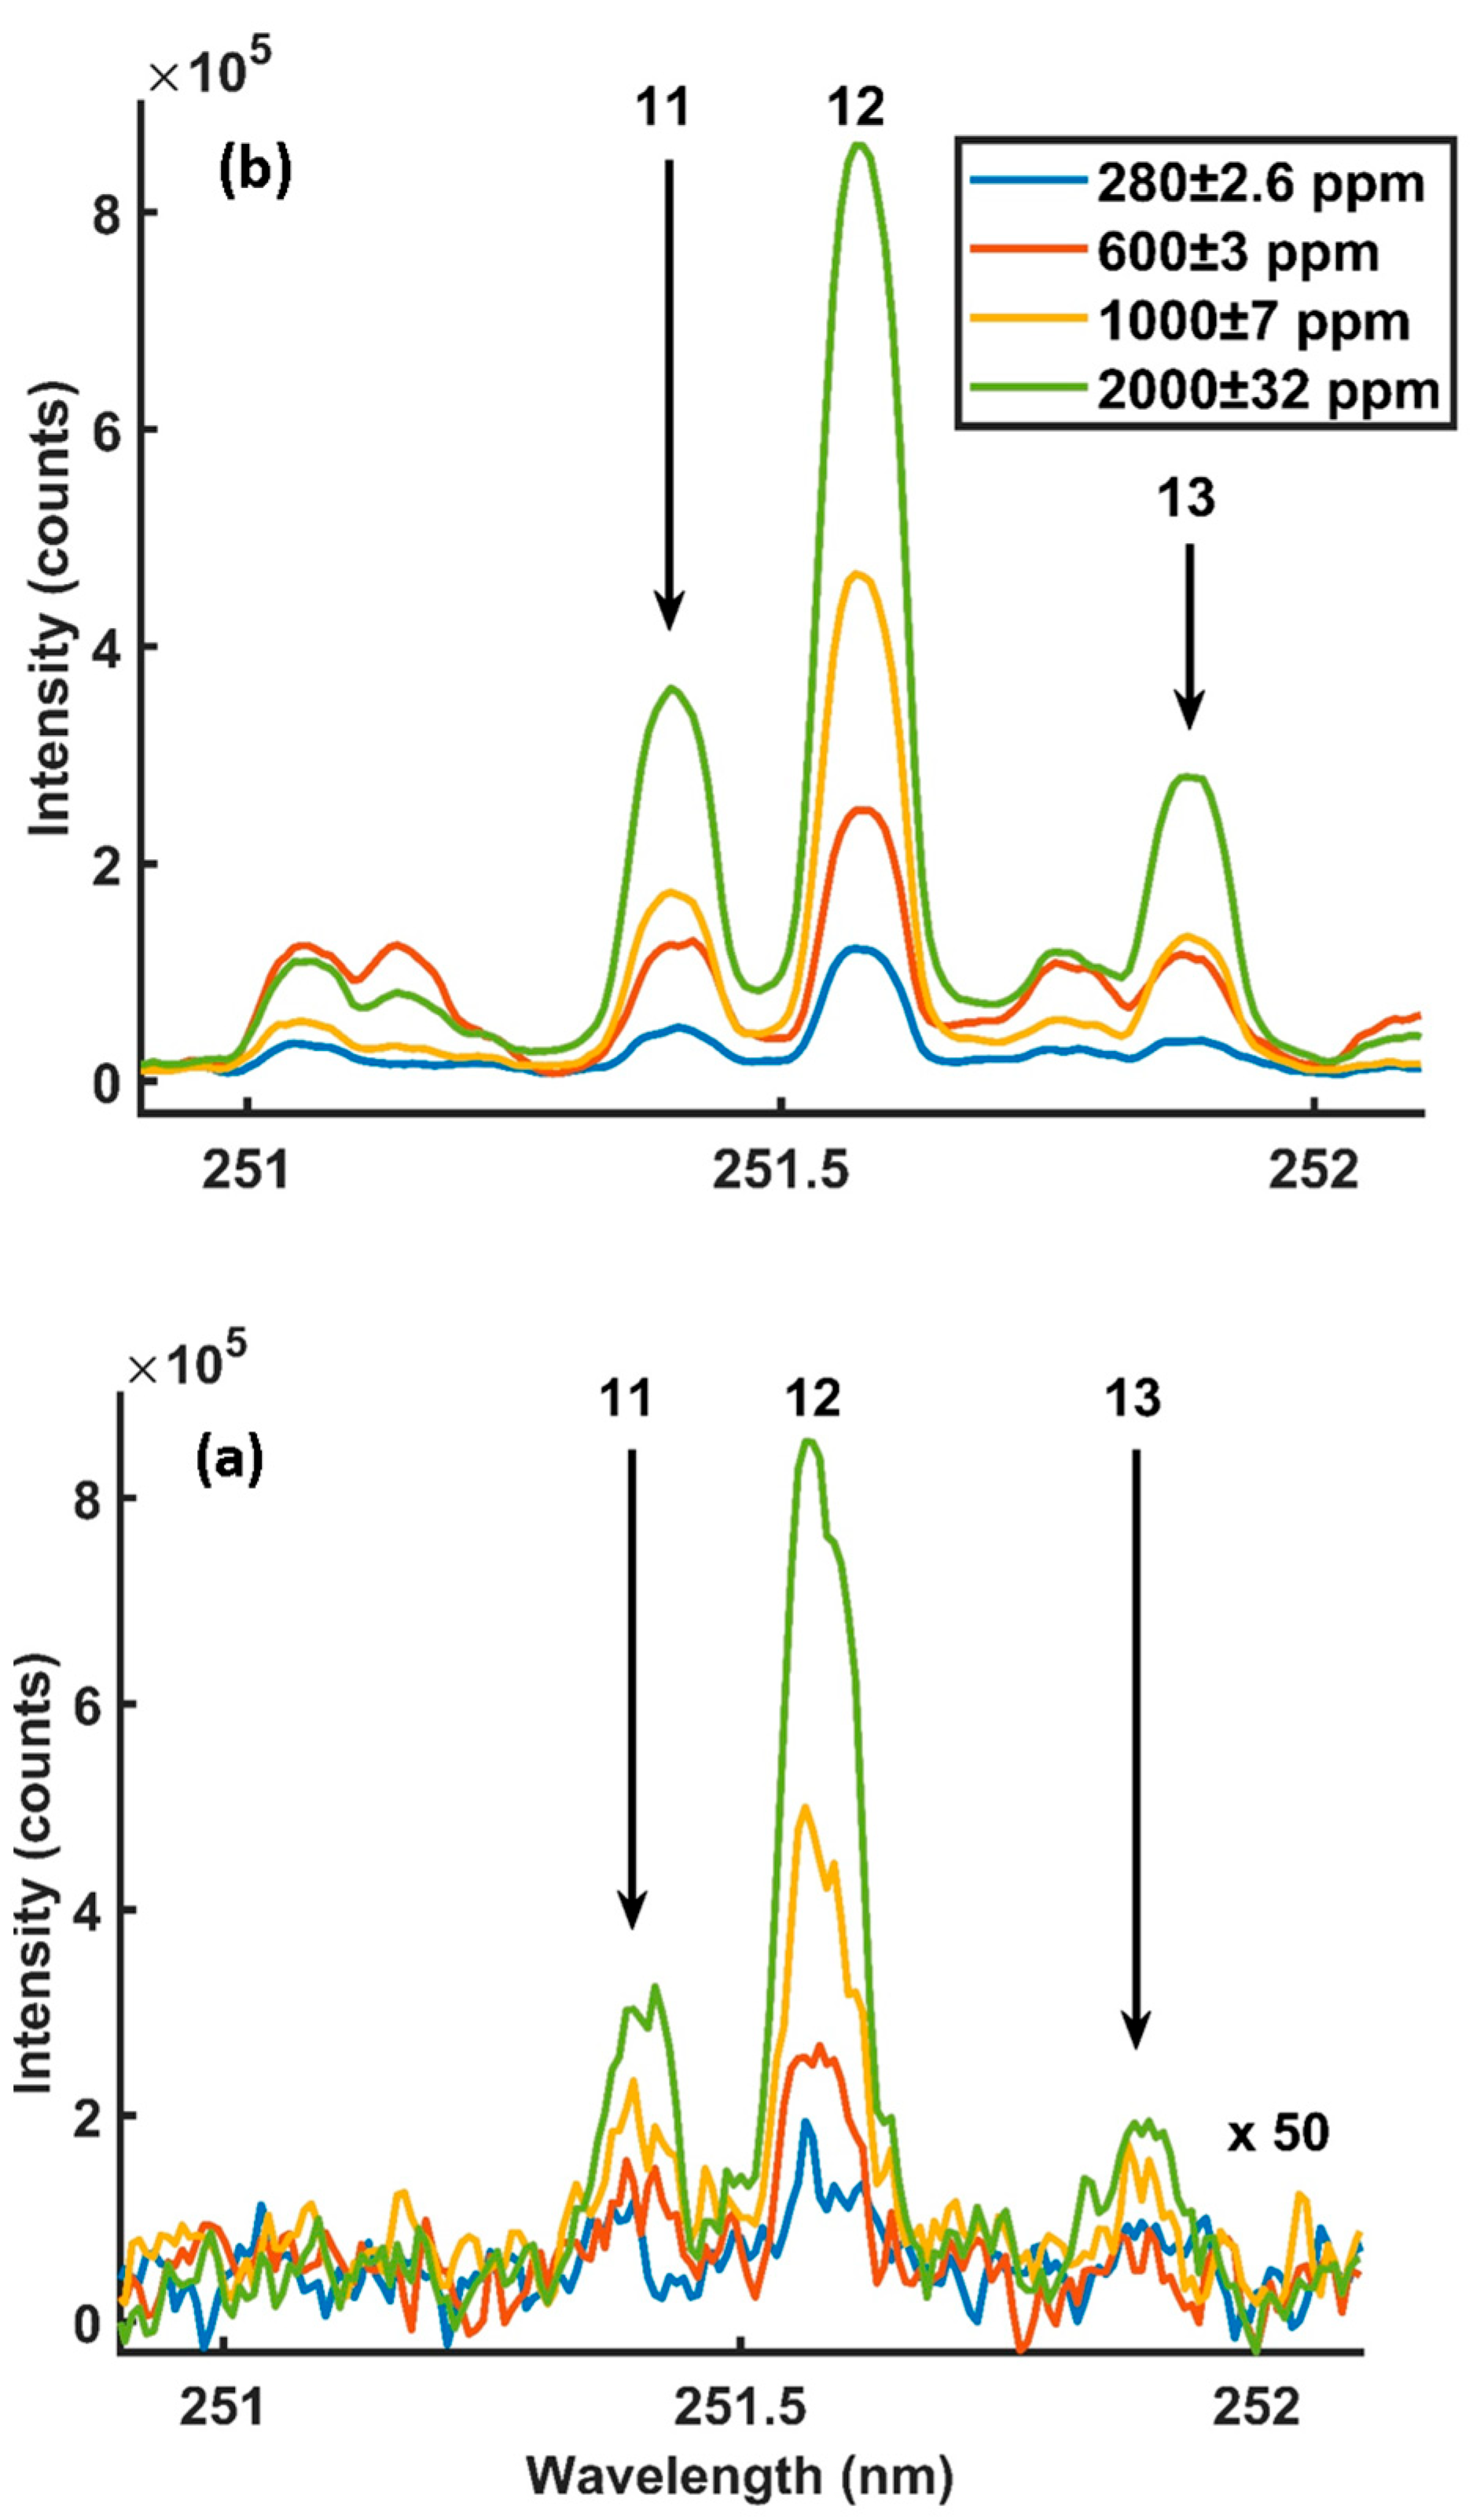
| 11 | 251.43 | 7.4 × 10⁷ | 4.93 | 0.00 | Spectral interference |
| 12 | 251.61 | 1.7 × 10⁸ | 4.95 | 0.027 | Spectral interference |
| 13 | 251.92 | 5.5 × 10⁷ | 4.93 | 0.009 | Spectral interference |
| 14 | 252.41 | 2.2 × 10⁸ | 4.92 | 0.009 | Spectral interference |
| 15 | 252.85 | 9 × 10⁷ | 4.93 | 0.027 | Spectral interference |
| 16 | 253.24 | 2.5 × 10⁷ | 6.8 | 1.90 | Undetectable |
| 17 | 263.13 | 1.1 × 10⁸ | 6.62 | 1.90 | Unresolved |
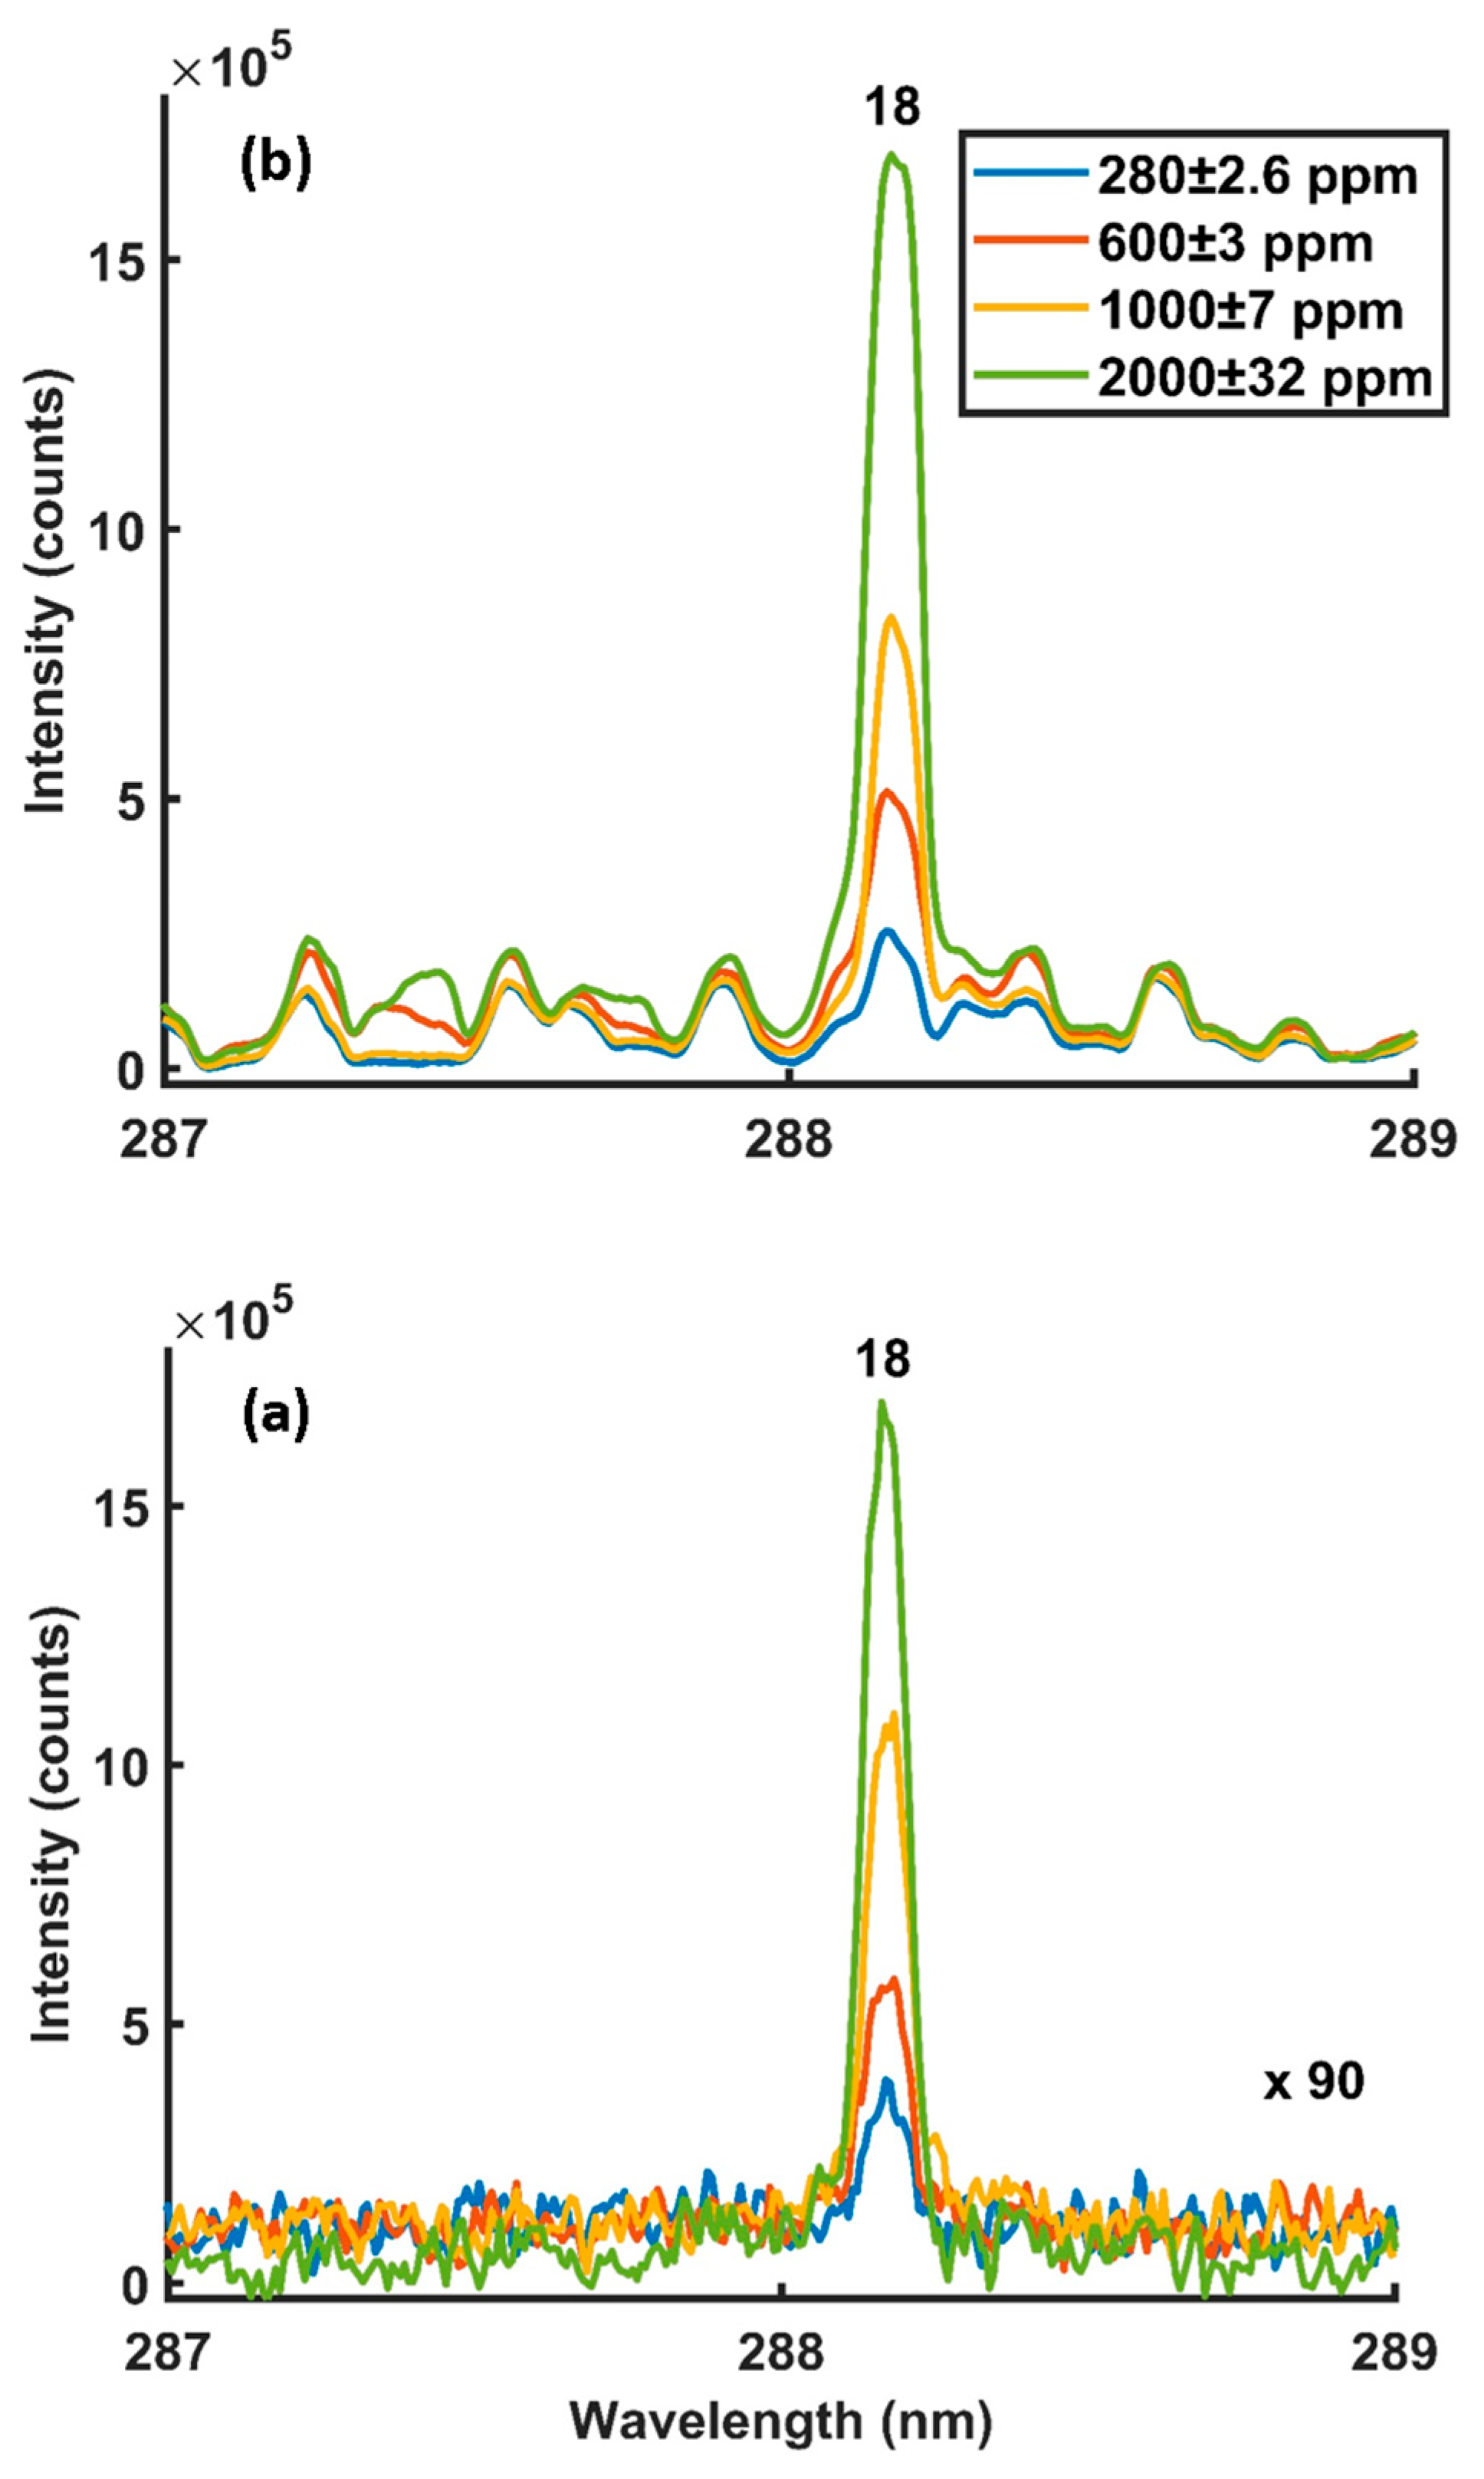
| 18 | 288.16 | 2.2 × 10⁷ | 5.08 | 0.78 | 57.6 |
| Technique | Detection Phase | Laser Energy (mJ) | Matrix | λ (nm) | LoD (ppm) | Ref. |
|---|---|---|---|---|---|---|
| LIBS | Solid | 60 | Al alloy | 251.6 | 14 | [22] |
| LIBS LIBS | Solid Solid | 25 25 | CeO2 CeO2 | 288.16 288.16 | 40 60 | [23] [23] |
| LIBS LIBS | Solid Solid | 220 220 | Leaves Leaves | 212.4 288.16 | 160 20 | [24] [24] |
| LIBS | Solid | 50 | Paper | 288.16 | 5.2 | [25] |
| LIBS DP-LIBS | Solid Solid | 70 70 | Paper Paper | 251.6 251.6 | 19 11 | [26] [26] |
| LIBS LIBS-LIMFG a LIBS-LIMFE b | Solid Solid Solid | 60 60 60 | Steel alloy Steel alloy Steel alloy | 288.16 248.68 248.68 | 2014 335 187 | [27] [27] [27] |
| LIBS, in He, 2.6 kPa | Solid | 15 | Steel alloy | 251.6 | 15 | [28] |
| LIBS, in Ar, ambient pressure | Solid | 100 | Steel alloy | 288.16 | 80 | [29] |
| LIBS DP-LIBS | Solid Solid | 50 50 | Steel alloy Steel alloy | 288.16 288.16 | 100 40 | [30] [30] |
| LIBS LIBS MA-LIBS MW–LIBS | Liquid Liquid Liquid Liquid | 8 8 8 8 | Water Water Water Water | 251.6 288.16 251.6 288.16 | 53 18.3 3.3 1.25 | This study This study This study This study |
Disclaimer/Publisher’s Note: The statements, opinions and data contained in all publications are solely those of the individual author(s) and contributor(s) and not of MDPI and/or the editor(s). MDPI and/or the editor(s) disclaim responsibility for any injury to people or property resulting from any ideas, methods, instructions or products referred to in the content. |
© 2024 by the authors. Licensee MDPI, Basel, Switzerland. This article is an open access article distributed under the terms and conditions of the Creative Commons Attribution (CC BY) license (https://creativecommons.org/licenses/by/4.0/).
Share and Cite
Alamri, A.M.; Alwahabi, Z.T. Sensitive Detection of Silicon in Aqua Phase by Microwave-Assisted Laser-Induced Breakdown Spectroscopy. Photonics 2024, 11, 380. https://doi.org/10.3390/photonics11040380
Alamri AM, Alwahabi ZT. Sensitive Detection of Silicon in Aqua Phase by Microwave-Assisted Laser-Induced Breakdown Spectroscopy. Photonics. 2024; 11(4):380. https://doi.org/10.3390/photonics11040380
Chicago/Turabian StyleAlamri, Ali M., and Zeyad T. Alwahabi. 2024. "Sensitive Detection of Silicon in Aqua Phase by Microwave-Assisted Laser-Induced Breakdown Spectroscopy" Photonics 11, no. 4: 380. https://doi.org/10.3390/photonics11040380
APA StyleAlamri, A. M., & Alwahabi, Z. T. (2024). Sensitive Detection of Silicon in Aqua Phase by Microwave-Assisted Laser-Induced Breakdown Spectroscopy. Photonics, 11(4), 380. https://doi.org/10.3390/photonics11040380