Abstract
We present a low-noise (<10 µ) broadband Faraday Rotation Spectroscopy method which is feasible for near-ultraviolet through near-infrared wavelengths. We demonstrate this in the context of a high-precision spectroscopy experiment using a heated Pb vapor cell and two different lasers, one in the UV (368 nm) and a second in the IR (1279 nm). A key element of the experimental technique is the use of a uniaxial single crystal CeF3 Faraday modulator with excellent transmission and optical rotation properties across the aforementioned wavelength range. Polarimeter performance is assessed as a function of crystal orientation and alignment, AC modulation amplitude, laser power, and laser wavelength. Crystal-induced distortion of the (1279 nm) and (368 nm) spectral lines due to misalignment-induced birefringence is discussed and modeled using the Jones calculus.
1. Introduction
Faraday Rotation Spectroscopy (FRS) is used to probe atomic and molecular structure by measuring the rotation of light polarization that passes through a gaseous sample of atoms or molecules. Owing to its high sensitivity (operable at the µRad/ level or better) FRS has many applications, including oxygen monitoring for medical and environmental purposes [1,2,3,4,5], diode laser frequency stabilization [6], observing fundamental symmetry violations (such as parity non-conservation (PNC) due to the weak interaction [7,8]), and atomic structure measurements [9,10]. It is the latter that has motivated the work discussed herein, but the details presented are applicable to all FRS applications, ranging from ultraviolet (UV) to near infrared (NIR).
In FRS, an atomic/molecular sample is placed between crossed-polarizers, and the transmitted intensity is monitored as the laser frequency is scanned about a resonance line. When subjected to a static magnetic field, the atomic sample exhibits a different frequency response to left- and right-handed polarization components of light, and the transmitted light intensity displays a characteristic optical rotation signal (see Section 4). Analysis of this signal enables for certain atomic properties (such as the quantum mechanical transition amplitude (TA) matrix element, ) to be extracted. Such a measurement requires a polarimeter noise resolution of a few µ, which is achieved with a modulation/demodulation lock-in detection method. To perform this polarization modulation, an optically active material (Faraday rotator) is placed in the beam path and modulated with an AC magnetic field. While there are many different Faraday rotators typically used in FRS (see Table 1), the most common (TGG, terbium doped ‘Faraday glass’, and YIG) do not transmit in the near UV. This limits the range of atomic transitions that can be studied using FRS, and to probe transitions below 400 nm, other spectroscopic techniques (relying on optical absorption) are often necessary. For spectroscopically weak transitions (i.e., transitions with no resolvable absorption feature in their atomic spectrum), this presents a significant challenge. Thus, broadband FRS (from near UV to near IR) is highly advantageous.
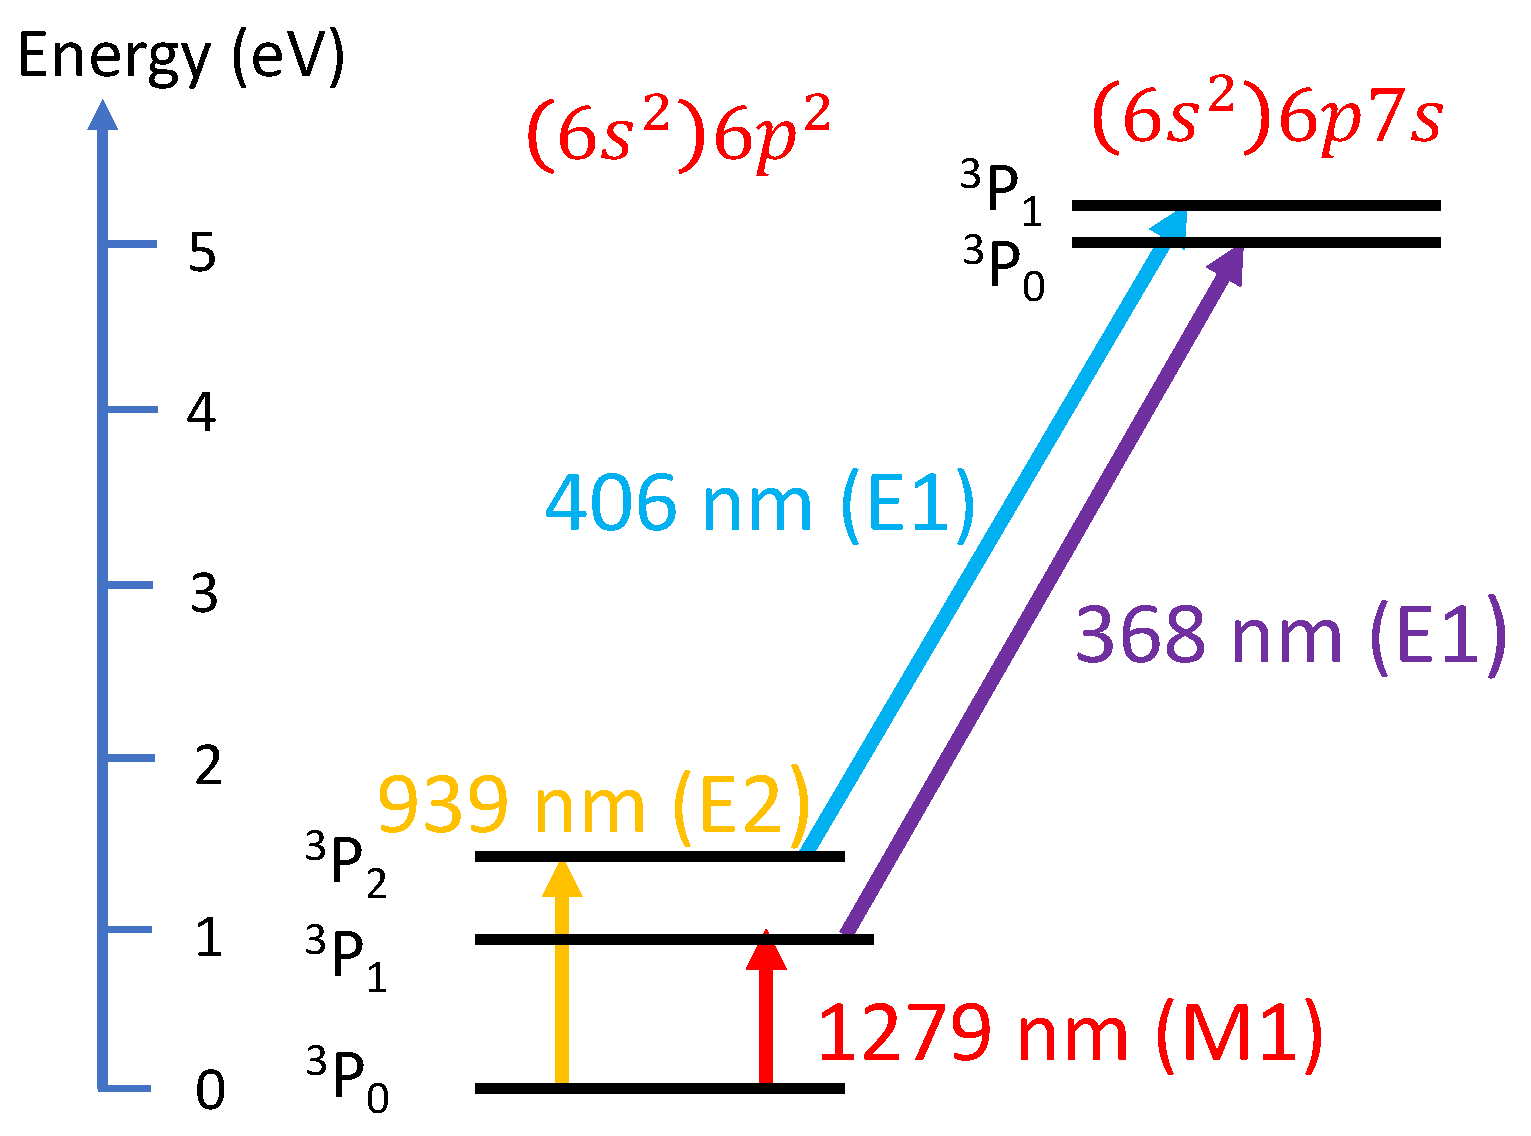
In the 1990s, sub-microradian level Faraday Rotation Spectroscopy was used to measure the weak interaction-induced PNC optical rotation in lead [11,12]. However, the absence of accurate theoretical wavefunction calculations at the time limited its impact in testing electroweak parameters, and attention shifted towards cesium, with its much simpler electronic structure allowing for more stringent tests of theory to be performed [13,14,15]. In recent years, there has been a renewed interest in lead, largely as a result of improved ab initio wavefunction models of tetravalent atomic systems [16]. TA measurements offer an excellent test of these wavefunction models, with our recent Faraday glass-based polarimetry measurement of the forbidden E2 transition at 939 nm (using a similar technique to the PNC measurements of the 1990s) enabling becnhmark comparisons to be made at the 1% level [10]. Following on from that work, we are now in the process of measuring the 368 nm (E1)/1279 nm (M1) and 406 nm (E1)/939 nm (E2) TA ratios (see Figure 1). Given the range of transition wavelengths, carrying out this series of measurements requires a FRS setup capable of broadband operation (UV ↔ NIR), meaning conventional Faraday glass or TGG-based polarimeters are not suitable.
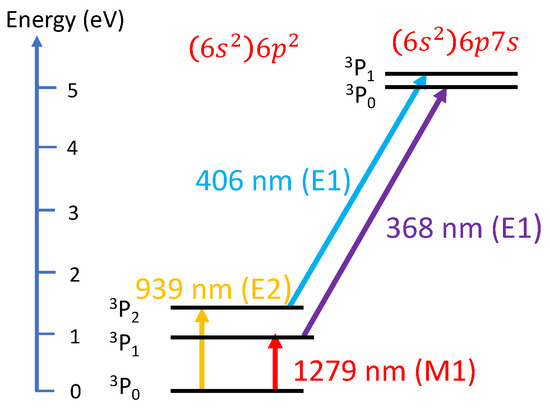
Figure 1.
Transitions between low-lying energy levels in 208Pb. The 368 nm and 406 nm transitions are electric dipole (E1) transitions, the 939 nm is an electric quadrople (E2) transition, and the 1279 nm transition is a magnetic dipole (M1) transition.
A promising alternative is single crystal CeF3, which has excellent optical properties (high transmissivity, large Verdet constant) down to 239 nm [17,18,19,20]. Despite this, a CeF3-based polarimeter is challenging because of its uniaxial crystal structure [18], making it highly sensitive to small changes in crystal orientation. An unexpected consequence of this alignment sensitivity is crystal-induced line shape distortion, where small crystal misalignments introduce dispersive-like features onto the otherwise symmetric Faraday signal. This is something not seen previously in Faraday glass or TGG-based polarimetry. Thus, in order to use CeF3-based polarimetry to accurately extract relevant quantum mechanical properties from atomic spectra (thereby testing the validity of the ab initio theory), a model that accounts for this crystal-induced line shape distortion is needed.
In this article, we present a CeF3-based polarimeter operable from the UV to the NIR. In Section 2, we describe a mechanically stable optical polarimeter with fine mechanical and optical adjustments. In Section 3, we discuss the various contributions to polarimeter noise and describe how noise at the sub-10 µ level is routinely achieved. In Section 4, we demonstrate the feasibility of CeF3-based Faraday Rotation Spectroscopy with optical rotation spectra of the M1 (1279 nm) and E1 (368 nm) transitions, and we present a simple model describing the origin of crystal-induced atomic line shape distortion. In Section 5, we show how line shape distortion can be accounted for in our fitting analysis, and discuss the limitations of our simple Jones calculus model.

Table 1.
Optical properties of commonly used Faraday rotator materials. All Verdet constants are given in rad/T m. The constants, F (rad/T m), G (rad/T m) and the cut-off wavelength, (nm) describe in the single-transition model: , where the Faraday effect is dominated by contributions from a single resonance. Not all listed materials are well-described using this model, and instead literature Verdet constant values at specific wavelengths are given.
| Material | V | F | G | Comments | References | |
|---|---|---|---|---|---|---|
| CeF3 | - | 743.6 | - | 239 | [17] | |
| - | 163.2 | - | 239.23 | along c-axis | [18] | |
| - | 155.2 | - | 245.42 | along a-axis | [18] | |
| - | −789 (4) | 3.41 (2) | 234 (1) | [19] | ||
| - | 260.8 | - | 375.1 | [21] | ||
| - | 697 | - | 245 | [21] | ||
| - | 228(4) | along c-axis | Present work 1 | |||
| TGG 2 | - | 668.8 | - | 258 | [17] | |
| - | 820.3 | −6.2 | 239.3 | [22] | ||
| YIG 3 | @ 1550 nm | - | - | - | Does not transmit <1 µm | [23] |
| PrF3 | - | 1357.7 | - | 184 | [17] | |
| Dy2O3 | @ 633 nm | - | - | - | [24] | |
| @ 1064 nm | - | - | - | [24]. See [19] for complicated model | ||
| EuF2 | - | 231.5 | - | 436 | [25] | |
| LiTbF4 | - | 1190.6 | - | 198 | [26] | |
| LiDyF4 | - | 1530.9 | - | 156 | [26] | |
| LiHoF4 | - | 3815.0 | - | 87 | [26] | |
| LiErF4 | - | 1700.0 | - | 93 | [26] | |
| LiYbF4 | - | 58.0 | - | 163 | [26] |
1 The ratio was determined. Compare to [19], . 2 Tb3Ga5O12. 3 Y3Fe5O12. YIG is not well described using single-transition model. More information can be found in [19].
2. Experimental Setup
2.1. Mechanical Setup
A 5 mm long, 5 mm diameter cylindrical CeF3 single crystal was obtained from Crylink Photonics Co., Ltd., Nanjing, China (see Figure 2). The crystal was z-cut (optic-c axis parallel to the cylindrical z-axis) with manufacturer-quoted tolerance on parallelism better than 1°, and the optical surfaces were polished to surface flatness @ 632 nm. Due to its broadband use, no anti-reflection coating was applied to any of the optical surfaces.
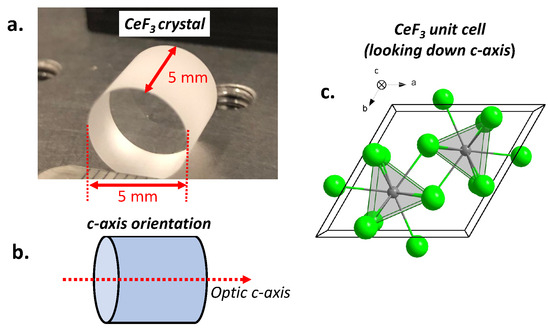
Figure 2.
(a) The mm, 5 mm-long cylindrical CeF3 single crystal from laser-Crylink, grown using the Bridgman-Stockbarger technique. The front and back faces are uncoated and polished to optical grade. (b) Side-on schematic of the CeF3 crystal showing c-axis orientation parallel to cylindrical z-axis. (c) CeF3 unit cell (Ce3+ in gray, F− in green), as seen down the optic-c axis. The a and b axes are oriented at 120°. CeF3 is reported to have a trigonal tysonite-type crystal structure (sp. gr. ) [27].
The crystal was securely placed in a 3D-printed holder and attached to a rotational mount, which itself was fixed to a number of mechanically stable optical mounts. In total, there were five degrees of freedom to which the position of the crystal could be finely adjusted (see Figure 3). The shaft of the 3D-printed crystal mount was inserted into a 5 cm long solenoid capable of producing a 10 mT field when driven by 2 A of AC current. This solenoid was driven at 500 Hz by the amplified output of a Stanford Research Systems, Sunnyvale, CA, USA DS335 synthesized function generator. Surrounding the solenoid-crystal mount system was another pair of coils (2 mT/A) placed in quasi-Helmholtz configuration (shown schematically in Figure 4). We applied a varying DC current from a separate precision current source to this set of coils in order to measure the Verdet constant at different wavelengths (see Section 4.1).
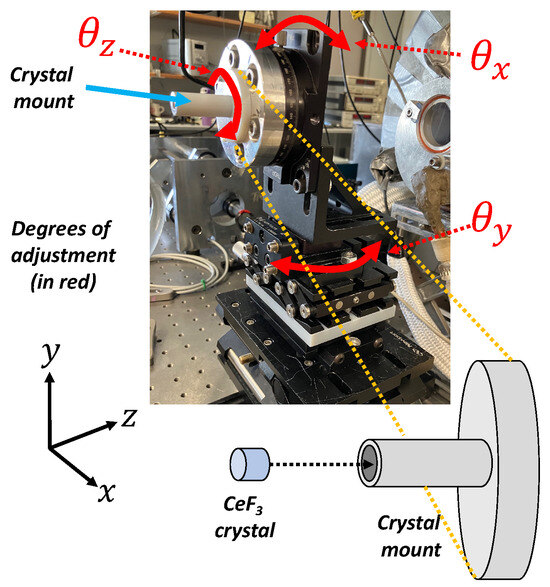
Figure 3.
Mount and adjustment apparatus for the CeF3 crystal, showing the three rotational degrees of freedom (, , ). Polarimeter noise is highly sensitive to rotational adjustments, as discussed in Appendix A. In addition, the mount apparatus is also configured to make small translational adjustments in the x and y directions.
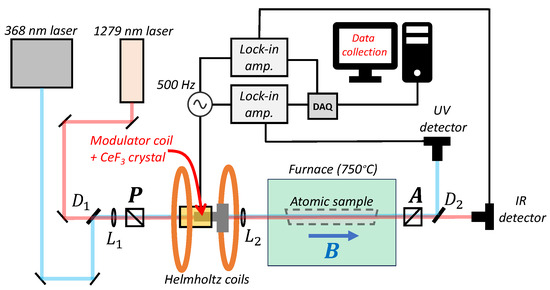
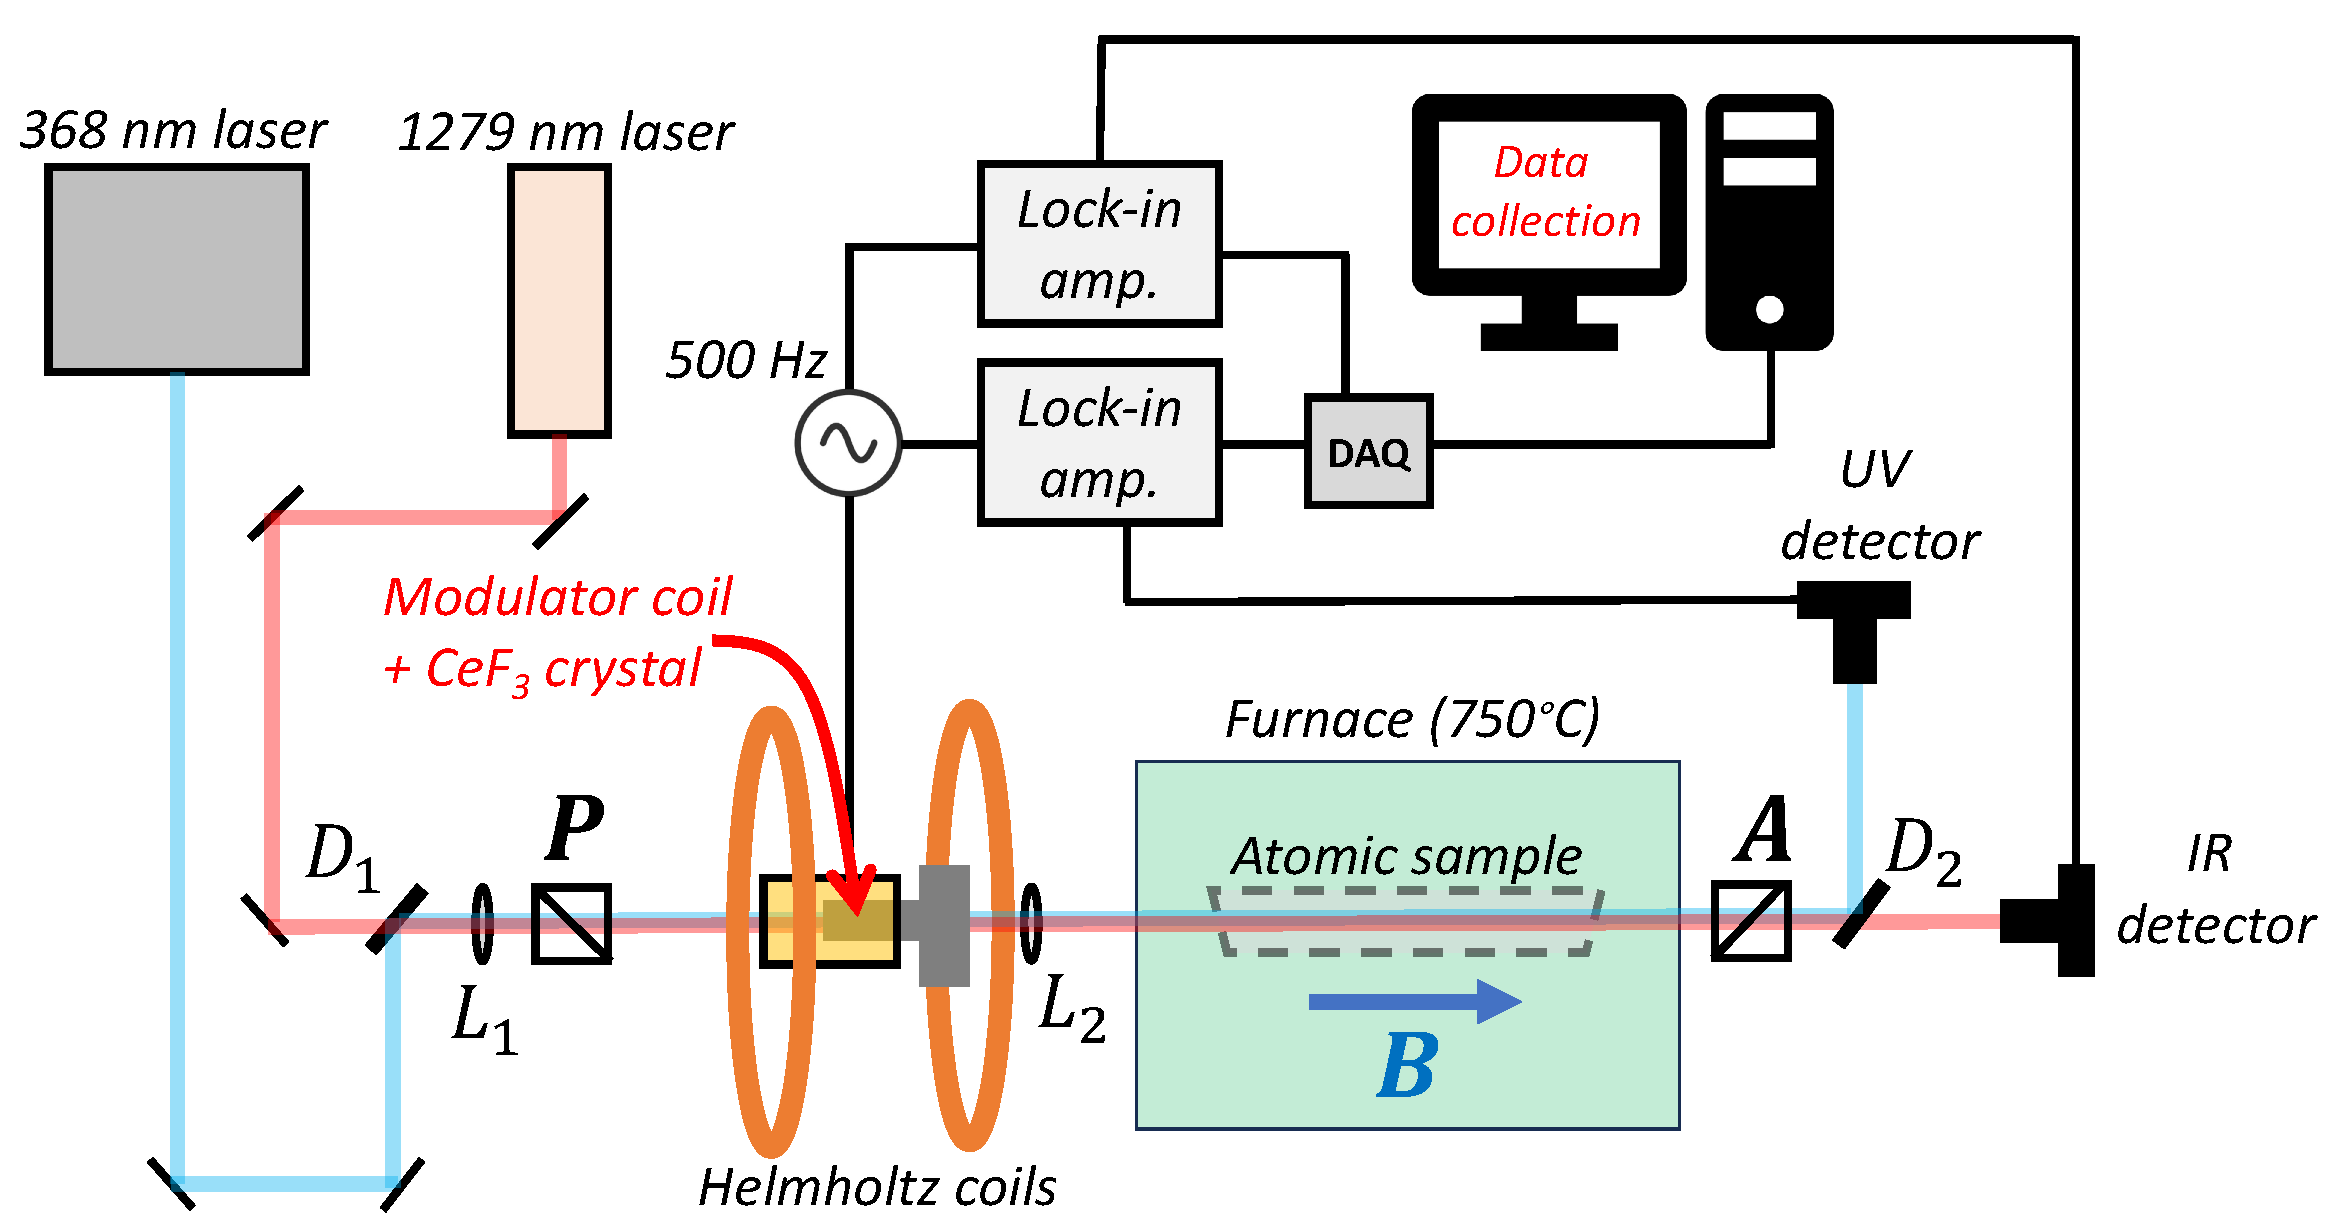
Figure 4.
Optical setup of the polarimeter. The 368 nm and 1279 nm lasers are combined using a dichroic mirror, D1. The beams (gently focused and collimated using lenses and ) pass through a polarizer, P, and then through the crystal modulator, where the plane of light polarization is modulated at 500 Hz. The modulated light then passes through a rotationally adjustable analyzer, A, before the beams are separated by a second dichroic mirror, , and into their respective detectors. The path length between P and A is about 2 m, and the beam divergence is around 5 mrad. and lock-in detection schemes are used for both lasers, where the lock-in outputs are collated with a data acquisition board (DAQ) and recorded on a computer. The location of the atomic sample is shown in dashed gray inside the vacuum furnace (depicted in green).
2.2. Optical Setup
A schematic depiction of the optical setup is given in Figure 4. The CeF3 crystal and associated mount was placed between two orthogonally oriented Glan‚ÄìThompson calcite polarizers from Karl Lambrecht Corp., Chicago, IL, USA (MGT25E-10), both with rated extinction ratios of . The optical paths from two laser systems—a home-built UV mW external cavity diode laser (ECDL) at 368 nm, and an infrared ∼25 mW ECDL (Sacher‚ÄìLasertechnik GmbH, Marburg, Germany TEC 150) tuned to 1279 nm—were combined using a dichroic mirror (), and were configured for the beam paths of both lasers to be overlapped. A lens () was placed before the polarizer (P) to gently focus the beam at the position of the crystal, and a collimating lens () was placed shortly after the crystal to minimize beam divergence downstream. Between and , we estimate a modest beam divergence of mrad. After the analyzer (A), a second dichroic mirror () was used to separate the beams, before they were directed to individual photodetectors. The location of the atomic Pb sample is given in gray, and an arrow represents the magnetic field used to induce optical activity in the Pb vapor.
2.3. Optical Properties of the CeF3 Modulator
With the polarizers fixed in crossed-nicols configuration, and the AC modulation field turned off, the normalized laser intensity emerging through the polarizer → CeF3 analyzer setup is given by
where is the rotational orientation of the crystal about its cylindrical axis (see Figure 3). The Jones calculus expressions for (analyzer), (crystal), and (polarizer) are given in Appendix A. With respect to the cylindrical z-axis of the crystal, laser beam and optic-c axis misalignments ( and , respectively) give rise to a misalignment-induced linear birefringence, which affects the transmitted intensity as a function of (see Appendix A).
Figure 5 shows a plot of transmitted laser intensity (at nm) as a function of for a particular alignment configuration. Experimental data are shown in red, while the model evaluated at reasonable experimental values is given in blue. In each case, a clear -dependence is observed. When perfectly aligned along the optic-c axis, no -dependence of the transmitted intensity is expected. However, an effective birefringence arises due to projections of the fast and slow crystal axes onto the plane. From our setup, we estimate that such misalignments of and are around 1°. In addition to this misalignment-induced birefringence, there may also be effects caused by crystal imperfections, as is described in [28], crystal nutation, where the rotation axis does not perfectly overlap with the cylindrical z-axis, and non-ideal beam properties. These are discussed in more detail in Section 5.2. Optimal noise performance is achieved when the crystal is aligned at the lowest intensity minimum, as suggested in Figure 5.
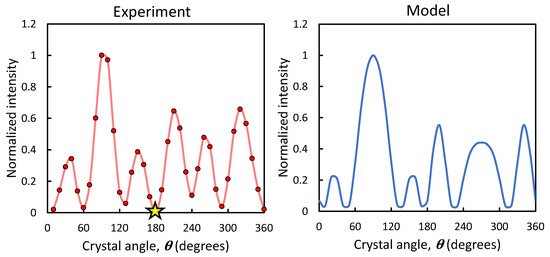
Figure 5.
Laser intensity through the polarizer → crystal → analyzer system as a function of crystal rotation angle, . Experimental data are shown on the left in red, with the red line joining the points acting as a guide for the eye. The star indicates the global intensity minimum. The blue curve on the right shows the model (Equation (A8) of the Appendix A.1) evaluated with small misalignment angles (a few degrees) and reasonable birefriengence values [29]. Despite its limitations (see Section 5.2), the model is able to qualitatively describe the overall -dependent intensity pattern of the crystal, although reproducing the empirical -dependent transmission exactly is not possible. Small changes to the crystal position result in vastly different intensity patterns.
3. Polarimeter Performance
3.1. Polarimeter Noise
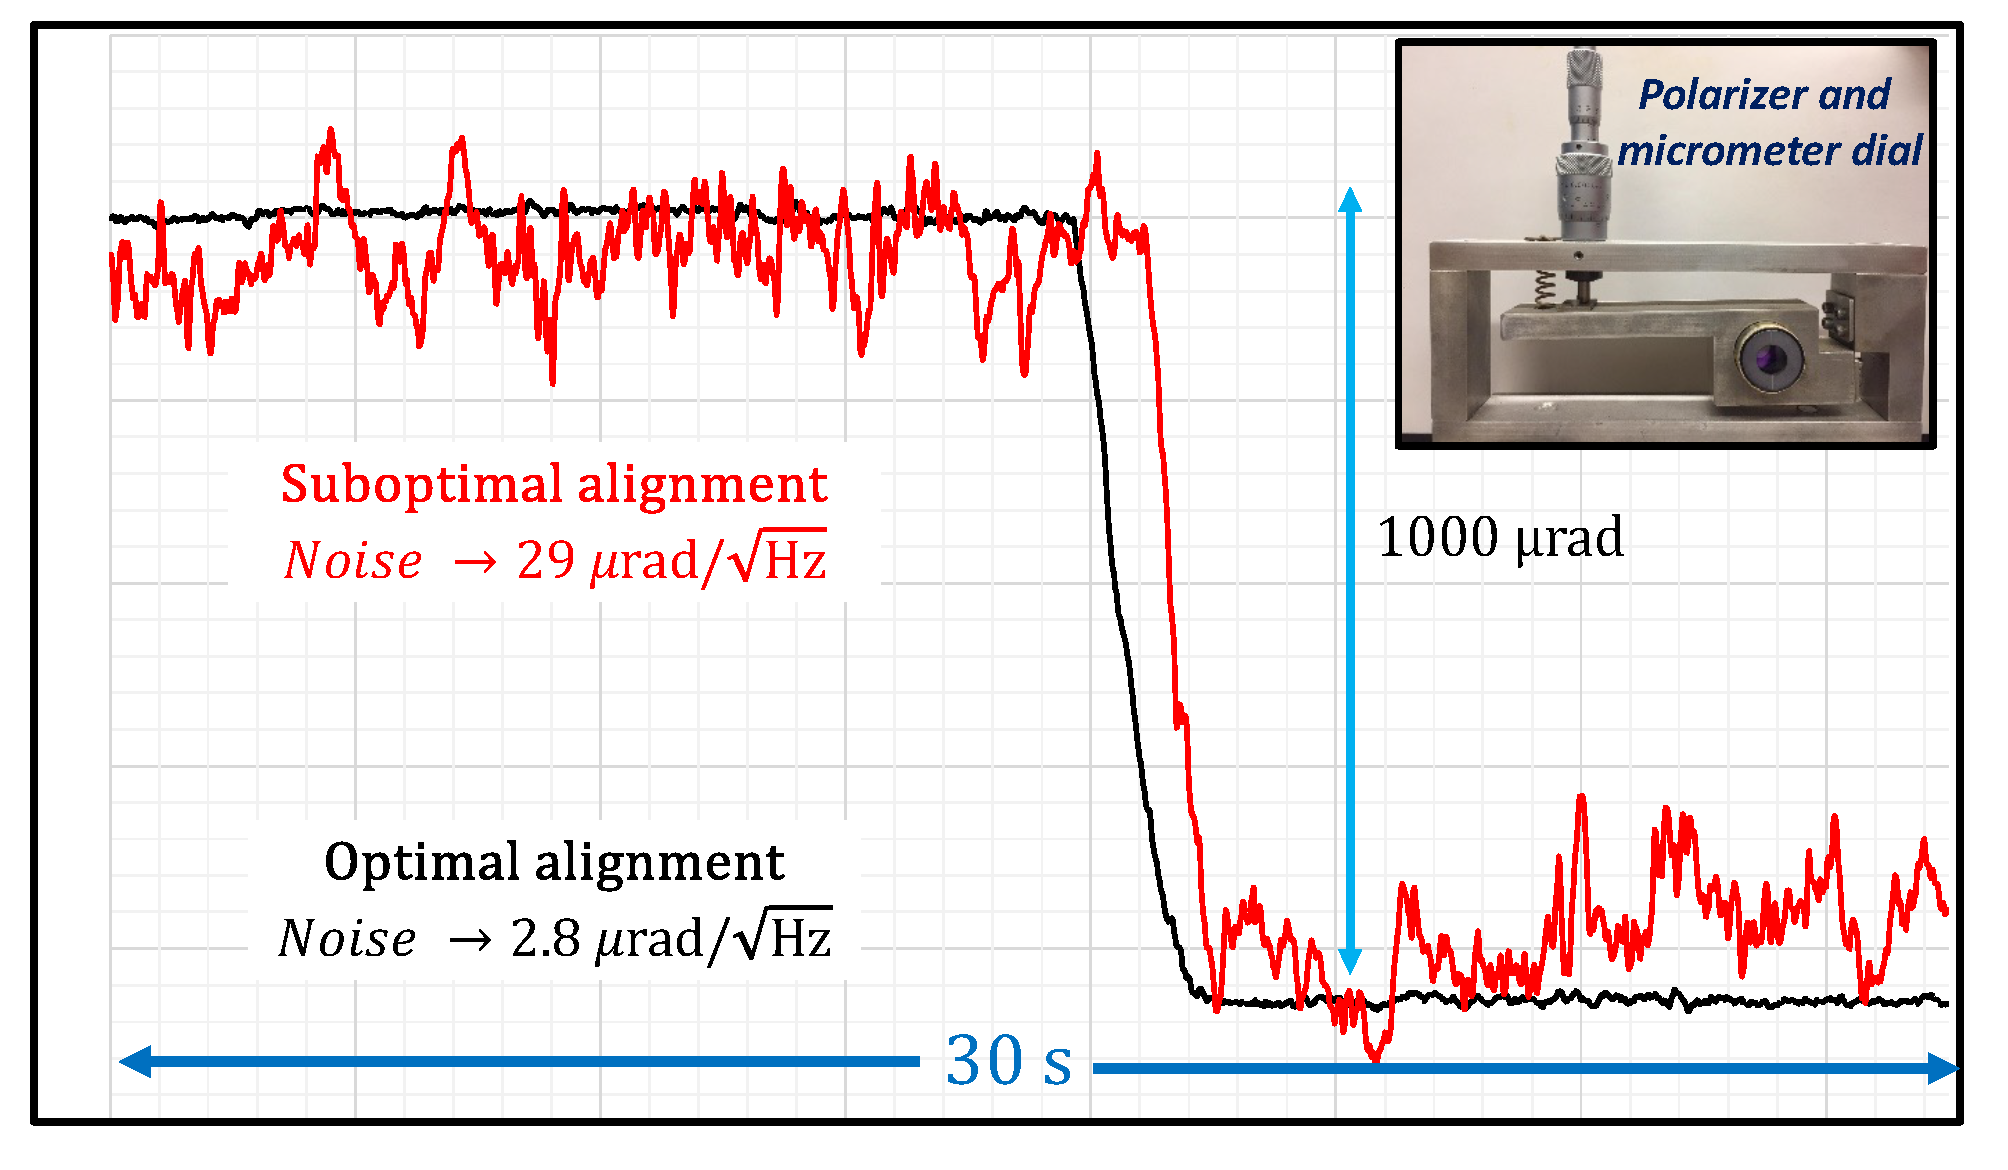
Polarimeter noise was measured using the setup described in Figure 4. With a modulation current of A at Hz (chosen to avoid 60 Hz and noise, while still ensuring a low inductive impedance of the modulator solenoid), the photodetector signal was fed into a Stanford Research Systems SR530 lock-in amplifier referenced to the Hz modulating signal. With this setup, a mechanically induced rotation, , was provided to the analyzer using a precision micrometer dial (see inset of Figure 6). The magnitude of is comparable to the optical rotation induced by an atomic sample under typical conditions (i.e., °C, mT). With this mechanically induced optical rotation, the laser intensity through the analyzer is given by
where is the angular modulating amplitude, and , where Hz is the modulating frequency. Using the small angle approximation, this becomes
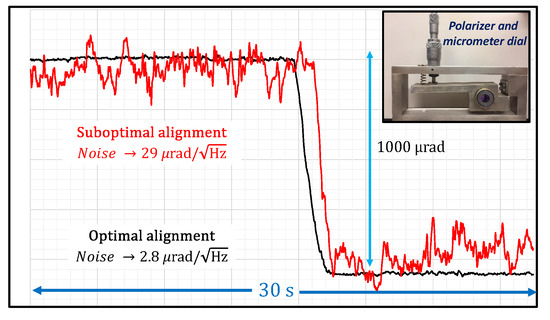
Figure 6.
Polarimeter noise for different crystal alignments at 368 nm. A mechanically induced polarizer rotation, mrad, was applied using a micrometer lever polarizer mount (top right). The optimized (black) and misaligned (red) crystal alignments are estimated to differ by only a few degrees, but there is factor of ten difference in noise.
As can be seen from Equation (3), the output signal from a lock-in tuned to will give a voltage signal proportional to the induced rotation, . Since is precisely known from the micrometer dial (with an estimated uncertainty of 1–2 µRad for mRad), we use this and the lock-in signal to calibrate the root-mean square noise in terms of angle. Note that the signal is also proportional to the laser intensity, , and the modulation amplitude, . In Section 3.3, we discuss how the noise varies as a function of these parameters.
3.2. Optimizing Crystal Alignment
The most prevalent sources of polarimeter noise are acoustic vibrations, intrinsic imperfections of optical materials (polarizers, lens, and crystal), and imperfect optical alignment through the crystal. Acoustic vibrations are largely eliminated with the use of stable optical platforms and appropriate clamping. Noise due to crystal imperfections is minimized by using a focusing/collimating lens pair to gently reduce the beam waist through the crystal to mm. A smaller diameter beam samples fewer crystal imperfections as it passes through, leading to a cleaner lock-in signal. For practical reasons, the effect of beam diameter on noise was not quantitatively investigated. Rather, it was found empirically that with a laser beam diameter of around 1 mm, it was possible to consistently achieve noise at the sub-10 µ level. Noise from crystal misalignment is first minimized by ensuring the crystal is aligned to allow for minimum transmitted intensity through crossed polarizers. At this point, additional fine tuning of the five adjustment axes (three rotational and two translation) can be made to further reduce the noise. A demonstration of polarimeter sensitivity to crystal alignment is given in Figure 6.
3.3. Noise Dependence on Modulation Current, Laser Power, and Wavelength
In addition to crystal alignment, the polarimeter noise also depends on modulation current and laser power. The -lock-in signal (see Equation (3)) is proportional to (which itself is proportional to modulation current), and so a larger modulation current enables for a more favorable signal-to-noise ratio. However, at large modulation currents (>2.5 A) stray fields and crystal heating from ohmic power dissipation can become problematic [30]. We found an approximately linear reduction in noise as a function of AC modulation current up to 2.5 A. With a modulation current of A (corresponding to angular modulations of mrad and mrad), the noise at 368 nm and 1279 nm were both below 5 µ.
We also found that once the laser power was reduced to below a few mW (as measured before the first polarizer) there was a steep reduction in the signal-to-noise ratio. In crossed-nicols configuration, a 1 mW input power corresponds to nW of laser power reaching the detector, at which point Poisson noise becomes significant. It is, however, important for us to explore a range of laser powers, as higher power can result in additional line shape broadening and potential saturation of the atomic transition (especially the E1 transitions). Even with a reduced input power below 1 mW, we were able to demonstrate noise below 10 µ, still ensuring a very high signal-to-noise ratio for our Faraday rotation spectra.
4. Faraday Rotation Spectroscopy in Atomic Pb
The CeF3-based polarimeter is demonstrated here with a sample of atomic lead. A quartz vapor cell (Precision Glassblowing, Inc., Englewood, CO, USA ) containing 20 mg of isotopically enriched 208Pb (Oak Ridge National Lab, Oak Ridge, TN, USA) was placed between the two-crossed polarizers immediately after the modulator setup, as illustrated in Figure 3. It was heated in a home-built vacuum furnace back-filled with 20 torr of argon to 750 °C, and was subjected to a 3 mT magnetic field from a solenoid carrying 2 A of DC current to provide the necessary Zeeman splitting for a Faraday rotation signal.
4.1. Obtaining the Faraday Spectra
Pb optical rotation spectra for both the 368 nm and 1279 nm transitions were obtained by measuring the and lock-in signals. These lock-in signals are the same as those in Equation (3), except with the induced optical rotation replaced by the relevant atomic optical rotation, . For each transition, taking the / ratio gives , meaning that the obtained atomic signal scales inversely with the modulation amplitude. This modulation amplitude is itself linearly proportional to the Verdet constant at that wavelength. Thus, in order to determine the ratio of optical rotations for the two transitions (which allows for the transition amplitude ratio to be determined), the Verdet constant ratios at the transition frequencies need to be determined. These ratios were measured by applying a DC current to the Helmholtz coils and measuring the change in lock-in output voltage for each laser wavelength. The lock-in signal was calibrated with a precision micrometer dial. Verdet constants were determined for 1279 nm, 939 nm, and 633 nm all compared with 368 nm. Fitting to the single transition model, these ratio measurements were found to be in agreement with [19] (see Table 1).
4.2. The Faraday Line Shape
The magneto-optical
where are the real parts of the frequency-dependent refractive indices of the atomic vapor for right- and left-handed circular polarization respectively. The exponential terms are the relative phase shifts of the two circular components of light as it passes through the atomic sample. The frequency dependence of these refractive index terms are modified dispersion-like curves, characterized by spectroscopic homogeneous, , and Doppler, , widths:
where is the resonance frequency of the transition. is the small frequency separation due to the linear Zeeman effect: , where B is the applied DC magnetic field to the sample, is the Bohr magneton, is the reduced Planck constant, and is the Landé g-factor relevant to the particular transition. is the quantum mechanical transition amplitude matrix element. Expanding the exponents in Equation (4) to first order (i.e., the electric dipole approximation: ), the atomic Jones matrix becomes
Without distortion from the CeF3 crystal, the optical rotation of linearly polarized light passing through the atomic sample between crossed polarizers is
which simplifies to
(The first term of Equation (6) is perfectly extinguished between crossed polarizers, and so has been omitted from the calculation). Equation (8) describes the idealized symmetric Faraday line shape, depicted in Figure 7b. Note that in the absence of an applied field, , and so there is no Faraday rotation signal.
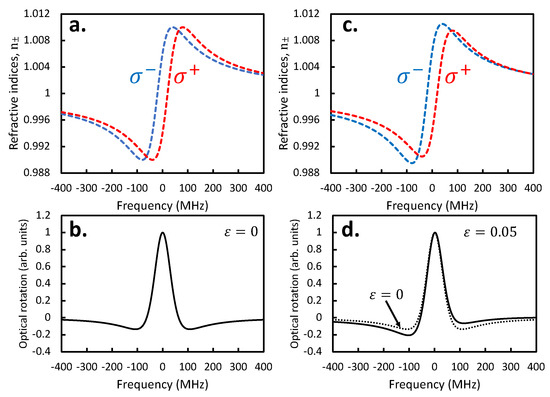
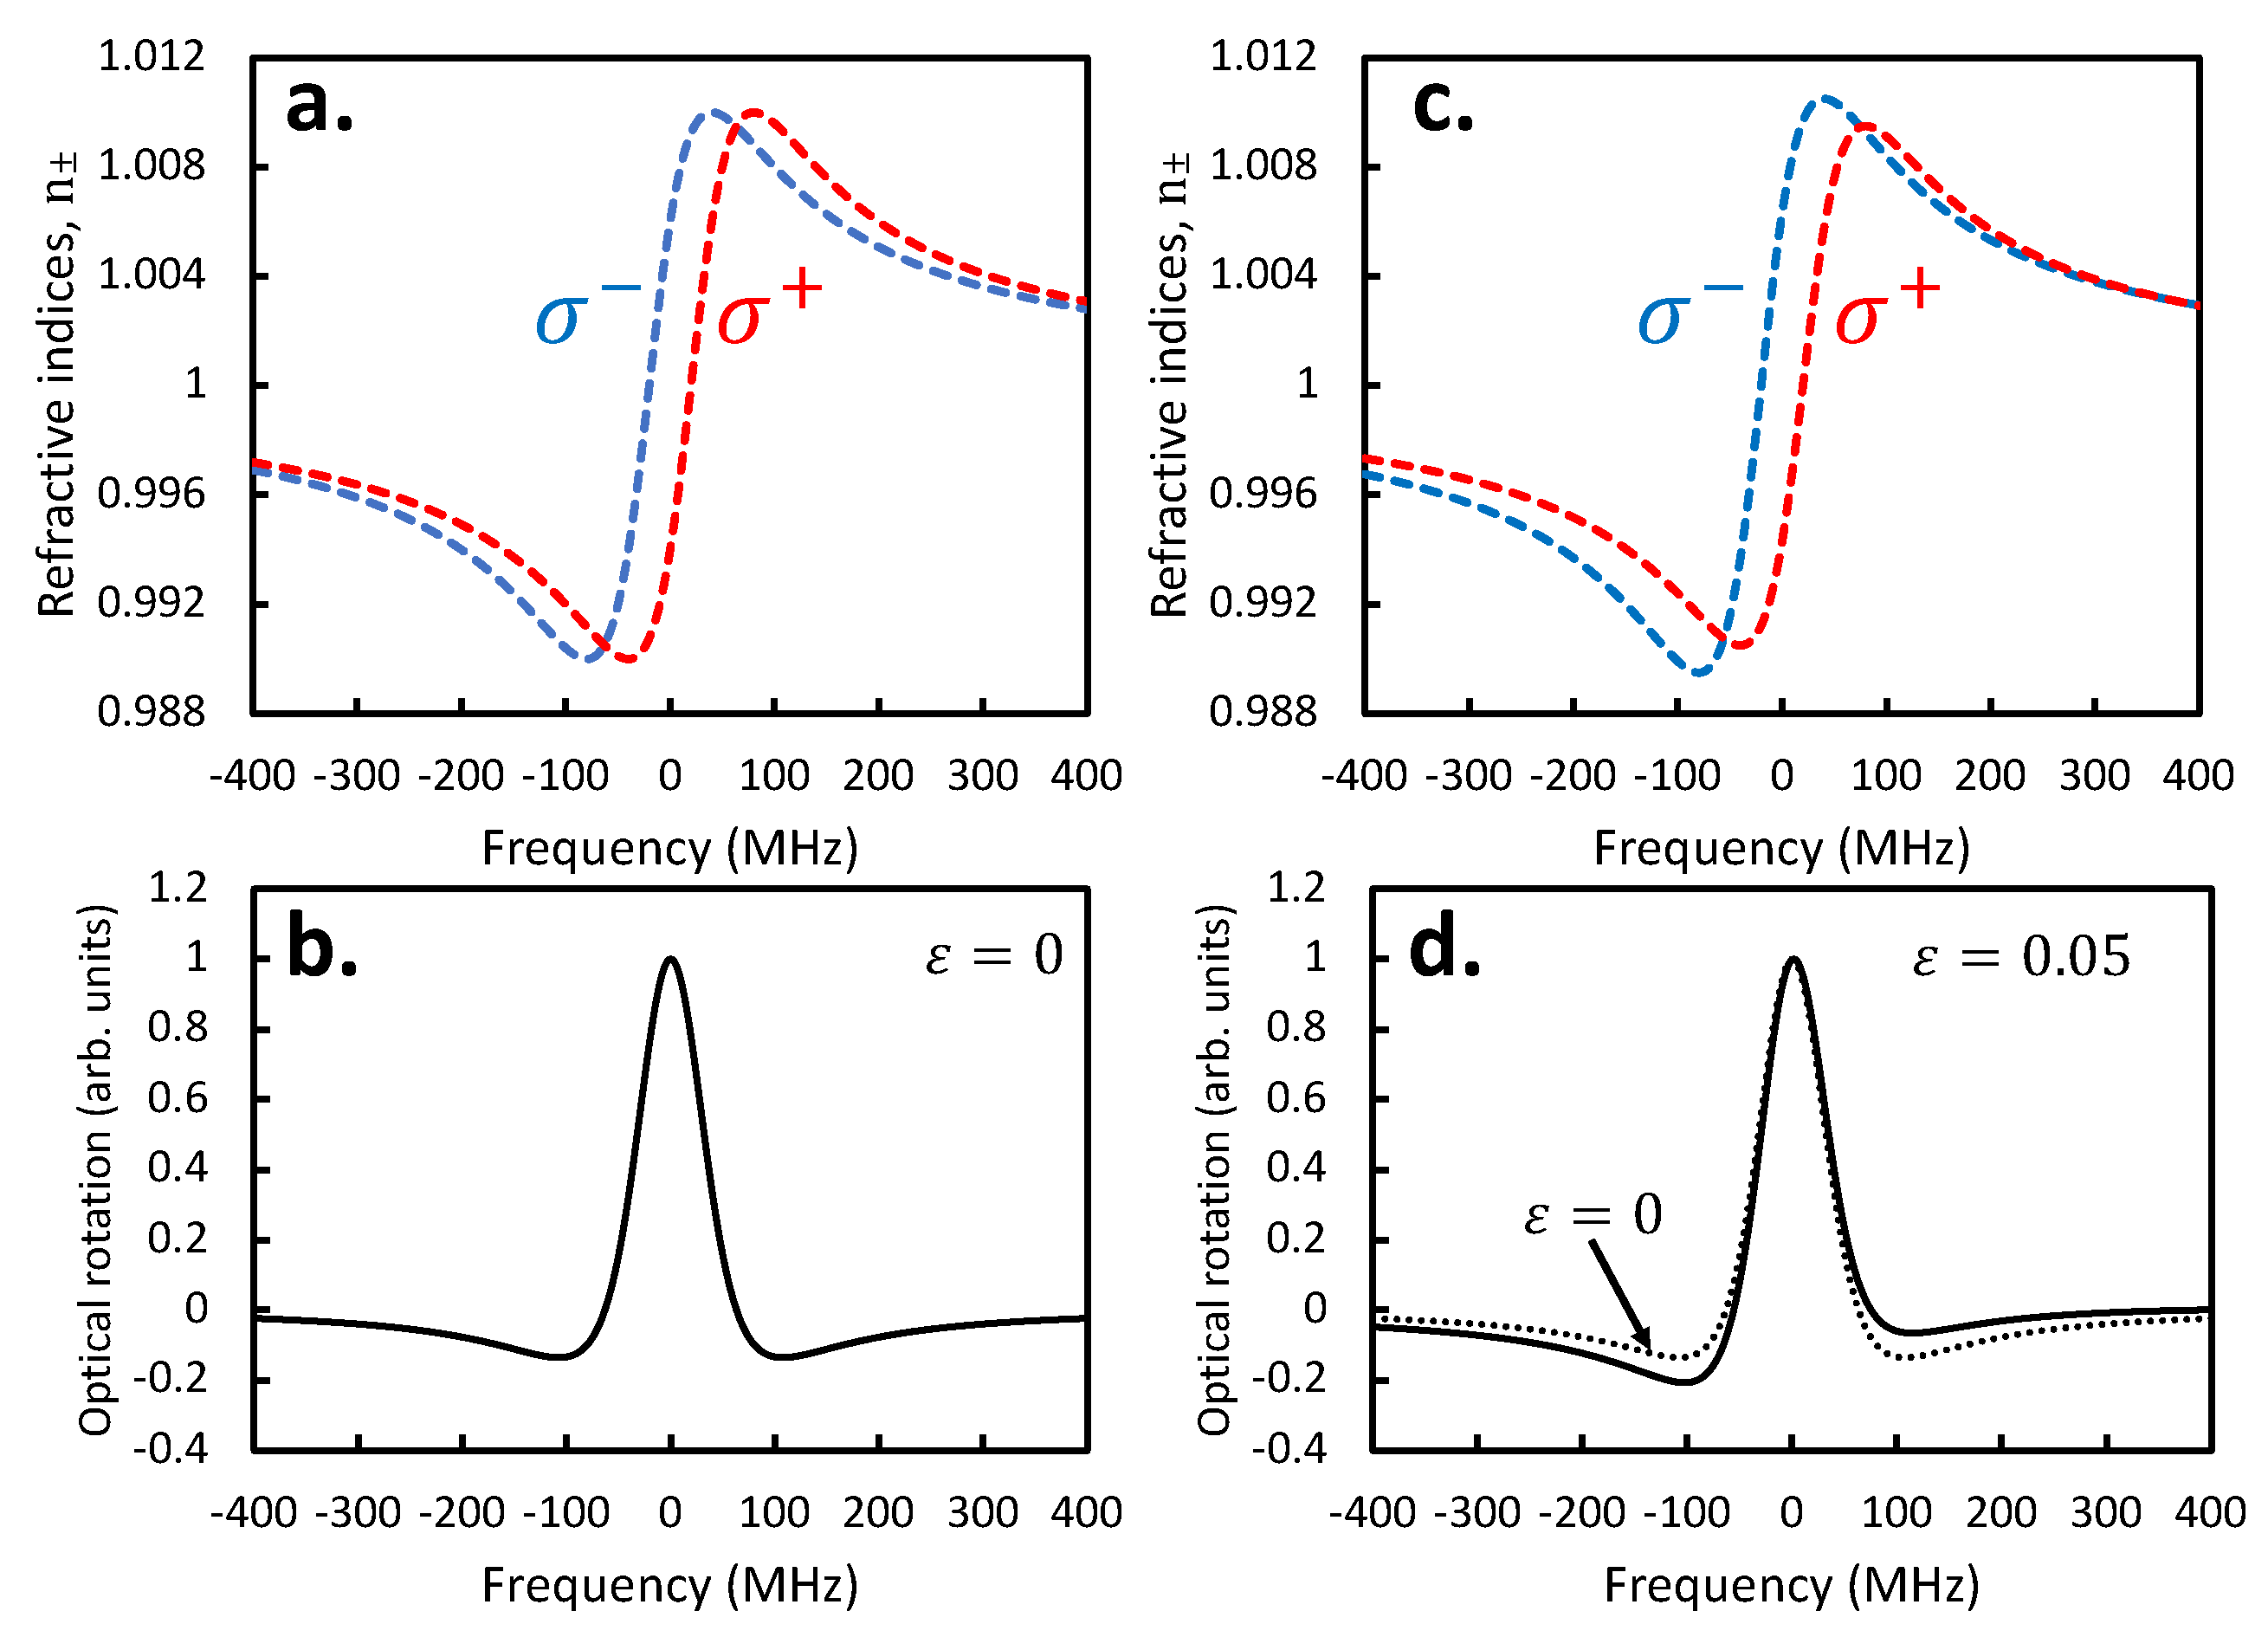
Figure 7.
Simulated spectra showing the asymmetric line shape arising from optical properties of the CeF3 crystal. (a) Refractive index curves ( MHz, MHz, MHz) of a 208Pb vapor near an atomic transition. Doppler broadening is ignored here for the sake of simplicity. Presented here is the ideal case where the atomic response to right- and left-handed polarized light is the same (just shifted in frequency). (b) Optical rotation arising from the situation in 7a resulting in a symmetric line shape (). (c) Refractive index curves showing a different response to right- and left-handed circular components of light when there is some relative misalignment between the laser and the crystal optic-c axis (). (d) The Faraday line shape (bold line) with line shape ellipticity, . The dashed line shows the ideal Faraday rotation line shape.
4.3. Crystal Distortion of the Faraday Line Shape
In general, the obtained Faraday spectra exhibits a -dependent asymmetry, which varies periodically as the CeF3 crystal is rotated on its axis. Ignoring circular dichroism [18], we model the optical behavior of the CeF3 crystal using a generalized crystal Jones matrix (Equation (A3) in the Appendix A) of the form:
where is the identity matrix, and the rotational matrix, , is given by
In Equation (10), represents the optical rotation due to circular birefringence, and can be considered negligibly small [18]. is the accumulated phase due to misalignment-induced linear birefringence, and consequently light emerging from the crystal is (in general) elliptically polarized. Thus, with the polarizer transmission axis oriented an angle from the projection of the CeF3 fast axis, the optical rotation is
With optimized phase settings ()), the lock-in signal is given by
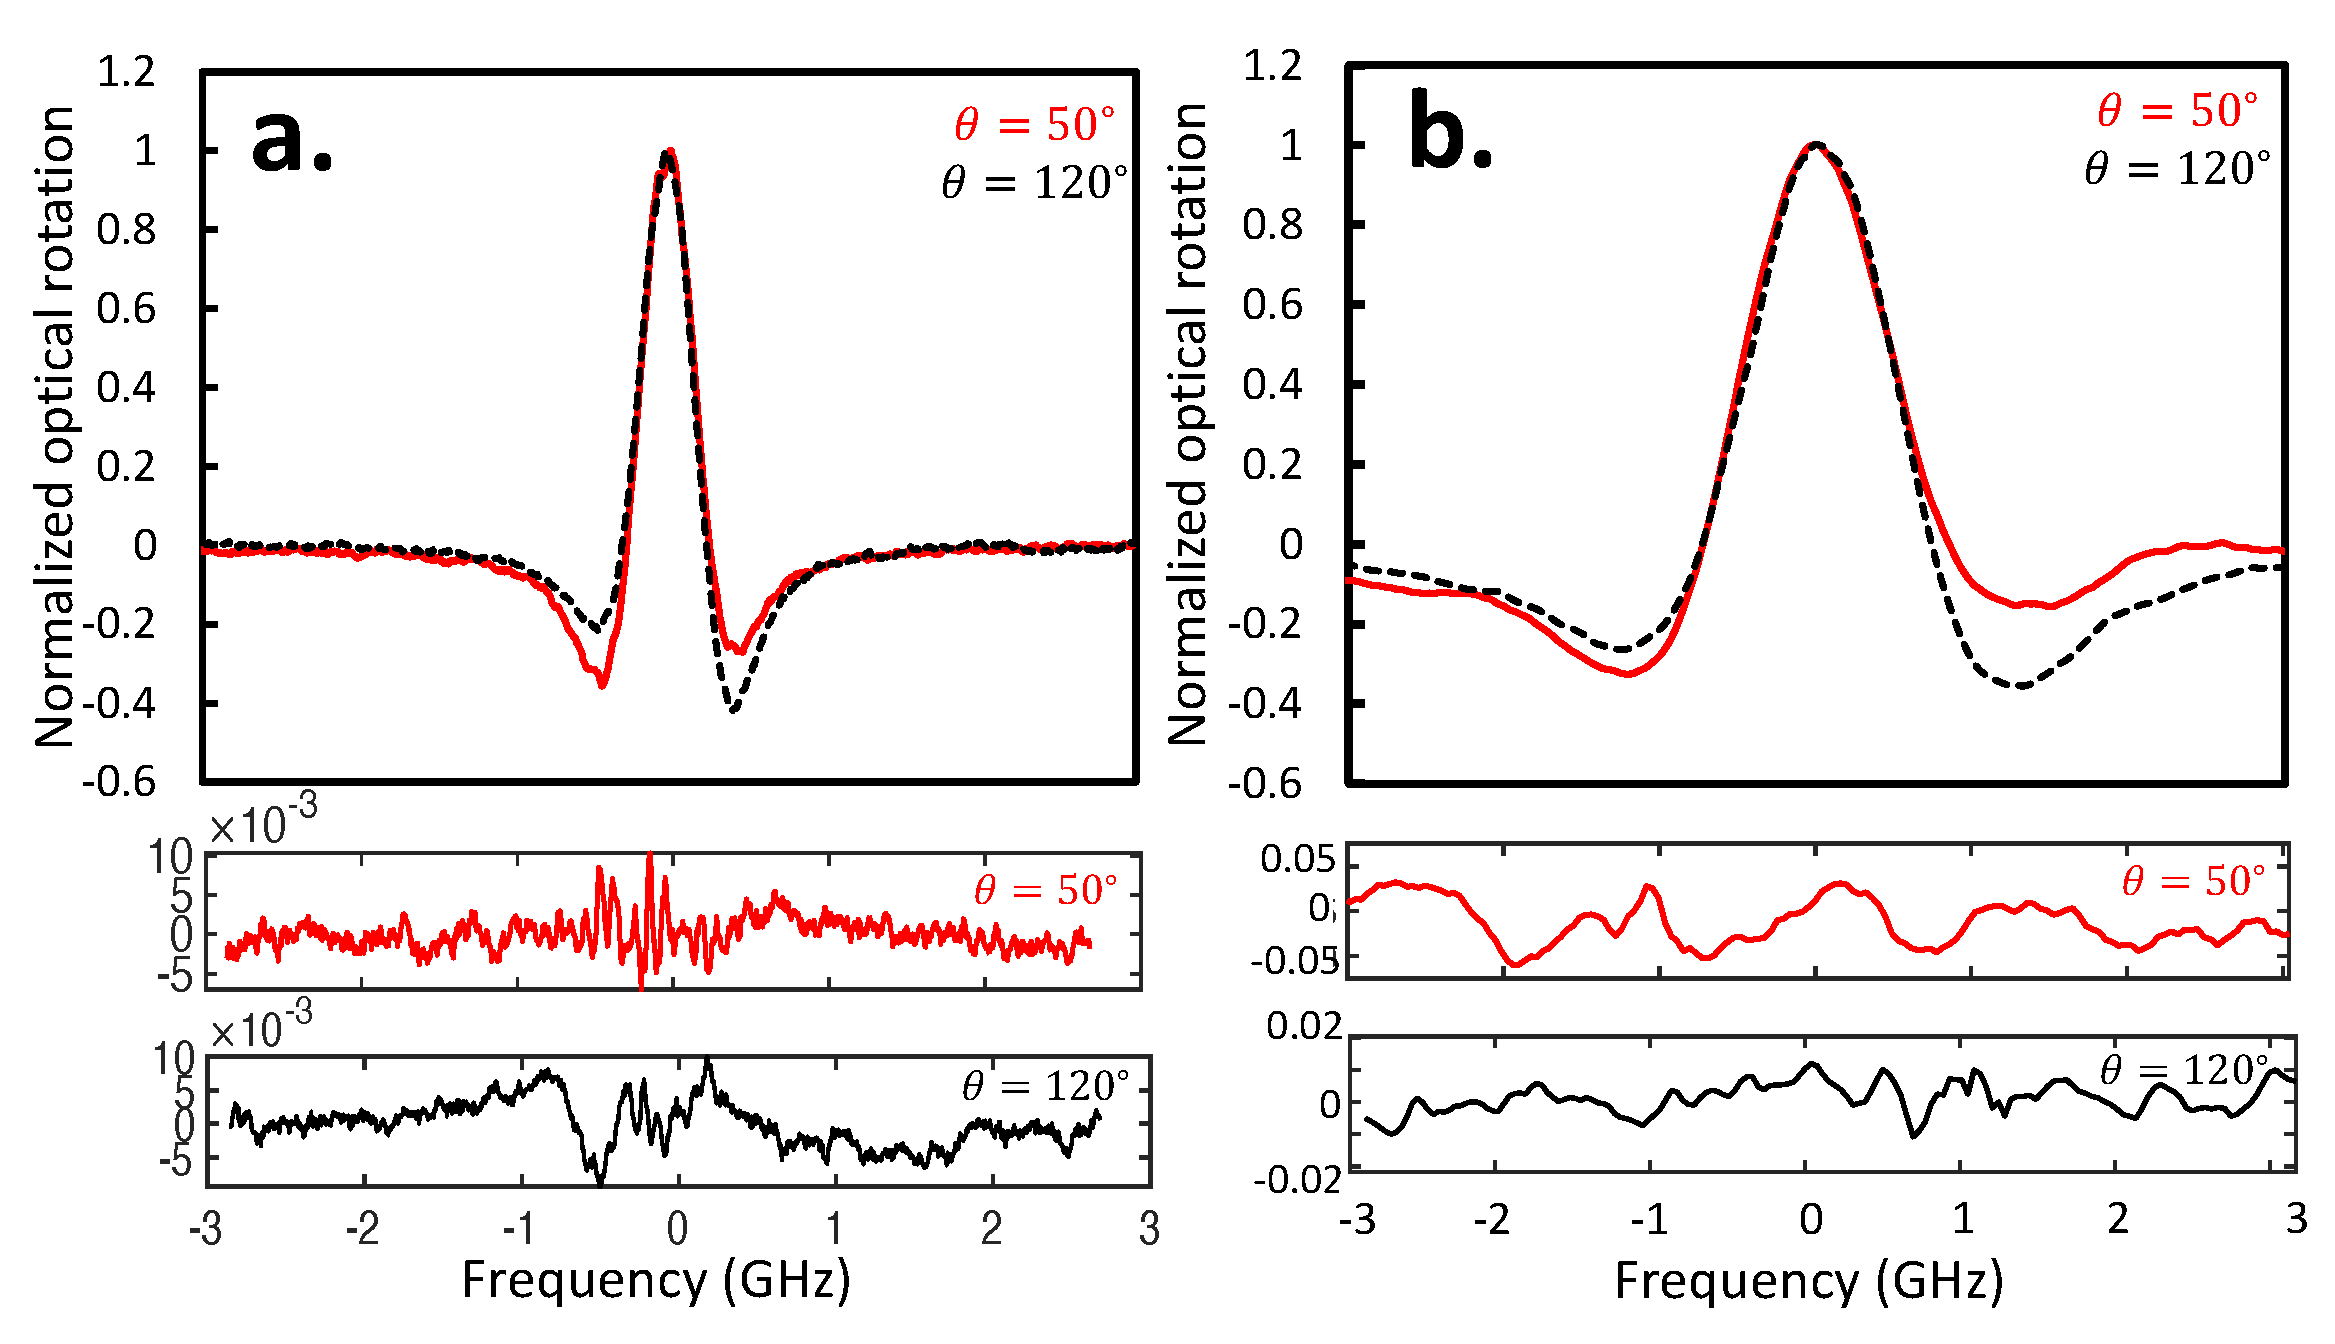
Equation (12) shows that with perfect crystal and laser alignment () there is no dependence to the Faraday spectra (i.e., there is no crystal-induced line shape distortion). However, if there is some discrepancy between the optic-c axis and the cylindrical z-axis, it is inevitable that as the crystal is rotated. The resulting elliptical polarization leads to an antisymmetric (dispersive-like) contribution to the overall line shape (proportional to ). This manifests as a tilt or asymmetry in the line shape, as demonstrated by the simulated spectrum in Figure 7d. Obtained spectra for the M1 (1279 nm) and E1 (368 nm) transitions (Figure 8) indeed show evidence of this ellipticity, where the Faraday spectra have opposite signs in their asymmetries as a result of differing crystal rotation angles, . This asymmetry varies periodically, but its overall -dependence is complicated for reasons discussed in Section 5.2.
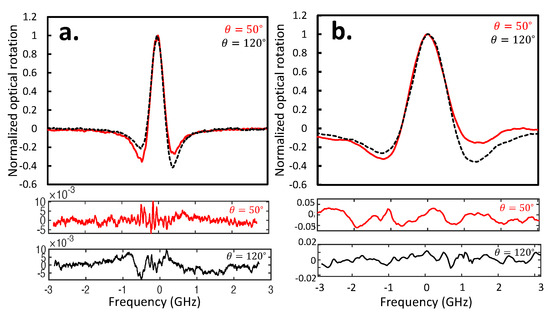
Figure 8.
dependence of line shape ellipticity taken with a 208Pb vapor at 750 °C in a magnetic field of ∼3 mT. Spectra for (a) the M1 transition at 1279 nm, and (b) the E1 transition at 368 nm are presented. The raw Faraday rotation data for crystal angles (red bold) and (black dashed) are shown on top, with both transitions showing ellipticities of opposite sign at these crystal angles. The fit residuals (bottom) indicate that the data are well described by the fitting model of Equation (13), where the change of scale should be noted. The high frequency noise around the spectral feature is predominantly due to frequency jitter of the laser. Due to the much higher Verdet constant of CeF3 in the UV, the E1 spectrum is greater affected by lower frequency drifts, as is seen in the residuals.
5. Discussion
The feasibility of obtaining low-noise optical rotation spectra with a CeF3-based polarimeter was demonstrated in the previous section. Its use in the broader context of precision Pb spectroscopy is discussed here, including line shape considerations as well as limitations to the magneto-optical model presented in Section 4.
5.1. Accounting for Ellipticity in the Line Shape Analysis
Extracting from a Faraday spectrum requires an accurate measurement of the height of the optical rotation feature [10]. Line shape distortion is therefore an important consideration, because it can lead to a systematic uncertainty in the estimated signal height if unaccounted for. For example, failure to account for an ellipticity of would lead to a systematic error of around 0.2% in the measured height, making it difficult to test the ab initio theory at the 1% level. Based on our magneto-optical model, a reasonable approach is to fit the obtained optical rotation spectra to a function that accounts for both symmetric and antisymmetric line shape contributions:
where, according to Equation (12), and the ellipticity is given by . As can be seen, an ellipticity of results in a perfectly symmetric line shape, while an ellipticity of corresponds to an entirely dispersive-like line shape. The fit residuals of the two spectra in Figure 8 show that the data are well-described by this model. The data also show that it is possible to reverse the sign of the asymmetry, and it turns out that at certain crystal angles it is possible for this line shape distortion to be effectively eliminated. It is at these zero-distortion angles that will be measured, but it is also important to perform TA ratio measurements at a range of crystal angles to confirm that this systematic effect is well understood.
5.2. Limitations of the Magneto-Optical Model
The magneto-optical model outlined in Section 4 provides a physical justification for our line shape analysis. It is necessary because, unlike TGG-based polarimetry, the presence of CeF3 has a clear influence on the symmetry of the obtained Faraday spectra. Nevertheless, it is important to realize that the model described in Section 4 is a simplified one with certain limitations. Principally, it assumes the crystal interacts with an idealized Gaussian laser beam. In reality, it is necessary for us to gently focus the laser through the crystal in order to achieve sub-10 µ noise, which deviates from our plane wave analysis presented in Section 4. This (along with possible crystal nutation and -dependence of ) is a possible contribution to the complicated variation of , which one would expect from Equation (12) to have a predominantly sinusoidal dependence. It also goes some way into explaining why the best misalignment parameters for the model in Figure 5 slightly overestimate the expected values of and . Nevertheless, the modest beam divergence of ∼ 5 mrad through the 5 mm-long crystal gives us some justification for using this idealized model, at least as a qualitative tool for understanding the impact of the CeF3 crystal on the atomic line shape.
5.3. Other Uses of CeF3-Based Faraday Rotation Spectroscopy
The discussion above has focused primarily on the use of CeF3-based optical polarimetry for measurements of . However, these line shape considerations are also relevant for other types of atomic structure measurements. For example, the use of CeF3-based Faraday rotation spectroscopy to improve on existing hyperfine structure measurements in Pb [31,32,33,34] would require accurate determination of the crystal-induced asymmetric contributions on top of similar lineshape asymmetries that arise from hyperfine mixing [35]. One way this can be achieved is by measuring the ellipticity pattern as a function of crystal rotation and estimating this effect from a rigorous line shape analysis. Similar considerations would also be necessary for certain isotope shift and scalar polarizability measurements.
6. Conclusions
We have presented a CeF3-based polarimeter for use in broadband Faraday Rotation Spectroscopy. A detailed analysis of polarimeter performance as a function of several varaibles was performed.
The polarimeter noise was found to be sensitive to laser beam diameter, and to operate at the microradian noise level a beam diameter of around 1 mm at the crystal location was required. This was achieved with a pair of lenses enabling for the beam to be gently focused through the crystal and then collimated through the atomic sample.
A mechanically stable crystal mounting apparatus with five separate degrees of adjustment was constructed. As the CeF3 crystal was rotated, a periodic variation of light intensity was observed. This is found to be in qualitative agreement with our model, which suggests that this is the result of misalignment-induced linear birefringence. Optimum polarimeter performance is achieved close to the global intensity minimum.
Other factors affecting polarimeter noise performance, such as modulation amplitude, laser intensity, and laser wavelength were explored. Polarimeter noise was found to decrease as modulation driving field was increased, but, due to practical considerations (such as stray fields and crystal heating) we restricted our modulation fields to under mT. There is also an inverse relationship between polarimeter noise and laser power, but this levels off after around 3 mW. With regard to noise performance, higher laser powers are therefore advantageous, but for stronger atomic transitions (such as the E1 transition at 368 nm), power-induced spectral broadening becomes a consideration.
Finally, we explored atomic spectral line shape distortion due to the non-ideal optical behavior of the CeF3 crystal. As a result of misalignment-induced linear birefringence, there is an asymmetric dispersive-like contribution to the atomic Faraday line shape, which is qualitatively supported by a simplified model based on the Jones calculus. With careful crystal alignment, this line shape distortion can be effectively eliminated or accounted for in the spectral analysis. Future TA ratio measurements in Pb using this same CeF3-based polarimeter arrangement are planned for the near future.
Author Contributions
Conceptualization, P.K.M. and J.H.L.; methodology, P.K.M. and J.H.L.; software, J.H.L.; validation, J.H.L. and P.K.M.; formal analysis, J.H.L. and G.E.P.; investigation, J.H.L. and G.E.P.; resources, P.K.M.; data curation, J.H.L. and A.C.K.; writing—original draft preparation, J.H.L.; writing—review and editing, J.H.L., G.E.P., A.C.K. and P.K.M.; visualization, J.H.L.; supervision, P.K.M.; project administration, P.K.M.; funding acquisition, P.K.M. All authors have read and agreed to the published version of the manuscript.
Funding
This study was supported by the National Science Foundation grant (NSF1912369).
Data Availability Statement
The data that support the findings of this study are available from the corresponding author upon reasonable request.
Acknowledgments
The authors thank Michael Taylor, Jason Mativi, Ruby Yager, Russell Blakey, and Charles Yang for their contributions in the design, construction, and testing of the apparatus. We thank Kate Jensen for her comments and insights on the CeF3 material properties and crystal structure.
Conflicts of Interest
The authors declare no conflict of interest.
Abbreviations
The following abbreviations are used in this manuscript:
| FRS | Faraday Rotation Spectroscopy |
| UV | Ultraviolet |
| (N)IR | (Near) infrared |
| PNC | Parity Non-Conserving/Parity Non-Conservation |
| TGG | Terbium Gallium Garnet |
| YIG | Yttrium Iron Garnet |
| ECDL | External cavity diode laser |
| AC | Alternating current |
| DC | Direct current |
| TA | Transition amplitude |
| E1 | Electric dipole |
| E2 | Electric quadrupole |
| M1 | Magnetic dipole |
Appendix A. Jones Calculus Description of Polarimeter Setup
Here, we present the relevant Jones calculus expressions for the polarimeter system (i.e., the Polarizer () → CeF3 (J Analyzer (A) system). Ignoring parasitic ellipticities from the Glan-Thompson polarizers, the Jones vectors and are given by
and
where is the small polarizer uncrossing, which may be real (polarizer misalignment) or effective (due to polarizer imperfections). In general, the optical properties of the CeF3 crystal are described by the generalized SU(2) Jones matrix:
where is the identity matrix, and the rotational matrix, , is given by
is the rotational angle of the crystal (with respect to the projected fast axis onto the plane of the crystal), is the circular birefringence, and is the phase shift due to linear birefringence. While nominally zero along the optic-c axis, is determined by accounting for beam and optic-c axis misalignment from the crystal z-axis ( and , respectively). By projecting the laser beam and optic-c axis directions onto the cylindrical z-axis, the alignment-dependent birefringence (which now depends on ) is then given by [36]
where is the refractive index of the ordinary ray, and the effective extraordinary refractive index, is given by
is the extraordinary refractive index, while is given by
As a result of this misalignment-induced birefringence, the accumulated phase difference between the ordinary and extraordinary ray passing through the CeF3 sample is
From our setup, we estimate . freely varies from . However, non-ideal beam shape resulting from gently focusing the laser through the crystal makes it difficult to accurately estimate these parameters.
Appendix A.1. θ-Dependence of Crystal Transmission between (nearly) Crossed Polarizers
The -dependent transmission through the crystal placed between crossed polarizers is presented here. Using Equation (1), the (normalized) transmitted intensity is
which reduces to
for small values of , where it should be noted that is a function of , , and . Note that (A8) assumes that the fast axis is projected onto . In reality, this may not be the case, and so (A8) may be further modified with an additional phase angle to the arguments of the trigonometric functions. Crystal imperfections (which may also contribute to intensity changes as a function of [28]) were not accounted for in this model. The Mueller calculus may be better suited at describing such depolarization effects [37], but this was not explored in the present study. Note that nutation of the crystal arising from the rotation axis not aligning exactly with the cylindrical axis was not accounted for in this model. Note that when , the intensity has no -dependence, as expected from perfect alignment along the optic-c axis. However, small changes in and have significant changes in the transmission pattern, and give some qualitative explanation to the data displayed in Figure 5.
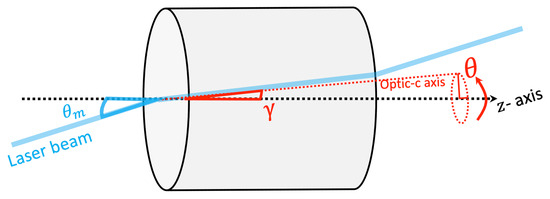
Figure A1.
A sketch of the crystal and laser beam alignment. describes the rotational angle of the crystal, is the relative angle between the laser and the cylindrical axis, z, while is the angle between the cylindrical axis and the optic-c axis. Note that it is assumed that the rotational axis is perfectly aligned with the z axis.
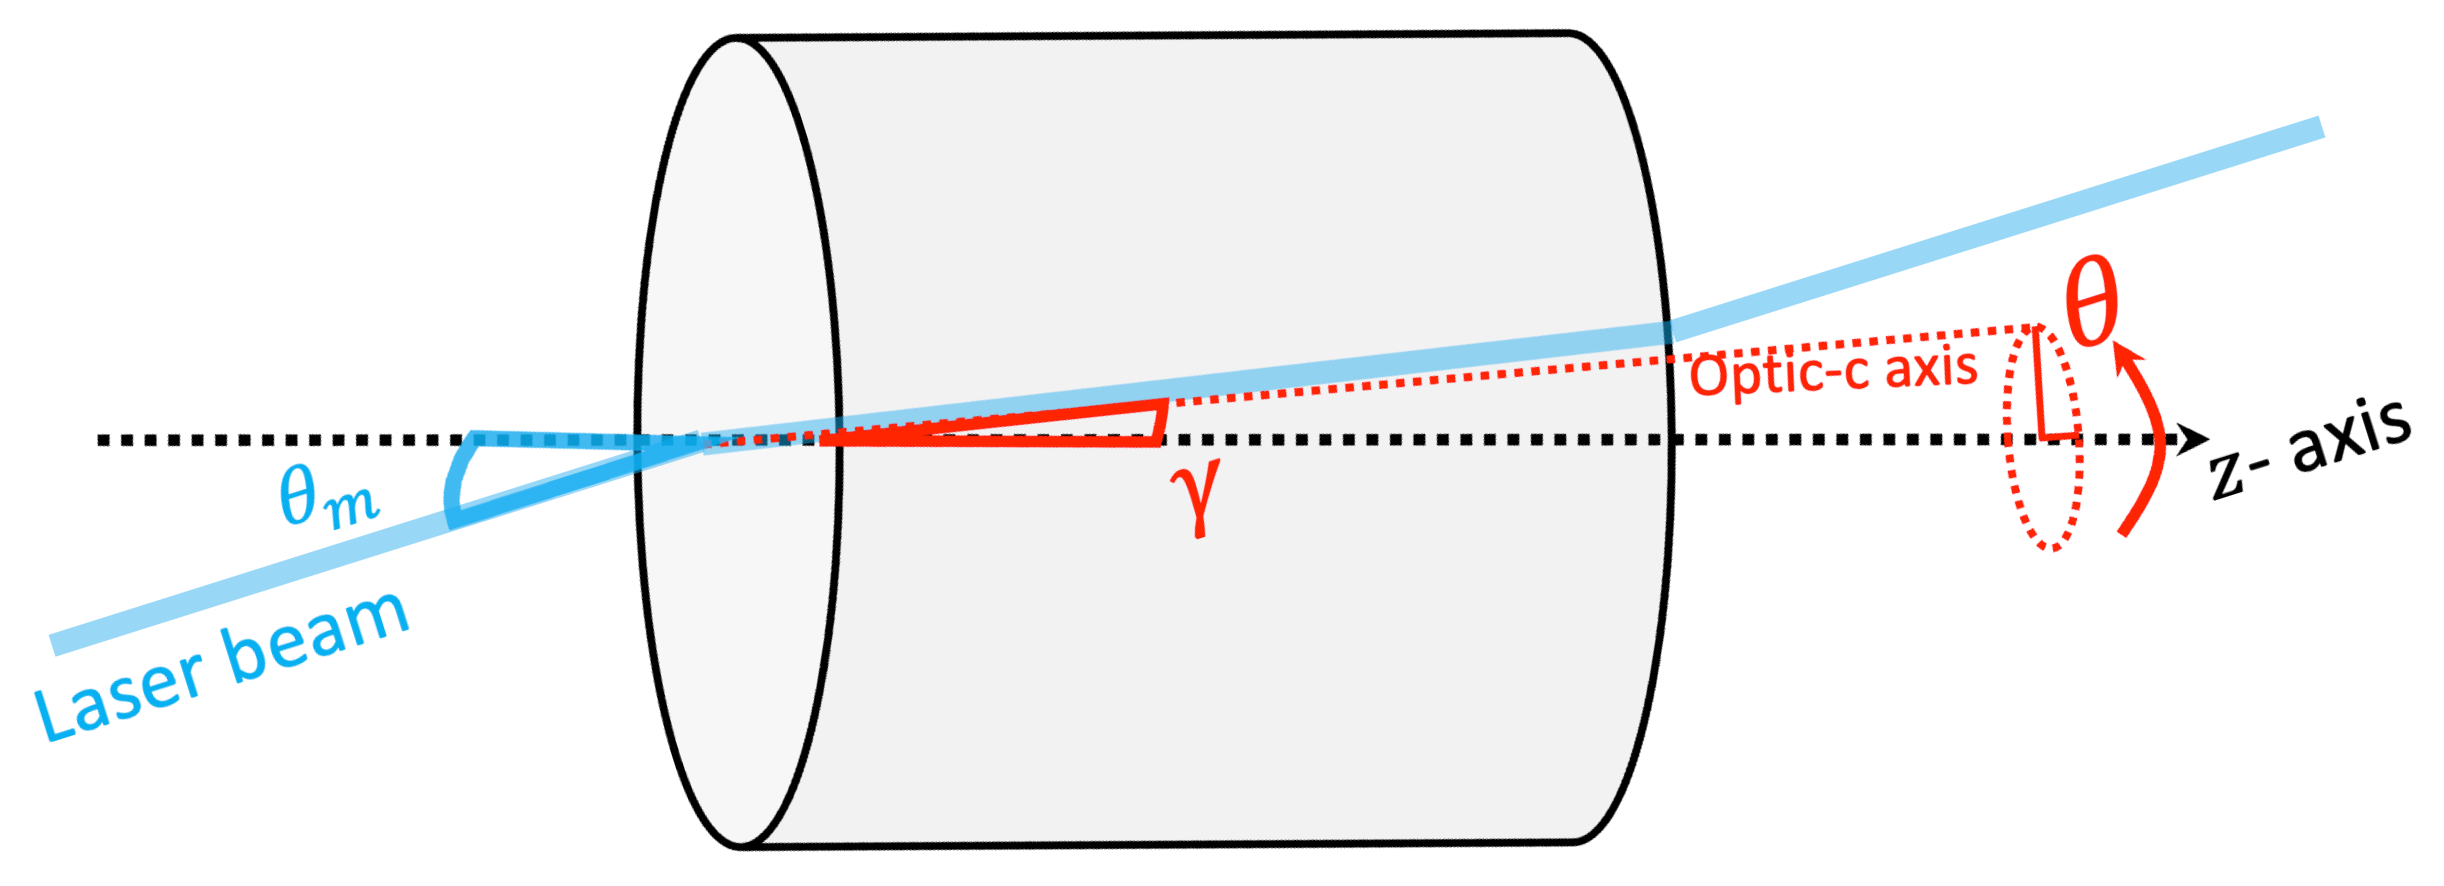
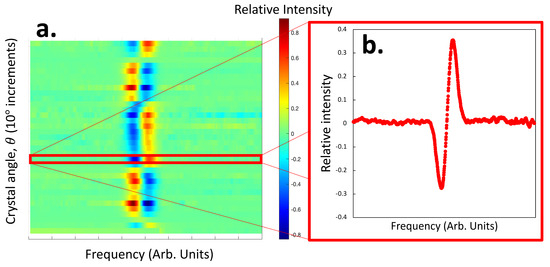
Figure A2.
Intensity variation as a function of crystal angle, , for the M1 transition at 1279 nm. Data were collected at 750 °C, with an applied magnetic field of mT. (a) A heat map of intensity spectra (on minus off) collected as a function of crystal angle, . As expected from the model, there are four nodes where a sign inversion of the dispersive-like signal is observed. (b) A background-subtracted intensity scan at . A clear dispersive-like curve is observed, as a result of elliptical light emerging from the CeF3 crystal and interacting with the atomic sample.

Appendix B. Faraday Rotation Spectra without Modulation
In addition to the lock-in detection method, optical rotation spectra were also collected without any modulation to the light polarization. Using the same setup as described in Figure 4, the crystal modulation current was turned off (), and the raw laser intensity through crossed polarizers was measured as a function of crystal rotation, . Intensity scans were collected with both B-on and B-off. The B-off (background) scans were subtracted from the B-on scans, thereby revealing the magneto-optical response of the atomic sample. As expected, the atomic response is strongly affected by the crystal orientation, . As shown in Figure A2, dispersive-like curves were obtained with a periodically varying amplitude. This is ultimately a result of the varying ellipticity of the light emerging from the crystal and interacting with the atomic 208Pb vapor. Depending on the sign of , this elliptical light has a stronger preference for either or contributions to the atomic transition, leading to a dispersive-like component to the signal. With careful crystal alignment, it is possible to eliminate this ellipticity (). Note that this method is only possible if there is a measurable absorption feature in the spectrum. For spectroscopically weak transitions, the lock-in detection method is required.
References
- Brumfield, B.; Wysocki, G. Faraday rotation spectroscopy based on permanent magnets for sensitive detection of oxygen at atmospheric conditions. Opt. Express 2012, 20, 29727. [Google Scholar] [CrossRef] [PubMed]
- Brecha, R.J.; Pedrotti, L.M.; Krause, D. Magnetic rotation spectroscopy of molecular oxygen with a diode laser. J. Opt. Soc. Am. B 1997, 14, 1927–1930. [Google Scholar] [CrossRef]
- Brecha, R.J. Noninvasive magnetometry based on magnetic rotation spectroscopy of oxygen. Appl. Opt. 1998, 37, 4834–4839. [Google Scholar] [CrossRef]
- So, S.G.; Jeng, E.; Wysocki, G. VCSEL-based Faraday rotation spectroscopy with a modulated and static magnetic field for trace molecular oxygen detection. Appl. Phys. B 2011, 102, 279–291. [Google Scholar] [CrossRef]
- Blake, T.A.; Chackerian, C., Jr.; Podolske, J.R. Prognosis for a mid-infrared magnetic rotation spectrometer for the in situ detection of atmospheric free radicals. Appl. Opt. 1996, 35, 973–985. [Google Scholar] [CrossRef]
- Kerckhoff, J.A.; Bruzewicz, C.D.; Uhl, R.; Majumder, P.K. A frequency stabilization method for diode laser utilizing low-field Faraday polarimetry. Rev. Sci. Instrum. 2005, 35, 093108. [Google Scholar] [CrossRef]
- Macpherson, M.J.D.; Zetie, K.P.; Warrington, R.B.; Stacey, D.N.; Hoare, J.P. Precise measurement of parity nonconserving optical rotation at 876 nm in atomic bismuth. Phys. Rev. Lett. 1991, 67, 2784–2787. [Google Scholar] [CrossRef] [PubMed]
- Vetter, P.A.; Meekhof, D.M.; Majumder, P.K.; Lamoreaux, S.K.; Fortson, E.N. Precise test of electroweak theory from a new measurement of parity nonconservation in atomic thallium. Phys. Rev. Lett. 1995, 74, 2658–2661. [Google Scholar] [CrossRef]
- Majumder, P.K.; Tsai, L.L. Measurement of the electric quadrupole amplitude within the 1283-nm 6P1/2-6P3/2 transition in atomic thallium. Phys. Rev. A 1999, 60, 262–272. [Google Scholar] [CrossRef]
- Maser, D.L.; Hoenig, E.; Wang, B.Y.; Rupasinghe, P.M.; Porsev, S.G.; Safronova, M.S.; Majumder, P.K. High-precision measurement and ab initio calculation of the (6s26p2)3P0→3P2 electric-quadrupole transition amplitude in 208Pb. Phys. Rev. A 2019, 100, 052506. [Google Scholar] [CrossRef]
- Phipp, S.J.; Edwards, N.H.; Baird, P.E.G.; Nakayuma, S. A measurement of parity non-conserving optical rotation in atomic lead. J. Phys. B At. Mol. Opt. Phys. 1996, 29, 1861. [Google Scholar] [CrossRef]
- Meekhof, D.M.; Vetter, P.A.; Majumder, P.K.; Lamoreaux, S.K.; Fortson, E.N. High-precision measurement of parity nonconserving optical rotation in atomic lead. Phys. Rev. Let. 1993, 71, 3442. [Google Scholar] [CrossRef] [PubMed]
- Wood, C.S.; Bennett, S.C.; Cho, D.; Masterson, B.P.; Roberts, J.L.; Tanner, C.E.; Wieman, C.E. Measurement of parity nonconservation and anapole moment in cesium. Science 1997, 275, 1759. [Google Scholar] [CrossRef] [PubMed]
- Porsev, S.G.; Beloy, K.; Dervianko, A. Precision determination of electroweak coupling from atomic parity violation and implications for particle physics. Phys. Rev. Lett. 2009, 102, 1759. [Google Scholar] [CrossRef] [PubMed]
- Dzuba, V.A.; Berengut, J.C.; Flambaum, V.V.; Roberts, B. Revisiting parity nonconservation in cesium. Phys. Rev. Lett. 2012, 109, 203003. [Google Scholar] [CrossRef] [PubMed]
- Porsev, S.G.; Kozlov, M.G.; Safronova, M.S.; Tupitsyn, I.I. Development of the configuration-interaction + all=irder method and application to the parity nonconserving amplitude and other properties of Pb. Phys. Rev. A 2016, 93, 012501. [Google Scholar] [CrossRef]
- Molina, P.; Vasyliev, V.; Villora, E.G.; Shimamura, K. CeF3 and PrF3 as UV-visible Faraday rotators. Opt. Express 2011, 19, 11786. [Google Scholar] [CrossRef] [PubMed]
- Nakagawa, K.; Asahi, T. Determination of the Faraday rotation perpendicular to the optical axis of a uniaxial CeF3 crystal using the Generalized High Accuracy Universal Polarimeter. Sci. Rep. 2019, 9, 18453. [Google Scholar] [CrossRef] [PubMed]
- Vojna, D.; Slezak, O.; Yasuhara, R.; Furuse, H.; Lucianetti, A.; Mocek, T. Faraday rotation of Dy2O3, CeF3 and Y3Fe5O12 at the mid-infrared wavelengths. Materials 2020, 13, 5324. [Google Scholar] [CrossRef]
- Xygkis, M.; Linaraki, A.N.; Toutoudaki, E.N.; Katsoprinakis, G.E.; Rakitzis, T.P. Absorption coefficients and scattering losses of TGG, TGP, KTF, FS, and CeF3 magneto-optical crystals in the visible via cavity ring-down spectroscopy. Appl. Opt. 2023, 62, 7730–7735. [Google Scholar] [CrossRef]
- Vojna, D.; Yasuhara, R.; Slezak, O.; Muzik, J.; Lucianetti, A.; Mocek, T. Verdet constant dispersion of CeF3 in the visible and near-infrared spectral range. Opt. Eng. 2017, 56, 067105. [Google Scholar] [CrossRef]
- Slezak, O.; Yasuhara, R.; Lucianetti, A.; Mocek, T. Temperature-wavelength dependence of terbium gallium garnet ceramics Verdet constant. Opt. Mater. Express 2016, 6, 3683–3691. [Google Scholar] [CrossRef]
- Ikesue, A.; Aung, Y.L. Development of optical grade polycrystalline YIG ceramics for Faraday rotator. J. Am. Ceram. Soc. 2019, 101, 5120–5126. [Google Scholar] [CrossRef]
- Slezak, O.; Yasuhara, R.; Vojna, D.; Furuse, H.; Lucianetti, A.; Mocek, T. Temperature-wavelength dependence of Verdet constant of Dy2O3 ceramics. Opt. Mater. Express 2019, 9, 2971–2981. [Google Scholar] [CrossRef]
- Mironov, E.; Palashov, O.; Karimov, D. EuF2-based crystals as media for high-power mid-infrared Faraday isolators. Sci. Mater. 2019, 162, 54–57. [Google Scholar] [CrossRef]
- Vasyliev, V.; Villora, E.G.; Nakamura, M.; Sugahara, Y.; Shimamura, K. IV-visible rotators based on rare-earth single crystals: LiREF4 (RE=Tb, Dy, Ho, Er and Yb). Opt. Express 2012, 20, 14460–14470. [Google Scholar] [CrossRef] [PubMed]
- Karimov, D.N.; Lisovenko, D.S.; Ivanova, A.G.; Grebenev, V.V.; Popov, P.A.; Sizova, N.L. Bridgman growth and physical properties anisotropy of CeF3 crystals. Crystals 2021, 11, 793. [Google Scholar] [CrossRef]
- Mironov, E.A.; Starobor, A.V.; Snetkov, I.L.; Palashov, O.V.; Furuse, H.; Tokita, A.; Yasuhara, R. Thermo-optical and magneto-optical characteristics of CeF3 crystal. Opt. Mater. 2017, 69, 196–201. [Google Scholar] [CrossRef]
- de Marcos, L.V.R.; Larruquert, J.I.; Mendéz, J.A.; Aznárez, J.A. Self-consistent optical constants of MgF2, LaF2, and CeF3 films. Opt. Mater. Express 2017, 7, 989–1006. [Google Scholar] [CrossRef]
- Vojna, D.; Slezak, O.; Lucianetti, A.; Mocek, T. Verdet constant of magneto-active materials developed for high-power Faraday devices. Appl. Sci. 2019, 9, 3160. [Google Scholar] [CrossRef]
- Bouazza, S.; Gough, D.S.; Hannaford, P.; Lowe, R.M.; Wilson, M. Isotope shifts and hyperfine structure in near-ultraviolet transitions of Pb I by Doppler-free saturation spectroscopy. Phys. Rev. A 2000, 63, 012516. [Google Scholar] [CrossRef]
- Persson, J.R. Hyperfine structure and hyperfine anomaly in Pb. J. Phys. Commun. 2018, 2, 055028. [Google Scholar] [CrossRef]
- Thompson, R.C.; Anselment, M.; Bekk, K.; Göring, S.; Hanser, A.; Meisel, G.; Rebel, H.; Schatz, G.; Brown, B.A. High-resolution measurements of isotope shifts and hyperfine structure in stable and radioactive lead isotopes. J. Phys. G Nucl. Phys. 1983, 9, 443. [Google Scholar] [CrossRef]
- Reeves, J.M.; Fortson, E.N. Isotope shifts at 1.28 µm in Pb. Phys. Rev. A 1991, 44, R1439(R). [Google Scholar] [CrossRef]
- Budker, D.; Gawlik, W.; Kimball, D.F.; Rochester, S.M.; Yaschuk, V.V.; Weis, A. Resonant nonlinear magneto-optical effects in atoms. Rev. Mod. Phys. 2002, 74, 1153. [Google Scholar] [CrossRef]
- Jellison, G.E.; Rouleau, C.M. Determination of optical birefringence by using off-axis transmission ellipsometry. Appl. Opt. 2005, 44, 3153–3159. [Google Scholar] [CrossRef]
- Schurcliff, W.A. Polarized Light: Production and Use; Harvard University Press: Cambridge, MA, USA, 1962; pp. 122–123. [Google Scholar]


Disclaimer/Publisher’s Note: The statements, opinions and data contained in all publications are solely those of the individual author(s) and contributor(s) and not of MDPI and/or the editor(s). MDPI and/or the editor(s) disclaim responsibility for any injury to people or property resulting from any ideas, methods, instructions or products referred to in the content. |
© 2024 by the authors. Licensee MDPI, Basel, Switzerland. This article is an open access article distributed under the terms and conditions of the Creative Commons Attribution (CC BY) license (https://creativecommons.org/licenses/by/4.0/).