Abstract
Metasurfaces are an excellent platform for terahertz (THz) sensing applications, enabling highly efficient light–matter interaction and overcoming the fundamental disadvantage of the relatively long-wavelength THz range (30–3000 μm), which limits sensing of small features. The current focus in developing metasurfaces is mostly directed toward single-resonance metasurfaces and reconstruction of the dielectric constants of analyte from the saturation mode induced by the limited sensing volume of the metasurface. This paper presents a numerical demonstration of using a multiresonance metasurface to extract the thickness and refractive index of a deposited film without saturation of the sensor. It was shown that the multiresonance property enables determination of the analyte characteristic via measurements with two different thicknesses and tracking changes in two resonances. High-accuracy parameter retrieval is achieved when there are large differences in the thicknesses. In contrast to the established approach, this method provides an efficient way to avoid using relatively thick films.
1. Introduction
The remarkable characteristics of the terahertz radiation make THz spectroscopy a promising technology for chemical and biological analysis [1]. THz waves’ excitation of complex molecular vibrations and rotation transitions leads to the appearance of distinctive fingerprint characteristics of molecules in the gas phase [2]. The energies of these transitions are equal to the energy of the THz radiation, which is low enough to be non-ionizing. In addition, THz waves can penetrate dielectric materials, such as plastics, fabric, ceramics, etc. Although polar liquids absorb THz waves, terahertz absorption spectroscopy can be used for the measurement and detection of the water content of samples [3]. All these features allow researchers to find applications of THz waves in various sectors, such as security, defense, pharmaceuticals, etc. [4,5,6,7].
However, since the wavelength in the THz range can be as big as several hundreds or thousands of micrometers, it is almost impossible to measure very thin films with conventional methods, such as conventional THz time domain spectroscopy [8,9]. Scientists have proposed different solutions to this problem, including waveguides [10,11,12], photonic crystals [13], as well as plasmonic structures [14] and metasurfaces [15]. Due to the variety of principles, functions, and requirements of thin-film sensing approaches, it is difficult to compare the performance of these techniques. Despite this, metasurfaces are considered to be a desirable alternative because of their reduced complexity, flexible design, and because they offer the possibility to directly manipulate the quality factors in comparison with other methods [16].
Metasurfaces are artificial structures that can be described as two-dimensional metamaterials. They usually consist of periodically placed elementary subwavelength units that are designed to have a customized electromagnetic response [17]. These artificial structures have expanded the capabilities of manipulating THz waves and sensing and even mimicking the properties of different phenomena from the visible range, such as localized surfaces plasmon polaritons [18]. As for sensing, metasurfaces have significantly improved it across the entire electromagnetic spectrum, especially in the THz range. They enable enhancement of the light–matter interaction with the substance under analysis, producing a high confined electric field near the substance. This corresponds to the appearance of a sharp change in the spectral response. The typical behavior is a shift in the metasurface resonance dip because of a change in the metasurface dielectric environment. Tracking the position of the dip, one can measure and detect even minute amounts of the analyte. This feature, in addition to the unique properties of terahertz radiation, is optimal for label-free, selective thin-film sensing [19,20].
Many authors have reported on metasurface-based thin-film sensors. Most of these articles are devoted to split-ring resonators and their modifications, periodic slits in metallic foil, and sensors based on extraordinary transmission, BIC, or spoof localized surface plasmon resonance [15,20,21,22]. Although these examples show good performance as sensing platforms, they usually exploit a single-resonance approach to measuring the characteristics of thin films. In general, measuring the change in one resonance dip is not enough to simultaneously retrieve the thickness and refractive index of film of an unknown substance. To overcome this problem, different authors suggested either using the saturation mode of the metasurface to study, for example, bacteriophage viruses [23,24], or measuring only the concentration of substances excluding the thickness and refractive index from consideration [25,26].
Although various metasurfaces have successfully demonstrated their single-resonance capabilities for near-field enhancement, there are different applications in photonics that require coverage of multiple operating frequencies. For instance, it has been shown that multispectral metamaterials can be useful in the search for the highest response of sensors on optically unknown target molecules (without recognizable absorption features) [27]. Furthermore, such types of metasurfaces may work in nonlinear photon generation, where it could be possible to enhance the field at the second- and third-harmonic frequencies [28]. In addition, such metasurfaces can be used to enhance multiple characteristic frequency peaks of molecule fingerprint spectra, differentiating two substances [29] and extending the operating range of absorbers [30] and sensors [31].
In this work, one of the advantages of multiresonant metasurfaces is demonstrated for the first time, namely, the possibility of simultaneously measuring the thickness and refractive index of unknown non-absorbing substances. To this end, we use a modified metasurface based on the Archimedean spiral with a C resonator. The paper is structured as follows: first, we present basic information about the metasurface and approaches to its simulations. Then, we show the step-by-step logic of refractometry measurement with metasurfaces. Next, we describe the principles of measuring the refractive index and thickness by using a non-dispersive analyte without absorption and suggest our own approach based on the multiresonance nature of resonance spectra of the metasurface. Finally, we summarize our findings, discussing perspectives of this method.
2. Materials and Methods
Archimedean spiral metasurfaces are a modification of another metamaterial called textured cylinders. They are well known as structures that support spoof localized surface plasmon polaritons (SLSPs) [18]. This modification has solved the limitation of work of textured cylinders in the region of longer wavelengths. The combination of an additional resonator with the spiral structure is associated with the electromagnetically induced transparency (EIT) phenomenon [32], which enables excitation of high-Q resonances. In general, there have been many articles on the mechanisms underlying the excitation of spoof localized surface plasmon polaritons and the appearance of EIT on such metasurfaces [18,32,33,34,35,36,37,38,39,40,41,42].
In this article, we continue investigating the properties of spiral-based metasurfaces and their application to measuring the characteristics of analytes [35,43,44]. In [35], the authors compared a logarithmic spiral metamaterial with an azimuthally grooved metal cylinder and studied the influence of their various parameters on resonance excitation. The next article [43] was devoted to different designs of metasurfaces based on Archimedean spirals. Their disadvantages and advantages were analyzed. The last article [44] demonstrated the sensor capabilities of Archimedean spiral metasurfaces with a C resonator and the benefit of using phase spectra both experimentally and numerically. This work mainly focuses on the methodology of using the multiresonance feature for analyte characterization.
To demonstrate the new approach, we chose the same structure parameters as in the previous article [44] because of the technological feasibility of fabrication by the current technology. We will briefly describe the influence of the parameters on the sensor performance. The metasurface is an aluminum (σ = 1.5 ∙ 107 cm/m) [45] Archimedean spiral with a C resonator (see Figure 1a), which is placed on a polypropylene (εPP = 2.25∙(1 - j∙10 - 3)) substrate [46]. The substrate material has low values of dielectric losses and low cost, and it is compatible with the photolithographic process. In addition, its low permittivity leads to a relatively higher sensitivity, due to a higher electric field above the metasurface [47]. The metallization thickness tAl = 0.35 μm is limited by the fabrication process and the skin depth, while the substrate thickness tPP = 15 μm corresponds to the commercially available polypropylene films. Large substrate thickness can lead to the Fabry–Pero effect interfering with the entire response of the metasurface. Thicker metallization increases the sensitivity of the sensor [48]. The structure radius R = 192 μm makes it possible to control the resonance frequency of the structure. The higher the radius, the lower the resonance frequency. The disk radius r = 18 µm has the opposite effect on the resonant frequency [32]. The period of the metasurface influences the interaction between elementary units of the metasurface, which can change the quality factor and sensitivity of the sensor. At the same time, the period must be small enough for the resonance frequency of diffraction mode to be as high as possible and to not overlap with the resonances of the structure. The periods of the metasurface in the x- and y-directions are equal in both directions (px = py = 768 μm), and this distance is great enough to avoid a strong hybridization effect [32,42]. The number of arms m = 12 and their width w = 8 μm are related to nonlocal effects and spectrum stability against small variations due to incidence angle error and losses in the metal. The distance to the C-shaped resonator RC = 204 μm, its angular width α = 90 deg, and its width wr = 8 μm relate to the symmetry of the structure, the position of the resonance dips, and the efficiency of excitation of higher modes [43].
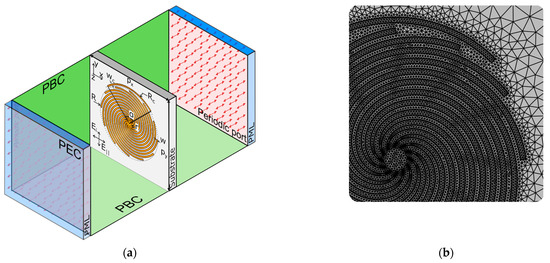
Figure 1.
(a) Floquet’s unit cell limited by periodic boundary conditions, perfectly matched layer (PML) conditions, and perfect electric conductor (PEC) conditions. (b) Mesh around spiral structure.
To analyze the interaction of the metasurface with the analyte, we used the COMSOL Multiphysics software with the numerical scheme shown in Figure 1a. To simulate the periodic structure, we realized a standard Floquet cell consisting of periodic boundary conditions (PBC), periodic ports, and perfectly matched layers (PML) [44]. Because of its geometrical complexity, the mesh was developed without using an automatic algorithm from the COMSOL. It was necessary to provide convergence of the numerical scheme and save the computation resource. Inside the PML domains, we used an eight-layer structured mesh. The same type of mesh but with four layers was applied to the analyte and substrate domains. Both air domains had unstructured triangular meshes, and their minimum and maximum element sizes were 100 and 10 times smaller than the wavelength relating to the maximum frequency of the investigated spectral range. To prevent the excitation of resonance modes by numerical ports, the height of these domains was made equal to the doubled radiation wavelength corresponding to the minimum frequency of the spectrum range of interest. The spiral structure was modeled as a transition boundary condition. For reproduction of the geometry, the size of triangular elements around the spiral structure was varied between w/4 and w/2 (see Figure 1b). In this configuration, because of high memory requirements, it was impossible to apply the direct solver, and thus the iterative solver was used instead. We stopped diminishing the mesh size when the shift of the resonances and change in the amplitude of the resonances became negligible.
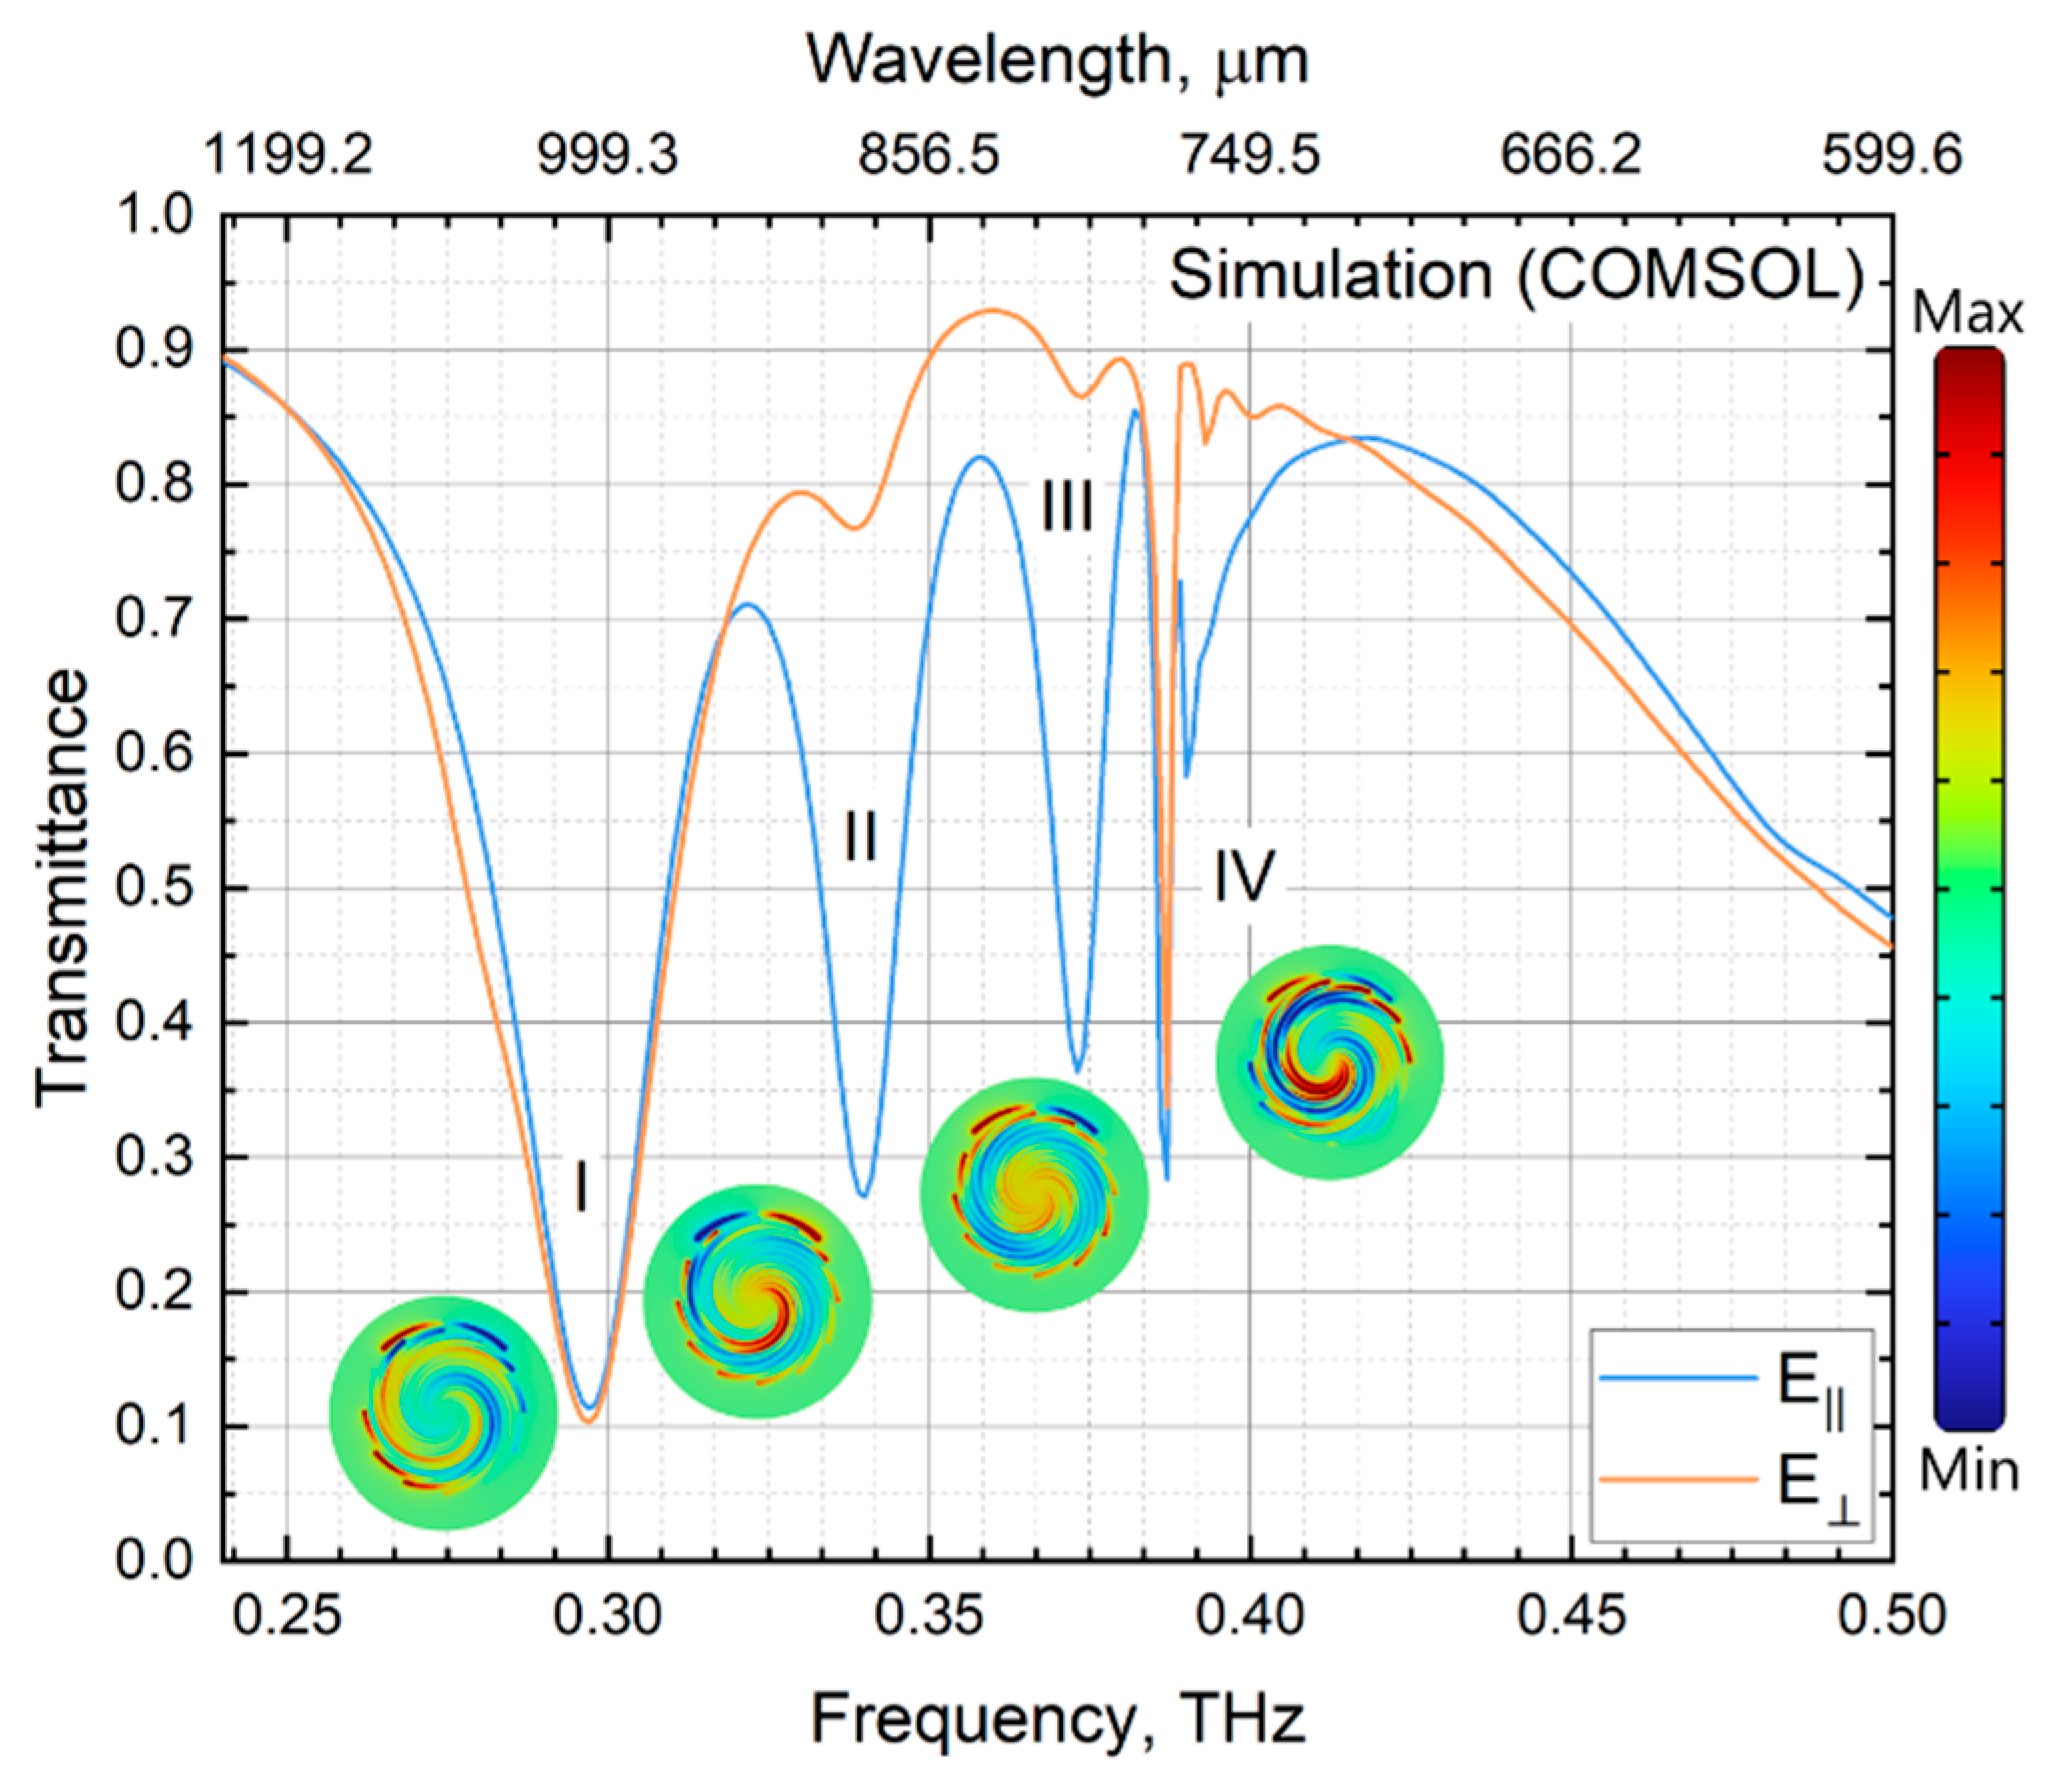
Because the metasurface is a combination of a C-shaped resonator and Archimedean spiral, it supports several resonances under different polarization conditions of the incident radiation. In the case of polarization parallel to the C resonator (), the plane wave excites two fundamental electric dipole modes of the spiral structure (I—0.297 THz) and the C-shape resonator (II—0.34 THz), magnetic dipole mode (III—0.373), and diffraction mode (IV—0.388 THz). If the polarization of the incident beam is perpendicular to the C resonator , only the fundamental electric dipole mode of the spiral structure and diffraction mode will be observed (see Figure 2) [32,43,44]. The several dips in the spectra not only allow one to expand the spectral range for analysis, but also improve the method of retrieving the analyte characteristics, which will be shown below.

Figure 2.
Transmission spectra are related to two different polarizations and and field distribution , which is associated with different resonance dips.
3. Transmission Refractometry Measurement
Metasurfaces can be tuned to work in two different regimes: the refractometric and spectroscopic operating modes. In the first case, the absorption line of the analyte is far from the resonance dip of the metasurface, whereas in the second regime, the absorption line overlaps with it. We will study the refractometry operating mode, in which it is hypothetically possible to retrieve the real part of the refractive index and the thickness of the analyte.
Specifically, our typical transmission measurement algorithm is as follows.
- (i)
- Diaphragm measuring.
A frequency-tunable terahertz source of radiation produces a horizontally polarized plane wave, which is incident on a diaphragm with size equal to or less than the size of the metasurface. A detector records the transmitted beam at different frequencies. This spectrum is used for calibration, and we can designate it as .
- (ii)
- Measuring bare metasurface.
The next step is to record the spectrum of the bare metasurface. The same radiation is transmitted through the spiral metasurface without the analyte, and the recorded intensity is normalized to the spectrum of the first step:
- (iii)
- Measuring metasurface covered by analyte.
The sensing mechanism is based on the change in the measured metasurface resonances as a result of a small change in the analyte covering the metasurface. Thus, at the final step, the transmission spectra of the metasurface covered by the analyte are recorded:
Comparing and , we can estimate the characteristics of the analyte. We will reproduce this measurement algorithm with simulation, in which and are presented in terms of the absolute value of the S parameter 2.
4. Refractive Index Sensitivity
To retrieve the refractive index by using metasurfaces, it is necessary to identify the parameters of their response on thin layers of analytes. One such characteristic is the sensor’s sensitivity to the real part of the refractive index. It can be found through changes in the resonance frequencies in the amplitude, phase, or phase derivative spectra. Although the imaginary part of the refractive index has little influence on the frequency shifts of the resonances [23] when the sensor works in the refractometric regime, for simplicity and certainty we assume that our analyte is lossless with the refractive index and thickness . This enables us to exclude additional effects from consideration. In addition, we study only the amplitude transmission frequency spectra.
Let us consider a three-layer structure consisting of the substrate with a metasurface covered with the analyte and surrounded by the medium with the refractive index (in our case, it is air with ). As the refractive index changes, the response of the metasurface in the absence of the absorption and with is linear, and the resonance frequency shift can be described as follows [49]:
If the analyte is a thin film of finite thickness, then the sensor response will be
where is the effective refractive index of the bilayer, which is the weighted average of and .
Assuming that the evanescent electric field decays exponentially with the distance from the metasurface and is proportional to this field, we can write down the weighting factor as , where is the transverse coordinate with zero at the surface of the metamaterial and is the characteristic decay length. Thus, can be described as [49]
or
Substituting Equation (6) into Equation (4), we obtain
or
Using Equation (8) and the terms of the sensor response, we can perform the replacements and , and then
where is the saturation sensitivity, that is, the maximum sensitivity of the sensor, and is the saturation thickness. characterizes the maximum overlap of the field and the analyte film, whereas is the thickness at which the sensitivity of the sensor increases “e” times. This behavior of metasurfaces has been reported by various authors [48,50,51,52].
The spectrum of our metasurface has four resonance dips with their own sensitivities. Thus, Equation (9) can be rewritten as follows:
where is the number of the resonance and is the resonance shift, depending on the analyte thickness and refractive index. With a substance with known refractive index and thickness, it is possible to obtain the characteristics of sensors.
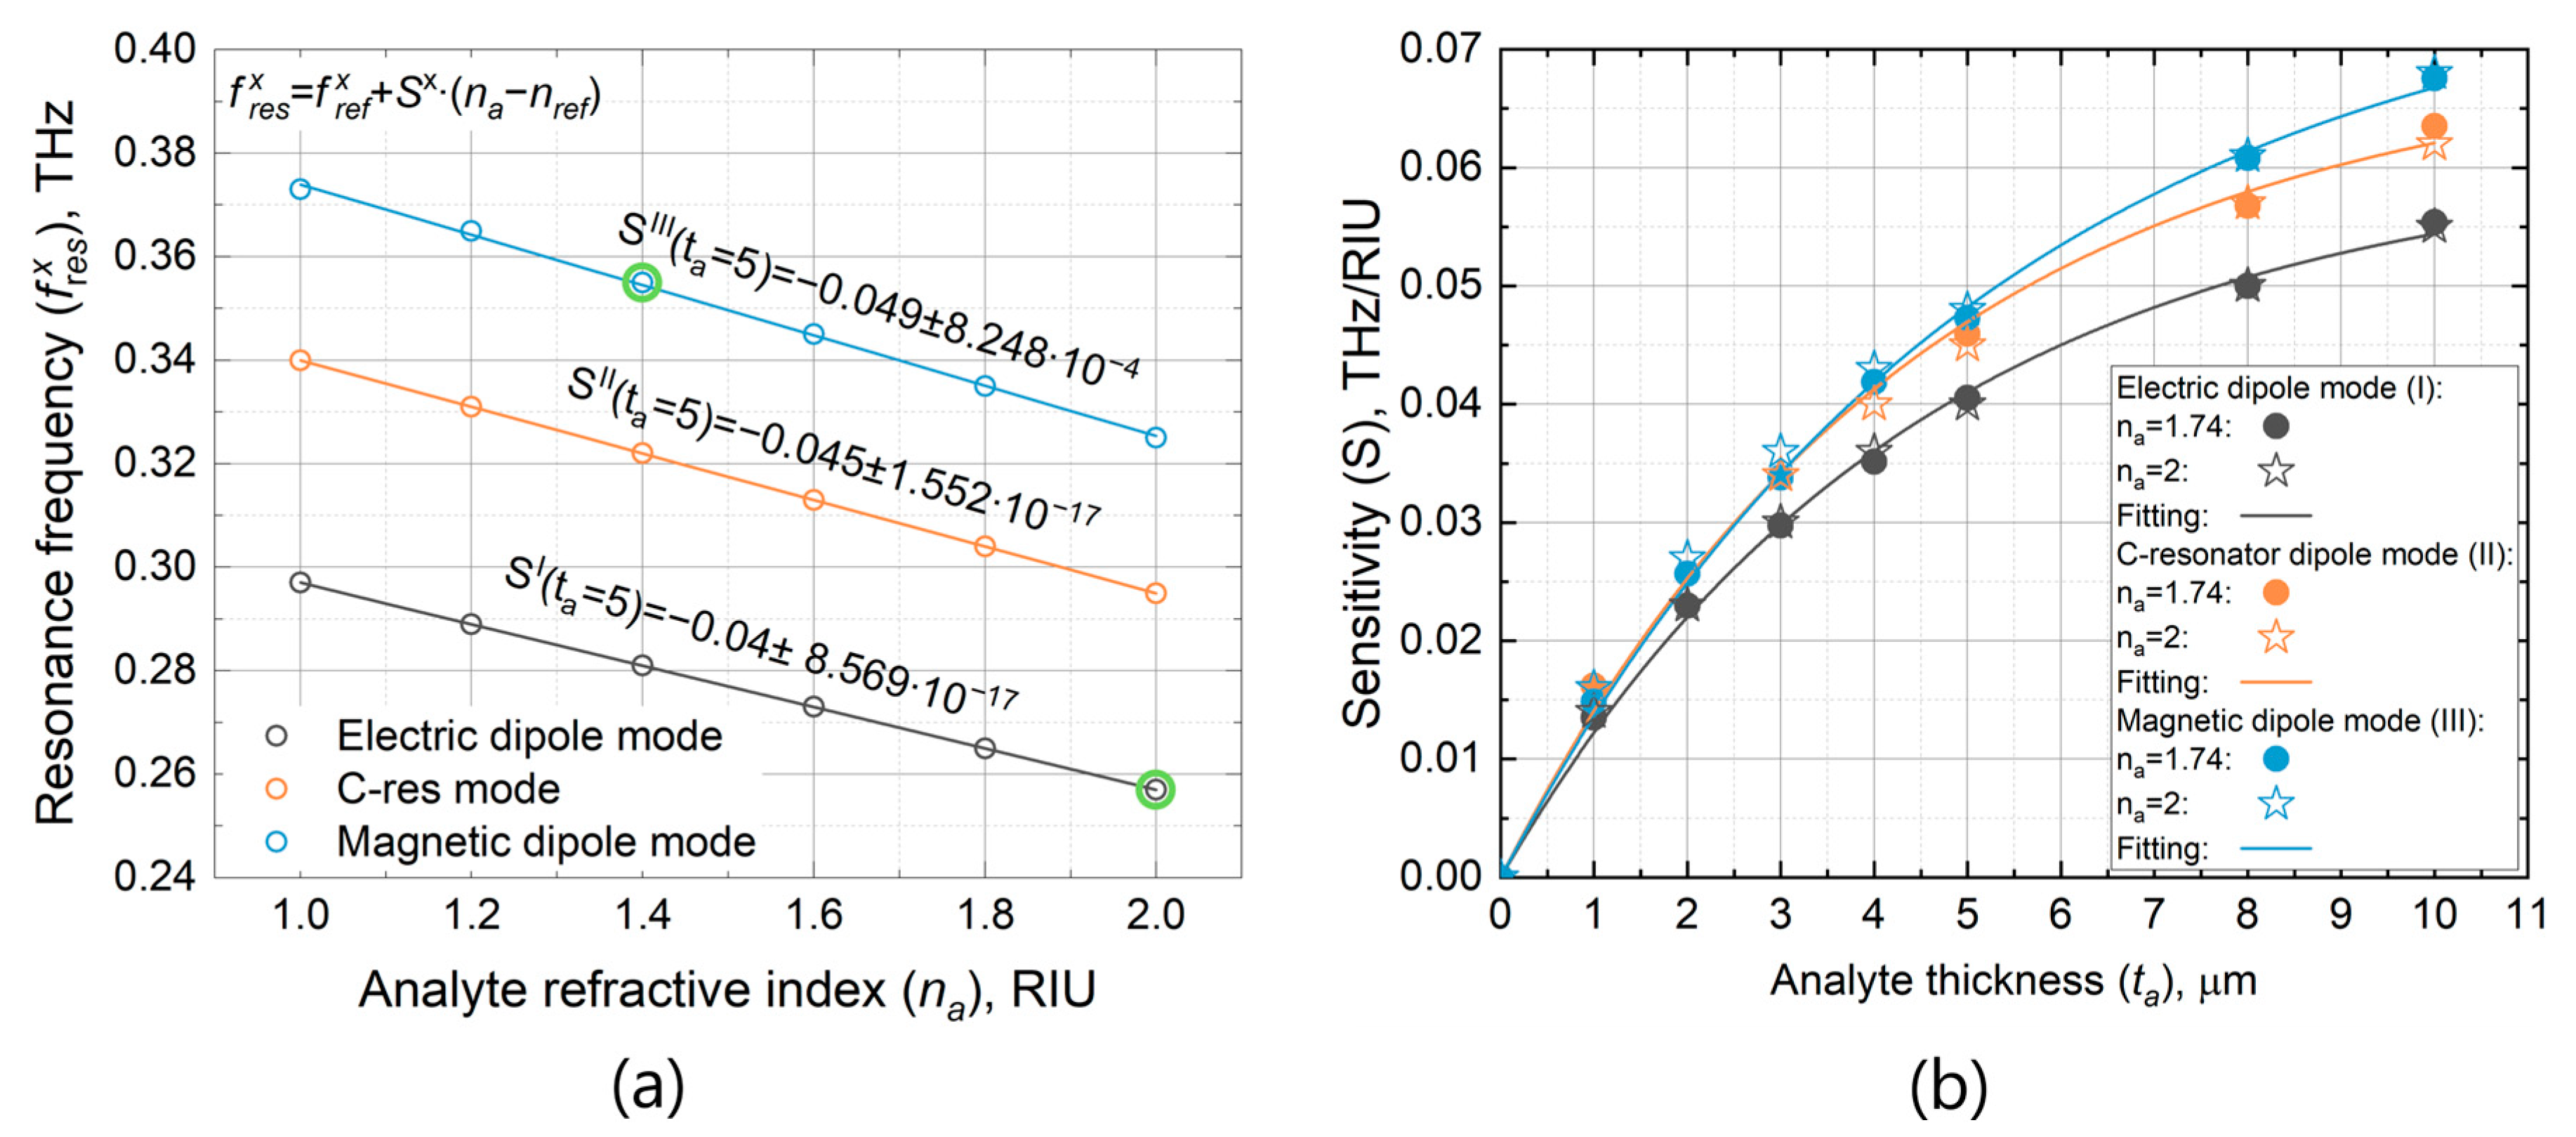
To check the above equations, we calculated the spectra of the metamaterial covered with an analyte of different thicknesses and refractive indices. In each spectrum, we tracked the change in the resonance frequency and then calculated the resonance shift induced by the change in either the refractive index or thickness. The calculated points were fitted by Equations (3) and (10), as shown in Figure 3.
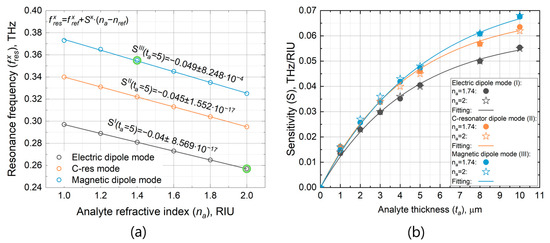
Figure 3.
Sensitivity of different modes at variation in (a) refractive index and (b) analyte thickness.
Figure 3 shows that the sensitivity of the magnetic dipole mode is higher than that of the electric dipole mode; the fitting results are demonstrated in Table 1. The same is true for the saturation thickness of the magnetic dipole modes, which is larger than that of other modes. Although the figure of merit of the diffraction mode is similar to those of other modes in simulations, it is the side mode that is highly dependent on the quality of fabrication, which results in strong broadening of the resonance in experiments. This mode can be used to determine the quality of fabrication of a structure, but it is of no interest for sensor application [44]. Thus, it was excluded from consideration.

Table 1.
Fitting results.
5. Measurement Principles
An unknown substance can be examined with a metasurface if the sensitivity of the latter has been calculated and measured for a known material. There are three options for analyzing a thin non-absorptive film covering the sensor, which depend on the input known characteristics as shown in Table 2.
Table 2.
Options for analyzing a thin non-absorptive film.
- A.
- The real part of the refractive index is known.
Considering , and as known characteristics, we can obtain from Equation (10):
Let us assume that we do not know the parameter of thickness for and , related to the electric dipole mode. This point was marked with the big green circles in Figure 3a. Taking into account the model error, we can obtain
The result must be equal to 5 in the case of zero approximation error.
- B.
- The film thickness is known.
Similar reasoning can be carried out in the case of a known analyte thickness:
For example, here, we consider the result for the magnetic dipole mode with the known and (see Figure 3a):
As in the previous case, the model does not yield an ideal result and is slightly further away from the ideal 1.4 RIU.
The “A” and “B” measurement approaches are straightforward. These methods provide the analyte parameters directly, but additional measurements of either the thickness or refractive index must be made, which increases the complexity of the measurements and adds some steps to the transmission refractometry measurement, and thus more errors appear.
- C.
- Only the sensitivity of the multiresonance metasurface is known.
During work with an unknown substance, we need to switch the sensor to a special mode of measurement to collect additional data on the deviation induced by the substance. Below, we will discuss a general approach, which works with any type of metasurface, and an extra one, which can work only with multiresonant metasurfaces.
5.1. Saturation Measurement
If the thickness of the analyte is much greater than the saturation thickness, , then saturation of the sensor occurs, that is, , or in other words, the sensitivity (Equation (10)) reaches its maximum:
In an experiment, this condition is true when , since , and the error will be less than 1.8%. However, from the viewpoint of the experiment, it is necessary to keep increasing the thickness of the substance until the change in the resonance shifting almost ceases.
The real part of the refractive index can be derived from Equation (13):
Substituting Equation (14) into Equation (11), we can find the thickness for other films of the analyte and modes:
For example, let us consider and an ideal case, when the parameters of the sensor are defined ideally. Then, for the electric dipole mode, the frequency shift (Equation (6)) will be . Using this value and Equation (10), we obtain
This value represents a small error of 0.6% without taking into account the model error.
5.2. Nonlinear Measurement
In this section, we study another approach to search for both the refractive index and thickness simultaneously with amplitude transmission spectra. This approach is based on several resonances arising in the spectrum of the metasurface.
Let us consider measurements with two different thicknesses, but the same substance, and track the resonance change of the electric and magnetic dipole modes. Then, using Equation (11), we can write down four equations with four unknowns ():
We conduct one measurement at the thickness and another one at . Then, it is true that
Solving this equation relative to and , we obtain
Let us equate the relations in (18) and get the ratios for :
To solve this equation for , we looked for the zero modulus of the difference between the right-hand and left-hand sides of the equation:
By solving Equation (20), we can find first and then , and with Equations (16) and (18).
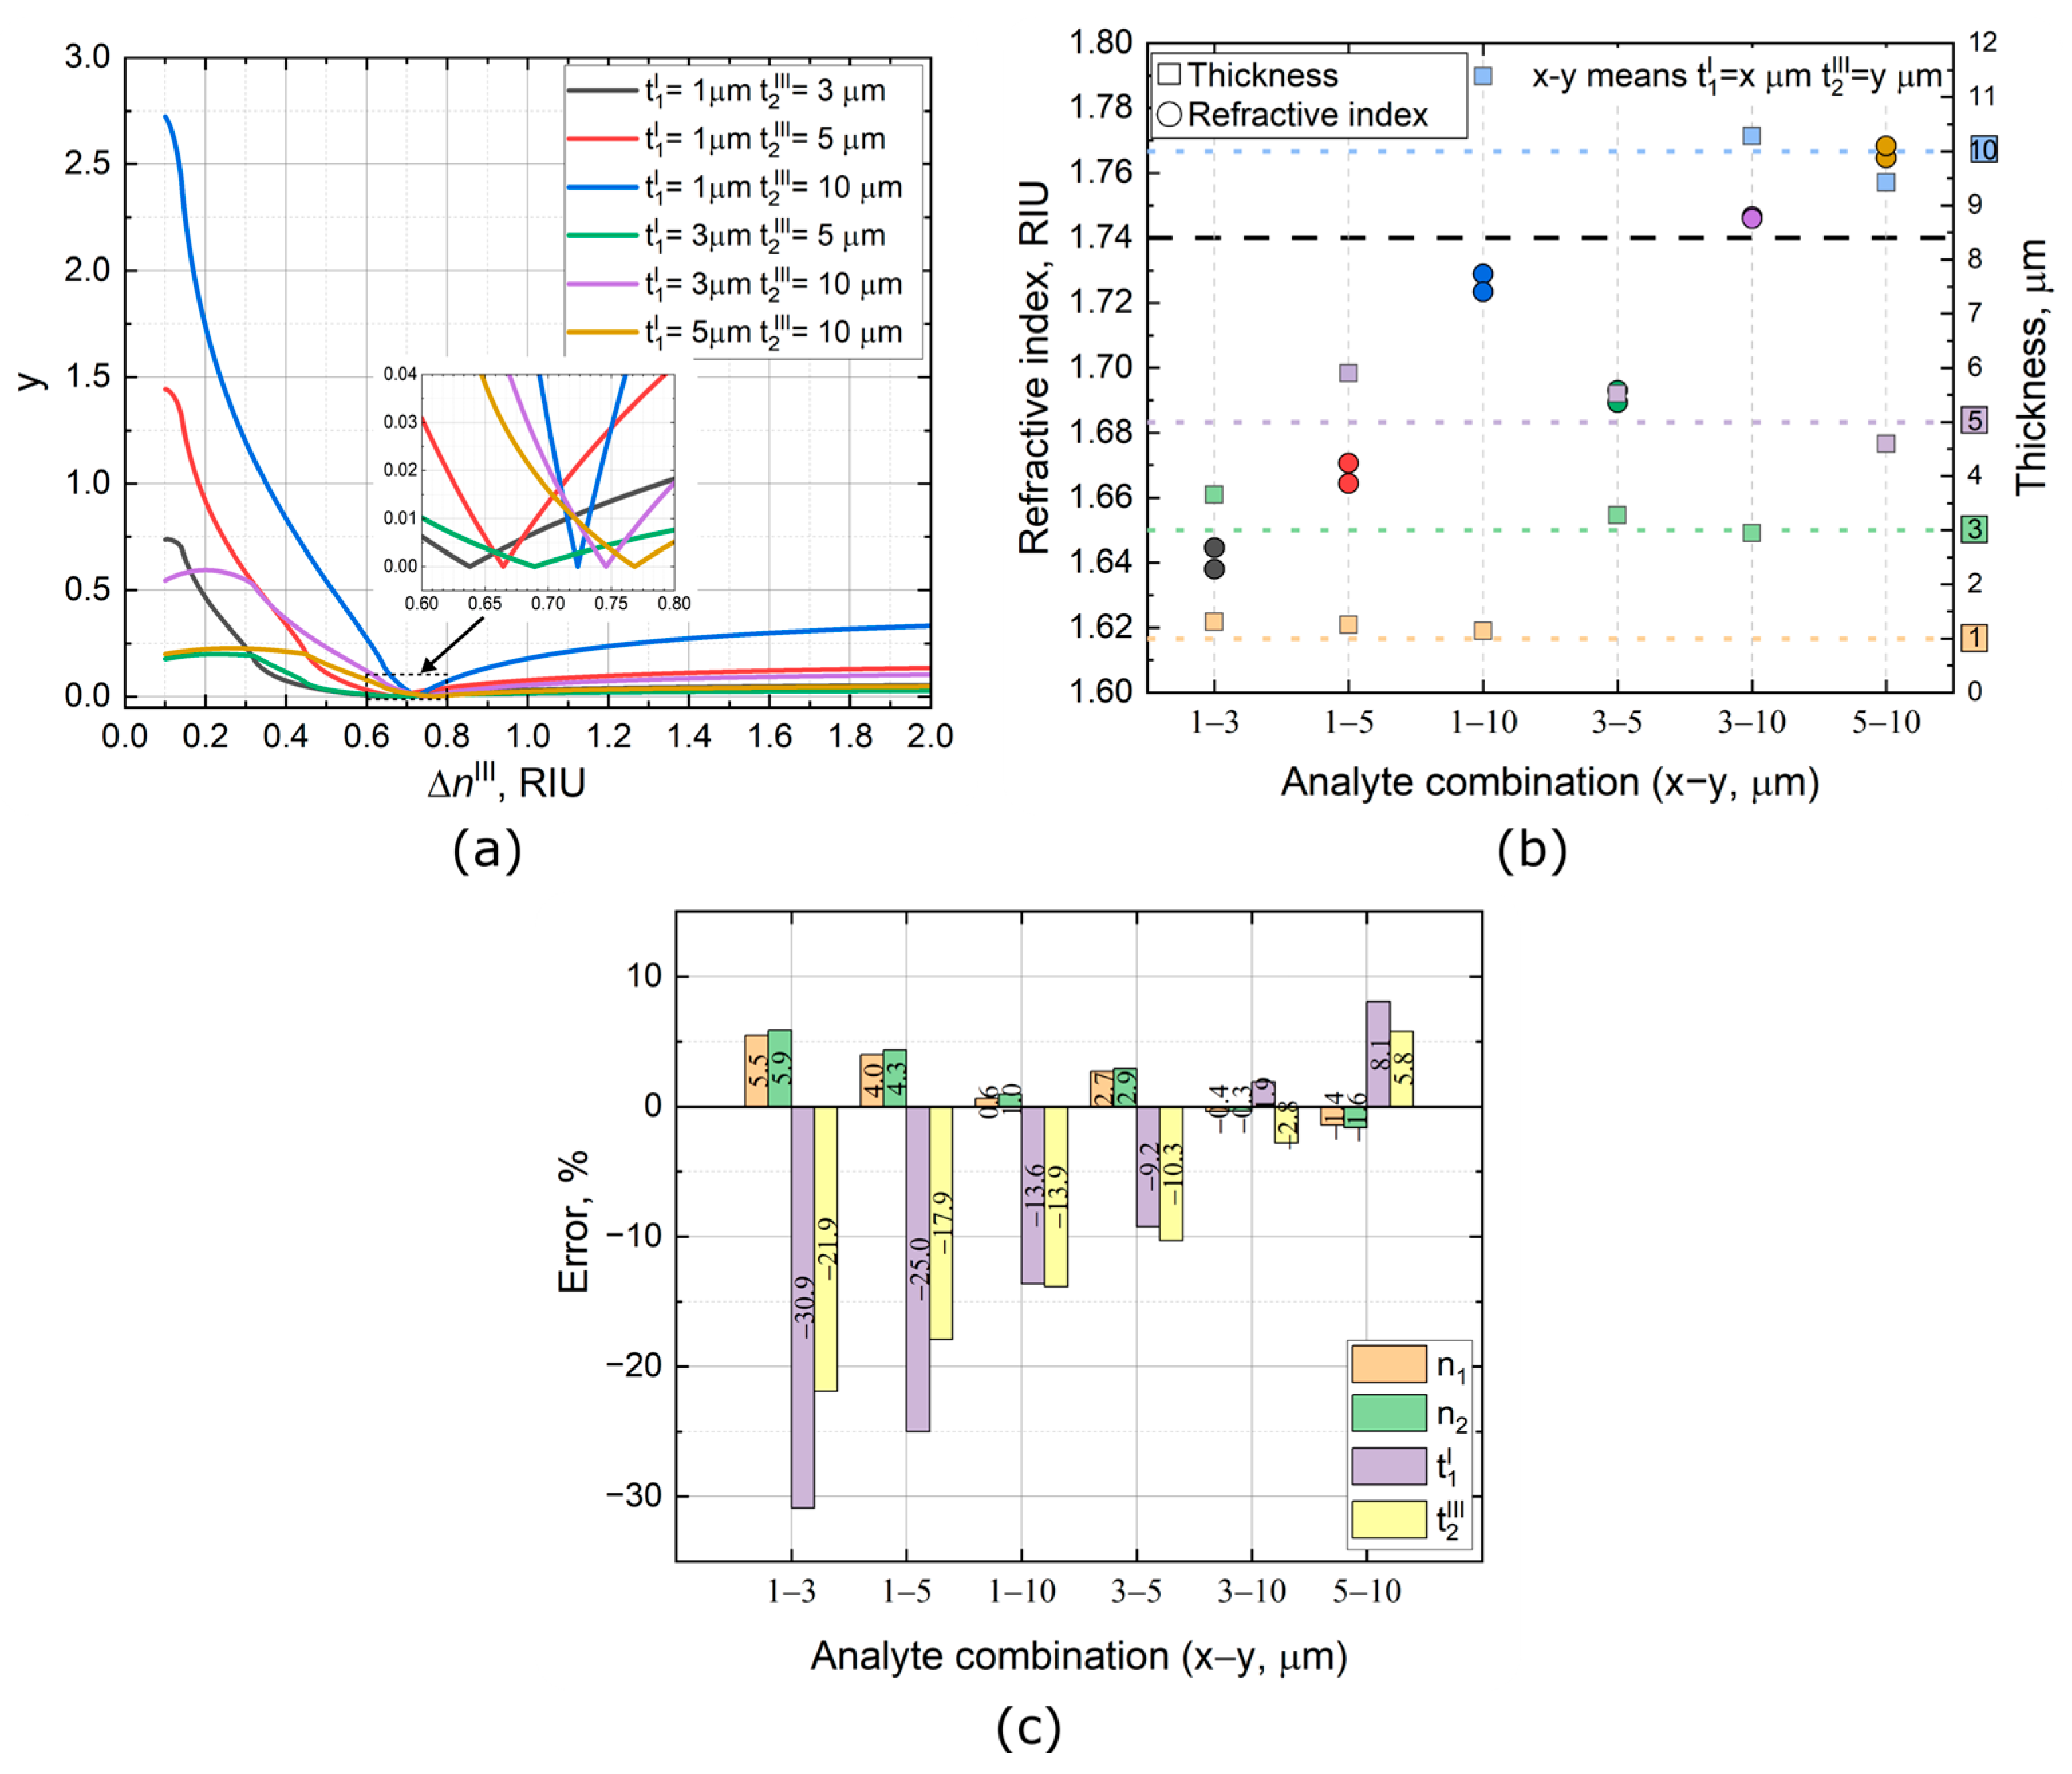
Following our approach, we tried to find the parameters of the analyte with and precalculated values of thickness by using only the sensitivities from Table 1. Figure 4a shows the typical behavior of Equation (20) for various analyte thicknesses, whereas Figure 4b presents the thickness and refractive index values obtained by taking into account the error of the approximation model. According to Figure 4c, the error decreases with increasing thickness contrast and becomes minimal when the thickness is sufficiently far from the saturation mode and the linear operation mode of the sensor ().
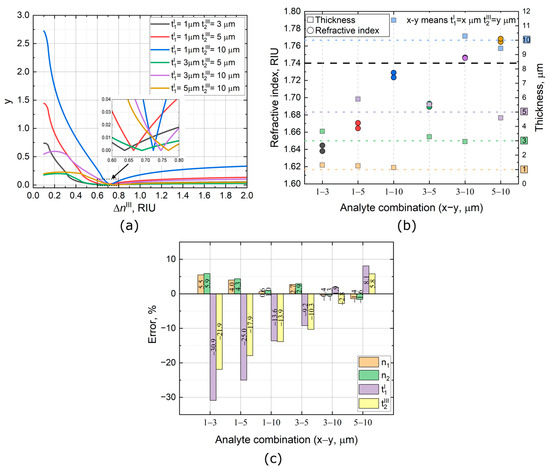
Figure 4.
(a) Typical behavior of Equation (20) if there is solution; (b) values of refractive index and thickness calculated with Equation (20) and sensitivity from Table 1; (c) dependence of errors on combinations of analytes.
Let us define the scope of applicability of this approach. The upper limit of the operation mode is determined by the saturation mode. There is no sense in using Equation (19), since it is easier to retrieve the parameters from Equation (13). On the other hand, Equation (19) will not work if the measurements are conducted in the mode of thin films (linear operation mode of the sensor):
The simplest way to show this is to repeat the above reasoning, using Equation (21). To achieve this, we obtain
In experiments, it is only necessary to check the frequency shifts for compliance with Equation (22). If it is true, then Equation (19) cannot be applied to determine the analyte characteristics. Moreover, it can be shown that if at least one measurement is carried out in the thin-film mode, then Equation (19) remains true. For example, we can use thicknesses of 1 μm and 3 μm to extract the analyte parameters as shown in Figure 4, while for measurements in the saturation mode, it is necessary to use a thickness equal to at least 18 μm, which is six times greater than the largest thickness required for our approach.
6. Conclusions
To conclude, we have presented techniques for measuring the dielectric constants of thin films covering metasurfaces and suggested a new approach based on the multiresonance spectral features of the Archimedean spiral metasurfaces with a C resonator. This method uses the different responses of two resonances on an analyte with two different thicknesses. Comparing the frequency shifts of the two resonances under these conditions, one can extract both the refractive index and thickness of the dielectric film. There is no need to apply additional methods to measure the film thickness or the refractive index. In contrast with the well-known measurement technique based on the saturation behavior of the resonances, this approach requires a much thinner film, although it still partly fails to work with the minimum film thickness resolvable by the sensor. In addition, it was shown that precise determination of the sensor parameters such as the saturation sensitivity and thickness is needed for the new approach. Our work demonstrates the advantages of multiresonance metasurface for sensing, and it could be useful for further development of sensors and sensor techniques in the THz frequency range.
Author Contributions
This work was realized through the collaboration of all authors. O.K.: contributing to the main results, original draft preparation; V.G.: reviewing and editing; scientific discussion. All authors have read and agreed to the published version of the manuscript.
Funding
This research received no external funding.
Institutional Review Board Statement
Not applicable.
Informed Consent Statement
Not applicable.
Data Availability Statement
The raw data supporting the conclusions of this article will be made available by the authors on request.
Acknowledgments
The work was carried out at the shared research facility Siberian Center for Synchrotron and Terahertz Radiation on the basis of the Novosibirsk Free Electron Laser at Budker Institute of Nuclear Physics SB RAS.
Conflicts of Interest
The authors declare no conflicts of interest.
References
- Markelz, A.G.; Mittleman, D.M. Perspective on Terahertz Applications in Bioscience and Biotechnology. ACS Photonics 2022, 9, 1117–1126. [Google Scholar] [CrossRef]
- Cuisset, A.; Hindle, F.; Mouret, G.; Bocquet, R.; Bruckhuisen, J.; Decker, J.; Pienkina, A.; Bray, C.; Fertein, É.; Boudon, V. Terahertz Rotational Spectroscopy of Greenhouse Gases Using Long Interaction Path-Lengths. Appl. Sci. 2021, 11, 1229. [Google Scholar] [CrossRef]
- Smolyanskaya, O.A.; Chernomyrdin, N.V.; Konovko, A.A.; Zaytsev, K.I.; Ozheredov, I.A.; Cherkasova, O.P.; Nazarov, M.M.; Guillet, J.-P.; Kozlov, S.A.; Kistenev, Y.V.; et al. Terahertz Biophotonics as a Tool for Studies of Dielectric and Spectral Properties of Biological Tissues and Liquids. Prog. Quantum Electron. 2018, 62, 1–77. [Google Scholar] [CrossRef]
- Naftaly, M.; Vieweg, N.; Deninger, A. Industrial Applications of Terahertz Sensing: State of Play. Sensors 2019, 19, 4203. [Google Scholar] [CrossRef] [PubMed]
- Yan, Z.; Zhu, L.-G.; Meng, K.; Huang, W.; Shi, Q. THz Medical Imaging: From in Vitro to in Vivo. Trends Biotechnol. 2022, 40, 816–830. [Google Scholar] [CrossRef] [PubMed]
- Wei, L.; Yu, L.; Jiaoqi, H.; Guorong, H.; Yang, Z.; Weiling, F. Application of Terahertz Spectroscopy in Biomolecule Detection. Front. Lab. Med. 2018, 2, 127–133. [Google Scholar] [CrossRef]
- Akter, N.; Hasan, M.; Pala, N. A Review of THz Technologies for Rapid Sensing and Detection of Viruses Including SARS-CoV-2. Biosensors 2021, 11, 349. [Google Scholar] [CrossRef] [PubMed]
- Koch, M.; Mittleman, D.M.; Ornik, J.; Castro-Camus, E. Terahertz Time-Domain Spectroscopy. Nat. Rev. Methods Primers 2023, 3, 48. [Google Scholar] [CrossRef]
- Withayachumnankul, W.; O’Hara, J.F.; Cao, W.; Al-Naib, I.; Zhang, W. Limitation in Thin-Film Sensing with Transmission-Mode Terahertz Time-Domain Spectroscopy. Opt. Express 2014, 22, 972. [Google Scholar] [CrossRef]
- Laman, N.; Harsha, S.S.; Grischkowsky, D.; Melinger, J.S. High-Resolution Waveguide THz Spectroscopy of Biological Molecules. Biophys. J. 2008, 94, 1010–1020. [Google Scholar] [CrossRef]
- Razanoelina, M.; Kinjo, R.; Takayama, K.; Kawayama, I.; Murakami, H.; Mittleman, D.M.; Tonouchi, M. Parallel-Plate Waveguide Terahertz Time Domain Spectroscopy for Ultrathin Conductive Films. J. Infrared Millim. Terahertz Waves 2015, 36, 1182–1194. [Google Scholar] [CrossRef]
- Islam, M.; Kumar Bhowmik, B.; Dhriti, K.M.; Minakshi; Mohan, D.; Ahmad, A.; Kumar, G. Thin Film Sensing in a Planar Terahertz Meta-Waveguide. J. Opt. 2022, 24, 064016. [Google Scholar] [CrossRef]
- Zhao, Y.; Vora, K.; Liu, X.; Bögel, G.V.; Seidl, K.; Balzer, J.C. Photonic Crystal Resonator in the Millimeter/Terahertz Range as a Thin Film Sensor for Future Biosensor Applications. J. Infrared Millim. Terahertz Waves 2022, 43, 426–444. [Google Scholar] [CrossRef]
- Ng, B.; Wu, J.; Hanham, S.M.; Fernández-Domínguez, A.I.; Klein, N.; Liew, Y.F.; Breese, M.B.H.; Hong, M.; Maier, S.A. Spoof Plasmon Surfaces: A Novel Platform for THz Sensing. Adv. Opt. Mater. 2013, 1, 543–548. [Google Scholar] [CrossRef]
- Beruete, M.; Jáuregui-López, I. Terahertz Sensing Based on Metasurfaces. Adv. Opt. Mater. 2020, 8, 1900721. [Google Scholar] [CrossRef]
- O’Hara, J.F.; Withayachumnankul, W.; Al-Naib, I. A Review on Thin-Film Sensing with Terahertz Waves. J. Infrared Millim. Terahertz Waves 2012, 33, 245–291. [Google Scholar] [CrossRef]
- Ali, A.; Mitra, A.; Aïssa, B. Metamaterials and Metasurfaces: A Review from the Perspectives of Materials, Mechanisms and Advanced Metadevices. Nanomaterials 2022, 12, 1027. [Google Scholar] [CrossRef] [PubMed]
- Pors, A.; Moreno, E.; Martin-Moreno, L.; Pendry, J.B.; Garcia-Vidal, F.J. Localized Spoof Plasmons Arise While Texturing Closed Surfaces. Phys. Rev. Lett. 2012, 108, 223905. [Google Scholar] [CrossRef] [PubMed]
- Peng, Y.; Shi, C.; Zhu, Y.; Gu, M.; Zhuang, S. Terahertz Spectroscopy in Biomedical Field: A Review on Signal-to-Noise Ratio Improvement. PhotoniX 2020, 1, 12. [Google Scholar] [CrossRef]
- Ajayan, J.; Sreejith, S.; Manikandan, M.; Lai, W.-C.; Saha, S. Terahertz Sensors for next Generation Biomedical and Other Industrial Electronics Applications: A Critical Review. Sens. Actuators A Phys. 2024, 369, 115169. [Google Scholar] [CrossRef]
- Shen, S.; Liu, X.; Shen, Y.; Qu, J.; Pickwell-MacPherson, E.; Wei, X.; Sun, Y. Recent Advances in the Development of Materials for Terahertz Metamaterial Sensing. Adv. Opt. Mater. 2022, 10, 2101008. [Google Scholar] [CrossRef]
- Zhang, X.; Cui, W.Y.; Lei, Y.; Zheng, X.; Zhang, J.; Cui, T.J. Spoof Localized Surface Plasmons for Sensing Applications. Adv. Mater. Technol. 2021, 6, 2000863. [Google Scholar] [CrossRef]
- Park, S.J.; Yoon, S.A.N.; Ahn, Y.H. Dielectric Constant Measurements of Thin Films and Liquids Using Terahertz Metamaterials. RSC Adv. 2016, 6, 69381–69386. [Google Scholar] [CrossRef]
- Park, S.J.; Cha, S.H.; Shin, G.A.; Ahn, Y.H. Sensing Viruses Using Terahertz Nano-Gap Metamaterials. Biomed. Opt. Express 2017, 8, 3551. [Google Scholar] [CrossRef]
- Yang, J.; Qi, L.; Li, B.; Wu, L.; Shi, D.; Ahmed Uqaili, J.; Tao, X. A Terahertz Metamaterial Sensor Used for Distinguishing Glucose Concentration. Results Phys. 2021, 26, 104332. [Google Scholar] [CrossRef]
- Lee, G.; Cho, Y.; Ok, G. Improved Analysis of THz Metamaterials for Glucose Sensing Based on Modified Lorentz Dispersion Model. Spectrochim. Acta Part A Mol. Biomol. Spectrosc. 2023, 293, 122519. [Google Scholar] [CrossRef]
- Lee, D.-K.; Kang, J.-H.; Kwon, J.; Lee, J.-S.; Lee, S.; Woo, D.H.; Kim, J.H.; Song, C.-S.; Park, Q.-H.; Seo, M. Nano Metamaterials for Ultrasensitive Terahertz Biosensing. Sci. Rep. 2017, 7, 8146. [Google Scholar] [CrossRef] [PubMed]
- Krasnok, A.; Tymchenko, M.; Alù, A. Nonlinear Metasurfaces: A Paradigm Shift in Nonlinear Optics. Mater. Today 2018, 21, 8–21. [Google Scholar] [CrossRef]
- Zhang, M.; Guo, G.; Xu, Y.; Yao, Z.; Zhang, S.; Yan, Y.; Tian, Z. Exploring the Application of Multi-Resonant Bands Terahertz Metamaterials in the Field of Carbohydrate Films Sensing. Biosensors 2023, 13, 606. [Google Scholar] [CrossRef]
- Yuan, T.; Wu, J.; Xu, X.; Liu, J.; Du, Y. Multi-Resonant Tunable Absorber of Terahertz Metamaterial Based on GaAs and VO2. Results Phys. 2023, 49, 106519. [Google Scholar] [CrossRef]
- Ou, H.; Lu, F.; Xu, Z.; Lin, Y.-S. Terahertz Metamaterial with Multiple Resonances for Biosensing Application. Nanomaterials 2020, 10, 1038. [Google Scholar] [CrossRef] [PubMed]
- Liao, Z.; Liu, S.; Ma, H.F.; Li, C.; Jin, B.; Cui, T.J. Electromagnetically Induced Transparency Metamaterial Based on Spoof Localized Surface Plasmons at Terahertz Frequencies. Sci. Rep. 2016, 6, 27596. [Google Scholar] [CrossRef] [PubMed]
- Gao, Z.; Wu, L.; Gao, F.; Luo, Y.; Zhang, B. Spoof Plasmonics: From Metamaterial Concept to Topological Description. Adv. Mater. 2018, 30, 1706683. [Google Scholar] [CrossRef] [PubMed]
- Gao, Z.; Gao, F.; Zhang, Y.; Zhang, B. Deep-Subwavelength Magnetic-Coupling-Dominant Interaction among Magnetic Localized Surface Plasmons. Phys. Rev. B 2016, 93, 195410. [Google Scholar] [CrossRef]
- Gerasimov, V.V.; Kuznetsov, S.A.; Lemzyakov, A.G.; Hafizov, R.R. Studying Localized Surface Plasmon Resonances in the THz Region for Subwavelength Spiral Disks. J. Phys. Conf. Ser. 2020, 1461, 012048. [Google Scholar] [CrossRef]
- Huang, Y.; Zhang, J.; Cui, T.J.; Liao, Z.; Zhang, D.H. Revealing the Physical Mechanisms behind Large Field Enhancement in Hybrid Spoof Plasmonic Systems. J. Opt. Soc. Am. B 2018, 35, 396. [Google Scholar] [CrossRef]
- Huidobro, P.A.; Shen, X.; Cuerda, J.; Moreno, E.; Martin-Moreno, L.; Garcia-Vidal, F.J.; Cui, T.J.; Pendry, J.B. Magnetic Localized Surface Plasmons. Phys. Rev. X 2014, 4, 021003. [Google Scholar] [CrossRef]
- Liao, Z.; Fernández-Domínguez, A.I.; Zhang, J.; Maier, S.A.; Cui, T.J.; Luo, Y. Homogenous Metamaterial Description of Localized Spoof Plasmons in Spiral Geometries. ACS Photonics 2016, 3, 1768–1775. [Google Scholar] [CrossRef]
- Liao, Z.; Shen, X.; Pan, B.C.; Zhao, J.; Luo, Y.; Cui, T.J. Combined System for Efficient Excitation and Capture of LSP Resonances and Flexible Control of SPP Transmissions. ACS Photonics 2015, 2, 738–743. [Google Scholar] [CrossRef]
- Wang, Z.; Gao, Z.; Zhang, Y.; An, P.; Lou, J.; Cheng, P.; Zhao, H. Selectively Enhanced Magnetic Vertical Conductive Coupling among Magnetic Localized Surface Plasmons. J. Phys. D Appl. Phys. 2019, 52, 135101. [Google Scholar] [CrossRef]
- Gao, Z.; Gao, F.; Zhang, B. High-Order Spoof Localized Surface Plasmons Supported on a Complementary Metallic Spiral Structure. Sci. Rep. 2016, 6, 24447. [Google Scholar] [CrossRef] [PubMed]
- Zhang, J.; Liao, Z.; Luo, Y.; Shen, X.; Maier, S.A.; Cui, T.J. Spoof Plasmon Hybridization. Laser Photonics Rev. 2017, 11, 1600191. [Google Scholar] [CrossRef]
- Gerasimov, V.V.; Hafizov, R.R.; Kuznetsov, S.A.; Lazorskiy, P.A. Exploiting Localized Surface Plasmon Resonances in Subwavelength Spiral Disks for THz Thin Film Sensing. Appl. Sci. 2020, 10, 3595. [Google Scholar] [CrossRef]
- Kameshkov, O.; Gerasimov, V.; Kuznetsov, S. Sensing Performance Analysis of Spiral Metasurface Utilizing Phase Spectra Measurement Technique. Photonics 2023, 10, 243. [Google Scholar] [CrossRef]
- Kuznetsov, S.A.; Paulish, A.G.; Navarro-Cía, M.; Arzhannikov, A.V. Selective Pyroelectric Detection of Millimetre Waves Using Ultra-Thin Metasurface Absorbers. Sci. Rep. 2016, 6, 21079. [Google Scholar] [CrossRef] [PubMed]
- Navarro-Cia, M.; Kuznetsov, S.A.; Aznabet, M.; Beruete, M.; Falcone, F.; Ayza, M.S. Route for Bulk Millimeter Wave and Terahertz Metamaterial Design. IEEE J. Quantum Electron. 2011, 47, 375–385. [Google Scholar] [CrossRef]
- Deif, S.; Zarifi, M.H.; Daneshmand, M. Substrate Choice Impact on Microwave Sensor. In Proceedings of the 2016 17th International Symposium on Antenna Technology and Applied Electromagnetics (ANTEM), Montreal, QC, Canada, 10–13 July 2016; pp. 1–2. [Google Scholar]
- Chen, X.; Fan, W. Ultrasensitive Terahertz Metamaterial Sensor Based on Spoof Surface Plasmon. Sci. Rep. 2017, 7, 2092. [Google Scholar] [CrossRef] [PubMed]
- Shalabney, A.; Abdulhalim, I. Sensitivity-enhancement Methods for Surface Plasmon Sensors. Laser Photonics Rev. 2011, 5, 571–606. [Google Scholar] [CrossRef]
- Cong, L.; Tan, S.; Yahiaoui, R.; Yan, F.; Zhang, W.; Singh, R. Experimental Demonstration of Ultrasensitive Sensing with Terahertz Metamaterial Absorbers: A Comparison with the Metasurfaces. Appl. Phys. Lett. 2015, 106, 031107. [Google Scholar] [CrossRef]
- Chen, M.; Fan, F.; Shen, S.; Wang, X.; Chang, S. Terahertz Ultrathin Film Thickness Sensor below λ/90 Based on Metamaterial. Appl. Opt. 2016, 55, 6471. [Google Scholar] [CrossRef]
- Cheng, D.; Zhang, B.; Liu, G.; Wang, J.; Luo, Y. Terahertz Ultrasensitive Biosensing Metamaterial and Metasurface Based on Spoof Surface Plasmon Polaritons. Int. J. Numer. Model. 2020, 33, e2529. [Google Scholar] [CrossRef]

Disclaimer/Publisher’s Note: The statements, opinions and data contained in all publications are solely those of the individual author(s) and contributor(s) and not of MDPI and/or the editor(s). MDPI and/or the editor(s) disclaim responsibility for any injury to people or property resulting from any ideas, methods, instructions or products referred to in the content. |
© 2024 by the authors. Licensee MDPI, Basel, Switzerland. This article is an open access article distributed under the terms and conditions of the Creative Commons Attribution (CC BY) license (https://creativecommons.org/licenses/by/4.0/).