Article

Enhanced Discrete Wavelet Transform–Non-Local Means for Multimode Fiber Optic Vibration Signal

1
School of Ocean Information Engineering, Jimei University, Xiamen 361021, China
2
School of Marine Equipment and Mechanical Engineering, Jimei University, Xiamen 361021, China
3
Institute for Infocomm Research (I2R), Agency for Science, Technology and Research (A⋆STAR), Singapore 138632, Singapore
*
Authors to whom correspondence should be addressed.
These authors contributed equally to this work.
Photonics 2024, 11(7), 645; https://doi.org/10.3390/photonics11070645
Submission received: 16 May 2024 / Revised: 13 June 2024 / Accepted: 5 July 2024 / Published: 7 July 2024

Abstract

:
Real-time monitoring of heartbeat signals using multimode fiber optic microvibration sensing technology is crucial for diagnosing cardiovascular diseases, but the heartbeat signals are very weak and susceptible to noise interference, leading to inaccurate diagnostic results. In this paper, a combined enhanced discrete wavelet transform (DWT) and non-local mean estimation (NLM) denoising method is proposed to remove noise from heartbeat signals, which adaptively determines the filtering parameters of the DWT-NLM composite method using objective noise reduction quality assessment metrics by denoising different ECG signals from multiple databases with the addition of additive Gaussian white noise (AGW) with different signal-to-noise ratios (SNRs). The noise reduction results are compared with those of NLM, enhanced DWT, and conventional DWT combined with NLM method. The results show that the output SNR of the proposed method is significantly higher than the other methods compared in the range of −5 to 25 dB input SNR. Further, the proposed method is employed for noise reduction of heartbeat signals measured by fiber optic microvibration sensing. It is worth mentioning that the proposed method does not need to obtain the exact noise level, but only the adaptive filtering parameters based on the autocorrelation nature of the denoised signal. This work greatly improves the signal quality of the multimode fiber microvibration sensing system and helps to improve the diagnostic accuracy.

1. Introduction

Cardiovascular disease (CVD) has always been a major health concern, with its global annual mortality rate accounting for approximately one-third of all deaths, and its incidence continues to rise. Although various techniques were adopted to improve the accuracy of CVD diagnosis, such as sensing materials, device technology, sensing systems, and artificial intelligence algorithms, real-time monitoring and denoising of heartbeat signals still play a crucial role in the prevention, diagnosis, and treatment of CVD [1,2,3,4,5,6,7,8,9,10,11,12,13,14,15]. Heartbeat signal acquisition methods can usually be categorized as invasive or non-invasive. Invasive detection requires the use of electrode pads in contact with the human body to collect information [16,17,18], which may lead to skin sensitization in long-term use [19,20]. In contrast, non-invasive detection technologies typically utilize millimeter-wave radar sensors, pressure sensors, and fiber optic sensors [21,22,23,24], which do not need to come into contact with the human body and can solve the allergy problem of invasive sensors. Therefore, it has attracted much attention in the field of heartbeat monitoring. Millimeter-wave radar sensors have the disadvantages of electromagnetic radiation, high manufacturing costs, complex signal processing, and susceptibility to multipath effects. Pressure sensors may be affected by temperature, humidity, electromagnetic fields, and other environmental factors, and in terms of accuracy and long-term stability, there are limitations. Fiber optic sensors are resistant to electromagnetic interference and corrosion and are unaffected by humidity. However, most fiber optic micro vibration sensing systems have their own shortcomings. The external Fabry Perot interferometer (EFPI) pressure sensor based on a diaphragm has high manufacturing process requirements and difficult signal demodulation [21]. Although single crystal SiC pressure sensors have the advantages of low internal stress and high mechanical reliability, their preparation process is complex, the growth cycle is long, and there may be crystal defects that affect their stability [22,23]. The Mach–Zehnder and Michelson interferometers have interference fading issues; the Sagnac interferometer also has the disadvantage of polarization attenuation. In contrast, the multimode fiber optic micro vibration sensing system only uses the fusion of single-mode fiber and multimode fiber, without the disadvantage of interference attenuation, but has high sensitivity and system stability. In addition, this scheme does not require high requirements for laser light sources, detectors, and demodulation schemes, making it easy to manufacture and cost-effective. So, the multimode fiber optic micro vibration sensor has attracted much attention in recent years. However, regardless of the type of monitoring technique used, heartbeat signals are affected by a variety of noises. Numerous noise reduction techniques have been proposed for heartbeat signals [25,26,27,28,29,30,31,32,33,34,35,36,37,38,39], typically categorized into traditional methods and artificial intelligence (AI) methods. Traditional methods offer real-time processing capabilities but struggle to achieve high-quality noise reduction due to challenges in accurately estimating noise levels. On the other hand, AI methods can deliver excellent noise reduction outcomes but may lack real-time performance due to extensive data training requirements. Hence, for meeting the real-time demands of non-invasive heartbeat monitoring, traditional denoising methods are preferred. However, each traditional denoising method has its limitations. For instance, while wavelet methods offer advantages such as multi-scale analysis, sparsity, and efficiency, they often face difficulties in obtaining precise thresholds and adaptive threshold functions [40,41,42]. Non-local means (NLM) can address edge preservation issues in image denoising, effectively eliminating noise while maintaining the integrity of electrocardiogram signals. However, due to sparse patch effects in high-frequency regions [43], NLM may struggle to remove noise effectively in the high-frequency region of the QRS complex. Empirical mode decomposition (EMD) encounters challenges like mode mixing and a lack of rigorous mathematical modeling [44]. Although ensemble EMD (EEMD) resolves mode mixing by introducing white noise, practical applications may encounter stability and accuracy issues [45]. Complementary EEMD (CEEMD) enhances noise trajectory based on EEMD but still necessitates careful selection of noise levels [46]. Variational mode decomposition (VMD) combines EMD and EEMD advantages, offering robust time-domain analysis through non-recursive decomposition of quasi-orthogonal intrinsic mode functions (IMFs) [47]. However, VMD’s denoising outcomes are heavily influenced by parameter settings such as mode numbers, penalty coefficients, and convergence tolerance. Despite extensive efforts to enhance denoising methods, individual denoising method limitations persist. Presently, combining multiple methods is a common approach to address these limitations [48,49,50,51,52,53]. Notably, discrete wavelet transform (DWT) methods can effectively eliminate high-frequency noise by selecting suitable wavelet thresholds based on signal characteristics, albeit requiring more decomposition layers to remove low-frequency noise [54,55]. Conversely, NLM-based denoising methods [56,57,58] leverage significant non-local similarity to remove low-frequency noise from ECG signals while preserving signal contours and avoiding excessive smoothing, yet they may struggle to remove high-frequency signals near the QRS complex. Therefore, the literature [59] exploits the complementary advantages of DWT and NLM methods to address their respective shortcomings in denoising high and low-frequency ECG signals, ultimately enhancing the signal-to-noise ratio (SNR). However, whether employing individual or combined denoising methods, their performance heavily relies on filtering parameter selection [60]. Traditionally, filtering parameters are determined by noise levels that are challenging to accurately ascertain in practice, thus limiting the denoising efficacy of NLM and DWT composite methods. Although we have obtained precise wavelet thresholds [42] and optimal wavelet decomposition layers [61] without the need for clean signals or precise noise information, the optimal filtering parameters of NLM have not yet been explored, let alone the DWT-NLM composite method.
This paper introduces the use of an objective metric to assess denoising quality and determine appropriate NLM filtering parameters. The optimal filtering parameters are identified by continuously adjusting between very large and very small preset values. Therefore, an enhanced DWT-NLM method is obtained for the first time. This study first presents the principle of a multimode fiber vibration sensing system, the composite approach of combining DWT and NLM methods, and the evaluation index for denoising quality. Subsequently, real ECG data contaminated with additive Gaussian white (AGW) noise are processed using the improved DWT and NLM composite method. The denoising outcomes are compared with those obtained using individual DWT and NLM methods, as well as the conventional DWT and NLM composite method, to validate the effectiveness of the proposed enhanced composite method. Finally, the enhanced composite method is applied to measured signals of a multimode fiber micro vibration sensing system and compared visually with other denoising techniques. Finally, this paper discusses and analyzes the strengths and limitations of the proposed method, along with its potential applications.

2. Principle

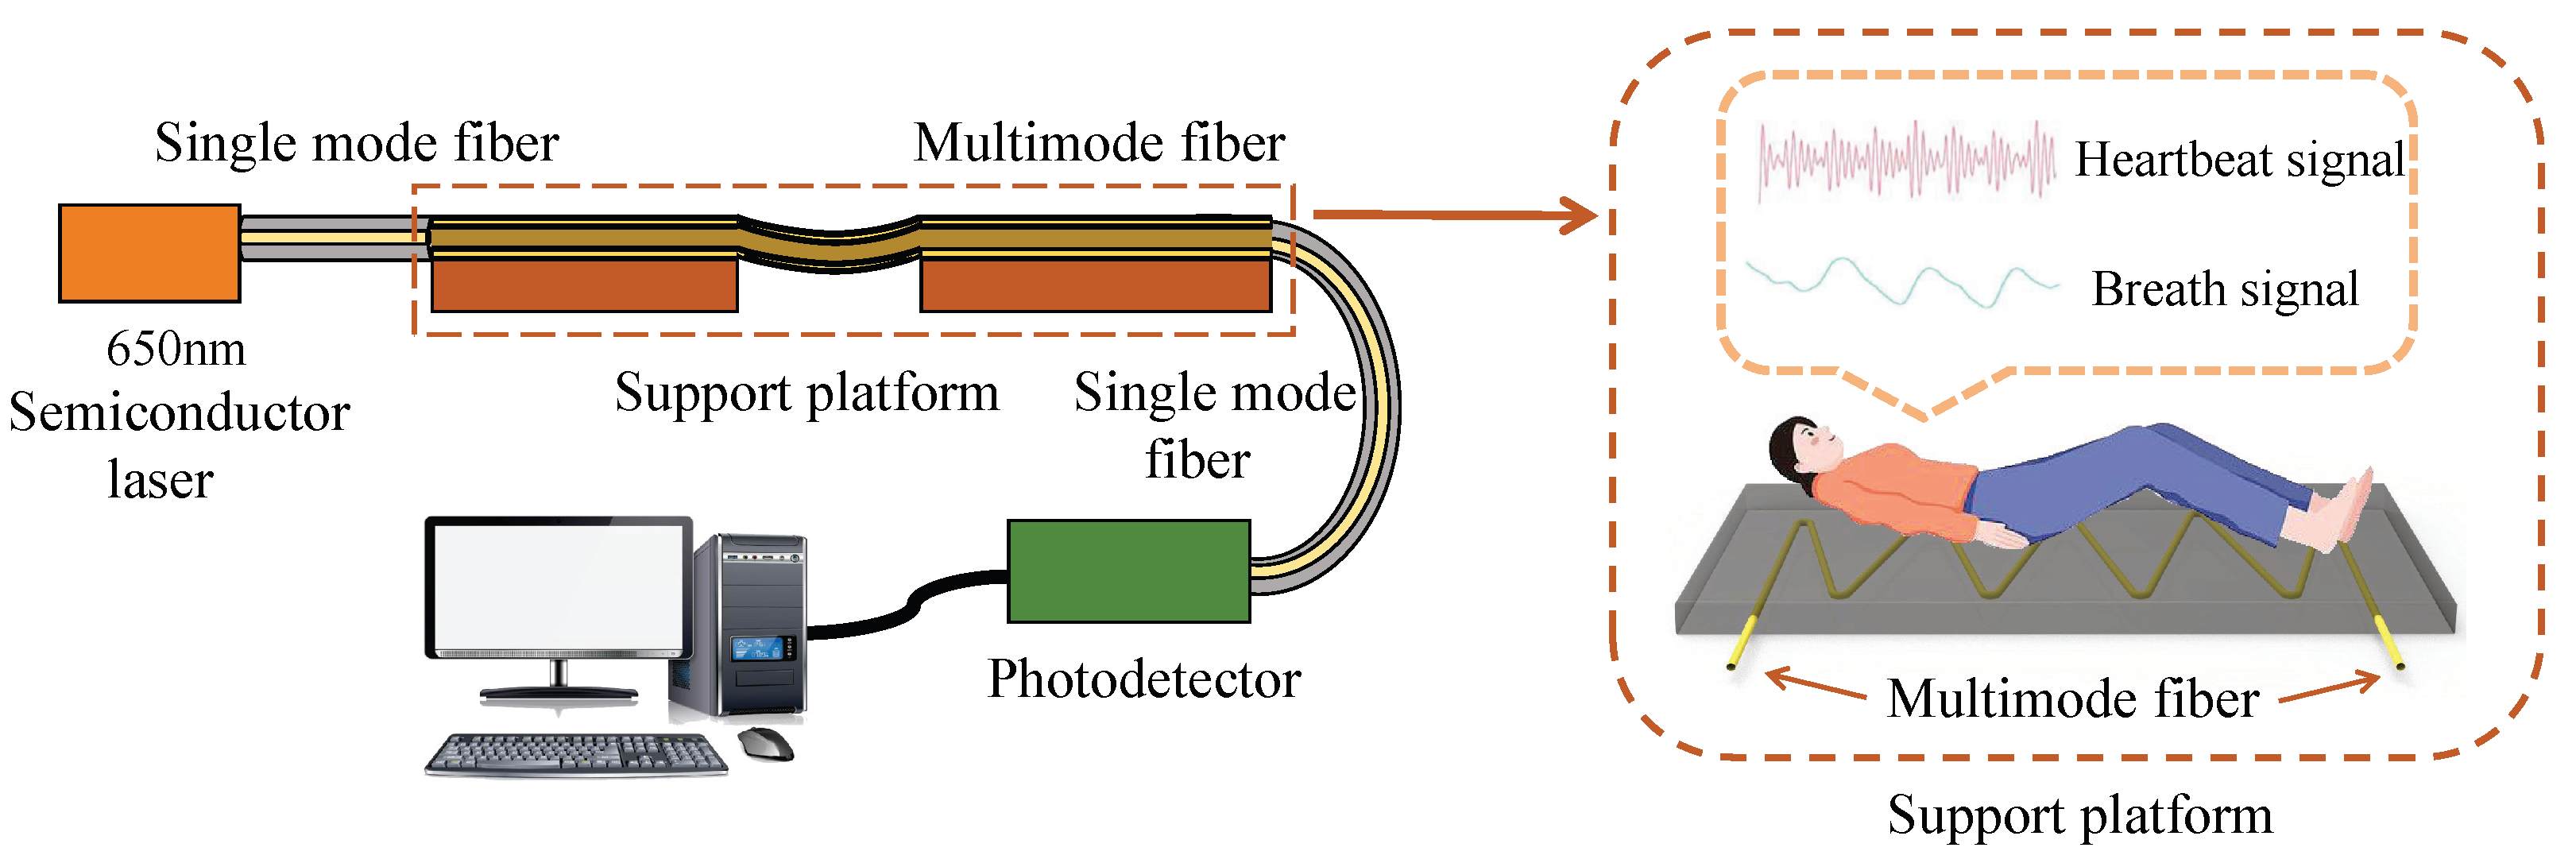
2.1. Fiber Optic Vibration Sensor

The principle of the multimode fiber optic microvibration sensing system used for heartbeat monitoring experiments is depicted in Figure 1. A 1-meter-long step-index multimode fiber (MMF) with a core diameter of 50 µm and a cladding diameter of 125 µm is seamlessly connected at both ends to a single-mode fiber (SMF) with a core diameter of 9 µm and a cladding diameter of 125 µm. The fabrication of the fiber structure is meticulously carried out utilizing a commercial fusion splicer [62]. A laser operating at a wavelength of 650 nm is launched into the MMF through one SMF, stimulating higher-order modes within the fiber. A healthy adult female subject aged 55 years, weighing 49 kg, lies supine in a relaxed state and undergoes 10 min of heartbeat monitoring. During the test, the subject’s heartbeat deforms the MMF, which in turn causes changes in the light intensity distribution across the cross-section of the MMF [63]. The altered light intensity is coupled into the SMF on the opposite end of MMF and detected by a photodetector with a sampling rate of 2048. The resulting weak photoelectric current undergoes amplification and analog-to-digital conversion and is transmitted to a computer for further processing. While the MMF optic micro-vibration sensing system is sufficiently sensitive to detect human heartbeat, it is vulnerable to disturbances like light source intensity fluctuations, phase noise, fiber optic transmission losses, photodetector thermal noise, and environmental interference [64]. Hence, effective noise mitigation measures are essential before utilizing the system for cardiovascular disease diagnosis to enhance its reliability and sensitivity.

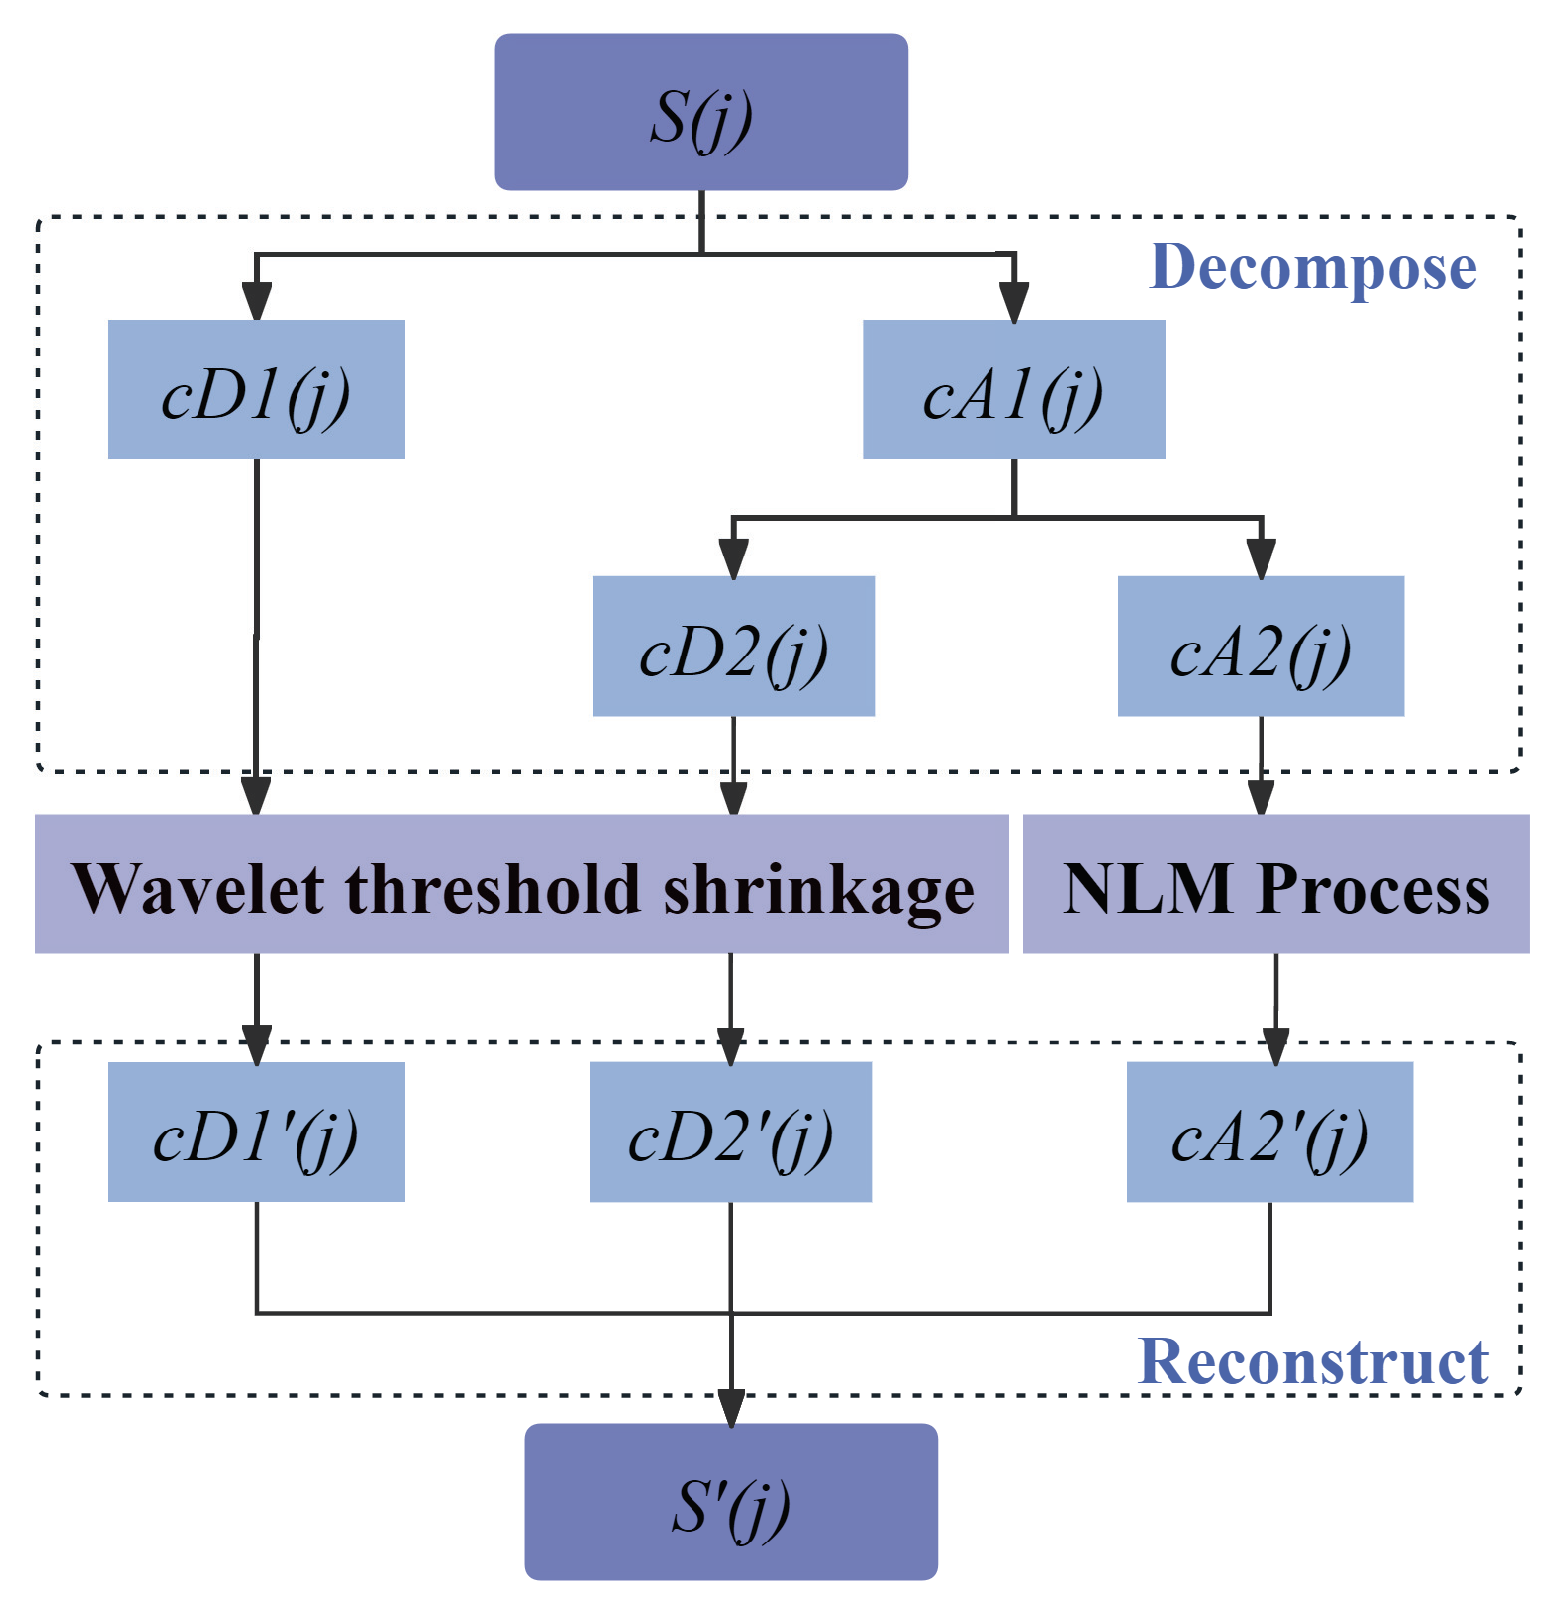
2.2. Enhanced DWT-NLM Composite Method

The enhanced DWT-NLM composite method, illustrated in Figure 2, involves decomposing a noisy heartbeat signal S ( j ) into detail coefficients c D 1 ( j ) , c D 2 ( j ) at two scales and approximation coefficients c A 2 ( j ) . High-frequency noise primarily resides in the wavelet detail coefficients of the first and second layers, while low-frequency noise is present in the wavelet approximation coefficients. Leveraging the strengths of DWT and NLM, the detail and approximation coefficients undergo wavelet threshold shrinkage and NLM processing, respectively, resulting in the denoised signal S ( j ) .
In wavelet threshold shrinkage, selecting appropriate thresholds and threshold function is crucial. Thresholding distinguishes signal components from noise by retaining significant wavelet coefficients and shrinking or zeroing noisy coefficients. For instance, the VisuShrink thresholding method employs a threshold λ calculated as
λ = σ 2 log ( n ) ,
where n is the number of wavelet coefficients and σ is the noise standard deviation. However, accurately determining noise in practice is challenging, impacting denoising outcomes. Commonly used threshold functions include hard H ( c D ) and S ( c D ) soft threshold functions.
H ( c D ) = c D , i f | c D | λ , 0 , i f | c D | < λ ;
S ( c D ) = sign ( c D ) ( | c D | λ ) , i f | c D | λ , 0 , i f | c D | < λ ,
where c D are the wavelet detail coefficients, and sign ( * ) is the sign function. The hard thresholding function directly sets coefficients below the threshold to zero, leading to a pseudo-Gibbs phenomenon from data discontinuities. On the other hand, the soft threshold function subtracts coefficients higher than the threshold to maintain coefficient continuity, albeit introducing a constant deviation. To address these issues concurrently, we propose the improved threshold function, as shown in Equation (4),
I ( c A ) = sign ( c D ) · c D 2 · tanh α · c D λ + 1 ,
where α makes it possible to obtain a suitable threshold function according to the signal characteristics, so it combines the benefits of hard and soft threshold functions with good asymptotic behavior and continuity. Additionally, the number of wavelet decomposition layers significantly influences denoising results and can be determined based on the method noise probability density function and a Gaussian distribution [61].
The NLM principle, depicted in Figure 3, involves estimating u ^ s as a weighted sum of values within a “search neighbourhood” N ( s ) that are similar to the data block at s [65].
u ^ s = t N ( s ) ω s , t v t t N ( s ) ω s , t ,
where ω s , t are
ω s , t = exp b Δ v s + b v t + b 2 2 L Δ λ 2 = exp d 2 ( s , t ) 2 L Δ λ 2 ,
where λ is a bandwidth parameter, Δ states a local patch of samples surrounding s, containing L Δ samples; a patch of the same shape also surrounds t. d 2 denotes the sum of the squares of the point-by-point differences between two patch samples centered on s and t, respectively. Thus, the weight ω s , t is computed based on the similarity between data blocks, with key parameters including the neighborhood half-width M, patch half-width P, and bandwidth λ . Among these, λ plays a crucial role in controlling the smoothing quantity parameter in NLM. In conclusion, the denoising effectiveness of any method heavily relies on the selection of filter parameters. Unfortunately, most parameters are dependent on noise levels that are challenging to accurately determine in practical scenarios.

2.3. Objective Evaluation Metric

The proposed objective metric for evaluating signal denoising quality focuses on the non-zero periodic peaks (NZOPPs) of the autocorrelation function [42,60,66], which takes full advantage of the correlation of the signal and the non-correlation of noise [67]. The metric is based on the autocorrelation properties of the signal rather than relying on noise levels that are difficult to determine accurately [60]. Therefore, it is different from traditional evaluation methods such as SNR and root mean square error (RMSE),
SNR = 10 log 10 n = 1 N u 2 ( n ) n = 1 N [ u ^ ( n ) u ( n ) ] 2 ,
RMSE = n = 1 N [ u ^ ( n ) u ( n ) ] 2 N ,
where N denotes the signal length, u ( n ) is the original ECG signal. u ^ ( n ) is the estimated ECG signal. The metric is based on the autocorrelation properties of the signal rather than on noise levels that cannot actually be accurately obtained. Thus, more accurate DWT filter parameters can be obtained, which improves denoising [42]. The optimization process involves determining the optimal parameters for NLM as well, as depicted in the flowchart in Figure 4.
Initially, the neighborhood radius M is set to 3 and the patch radius P to 800. The algorithm traverses through different values of λ to identify the maximum value of the objective evaluation metric, indicating the optimal λ . Subsequently, with the optimal λ and patch radius P fixed at 800, the algorithm varies the M value to maximize the metric, thereby determining the optimal M value. Similarly, the optimal value for P is then obtained. By optimizing all filter parameters in the enhanced DWT-NLM composite method, it is refined to achieve superior denoising performance.

3. Numerical Experiment

To demonstrate the proposed enhanced DWT-NLM method, we first establish its effectiveness by applying the pre-proposed NZOPP metrics [42] and comparing it with the SNR. Subsequently, we verify the performance of the enhanced DWT-NLM by comparing denoising results with traditional DWT-NLM, DWT, and NLM methods using various types of ECG signals from diverse databases. Finally, the efficacy of the enhanced DWT-NLM is demonstrated through the denoising of experimentally measured heartbeat signals in multimode fiber. Several ECG signals were obtained from different databases, including 109 and 233 ECG signals from the MIT-BIH arrhythmia database [68]; cu07, and cu11 from the Creighton University Ventricular Tachycardia Database [69]; s0016lrem and s0026lrem from the Physionet PTB diagnostic cardiology database [70]; synthetic ECG signals from the PhysioNet Long-Term ST database [71].
In the denoising processing, we utilized the wavelet base ’db3’ for a second-level wavelet second-level decomposition, separating the signal into detail coefficients containing high-frequency components and approximation coefficients containing low-frequency components. Subsequently, we applied accurate wavelet thresholds [42] and a modified thresholding function to the detail coefficients c D 1 and c D 2 to eliminate noise while preserving the ECG signal’s detail components. Meanwhile, we optimized the filtering parameters of the NLM for noise reduction of the approximation coefficients c A 2 using an objective evaluation metric [41]. The methodology was developed and assessed in MATLAB R2023a on a 64-bit Windows 11 operating system, running on a 1.19 GHz Intel processor with 16 GB of RAM.

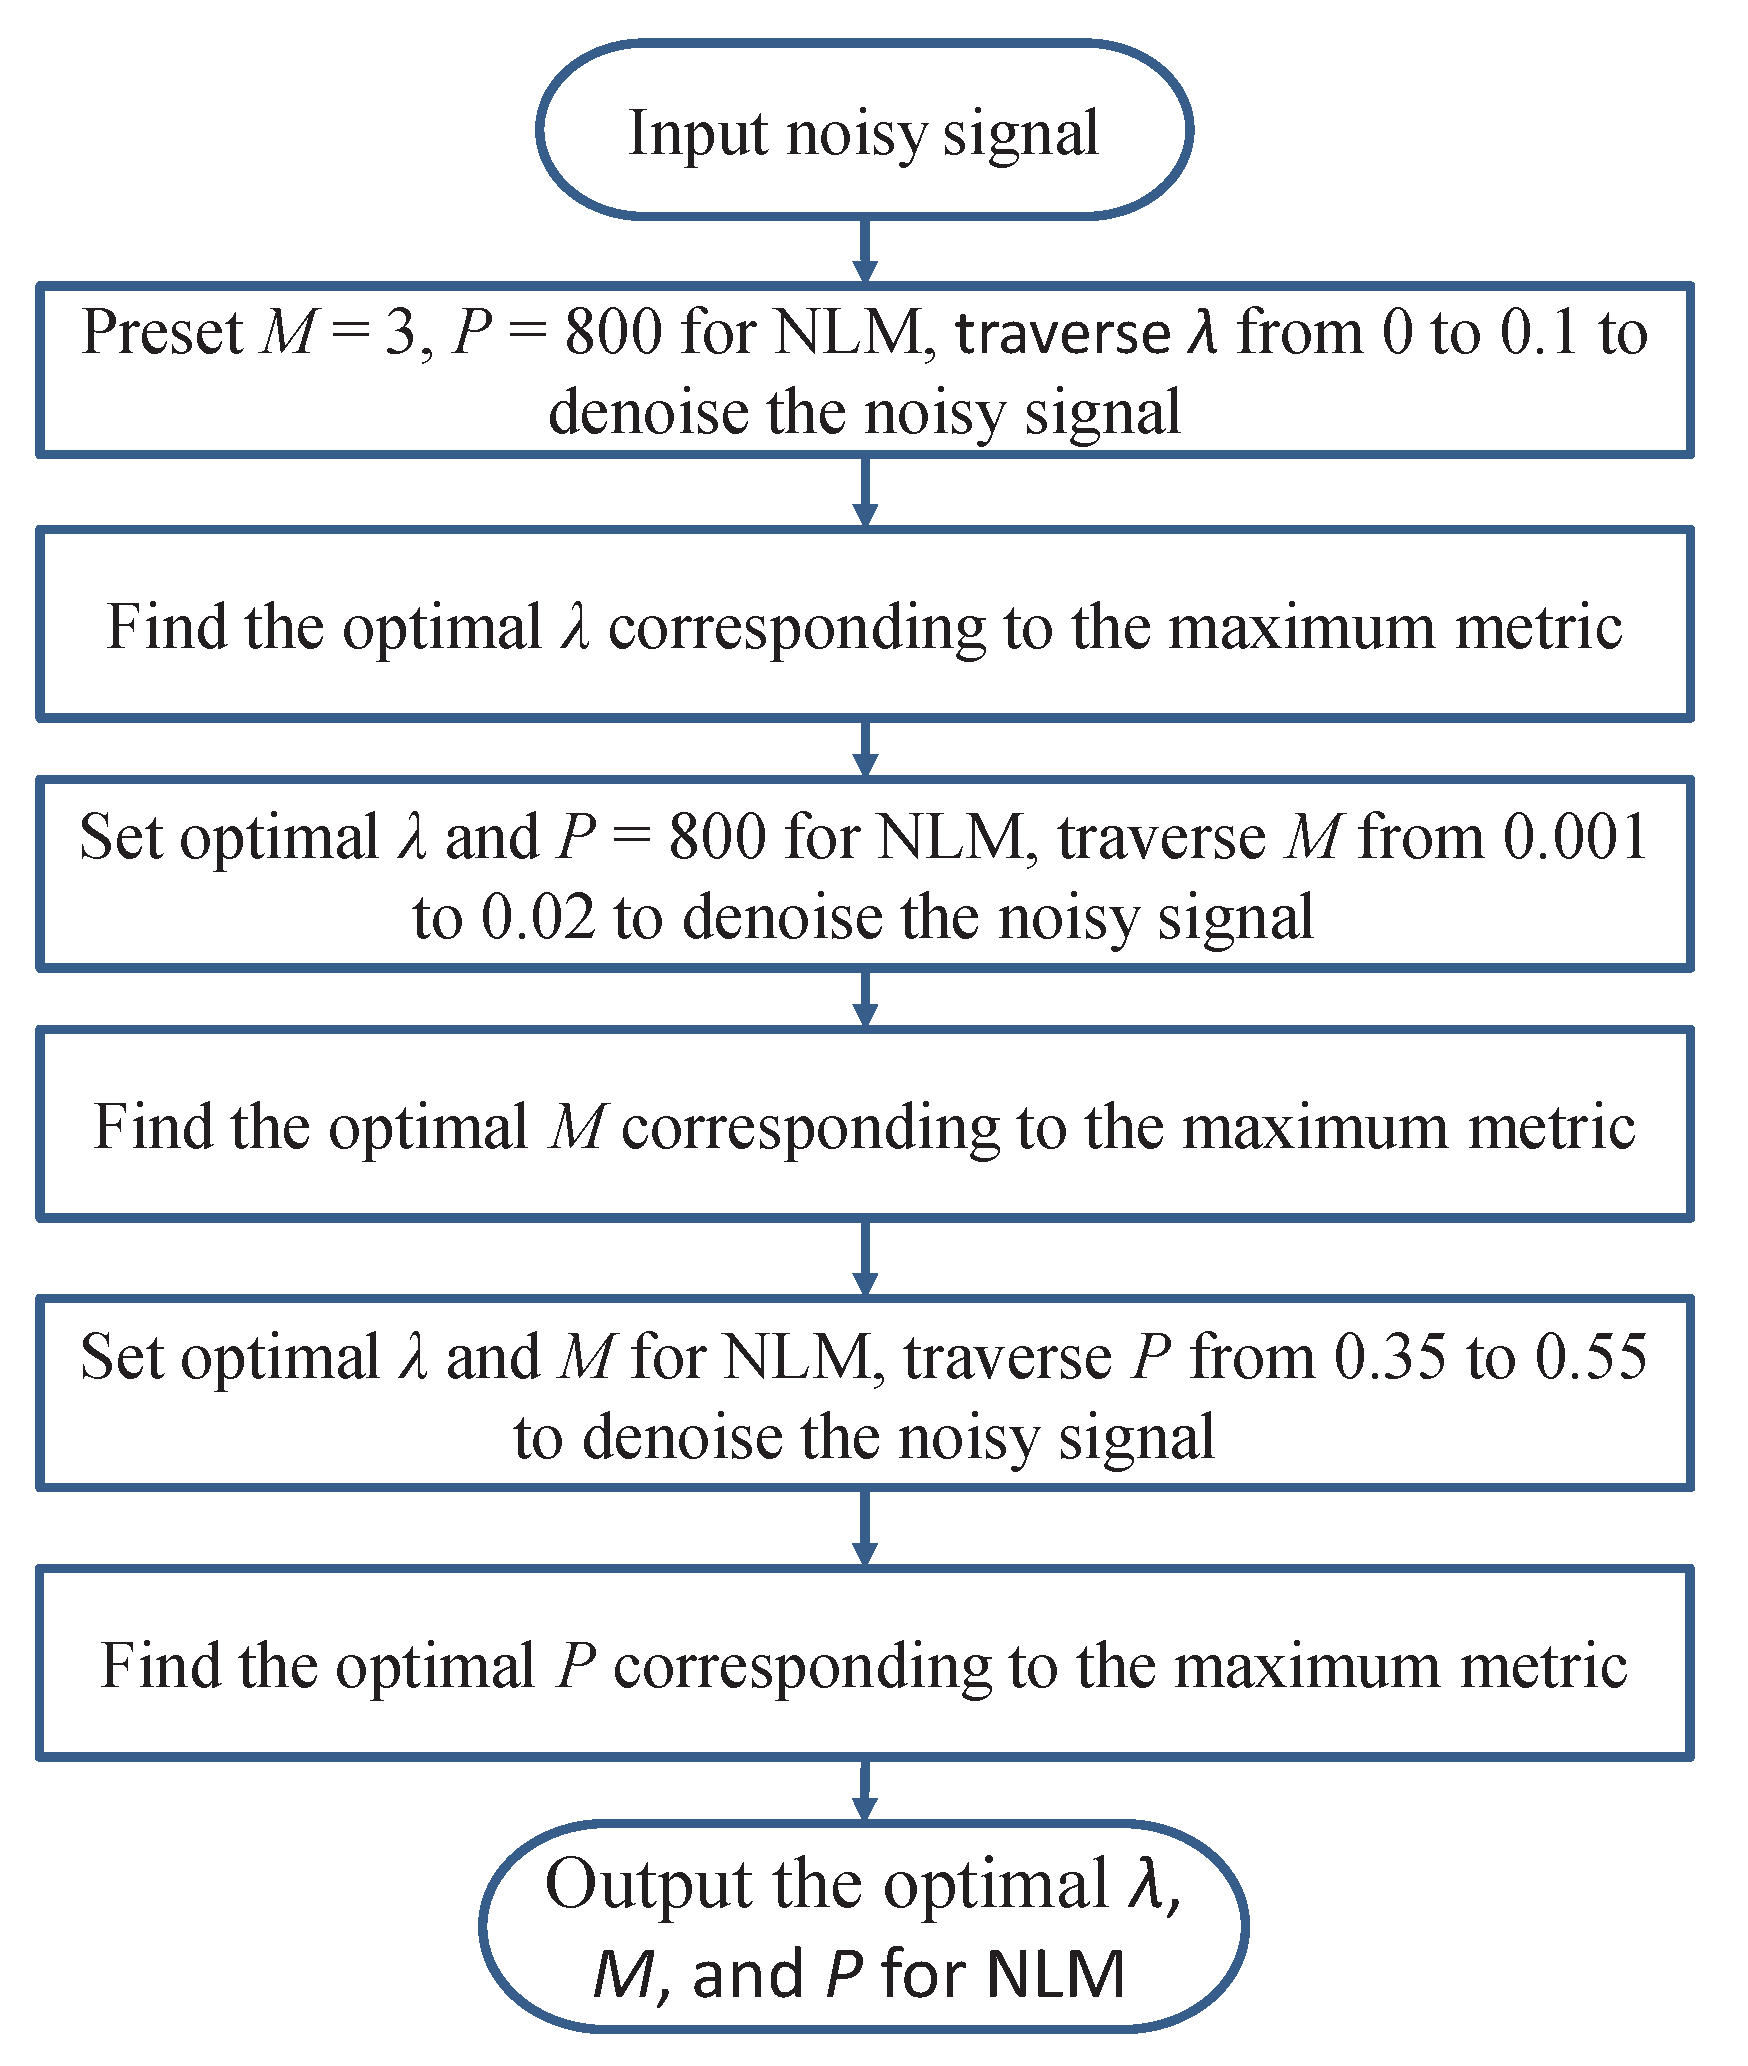
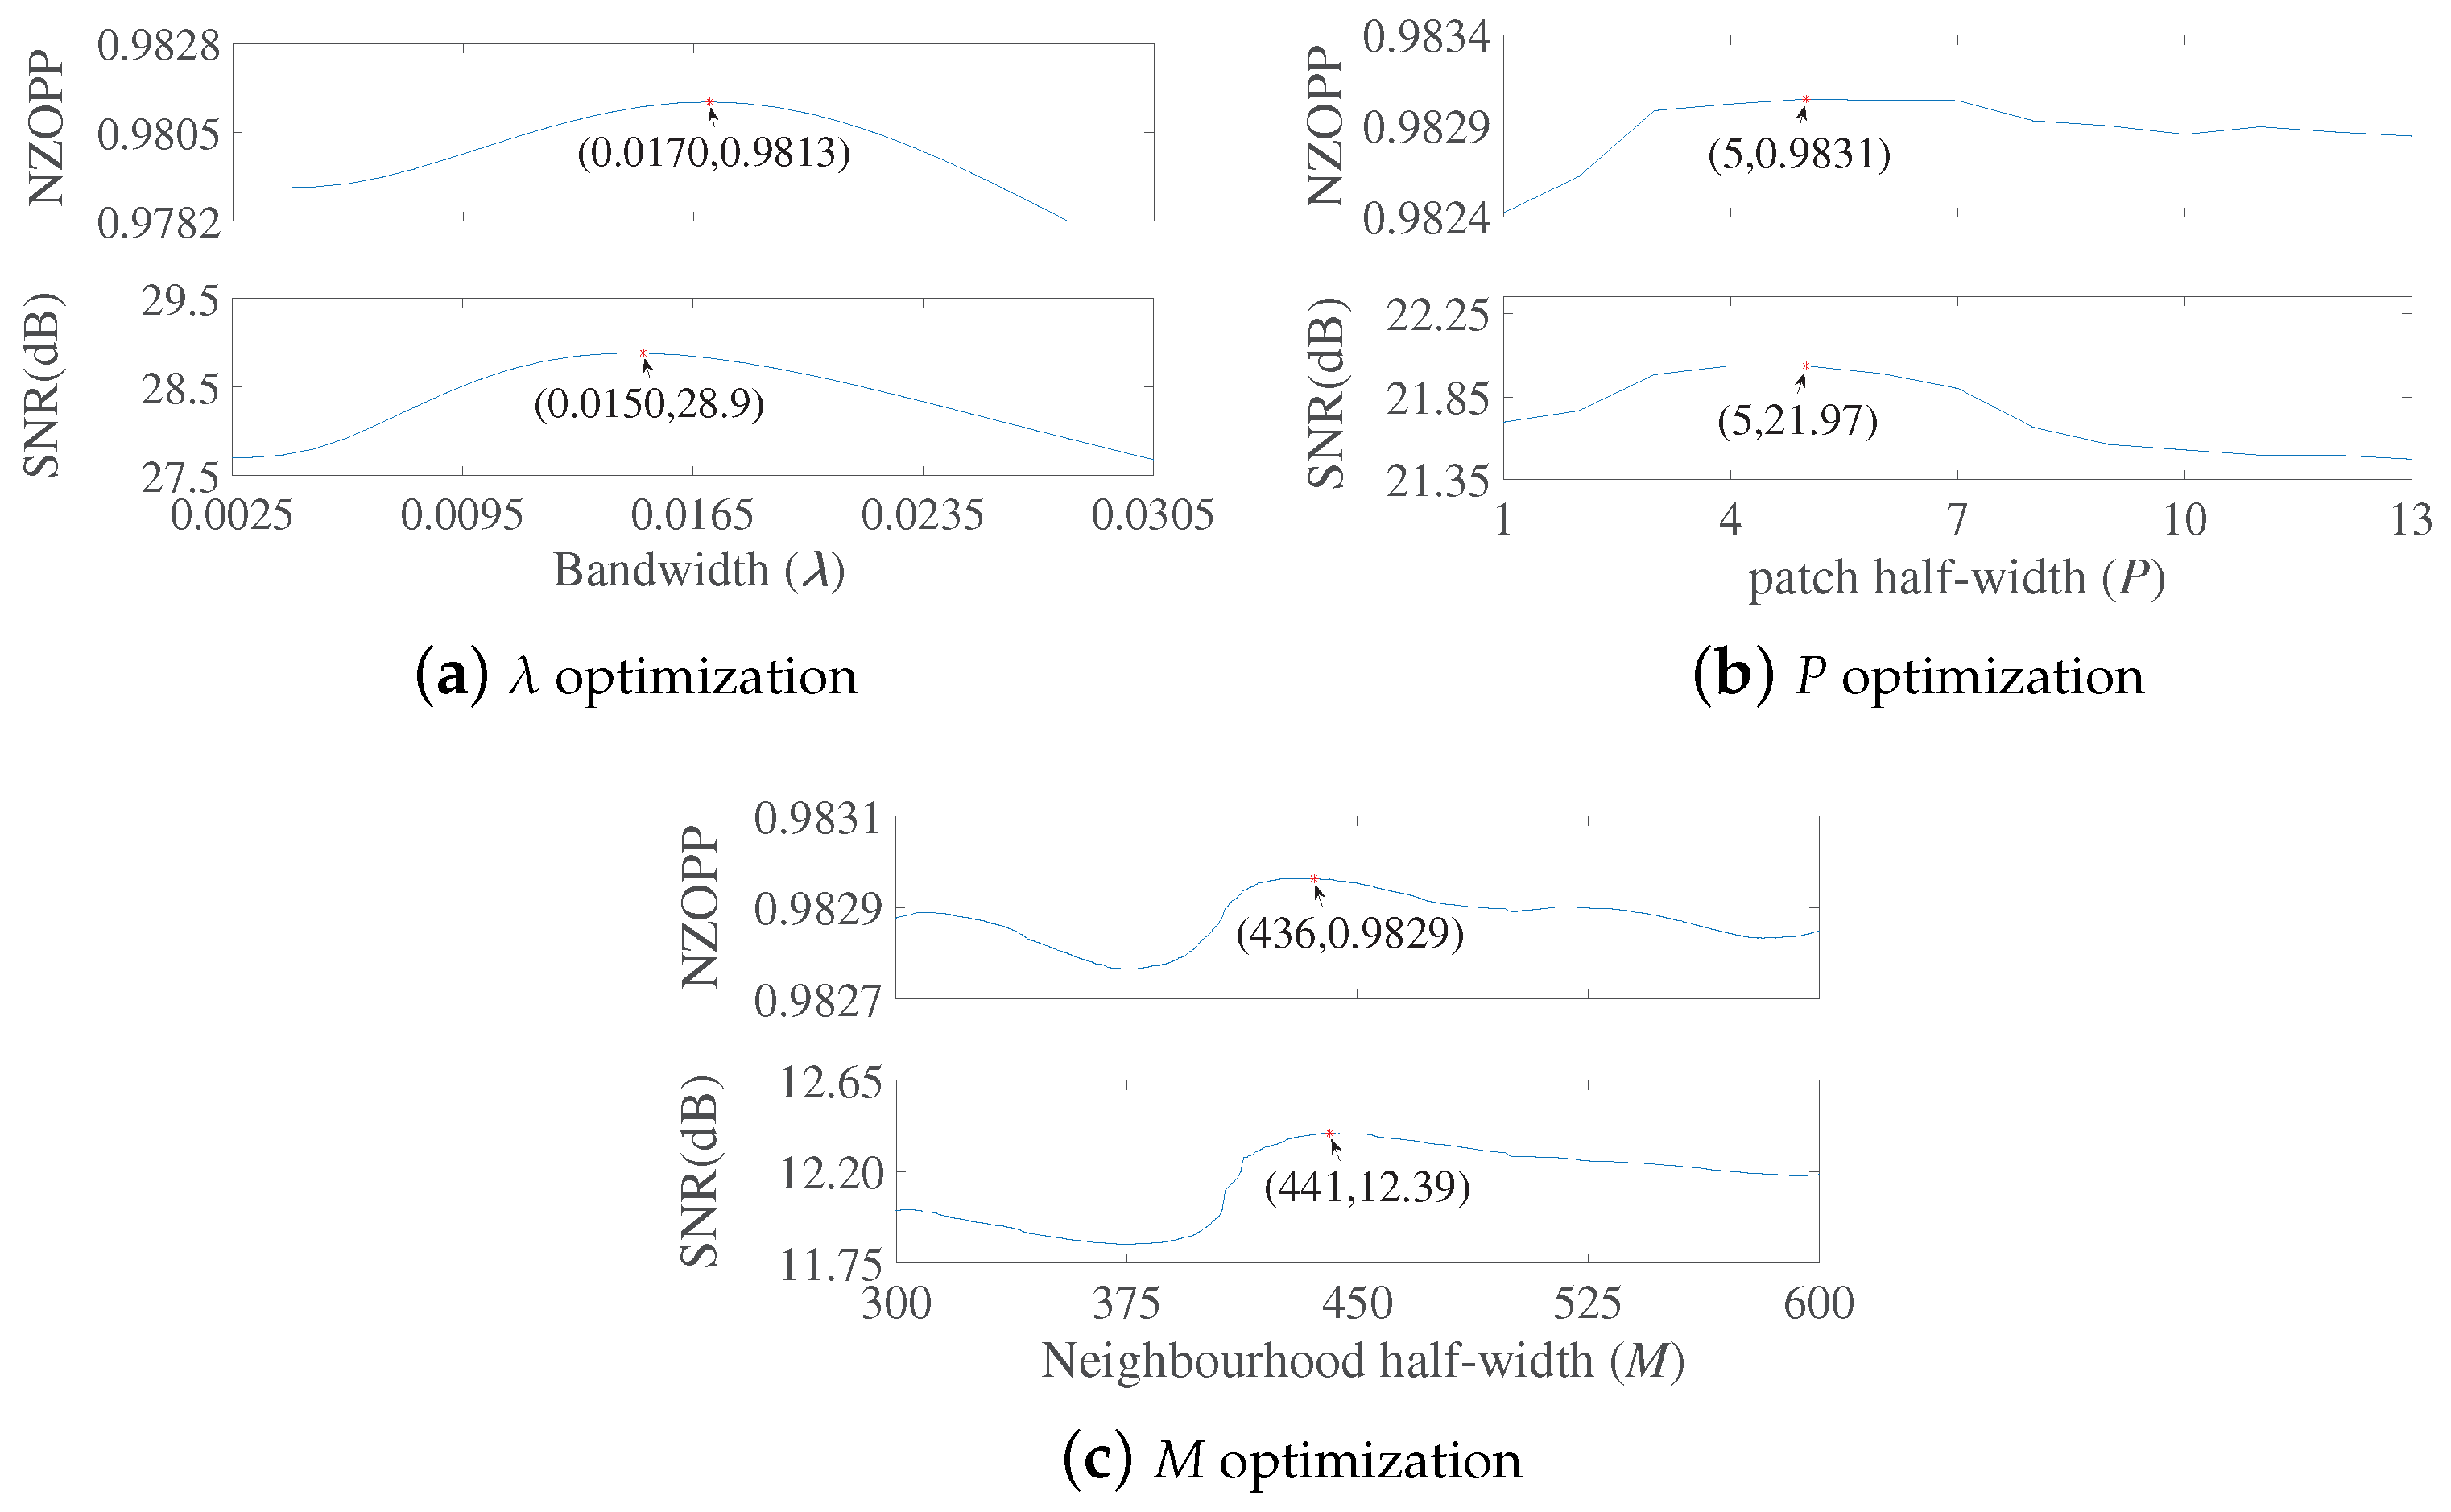
3.1. Optimizing NLM Parameter with Objective Evaluation Metric

To validate the optimization of the NLM parameter algorithm based on the objective assessment metric, it is compared with the SNR, as illustrated in Figure 5. Since the objective metric can serve as an alternative to SNR for evaluating denoised signal quality, the NLM parameters yielding the maximum objective metric should be similar or identical to those producing the maximum SNR.
Assuming a block radius of 3 and a neighborhood radius of 800, denoising of the 109 ECG signal is attempted with a bandwidth parameter ranging from 0.001 to 1 in steps of 0.001. The lower plot in Figure 5a shows that the SNR is maximum (28.9) for a bandwidth parameter of 0.0150. The upper plot in Figure 5a indicates the maximum objective metric (0.9813) for a bandwidth parameter of 0.0170. It evident that the optimal bandwidth parameter obtained from the objective denoising evaluation metric closely aligns with the optimal bandwidth parameter derived from the conventional SNR. Similarly, with the optimal bandwidth parameter set to 0.017 and assuming a neighborhood radius of 800, attempts are made to denoise the 109 ECG signal with a block radius ranging from 1 to 30 in steps of 1. The optimal neighborhood radius obtained in both plots of Figure 5b is consistent at 5. Subsequently, utilizing the obtained optimal bandwidth of 0.0170 with a block radius of 5, denoising of the 109 ECG signal is performed with a neighborhood radius varying from 300 to 600 in steps of 1. Figure 5c demonstrates that the optimal neighborhood radius obtained from both evaluation metrics is similar, with values of 436 and 441, respectively. This suggests that the objective denoising evaluation metric can effectively determine the most suitable NLM filtering parameters.

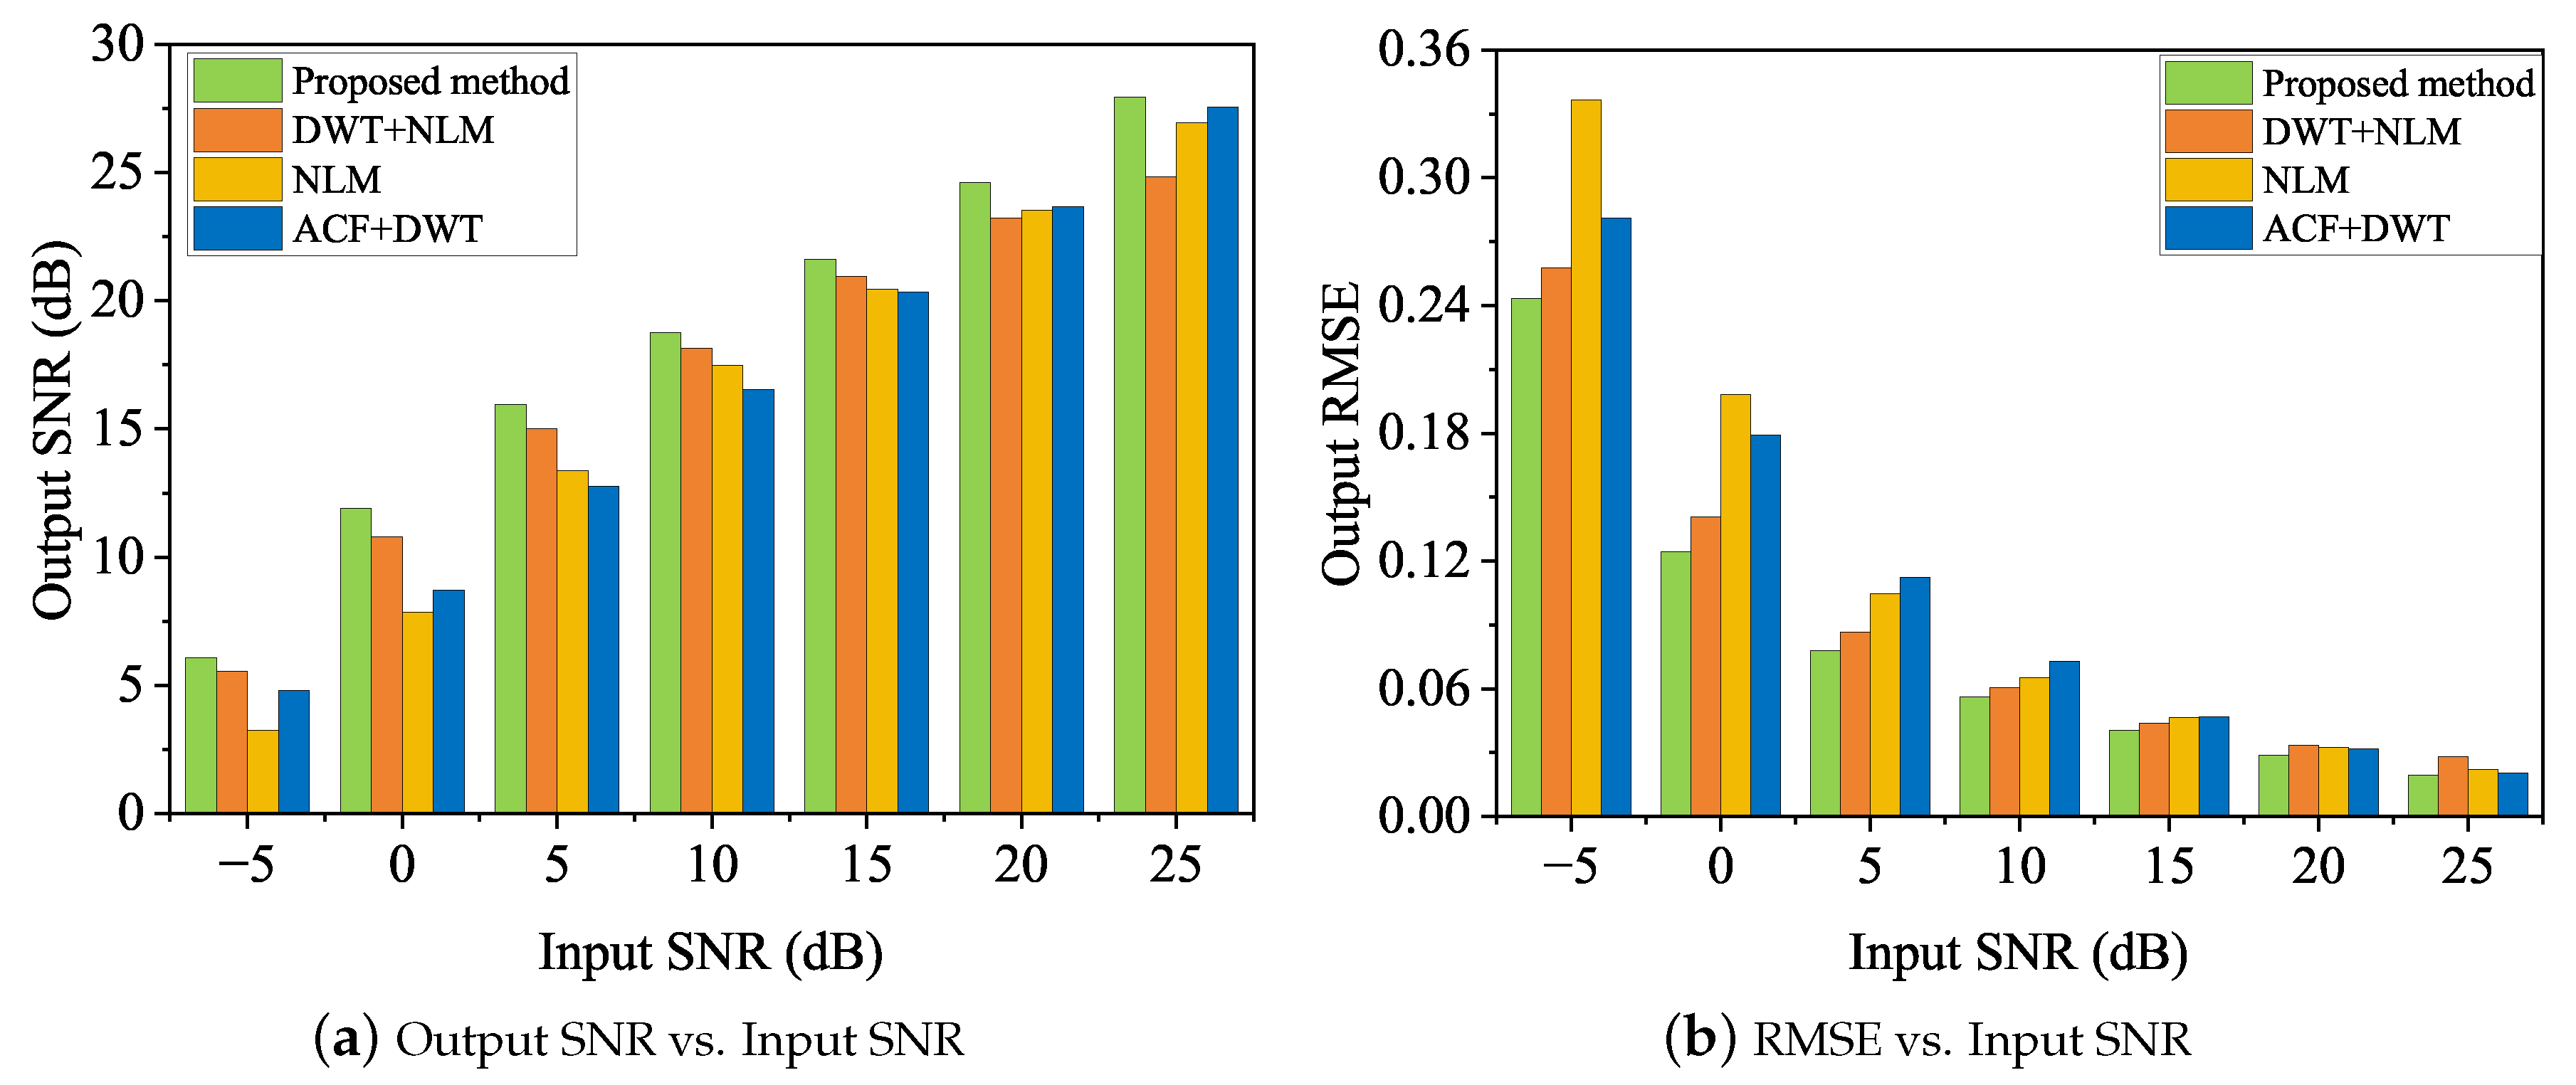
3.2. Mimic Heartbeat Signal with AGW Noise

To validate the effectiveness of the enhanced DWT-NLM composite method, we applied it to denoise multiple ECG signals corrupted by AGW noise ranging from −5 to 25 dB. We compared the denoising results with popular existing denoising methods such as NLM, DWT-NLM composite method, and recent improved DWT [42]. The noise reduction performance of difference denosing methods for various types of ECG signals under −5∼25 dB AGW noise interference is summarized in Table 1. The results show that, in most cases, the proposed method outperforms other denoising methods in terms of output SNR and RMSE, with optimal results highlighted in bold. Only in a few cases the output SNR of the proposed is slightly lower and the RMSE is slightly higher, within an acceptable error range of 0.05 dB. This can be attributed to the objective denoising quality assessment metric used for parameter optimization based on signal characteristics rather than relying on conventional noise variance estimation, which may not be accurate. The NLM method leverages denoiising in the low-frequency region, while the enhanced DWT-NLM composite method overcomes the rarefied patch effect in the high-frequency region to achieve accurate denoising in the QRS region.
To visually compare the denoising performance of different methods on the cu07 ECG signal corrupted by AGW noise ranging from −5 to 25 dB, the data in Table 1 are represented in a histogram in Figure 6. It evident that the output SNR achieved by the proposed DWT-NLM method surpasses that of other existing methods, while the RMSE is notably lower across different input SNR levels. Notably, the conventional DWT-NLM method may be inferior to the NLM and the improved DWT methods under higher AGW noise levels of 20–25 dB, whereas the enhanced DWT-NLM method significantly outperforms the conventional DWT-NLM method and excels over NLM and improved DWT methods.
To showcase the effectiveness of the proposed method across different ECG signals, we plotted the enhancement of output SNR for each method listed in Table 1 when denoising ECG signals are corrupted with AGW noise at an input SNR of 10 dB in Figure 7. The results indicate that the output SNRs of the proposed methods surpass those of the compared methods, while the output RMSE values are lower, particularly for the cu11 ECG signal.

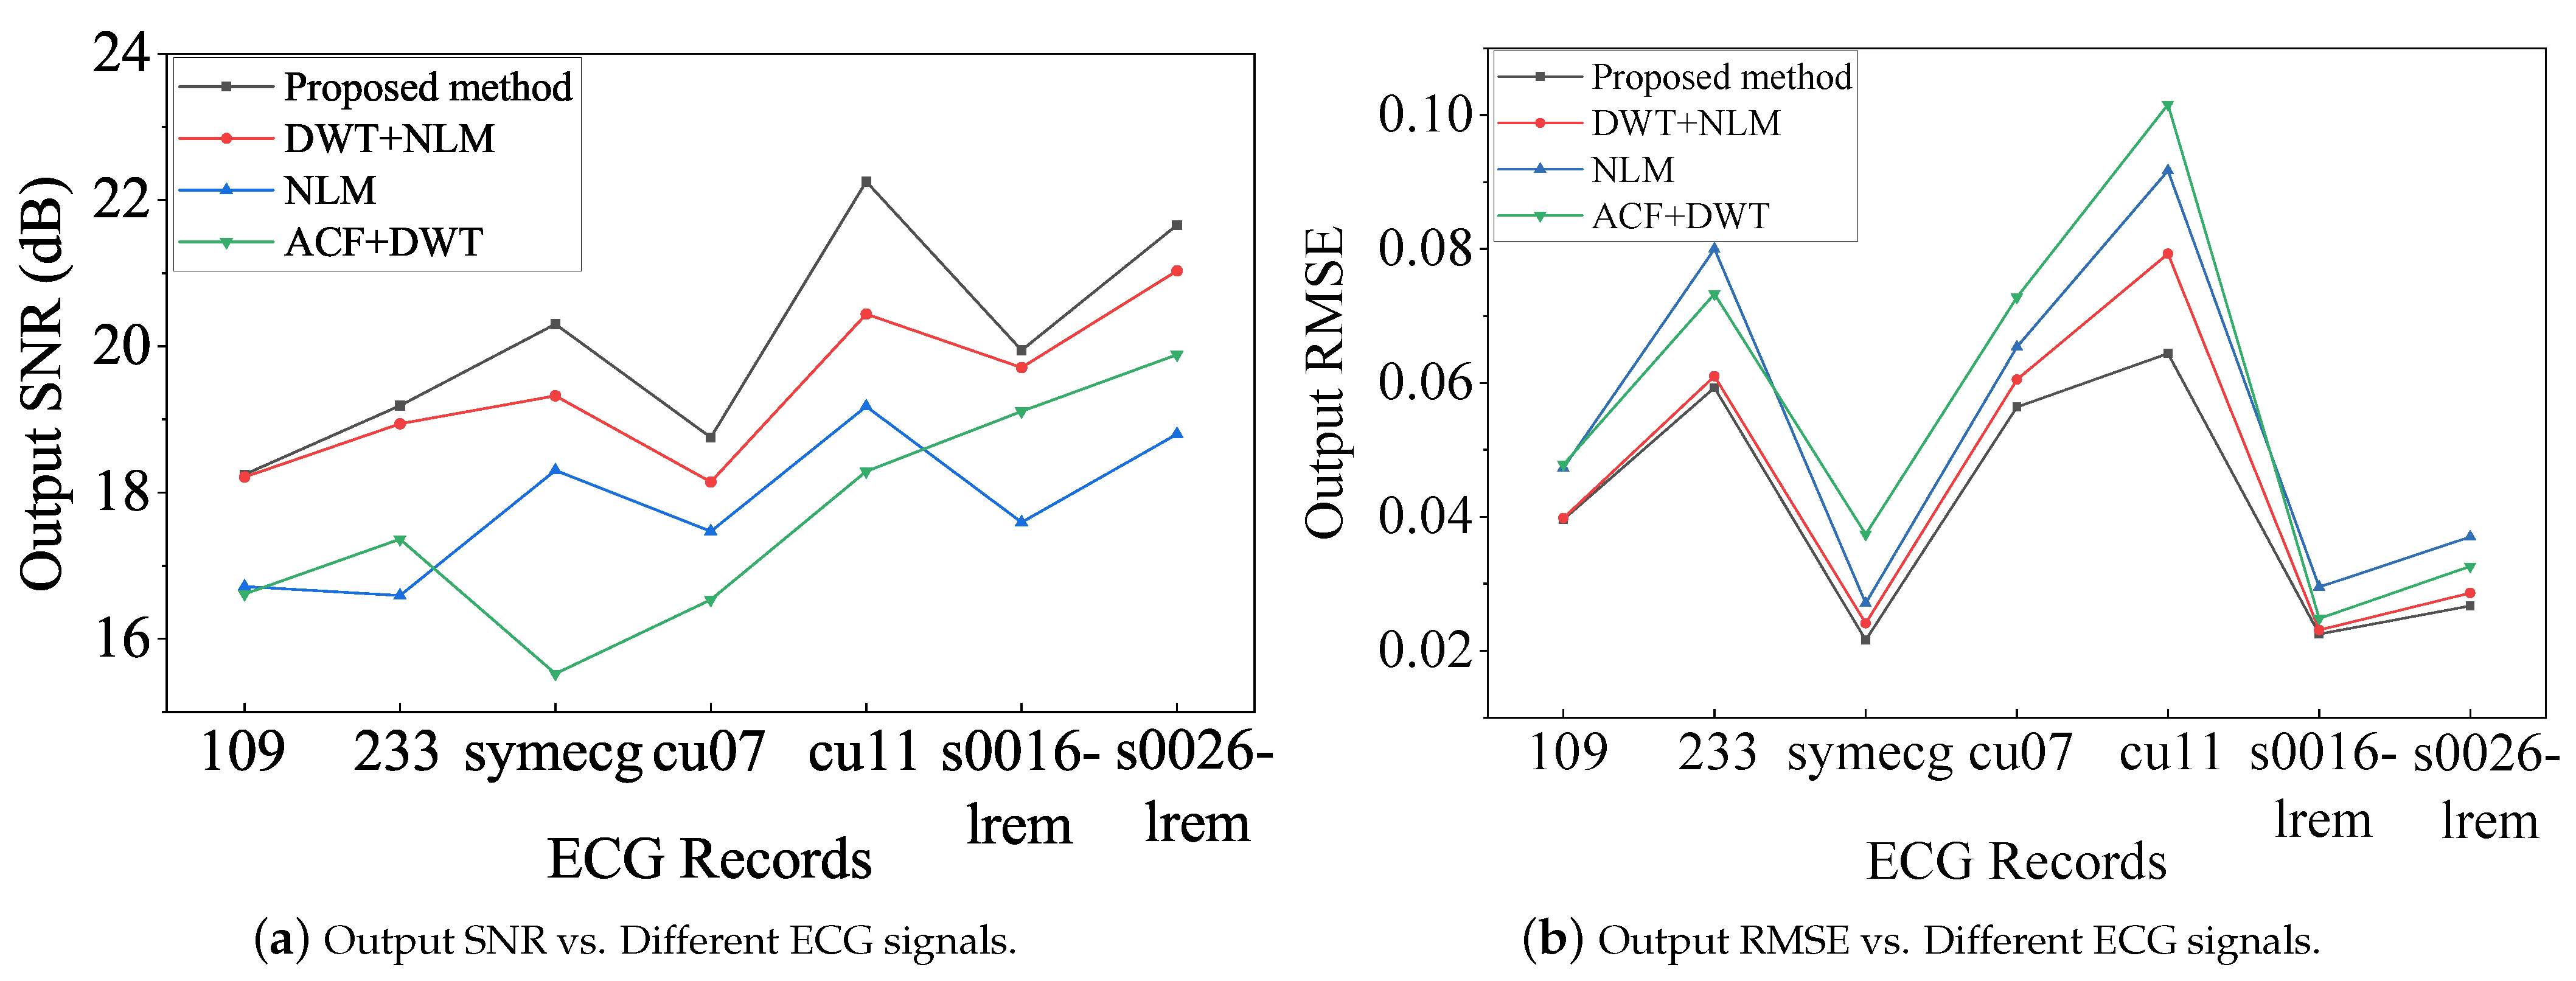
3.3. Measured Heartbeat Signals from Fiber Optic Vibration Sensors

In order to further validate the practicality of the proposed algorithm, we conducted experiments on heartbeat monitoring of a multimode fiber optic microvibration system and denoised the recorded heartbeat signals. Since there is no clean signal for reference and the noise level cannot be accurately assessed, we visually compare the noise reduction results of various denoising methods on the measured heartbeat signals, as illustrated in Figure 8. Figure 8a presents the measured 10 s heartbeat signal, while Figure 8b–e display the denoising results using different techniques. In Figure 8b, the proposed method exhibits the largest reduction curve with minimal signal distortion compared to the original signal in Figure 8a. Conversely, the noise reduction curves of the conventional DWT-NLM and NLM methods in Figure 8c,d show noticeable noise residuals due to reliance on noise deviation for parameter selection, which may not be accurately measurable. While the noise reduction curve of the improved DWT method is superior to those of DWT-NLM and NLM methods, it still falls short of the enhanced DWT-NLM method. This observation is further corroborated by examining the local details of the noise reduction curves, specifically within the red dashed squares shown in the inset of Figure 8. It is clear that the method proposed in this paper produces the cleanest and most precise denoising curves among all the compared methods. It significantly enhances the denoising effect of the traditional DWT-NLM method and surpasses the performance of the NLM method, as well as the improved thresholding DWT method we recently proposed [42]. Therefore, the proposed method not only maximizes the noise suppression but also effectively preserves the signal components, offering superior denoising performance compared to other methods.

4. Discussion

The proposed enhanced DWT-NLM method combines the advantages of DWT and NLM in handling high and low-frequency noise separately, avoiding the shortcomings of DWT in deteriorating low-frequency components and NLM in sparse speckle effects. However, the filtering parameters significantly impact the denoising results regardless of the type of filter used. Traditional denoising quality assessment metrics like SNR and RMSE require knowledge of the clean signal or accurate noise levels, which are often unattainable in real-world scenarios. Our previous research successfully obtained accurate wavelet thresholds for measured signals without the need for clean signal or precise noise information [42]. Subsequently, we further applied the probability density function of method noise to determine the optimal wavelet decomposition layer [61]. However, we left unexplored the optimal wavelet basis selection. Based on our previous work, we adopted our proposed objective evaluation metric NZOPP [41,42,60] to obtain the optimal filtering parameters for NLM in the composite DWT-NLM method, namely the enhanced DWT-NLM method. This method effectively denoises several types of ECG signals from different databases containing Gaussian white noise. In the range of input SNR of −5 to 25 dB, its denoising results are significantly better than traditional DWT-NLM, improved DWT, and NLM methods. The denoising results of the experimental signal of the multimode fiber optic vibration system show that among all the comparison methods, this method obtained the clearest and sharpest signal curve. Therefore, it can be seen from the results that the filtering parameters of DWT-NLM play a crucial role in the denoising results. Importantly, the proposed method does not require accurate noise or clean signals for reference, highlighting its practicality. Nevertheless, the denoising quality of heartbeat signals can be further improved by selecting appropriate wavelet bases.

5. Conclusions

To achieve real-time and effective noise reduction in fiber optic vibration sensors, this study introduces an enhanced DWT-NLM composite denoising method. This method utilizes an objective denoising quality assessment metric to determine the optimal filtering parameters for the DWT-NLM composite approach. The efficacy of this method is validated by comparing its denoising outcomes on various ECG signals contaminated with AGW noise against those of existing denoising techniques. The results indicate that the proposed method outperforms other comparative methods in terms of output SNR and RMSE. Particularly noteworthy is the visual superiority of the denoising curves produced by the proposed method when applied to measured fiber optic vibration sensing signals, in comparison to other methods under consideration. By deriving optimal filtering parameters from the objective denoising quality assessment metric, the enhanced DWT-NLM composite method mitigates the limitations of traditional filtering parametrization methods that rely on imprecisely measurable noise levels. This advancement not only enhances the signal quality in contemporary non-invasive heartbeat monitoring technologies, such as fiber-optic vibration heartbeat monitoring, but also contributes to the improved accuracy of diagnosing cardiovascular diseases.

Author Contributions

Conceptualization, Z.P., W.C. and J.H.; methodology, Z.P., K.Y. and W.C.; software, Z.P., K.Y. and W.C.; validation, K.Y. and Y.Z.; formal analysis, Z.P. and W.C.; investigation, K.Y. and Y.Z.; resources, J.H.; data curation, Z.P. and K.Y.; writing—original draft preparation, Z.P. and W.C.; writing—review and editing, J.H.; supervision, W.C. and J.H.; project administration, W.C.; funding acquisition, W.C. and P.Z. All authors have read and agreed to the published version of the manuscript.

Funding

This work was supported in part by the Natural Science Foundation of Fujian Science and Technology Plan under Grant [2022J01824, 2021J01866].

Institutional Review Board Statement

Not applicable.

Informed Consent Statement

Informed consent was obtained from all subjects involved in the study.

Data Availability Statement

Data available on request from the authors.

Conflicts of Interest

The authors declare no conflicts of interest.

References

  1. Lyakhov, P.; Kiladze, M.; Lyakhova, U. System for neural network determination of atrial fibrillation on ECG signals with wavelet-based preprocessing. Appl. Sci. 2021, 11, 7213. [Google Scholar] [CrossRef]
  2. Fatema, K.; Montaha, S.; Rony, M.A.H.; Azam, S.; Hasan, M.Z.; Jonkman, M. A robust framework combining image processing and deep learning hybrid model to classify cardiovascular diseases using a limited number of paper-based complex ECG images. Biomedicines 2022, 10, 2835. [Google Scholar] [CrossRef] [PubMed]
  3. Mhamdi, L.; Dammak, O.; Cottin, F.; Dhaou, I.B. Artificial intelligence for cardiac diseases diagnosis and prediction using ECG images on embedded systems. Biomedicines 2022, 10, 2013. [Google Scholar] [CrossRef] [PubMed]
  4. Moshawrab, M.; Adda, M.; Bouzouane, A.; Ibrahim, H.; Raad, A. Smart wearables for the detection of cardiovascular diseases: A systematic literature review. Sensors 2023, 23, 828. [Google Scholar] [CrossRef] [PubMed]
  5. Fine, J.; Branan, K.L.; Rodriguez, A.J.; Boonya-Ananta, T.; Ajmal.; Ramella-Roman, J.C.; McShane, M.J.; Cote, G.L. Sources of inaccuracy in photoplethysmography for continuous cardiovascular monitoring. Biosensors 2021, 11, 126. [Google Scholar] [CrossRef] [PubMed]
  6. Pandey, S.K.; Janghel, R.R.; Vani, V. Patient Specific Machine Learning Models for ECG Signal Classification. Procedia Comput. Sci. 2020, 167, 2181–2190. [Google Scholar] [CrossRef]
  7. Aarthy, S.T.; Mazher Iqbal, J.L. A Novel Deep Learning Approach for Early Detection of Cardiovascular Diseases from ECG Signals. Med. Eng. Phys. 2024, 125, 104111. [Google Scholar] [CrossRef] [PubMed]
  8. Zhang, X.; Gu, K.; Miao, S.; Zhang, X.; Yin, Y.; Wan, C.; Yu, Y.; Hu, J.; Wang, Z.; Shan, T.; et al. Automated Detection of Cardiovascular Disease by Electrocardiogram Signal Analysis: A Deep Learning System. Cardiovasc. Diagn. Ther. 2020, 10, 227–235. [Google Scholar] [CrossRef]
  9. Malakouti, S.M. Heart disease classification based on ECG using machine learning models. Biomed. Signal Process. Control 2023, 84, 104796. [Google Scholar] [CrossRef]
  10. Rath, A.; Mishra, D.; Panda, G. Imbalanced ECG Signal-Based Heart Disease Classification Using Ensemble Machine Learning Technique. Front. Big Data 2022, 5, 1021518. [Google Scholar] [CrossRef]
  11. Bokma, J.; Pengel, L.; Robbers-Visser, D.; Groenink, M.; Boekholdt, S.; Bouma, B. A comparison of ECG-based home monitoring devices in adults with congenital heart disease. Eur. Heart J. 2021, 42, ehab724.1881. [Google Scholar] [CrossRef]
  12. Zhou, S.; AbdelWahab, A.; Sapp, J.L.; Sung, E.; Aronis, K.N.; Warren, J.W.; MacInnis, P.J.; Shah, R.; Horáček, B.M.; Berger, R.; et al. Assessment of an ECG-Based System for Localizing Ventricular Arrhythmias in Patients with Structural Heart Disease. J. Am. Heart Assoc. 2021, 10, e022217. [Google Scholar] [CrossRef]
  13. Guo, W.; Ma, Z.; Chen, Z.; Hua, H.; Wang, D.; Hilal, M.E.; Fu, Y.; Lu, P.; Lu, J.; Zhang, Y.; et al. Thin and soft Ti3C2Tx MXene sponge structure for highly sensitive pressure sensor assisted by deep learning. Chem. Eng. J. 2024, 485, 149659. [Google Scholar] [CrossRef]
  14. Ma, Z.; Hua, H.; You, C.; Ma, Z.; Guo, W.; Yang, X.; Qiu, S.; Zhao, N.; Zhang, Y.; Ho, D.; et al. FlexiPulse: A machine-learning-enabled flexible pulse sensor for cardiovascular disease diagnostics. Cell Rep. Phys. Sci. 2023, 4, 101690. [Google Scholar] [CrossRef]
  15. Zhang, B.; Li, J.; Zhou, J.; Chow, L.; Zhao, G.; Huang, Y.; Ma, Z.; Zhang, Q.; Yang, Y.; Yiu, C.K.; et al. A three-dimensional liquid diode for soft, integrated permeable electronics. Nature 2024, 628, 84–92. [Google Scholar] [CrossRef] [PubMed]
  16. Zhang, F.; Yang, K.; Pei, Z.; Wu, Y.; Sang, S.; Zhang, Q.; Jiao, H. A highly accurate flexible sensor system for human blood pressure and heart rate monitoring based on graphene/sponge. RSC Adv. 2022, 12, 2391–2398. [Google Scholar] [CrossRef]
  17. Kazanskiy, N.L.; Khonina, S.N.; Butt, M.A. A review on flexible wearables-Recent developments in non-invasive continuous health monitoring. Sens. Actuators A Phys. 2024, 366, 114993. [Google Scholar] [CrossRef]
  18. Mao, P.; Li, H.; Yu, Z. A Review of Skin-Wearable Sensors for Non-Invasive Health Monitoring Applications. Sensors 2023, 23, 3673. [Google Scholar] [CrossRef] [PubMed]
  19. Chung, H.U.; Rwei, A.Y.; Hourlier-Fargette, A.; Xu, S.; Lee, K.; Dunne, E.C.; Xie, Z.; Liu, C.; Carlini, A.; Kim, D.H.; et al. Skin-interfaced biosensors for advanced wireless physiological monitoring in neonatal and pediatric intensive-care units. Nat. Med. 2020, 26, 418–429. [Google Scholar] [CrossRef]
  20. Prieto-Avalos, G.; Cruz-Ramos, N.A.; Alor-Hernández, G.; Sánchez-Cervantes, J.L.; Rodríguez-Mazahua, L.; Guarneros-Nolasco, L.R. Wearable devices for physical monitoring of heart: A review. Biosensors 2022, 12, 292. [Google Scholar] [CrossRef]
  21. Jiang, Y.; Li, J.; Zhou, Z.; Jiang, X.; Zhang, D. Fabrication of all-SiC fiber-optic pressure sensors for high-temperature applications. Sensors 2016, 16, 1660. [Google Scholar] [CrossRef] [PubMed]
  22. Li, J.; Geng, D.; Zhang, D.; Qin, W.; Jiang, Y. Ultrasonic vibration mill-grinding of single-crystal silicon carbide for pressure sensor diaphragms. Ceram. Int. 2018, 44, 3107–3112. [Google Scholar] [CrossRef]
  23. Li, J.; Jiang, Y.; Li, H.; Liang, X.; Huang, M.; Liu, D.; Zhang, D. Direct bonding of silicon carbide with hydrofluoric acid treatment for high-temperature pressure sensors. Ceram. Int. 2020, 46, 3944–3948. [Google Scholar] [CrossRef]
  24. Vysotskaya, N.; Will, C.; Servadei, L.; Maul, N.; Mandl, C.; Nau, M.; Harnisch, J.; Maier, A. Continuous Non-Invasive Blood Pressure Measurement Using 60 GHz-Radar—A Feasibility Study. Sensors 2023, 23, 4111. [Google Scholar] [CrossRef]
  25. Hussein, A.F.; Mohammed, W.R.; Musa Jaber, M.; Ibrahim Khalaf, O. An Adaptive ECG Noise Removal Process Based on Empirical Mode Decomposition (EMD). Contrast Media Mol. Imaging 2022, 2022, 3346055. [Google Scholar] [CrossRef] [PubMed]
  26. Boda, S.; Mahadevappa, M.; Dutta, P.K. A Hybrid Method for Removal of Power Line Interference and Baseline Wander in ECG Signals Using EMD and EWT. Biomed. Signal Process. Control 2021, 67, 102466. [Google Scholar] [CrossRef]
  27. Grobbelaar, M.; Phadikar, S.; Ghaderpour, E.; Struck, A.F.; Sinha, N.; Ghosh, R.; Ahmed, M.Z.I. A survey on denoising techniques of electroencephalogram signals using wavelet transform. Signals 2022, 3, 577–586. [Google Scholar] [CrossRef]
  28. Giorgio, A.; Guaragnella, C.; Giliberti, D.A. Improving ECG signal denoising using wavelet transform for the prediction of malignant arrhythmias. Int. J. Med. Eng. Inform. 2020, 12, 135–150. [Google Scholar] [CrossRef]
  29. Blanco-Velasco, M.; Weng, B.; Barner, K.E. ECG signal denoising and baseline wander correction based on the empirical mode decomposition. Comput. Biol. Med. 2008, 38, 1–13. [Google Scholar] [CrossRef] [PubMed]
  30. Prashar, N.; Sood, M.; Jain, S. Design and implementation of a robust noise removal system in ECG signals using dual-tree complex wavelet transform. Biomed. Signal Process. Control 2021, 63, 102212. [Google Scholar] [CrossRef]
  31. Hesar, H.D.; Mohebbi, M. An Adaptive Kalman Filter Bank for ECG Denoising. IEEE J. Biomed. Health Inform. 2021, 25, 13–21. [Google Scholar] [CrossRef] [PubMed]
  32. Prashar, N.; Sood, M.; Jain, S. Dual-tree complex wavelet transform technique-based optimal threshold tuning system to deliver denoised ECG signal. Trans. Inst. Meas. Control 2020, 42, 854–869. [Google Scholar] [CrossRef]
  33. Mohguen, W.; Bouguezel, S. Denoising the ECG signal using ensemble empirical mode decomposition. Eng. Technol. Appl. Sci. Res. 2021, 11, 7536–7541. [Google Scholar] [CrossRef]
  34. Gupta, V.; Mittal, M.; Mittal, V.; Gupta, A. ECG signal analysis using CWT, spectrogram and autoregressive technique. Iran J. Comput. Sci. 2021, 4, 265–280. [Google Scholar] [CrossRef]
  35. Jenkal, W.; Latif, R.; Laaboubi, M. ECG Signal Denoising Using an Improved Hybrid DWT-ADTF Approach. Cardiovasc. Eng. Technol. 2024, 15, 77–94. [Google Scholar] [CrossRef] [PubMed]
  36. Chandra, M.; Goel, P.; Anand, A.; Kar, A. Design and Analysis of Improved High-Speed Adaptive Filter Architectures for ECG Signal Denoising. Biomed. Signal Process. Control 2021, 63, 102221. [Google Scholar] [CrossRef]
  37. Gao, L.; Gan, Y.; Shi, J. A novel intelligent denoising method of ecg signals based on wavelet adaptive threshold and mathematical morphology. Appl. Intell. 2022, 52, 10270–10284. [Google Scholar] [CrossRef]
  38. Kumar, A.; Tomar, H.; Mehla, V.K.; Komaragiri, R.; Kumar, M. Stationary wavelet transform based ECG signal denoising method. ISA Trans. 2021, 114, 251–262. [Google Scholar] [CrossRef] [PubMed]
  39. Hu, X.; Yu, Q.; Yu, H. An ECG denoising method combining variational modal decomposition and wavelet soft threshold. Concurr. Comput. Pract. Exp. 2022, e7048. [Google Scholar] [CrossRef]
  40. Wang, J.; Sun, S.; Sun, Y. A muscle fatigue classification model based on LSTM and improved wavelet packet threshold. Sensors 2021, 21, 6369. [Google Scholar] [CrossRef]
  41. Chen, Y.; Zhu, P.; Yin, Y.; Wu, M.; Yu, K.; Feng, L.; Chen, W. Objective assessment of IPM denoising quality of ϕ-otdr signal. Measurement 2023, 214, 112775. [Google Scholar] [CrossRef]
  42. Yu, K.; Feng, L.; Chen, Y.; Wu, M.; Zhang, Y.; Zhu, P.; Chen, W.; Wu, Q.; Hao, J. Accurate Wavelet Thresholding Method for ECG Signals. Comput. Biol. Med. 2024, 169, 107835. [Google Scholar] [CrossRef] [PubMed]
  43. Sraitih, M.; Jabrane, Y. A denoising performance comparison based on ECG Signal Decomposition and local means filtering. Biomed. Signal Process. Control 2021, 69, 102903. [Google Scholar] [CrossRef]
  44. Gan, M.; Pan, H.; Chen, Y.; Pan, S. Application of the Variational Mode Decomposition (VMD) method to river tides. Estuar. Coast. Shelf Sci. 2021, 261, 107570. [Google Scholar] [CrossRef]
  45. Ding, Y.; Chen, Z.; Zhang, H.; Wang, X.; Guo, Y. A short-term wind power prediction model based on CEEMD and WOA-KELM. Renew. Energy 2022, 189, 188–198. [Google Scholar] [CrossRef]
  46. Zhang, W.; Teng, F.; Li, J.; Zhang, Z.; Niu, L.; Zhang, D.; Song, Q.; Zhang, Z. Denoising method based on CNN-LSTM and CEEMD for LDV signals from accelerometer shock testing. Measurement 2023, 216, 112951. [Google Scholar] [CrossRef]
  47. Dragomiretskiy, K.; Zosso, D. Variational Mode Decomposition. IEEE Trans. Signal Process. 2014, 62, 531–544. [Google Scholar] [CrossRef]
  48. Bing, P.; Liu, W.; Wang, Z.; Zhang, Z. Noise reduction in ECG signal using an effective hybrid scheme. IEEE Access 2020, 8, 160790–160801. [Google Scholar] [CrossRef]
  49. Dwivedi, A.K.; Ranjan, H.; Menon, A.; Periasamy, P. Noise reduction in ECG signal using combined ensemble empirical mode decomposition method with stationary wavelet transform. Circuits Syst. Signal Process. 2021, 40, 827–844. [Google Scholar] [CrossRef]
  50. Zhang, M.; Wei, G. An integrated EMD adaptive threshold denoising method for reduction of noise in ECG. PLoS ONE 2020, 15, e0235330. [Google Scholar] [CrossRef]
  51. Li, C.; Wu, Y.; Lin, H.; Li, J.; Zhang, F.; Yang, Y. ECG denoising method based on an improved VMD algorithm. IEEE Sens. J. 2022, 22, 22725–22733. [Google Scholar] [CrossRef]
  52. Malghan, P.G.; Hota, M.K. Grasshopper optimization algorithm based improved variational mode decomposition technique for muscle artifact removal in ECG using dynamic time warping. Biomed. Signal Process. Control 2022, 73, 103437. [Google Scholar] [CrossRef]
  53. Zhang, S.; Liu, H.; Hu, M.; Jiang, A.; Zhang, L.; Xu, F.; Hao, G. An adaptive CEEMDAN thresholding denoising method optimized by nonlocal means algorithm. IEEE Trans. Instrum. Meas. 2020, 69, 6891–6903. [Google Scholar] [CrossRef]
  54. Chatterjee, S.; Thakur, R.S.; Yadav, R.N.; Gupta, L.; Raghuvanshi, D.K. Review of Noise Removal Techniques in ECG Signals. IET Signal Process. 2020, 14, 569–590. [Google Scholar] [CrossRef]
  55. Talbi, M. New approach of ECG denoising based on 1-D double-density complex DWT and SBWT. Comput. Methods Biomech. Biomed. Eng. Imaging Vis. 2020, 8, 608–620. [Google Scholar] [CrossRef]
  56. Singh, P.; Pradhan, G. Variational Mode Decomposition Based ECG Denoising Using Non-Local Means and Wavelet Domain Filtering. Australas. Phys. Eng. Sci. Med. 2018, 41, 891–904. [Google Scholar] [CrossRef] [PubMed]
  57. Bhobhriya, R.; Boora, R.; Jangra, M.; Dalal, P. W-NLM: A Proficient EMG Denoising Technique. Int. J. Inf. Technol. 2023, 15, 2517–2527. [Google Scholar] [CrossRef]
  58. Tripathi, P.M.; Kumar, A.; Komaragiri, R.; Kumar, M. A Review on Computational Methods for Denoising and Detecting ECG Signals to Detect Cardiovascular Diseases. Arch. Comput. Methods Eng. 2022, 29, 1875–1914. [Google Scholar] [CrossRef]
  59. Singh, P.; Pradhan, G.; Shahnawazuddin, S. Denoising of ECG Signal by Non-Local Estimation of Approximation Coefficients in DWT. Biocybern. Biomed. Eng. 2017, 37, 599–610. [Google Scholar] [CrossRef]
  60. Wu, M.; Chen, Y.; Zhu, P.; Chen, W. NLM Parameter Optimization for φ-OTDR Signal. J. Light. Technol. 2022, 40, 6045–6051. [Google Scholar] [CrossRef]
  61. Chen, Y.; Yu, K.; Wu, M.; Feng, L.; Zhang, Y.; Zhu, P.; Chen, W.; Hao, J. Wavelet Decomposition Layer Selection for the φ-OTDR Signal. Photonics 2024, 11, 137. [Google Scholar] [CrossRef]
  62. Wu, Q.; Qu, Y.; Liu, J.; Yuan, J.; Wan, S.P.; Wu, T.; He, X.D.; Liu, B.; Liu, D.; Ma, Y.; et al. Singlemode-multimode-singlemode fiber structures for sensing applications—A review. IEEE Sens. J. 2020, 21, 12734–12751. [Google Scholar] [CrossRef]
  63. Zhu, R.Z.; Wan, S.J.; Xiong, Y.F.; Feng, H.G.; Chen, Y.; Lu, Y.Q.; Xu, F. Magnetic field sensing based on multimode fiber specklegrams. J. Light. Technol. 2021, 39, 3614–3619. [Google Scholar] [CrossRef]
  64. Wang, K.; Dong, X.; Köhler, M.H.; Kienle, P.; Bian, Q.; Jakobi, M.; Koch, A.W. Advances in optical fiber sensors based on multimode interference (MMI): A review. IEEE Sens. J. 2020, 21, 132–142. [Google Scholar] [CrossRef]
  65. Tracey, B.H.; Miller, E.L. Nonlocal Means Denoising of ECG Signals. IEEE Trans. Biomed. Eng. 2012, 59, 2383–2386. [Google Scholar] [CrossRef] [PubMed]
  66. Wu, H.; Shang, C.; Zhu, K.; Lu, C. Vibration Detection in Distributed Acoustic Sensor with Threshold-Based Technique: A Statistical View and Analysis. J. Light. Technol. 2021, 39, 4082–4093. [Google Scholar] [CrossRef]
  67. Moeyersons, J.; Morales, J.; Villa, A.; Castro, I.; Testelmans, D.; Buyse, B.; Van Hoof, C.; Willems, R.; Van Huffel, S.; Varon, C. Supervised SVM Transfer Learning for Modality-Specific Artefact Detection in ECG. Sensors 2021, 21, 662. [Google Scholar] [CrossRef] [PubMed]
  68. Moody, G.; Mark, R. The Impact of the MIT-BIH Arrhythmia Database. IEEE Eng. Med. Biol. Mag. 2001, 20, 45–50. [Google Scholar] [CrossRef] [PubMed]
  69. Nolle, F.; Badura, F.; Catlett, J.; Bowser, R.; Sketch, M. CREI-GARD, a new concept in computerized arrhythmia monitoring systems. Comput. Cardiol. 1986, 13, 515–518. [Google Scholar]
  70. Bousseljot, R.; Kreiseler, D.; Schnabel, A. Nutzung Der EKG-Signaldatenbank CARDIODAT Der PTB Über Das Internet. Biomed. Eng. 1995, 40, 317–318. [Google Scholar] [CrossRef]
  71. Goldberger, A.L.; Amaral, L.A.; Glass, L.; Hausdorff, J.M.; Ivanov, P.C.; Mark, R.G.; Mietus, J.E.; Moody, G.B.; Peng, C.K.; Stanley, H.E. PhysioBank, PhysioToolkit, and PhysioNet: Components of a New Research Resource for Complex Physiologic Signals. Circulation 2000, 101, E215–E220. [Google Scholar] [CrossRef] [PubMed]
Figure 1. Schematic diagram of multimode fiber optic micro vibration sensing system.
Photonics 11 00645 g001
Figure 2. Enhanced DWT-NLM composite method.
Photonics 11 00645 g002
Figure 3. The NLM principle is a weighted average of data blocks ( t P ) ( t + P ) that are similar to the data block ( s P ) ( s + P ) in the range N ( s ) .
Photonics 11 00645 g003
Figure 4. Flowchart for determining the optimal threshold for each decomposition layer.
Photonics 11 00645 g004
Figure 5. Comparison of the optimal parameters of NLM obtained by objective metric and SNR, respectively.
Photonics 11 00645 g005
Figure 6. Comparison of denoising methods for noise reduction of cu07 ECG signals with different input SNRs.
Photonics 11 00645 g006
Figure 7. Comparison of different denoising methods for output SNR improvement of cu07 signal with 10 dB input SNR.
Photonics 11 00645 g007
Figure 8. Visual comparison of the denoising effect of multimode fiber sensing heartbeat signals: (a) original signal, (b) proposed method, (c) conventional DWT-NLM, (d) NLM, and (e) improved DWT.
Photonics 11 00645 g008
Table 1. Comparison of optimal output SNR ratios and RMS values of different ECG signals denoised by different methods.
RecordInput SNRProposed MethodDWT + NLMNLMACF + DWT
SNRRMSESNRRMSESNRRMSESNRRMSE
109−56.62330.15116.58980.15173.99410.20456.12590.1600
011.27690.088510.66590.09497.99820.1299.94490.103
515.44400.054715.01250.057513.04310.072113.39940.0692
1018.24840.039618.21190.039816.71430.047316.61440.0478
1520.89320.029221.06280.028619.66670.033619.77310.0332
2023.68350.021223.33440.022022.89140.023222.97760.023
2526.39740.015524.87610.018526.19360.015924.75090.0187
233−56.1820.26556.17430.26563.28390.37015.92750.2734
011.40790.145311.44910.14468.42030.205010.21940.1667
515.17820.094215.14950.094512.78920.123913.61630.1128
1019.18930.059318.94170.061016.59350.080017.36480.0733
1522.33220.041322.28550.041520.25850.052420.48540.0511
2026.02850.027025.20190.029723.81000.034824.82300.0310
2529.19990.018727.64680.022427.42670.023028.98780.0192
symecg−56.73260.10286.58330.10463.14300.15543.56870.1479
012.01670.056011.87150.05698.49310.08407.39380.0953
517.12690.031116.12460.034914.22040.043410.88100.0638
1020.30130.021619.32410.024118.30280.027115.52250.0374
1522.89140.016022.18130.017422.02420.017719.86150.0227
2025.85540.011424.38140.013525.42620.011923.07190.0157
2529.12350.007827.37720.009529.01800.007927.94030.0089
cu11m−57.23820.36337.08670.36924.23120.51267.05930.3702
013.64700.173913.23640.181910.02580.263310.59750.2462
518.67570.097417.28930.114015.95810.132814.45830.1579
1022.25100.064420.44260.079319.17800.091718.28900.1016
1524.99230.047024.12910.051922.48870.062622.27290.0642
2028.16550.032627.59890.034825.89050.042326.00300.0418
2531.00850.023530.58410.024729.15570.029129.71220.0273
cu07m−56.06800.24325.55990.25783.24430.33654.80810.2810
011.89290.124510.80790.14097.84050.19838.71590.1791
515.95000.078015.02650.086613.37210.104812.76070.1124
1018.75300.056418.14590.060517.46800.065416.53450.0728
1521.61980.040520.95170.043820.44230.046420.33140.0470
2024.60230.028823.23710.033723.54060.032523.66850.0320
2527.92550.019624.83380.028026.93310.022027.54780.0205
s0016lrem−58.43380.08468.29420.08606.02780.11178.43830.0847
012.32340.054212.17020.05519.46210.075212.37680.0538
516.43170.033716.01170.035413.41700.047715.80190.0363
1019.94430.022519.70730.023117.59140.029519.11180.0248
1522.85930.016122.83820.016121.10110.019722.29870.0171
2025.06370.012525.01940.012524.13830.013924.41890.0134
2528.07250.008826.64890.010427.18100.009826.98290.0100
s0026lrem−59.42990.10908.61990.11956.46730.15329.05390.1138
013.17350.070912.51870.07639.99790.102013.10900.0713
517.49170.043116.81510.046514.26930.062417.15890.0447
1021.65740.026721.03040.028618.79860.037019.88680.0326
1525.66820.016825.18100.017823.11560.022523.16680.0224
2029.24140.011128.84530.011627.10560.014226.83150.0147
2532.02180.008131.82640.008330.49820.009630.18700.0100
Disclaimer/Publisher’s Note: The statements, opinions and data contained in all publications are solely those of the individual author(s) and contributor(s) and not of MDPI and/or the editor(s). MDPI and/or the editor(s) disclaim responsibility for any injury to people or property resulting from any ideas, methods, instructions or products referred to in the content.

