Abstract
Super-resolution structured illumination microscopy (SR-SIM) is one of the important techniques that are most suitable for live-cell imaging. The reconstructed SR-SIM images are noisy once the raw images are recorded with low-light exposure. Here, we propose a new network (entitled the ND-SIM network) to denoise the SR images reconstructed using frequency-domain algorithms (FDAs). We demonstrate that ND-SIM can yield artifact-free SR images using raw images with an average photon count down to 20 per pixel while achieving comparable resolution to the ground truth (GT) obtained with high-light exposure. We can envisage that the ND-SIM will be widely applied for the long-term, super-resolution live-cell imaging of various bioprocesses in the future.
1. Introduction
Fluorescence microscopy is an essential tool for imaging the dynamics and functions of various biological processes in live cells. However, the spatial resolution of fluorescence microscopy impedes the dynamic visualization of living cellular structures smaller than 200 nm [1,2,3]. Recently, super-resolution (SR) techniques have been proposed to enhance the spatial resolution to tens or even a few nanometers [4,5,6,7]. Among these SR techniques, structured illumination microscopy (SIM) stands out because it is applicable to most fluorophores commonly used in cell biology without the requirement for additional fluorescent labeling [8,9,10,11,12,13].
SIM utilizes the frequency-shift effect of sinusoidal illumination and postprocessing algorithms to obtain SR-SIM images with a two-fold resolution improvement. Frequency-domain-based reconstruction algorithms, such as Fair-SIM [14], Open-SIM [15], HiFi-SIM [16], and PCA-SIM [17], have been developed. However, frequency-domain-based reconstruction algorithms are prone to generate photon noise and background noise artifacts, especially when the signal-to-noise ratio (SNR) of raw images is too low (e.g., due to low-light excitation or short exposure time) [18]. To alleviate the reconstruction noise, SIM imaging experiments employ a long exposure time and high excitation power, which reduce the image acquisition speed and introduce considerable photobleaching and phototoxicity. Alongside the development of SIM instruments, several algorithms have been proposed to circumvent this problem. To cite a few, Huang et al. proposed a Hessian matrix-based deconvolution algorithm combined with the spatiotemporal continuity prior to reducing noise and minimizing reconstruction artifacts [11]. Hoffman and Betzig used lower pixel counts to reconstruct SIM images and subsequently merged them to reduce reconstruction artifacts [19]. Yet, these algorithms are often ill posed [11,20], facing complex microscopic imaging scenarios. Recently, deep learning has demonstrated outstanding performance in denoising SR-SIM images since it allows for obtaining stochastic and reasonable feature samples by exploiting pairs of end-to-end transformation images. Jin et al. proposed a U-Net framework to reconstruct SR-SIM images from the raw images with reduced numbers and under extremely low-light conditions (at least 100× fewer photons) [21]. Christensen et al. designed a network architecture for reconstruction from synthetic raw SIM images with different levels of noise and verified its robustness to noise [22]. Qiao et al. developed a deep Fourier channel attention network (DFCAN) that learns high-frequency information by leveraging frequency content differences across distinct features in the Fourier domain [23,24]. Consequently, DFCAN could generate high-quality SR SIM images in both low-light- and high-light-exposure conditions. However, these existing end-to-end techniques directly reconstruct the SR-SIM image from raw images with low SNR. When the input image becomes noisier and contains more complex structures, the impact of spectral deviation will be aggravated [23,25]. As a result, the resolution of SR-SIM images will be compromised.
In this paper, the network denoise SIM (entitled ND-SIM), which combines conventional FDAs with a deep convolutional neural network, is constructed to obtain artifact-free SR-SIM images from raw images recorded under low-light excitation. ND-SIM starts with the noisy SR-SIM image reconstructed by conventional FDAs and is followed by a denoise network to reduce noise-induced artifacts. We demonstrated that the proposed ND-SIM can perform high-quality SR reconstruction under average effective photon counts ranging from 25 to 100 compared to traditional SIM algorithms.
2. Methods
2.1. ND-SIM Network
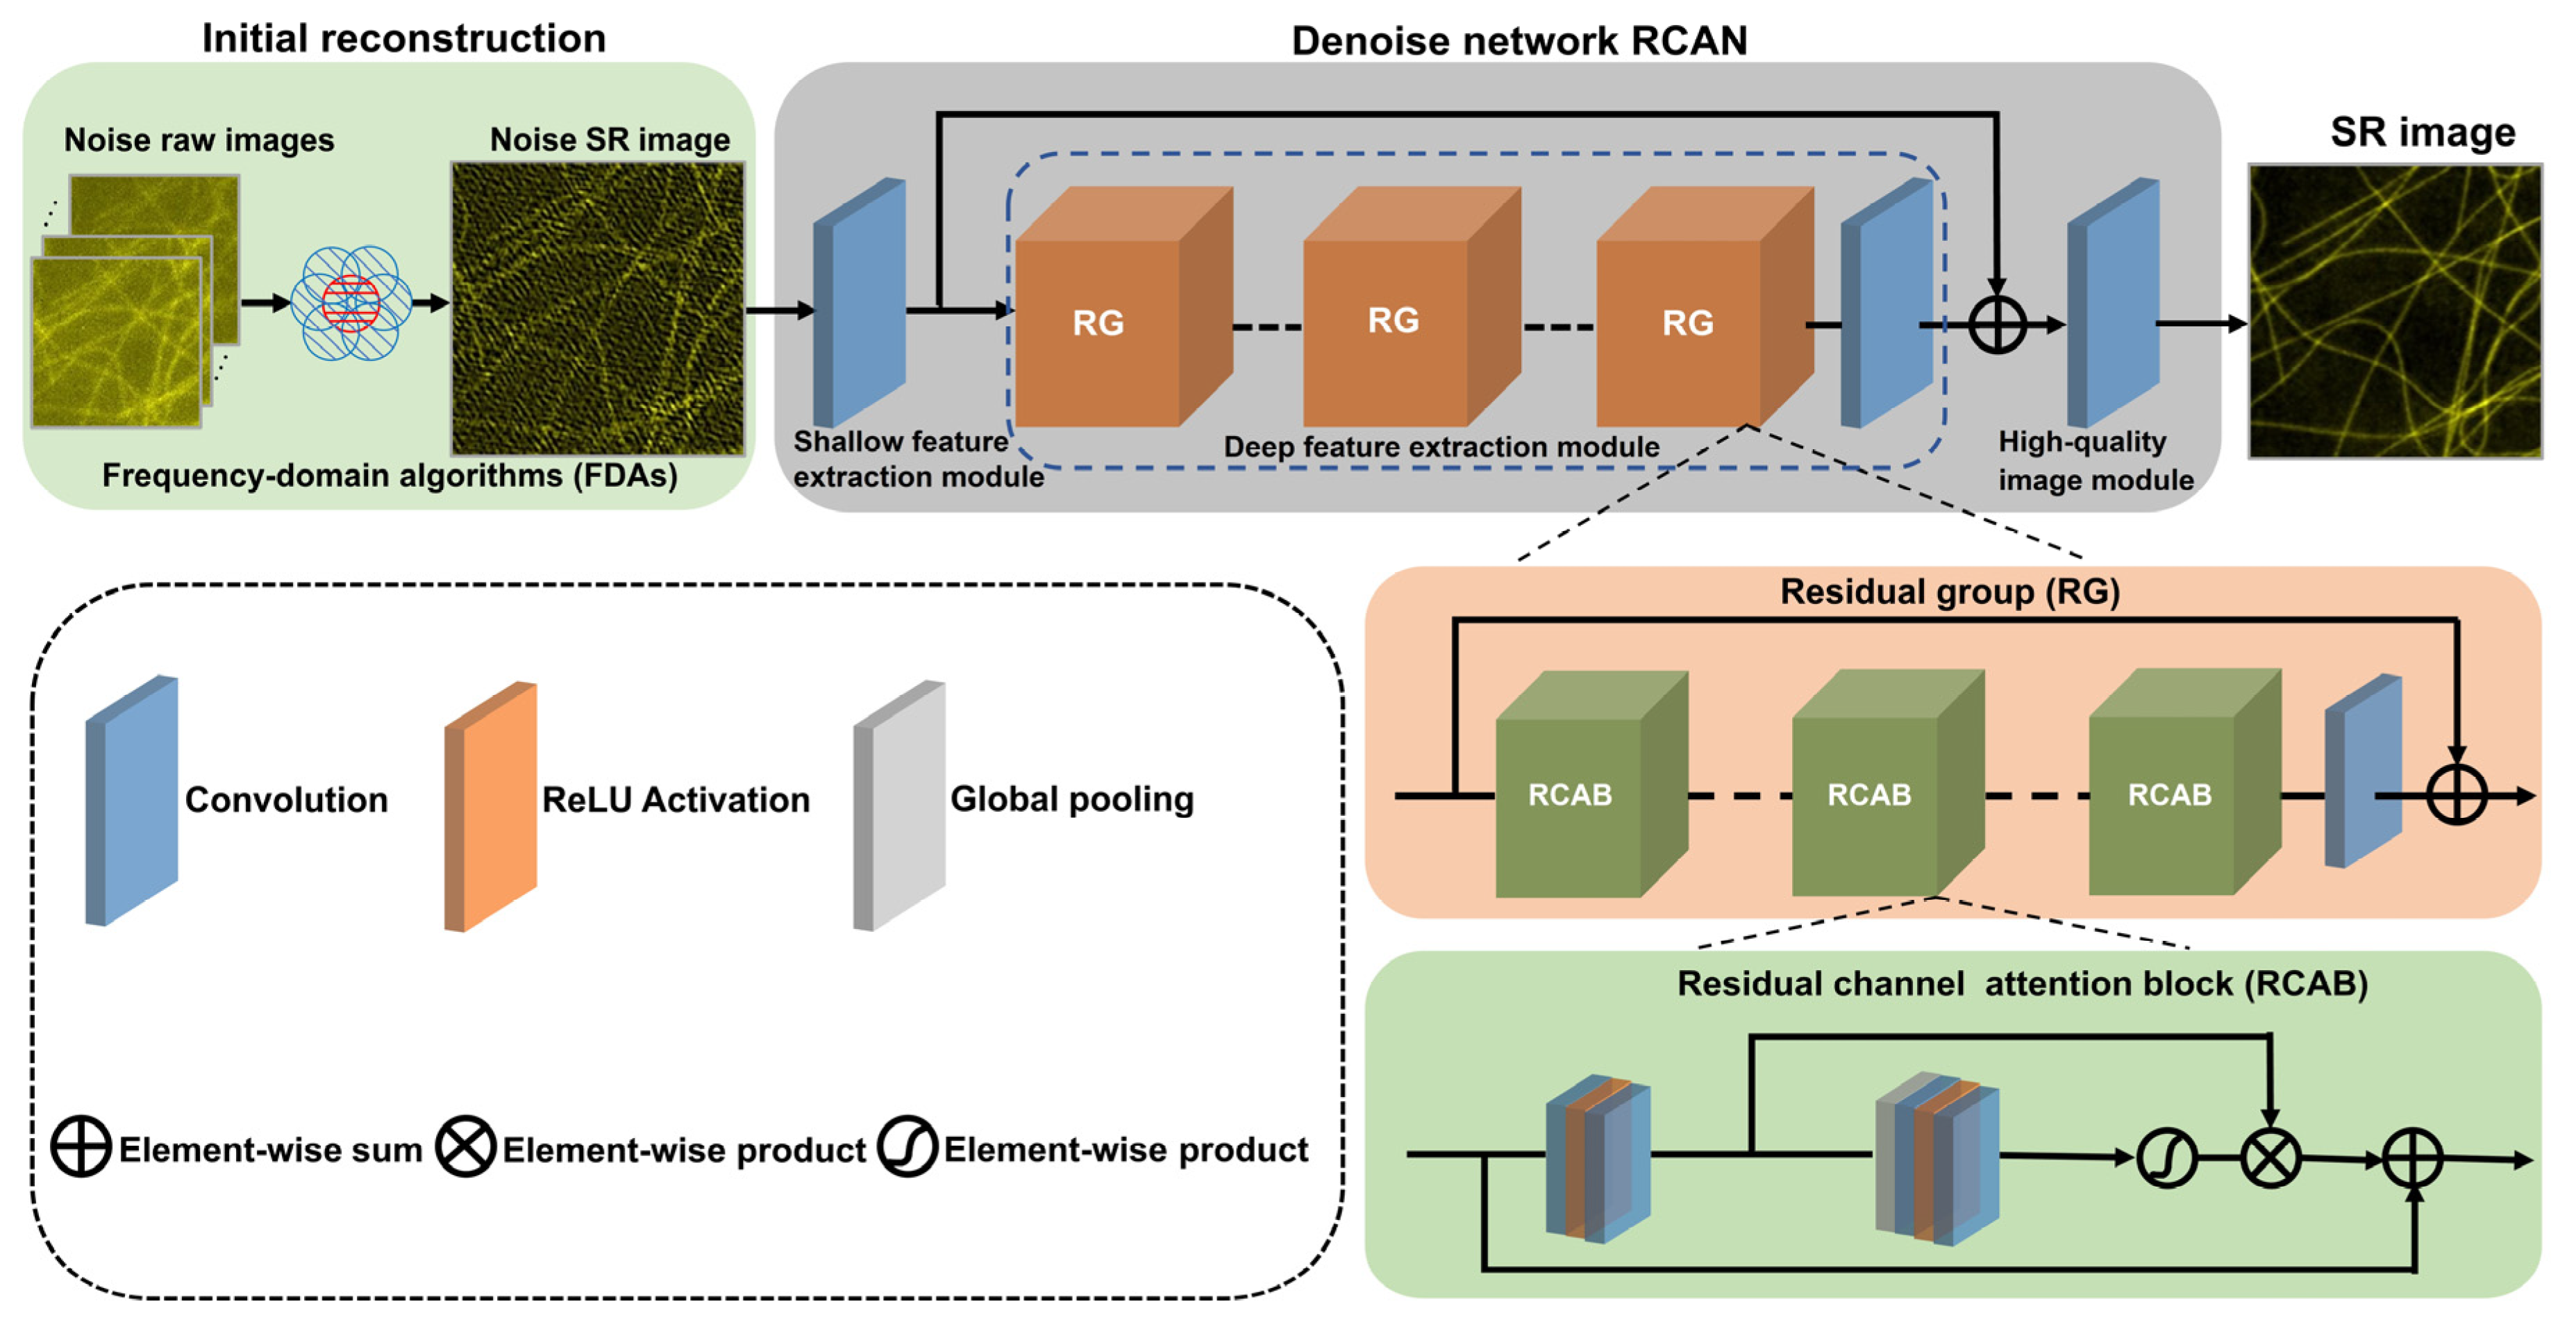
Herein, the proposed ND-SIM method to obtain SR-SIM images denoised from low-SNR raw images is shown in Figure 1. The ND-SIM utilizes frequency-domain algorithms (FDAs) to perform an initial reconstruction and denoise this reconstruction with a deep convolution neural network. More specifically, we first utilize the HiFi-SIM algorithm to computationally reconstruct noisy SR-SIM images from noisy raw image stacks. The noisy SR-SIM images are then further propagated into the residual channel attention networks (RCANs) [26] without an upsampling module to obtain noise-free SR-SIM images. In ND-SIM, the nonlinear relation between Inoise_raw(r) with low SNR and Sdenoise_SR(r) can be described with
where r is the spatial coordinate. RSIM[·] is the operation to reconstruct an SR image from low-SNR raw images Inoise_raw(r) and Net is the RCAN without an upsampling module. Compared to the deep learning methods that directly obtain noise-free SR images from low-SNR raw images, ND-SIM can eliminate the spectral bias effect [25] to improve the quality of SR images.

Figure 1.
The schematic diagram of the ND-SIM model.
ND-SIM employs HiFi-SIM to generate the noisy SR-SIM image. Briefly, it consists of the following steps: the preprocessing, the reconstruction parameter estimation, and the reconstruction. Mathematical and algorithmic details are provided in the original publication [16]. The raw image was deconvoluted using the theoretical optical transfer function (OTF) with NA = 1.41 (in terms of clathrin-coated pits (CCPs) and F-actin), λ = 488 nm, and pixel size = 62.6 nm in preprocessing. The reconstruction parameters are estimated using an improved normalized cross-correlation method. Then, spectrum components were separated, shifted, and combined to yield a directly combined spectrum, using a method similar to Fair-SIM.
ND-SIM employs an RCAN to implement a form of SR-SIM artifact reduction and denoising. The input has a dimension of C × H × W, where C indicates the number of the noisy SR-SIM image and H and W are the pixel counts along the width and height directions. The network is composed of shallow feature extraction, deep feature extraction, and high-quality image modules. For the shallow feature extraction module, the input noise SR-SIM image is first fed into a convolution layer with 64 kernels to extract shallow feature maps. The convolutional layer can map raw images into a higher-dimensional feature space. The deep feature extraction module consists of four residual groups (RGs) with long skip connections and a convolution layer with 64 kernels. Each residual group also contains four residual channel attention blocks (RCABs) with short skip connections and a convolution layer. The short skip and long connections allow for bypassing the low-frequency information and boosting the high-frequency information. Furthermore, a channel attention mechanism within the RCAB further enhances the ability to achieve a higher resolution by exploiting the interdependencies among channels to adaptively rescale channel-wise features. A deep feature map obtained by accumulating the intermediate features in the RCAB module is fed into the high-quality image module. For the high-quality image module, a convolutional layer is placed at the end of the network to transfer the final noise-free SR-SIM images. Concretely, the kernel size of all the convolutional layers is 3 × 3, and the activation function used is ReLU.
In addition to model architecture, the loss function is another key factor that significantly affects model performance. By iteratively optimizing the loss between the predicted noise-free SR-SIM images and the ground truth SIM (GT-SIM) images obtained by averaging three SR images with ultra-high SNR, the ND-SIM will acquire the denoising ability to transform noisy SR-SIM images into corresponding noise-free SR-SIM images. The loss function is defined with
where S′ = R(x, θ) represents the noise-free SR-SIM image output from the RCAN, and the weight parameter λ is used to balance the Mean Squared Error (MSE) loss and structural similarity index measure (SSIM) loss, which is fixed as 0.01. Especially, the MSE loss ensures the convergency of the SR-SIM image output from the RCAN to the GT-SIM images, and the SSIM loss enhances the structural similarity of the output SR-SIM image. S is the GT-SIM image reconstructed with the conventional approach (a high fluorescence level of >1200 average photon count), and x denotes the input noise SR-SIM image reconstructed by the HiFi-SIM algorithm. The network parameters are optimized as the loss gradually decreases, eventually yielding a well-trained ND-SIM model. In the inference stage, the noisy SR-SIM images are reconstructed from the raw images with low SNRs via the FDAs, and then, the noisy SR-SIM images are fed into the well-trained ND-SIM model and the final noise-free SR-SIM images are output. The ND-SIM network can be further enhanced to achieve even higher spatial resolution by incorporating an additional enhancing subnet [27].
2.2. Image Assessment Metrics Calculation
In this work, we used the three metrics of peak signal-to-noise ratio (PSNR), structural similarity index measure (SSIM), and average photon count. We used the average photon count to measure the signal level of raw images. PSNR and SSIM are used as evaluation indicators to assess the performance of the proposed ND-SIM. The PSNR is defined as follows:
where MAX represents the maximum pixel value in the image and Mean Squared Error (MSE) is defined as
where SGT(i, j) and Sdenoise_SR(i, j) are the pixel values of the ground truth and the denoised SR-SIM images, M is the number of rows in the image, and N is the number of columns in the image. In particular, the higher the PSNR score, the more accurate the denoised SR image value provided by ND-SIM. The SSIM is defined as
Here, μGT and μdenoise_SR are the mean values of the ground truth and the denoised SR images, respectively; σGT and σdenoise_SR are the variances in the ground truth and the denoised SR images; σ is the covariance in the ground truth and the denoised SR images; and c1 and c2 are regularization parameters. The larger the SSIM is, the more accurate the sample’s structure obtained by ND-SIM is.
Then, we quantitatively assessed the signal level of the raw images, using the average photon count. The computational details are provided in the original publication [24]. Specifically, we used the same following steps to calculate the average photon count of a given raw image. To identify the sample structure regions, the given raw images are preprocessed by subtracting the average background noise (measured in the absence of any samples) and low-pass filtering by a Gaussian-type filter with a standard deviation of five pixels. Then, the sample structure regions were identified with a threshold of 20% of the average intensity of the processed image.
2.3. Data Acquisition of ND-SIM
The proposed ND-SIM was trained on the publicly available BioSR dataset, which was obtained using a multimodality SIM system [23,24]. To bring convenience for readers, we depict the optical diagram of this SIM system in Figure 2 again. In the excitation part, lasers of different wavelengths (405 nm, 488 nm, 560 nm, and 642 nm) were collinearly combined and used as the light source. The selected laser beam was expanded and successively passed through a polarization beam splitter (PBS) and a halfwave plate (HWP) and then reached a spatial light modulator (SLM, QXGA-3DM, Forth Dimension Display, Dalgety Bay, UK). Then, it was reflected back by the SLM, which loaded the grating pattern. Thereafter, the ±1 diffraction orders were selected using a spatial mask and relayed to the back focal plane of a high-numerical-aperture (NA) objective lens to interfere with each other and eventually generate fringe structured light on the sample plane. In the detection part, the structured fluorescence emissions were collected by the same objective, separated from the excitation laser light by a dichroic mirror (Chroma, ZT405/488/560/647tpc), and finally detected by a scientific complementary metal oxide semiconductor (sCMOS) camera (Hamamatsu, Orca Flash 4.0 v.3) to form the raw images. The main parameters of this optical setup used for the ND-SIM training dataset are as follows. The excitation laser wavelength is 488 nm. The effective excitation NA is 1.41 for clathrin-coated pits (CCPs) and F-actin and 1.35 for endoplasmic reticulum (ER) and microtubules (MTs). The effective detection NA is 1.3 for all the organelle structures. The pixel size of raw images is 62.6 nm, and in the image reconstruction, there is a factor of 2 for image upscaling.
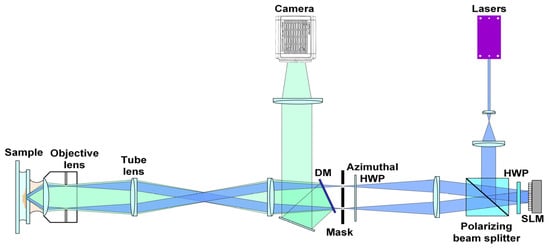
Figure 2.
Schematic diagram of the multimodality SIM system.
The publicly available biological BioSR dataset was taken on a wide range of biological structures, including MTs, CCPs, ER, and F-actins. Here, we chose CCPs and MTs that had high structural complexity to train the network. Every specimen contained at least 50 distinct regions of interest (ROIs). Each ROI contained nine different SNR level sets of raw images with constant 1 ms exposure times but increasing excitation light intensity. Each set of raw images was used to calculate its photons per pixel. In addition, in the same ROI, three N × M raw images (>1200 average photon count) were acquired with an exposure time of 10 ms and an excitation intensity of 120 W cm−2, and the reconstructed three SR images with ultra-high SNRs were averaged as the GT-SIM image. In general, the average effective photon counts of low-SNR images (the raw images) were less than those of artifact-free GT-SIM images. Here, we chose the raw images with an SNR level ranging from 1 to 3 in each ROI, from which an initial SR image was obtained via FDAs. The dataset is piled up with pairs of noisy SR-SIM images (the initial reconstruction) and corresponding artifact-free GT-SIM images. In total, 35 groups of specimens within each type were used for training, and the remaining 15 were used for testing. For data augmentation, firstly, the pairs were to be randomly cropped into patches of 256 × 256 pixels. Meanwhile, horizontal/vertical flipping and random rotation operations were applied to further enrich the dataset. Eventually, the total number used for training was ~20,000. During the network training, we adopted the Adam optimizer with an initial learning rate of 10−4 to update the parameters. The ND-SIM parameters were initialized randomly and trained for about 30,000 mini-batch iterations. The training processes were performed on a computer workstation with a Linux system equipped with an NVIDIA GeForce RTX 3090 with Python version 3.7.5 and PyTorch version 1.10.1.
3. Experimental Results
3.1. Evaluation of ND-SIM in Low-Photon-Count Level
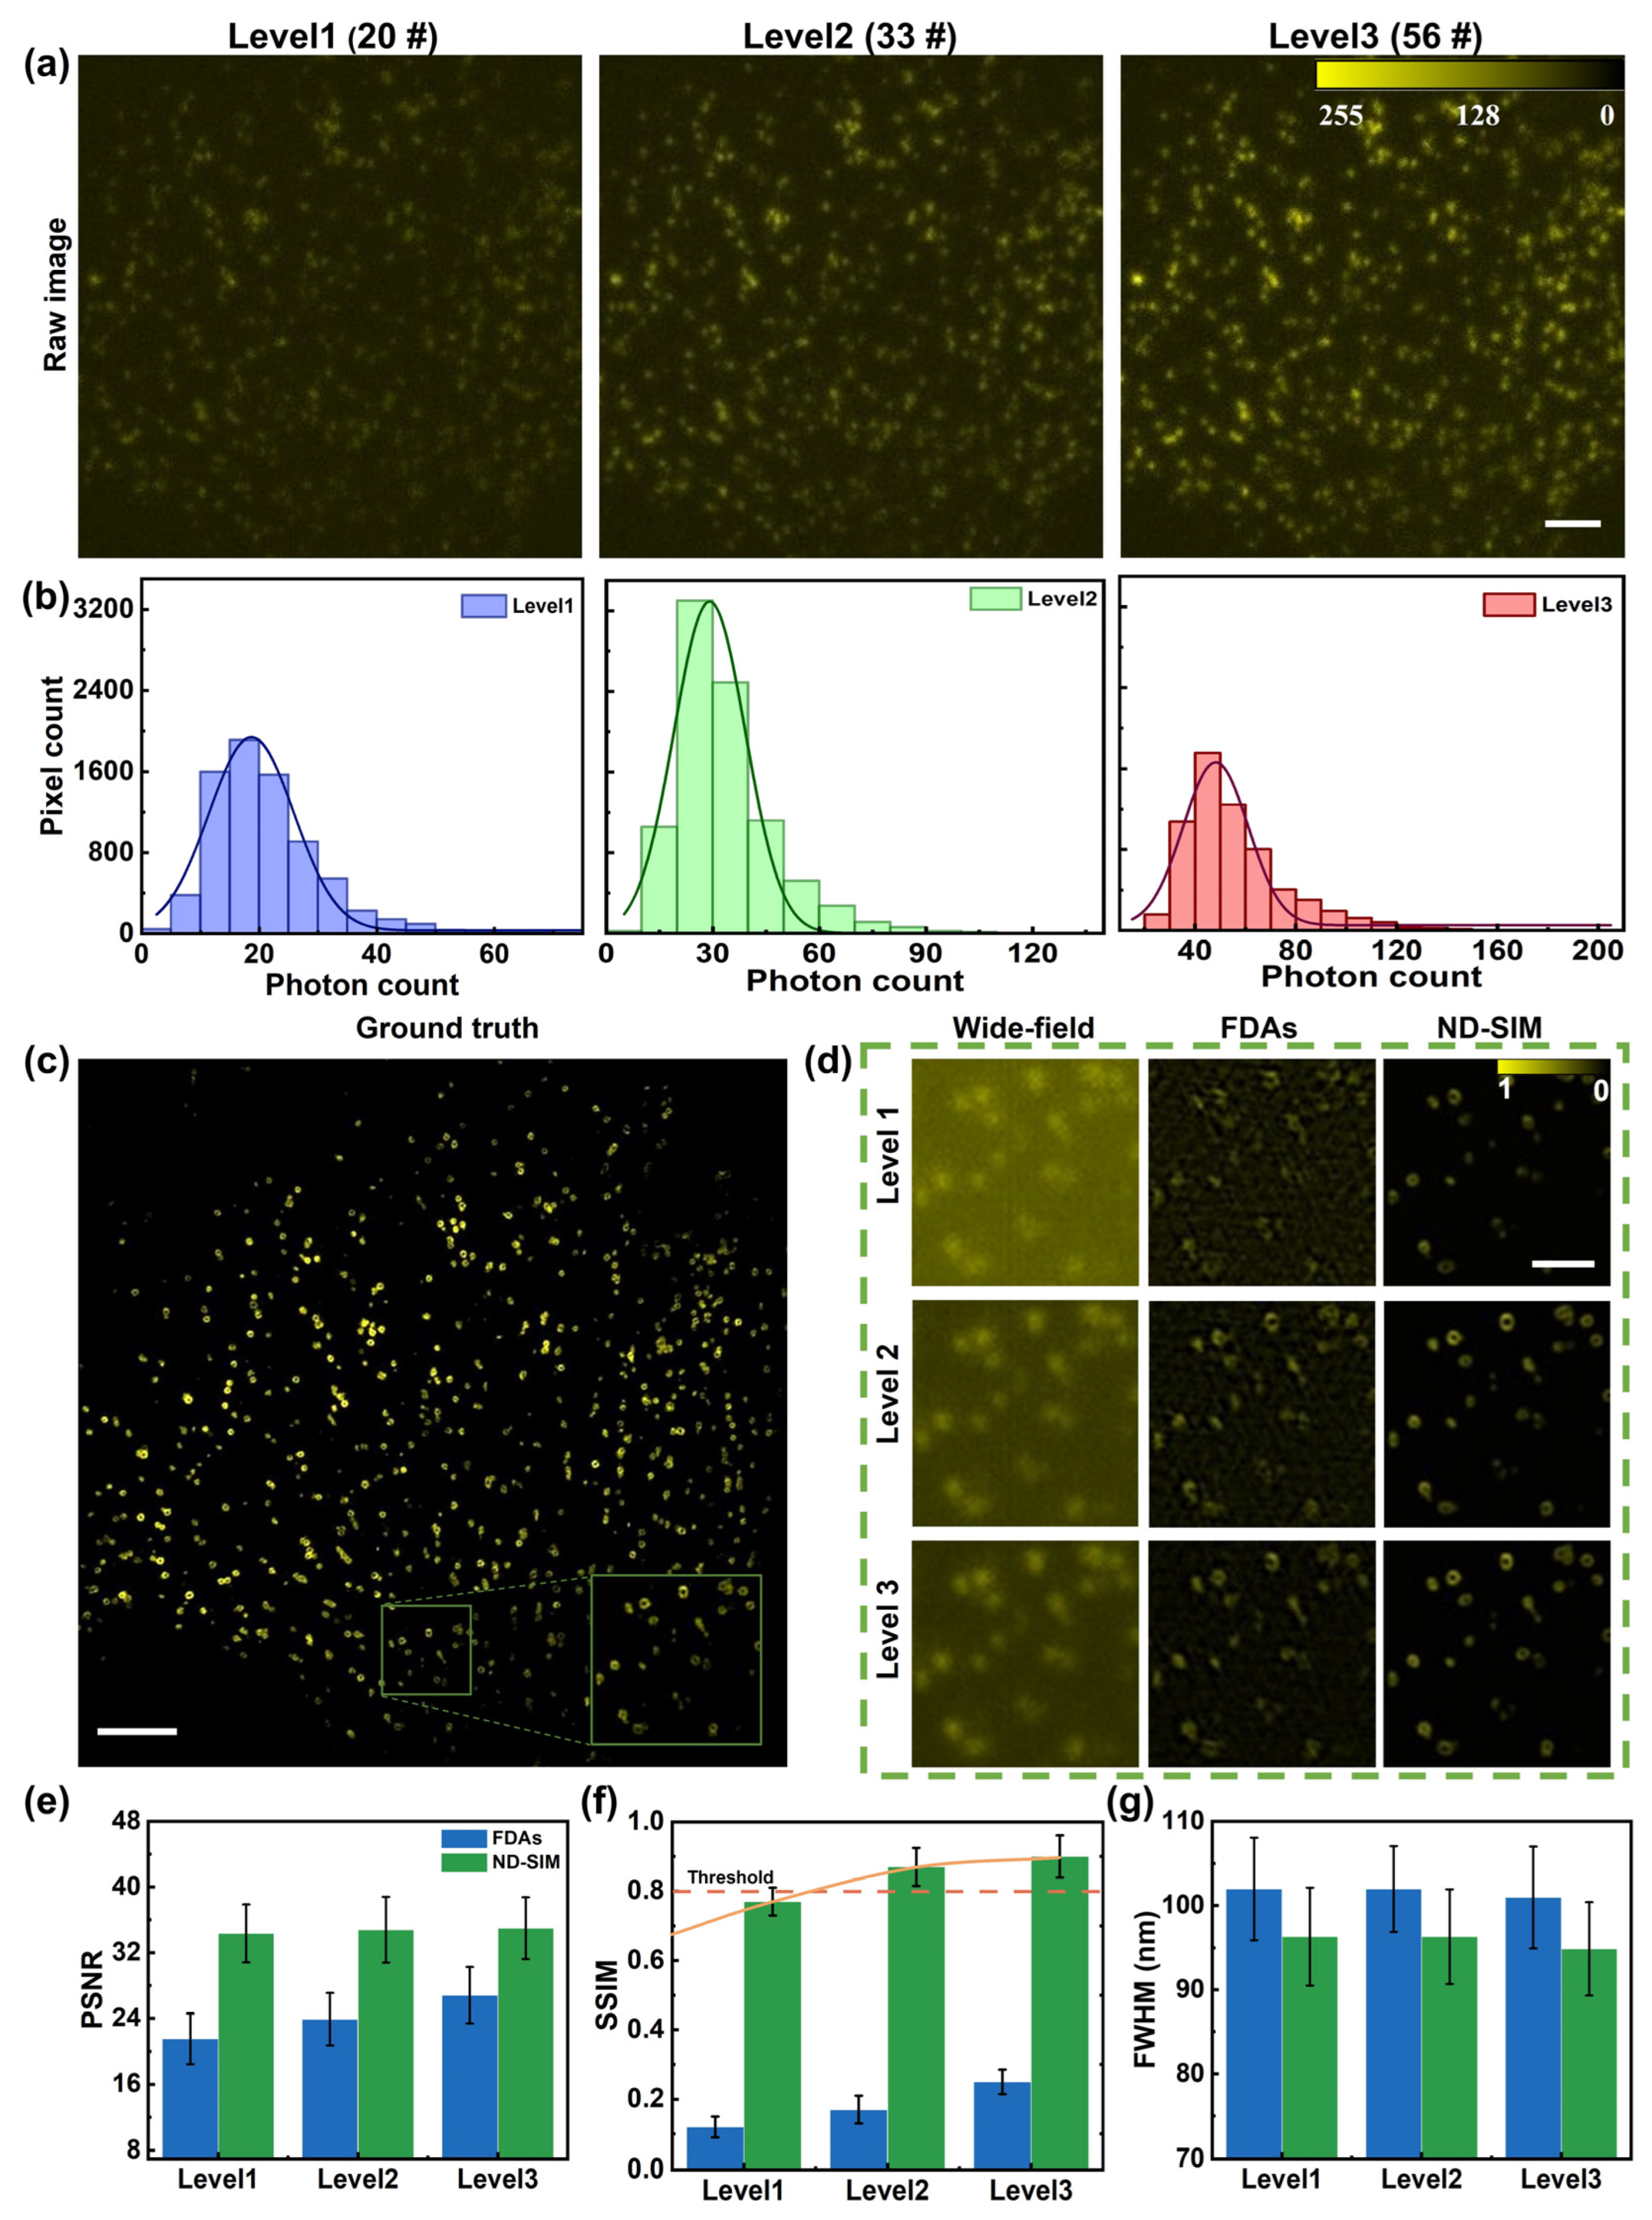
To systematically evaluate the reconstruction quality of ND-SIM at different low-photon-count levels, the effective photon counts of raw images are classified into different levels. The low-SNR raw images on ring-like CCPs from the publicly available biological image dataset BioSR are used as the input of the well-trained ND-SIM model. We follow and use the average photon count (on bio-structures) [24] to quantify the SNR level of the raw images. The raw images in Figure 3 range from 25 to 100, and they are split into three levels. The levels from 1 to 3 feature average photon counts of 24 ± 9, 39 ± 14, and 55 ± 20 (mean ± std, n = 9 (3 orientations × 3 phase shifts)). Figure 3a shows single-frame raw images as the representatives of the three levels. We also obtain the statistics of the average photon counts per pixel on sample structures, as shown in Figure 3b. Figure 3c shows a high-resolution GT-SIM image of the CCPs, and a sub-region indicated with the green box is magnified and shown with the inset in the lower-right corner. FDAs and ND-SIM were used to perform SR reconstruction for the same raw images under different brightness levels. Figure 3d shows the wide-field images (the first column) and the SR images reconstructed by FDAs (the second column) and ND-SIM (the third column) of a sub-region with different SNR levels. Compared to the wide-field image, the ND-SIM reveals a remarkably improved resolution. Notably, the ND-SIM image shows clear ring-shaped structures for CCPs. Furthermore, ND-SIM exhibits fewer artifacts and less background noise compared to the SR images reconstructed using FDAs for different brightness levels of the raw images. We further compare the performance of FDAs and ND-SIM using the criteria of peak signal-to-noise Ratio (PSNR) and structural similarity index measure (SSIM) relative to the ground truth, as shown in Figure 3e–f. The spatial resolutions (in terms of FWHM) of ND-SIM and FDAs are quantified by decorrelation analysis [28] and shown in Figure 3g. The results further verify the effective and reliable resolution improvement using our method. In general, the quality of reconstructed SIM images, evaluated by PSNR, SSIM, and spatial resolution, decreases with the reduction in the average photon number. The metric of SSIM shows a noticeable change in the image quality with a small variation in the average photon number. The trend in SSIM change with the average photon number suggests that the minimal average photon count for ND-SIM is 30 per pixel, which guarantees a generally accepted quality threshold of SSIM ≥ 80%.

Figure 3.
Comparison of FDAs and ND-SIM on SR image reconstruction at different low-photon-count levels. (a) Representative raw images of different photon count levels, which feature an averaged photon number per pixel of 20 #, 33 #, and 56 #. (b) The statistical results of the average number of photons per pixel within the sample region in (a). (c) The high-resolution GT-SIM image of the CCPs and magnified view of a sub-region are indicated with the green box. (d) Representative SR images reconstructed by the wide-field, FDAs, and ND-SIM methods. (e–g) PSNR, SSIM, and spatial resolution (FWHM) comparisons at varying signal levels for the FDAs and ND-SIM methods, n = 20. The scale bar in (a) is 1 μm, the scale bar in (c) is 3 μm, and the scale bar in (d) is 0.5 μm.
3.2. Comparison of ND-SIM with Other Existing SR Image-Denoising Methods
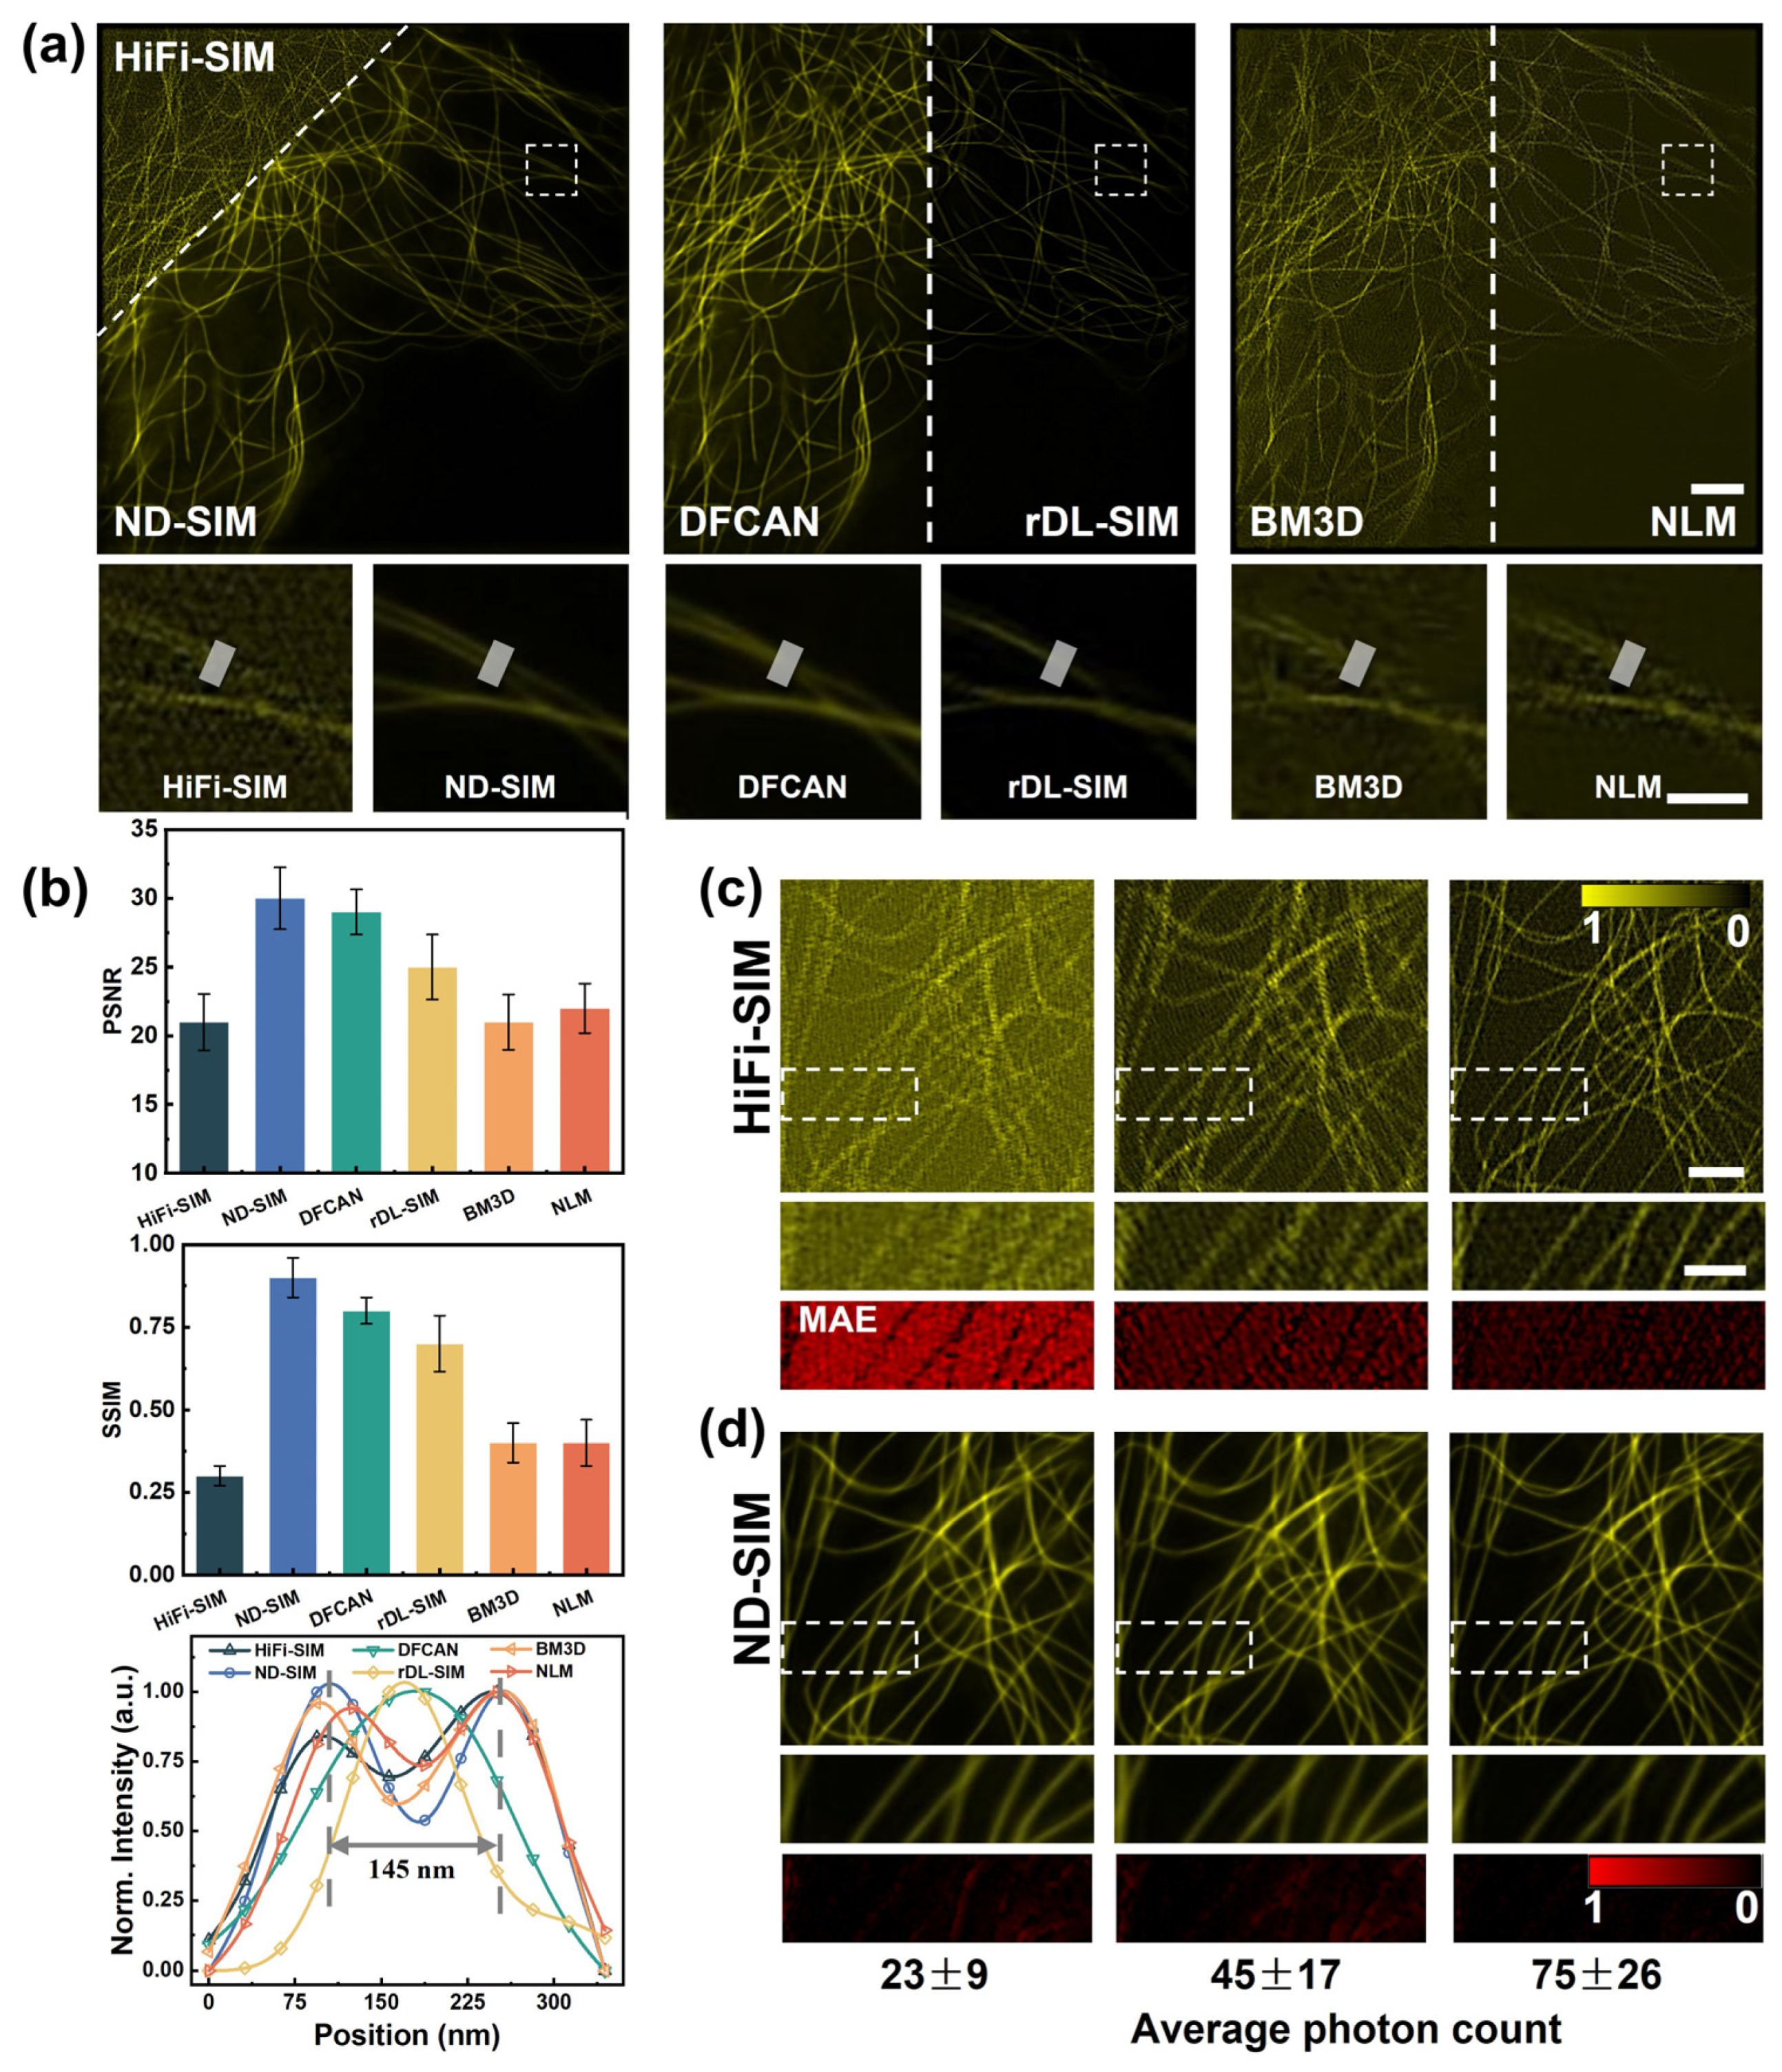
We experimentally compared ND-SIM with HiFi-SIM (without denoise processing), DFCAN, rDL-SIM, BM3D, and NLM on an SR image denoised using the recording condition of low-light excitation. HiFi-SIM obtains SR images by combining the normalized cross-correlation with a spectrum notch to estimate the illumination pattern parameters. The DFCAN exploits the difference in frequency-distinct features in the Fourier domain to obtain SR images from raw images with a low photon count. rDL-SIM incorporates the physical model of SIM into the network to denoise raw images, and the denoised raw images are reconstructed into SR images. BM3D is a state-of-the-art image-denoising method from the field of computer vision, which is based on a collaborative Wiener filtering strategy [29]. Non-local means [30] (NLM) based on machine learning (ML) is also an effective denoising algorithm, which utilizes a certain similarity to perform the weighted averaging of pixels to achieve denoising. We used BM3D and NLM to denoise the noisy SR-SIM images reconstructed by HiFi-SIM.
During this work, we utilized HiFi-SIM to obtain the noisy SR-SIM images from raw images with low photon counts. Then, ND-SIM was used to denoise the SR-SIM images reconstructed by HiFi-SIM. For better comparison, we used the well-trained DFCAN model, rDL-SIM model [23], BM3D, and NLM to obtain the noise-free SR-SIM image on microtubules in COS-7 cells, of which the average photon count is 43 ± 16 (mean ± std, n = 9). The reconstruction results of the HiFi-SIM, ND-SIM, DFCAN, rDL-SIM, BM3D, and NLM modalities are juxtaposed in Figure 4a. Subsequently, the white close-up in (a) is magnified and compared in the second row of Figure 4a for different approaches. The comparison apparently shows that the ND-SIM images have the finest structures and minimal noise, benefiting from the denoise and artifact removal module in ND-SIM. ND-SIM is superior to DFCAN and rDL-SIM in resolving fine structures of microtubules. BM3D and NLM denoising methods cannot recover the lost information and cannot completely remove the noise and artifacts in the noisy SR-SIM image compared to ND-SIM. In addition, we quantitatively assessed the quality of HiFi-SIM, ND-SIM, DFCAN, rDL-SIM, DM3D, and NLM relative to the GT-SIM. The evaluation of the ND-SIM in terms of PSNR, SSIM, and intensity profile values in Figure 4b shows a significant improvement compared to other methods. For both metrics, ND-SIM has the highest scores with the PSNR and SSIM while the traditional denoising methods, such as BM3D and NLM, do not show significant improvement with respect to HiFi-SIM.

Figure 4.
Comparison of different approaches to SR microtubule image denoising. (a) SR images of microtubules by HiFi-SIM, ND-SIM, DFCAN, rDL-SIM, BM3D, and NLM from the same noisy raw images. Magnified view of the close-up in (a) for different reconstruction approaches in the second row of Figure 4a. Scale bar: 3 μm; 1 μm (zoom-in). (b) Quantitative comparison of the performance among the above methods using PSNR, SSIM, and intensity profiles, n = 20. The normalized intensity profiles of microtubules marked with the white lines in the second row of Figure 4a, averaging 16 pixels along the width direction. (c,d) Representative HiFi-SIM and ND-SIM denoised images of different signal levels. Magnified view in (c,d) in the second row of Figure 4c and Figure 4d, respectively. The MAE maps of the zoomed-in region are provided in the third row of Figure 4c and Figure 4d, respectively. Scale bar: 1 μm; 1 μm (zoom-in).
Next, we also validated the robustness of ND-SIM on MT samples with different signal levels, as shown in Figure 4c,d. The average photon counts of raw images at different signal levels were 23 ± 9, 45 ± 17, and 75 ± 26 (mean ± std, n = 9). For better observing and comparing the SR images, the sub-regions (indicated with the white boxes) are magnified and shown in the second rows of Figure 4c and Figure 4d, respectively. The mean-absolute-error (MAE) maps of the zoomed-in region reveal the difference between ND-SIM and HiFi-SIM images relative to the GT-SIM images, as shown in the third row of Figure 4c,d. We demonstrated that a well-trained ND-SIM model is applicable with different low-SNR inputs and significantly outperforms the conventional SIM reconstruction algorithm in different low-signal-level conditions.
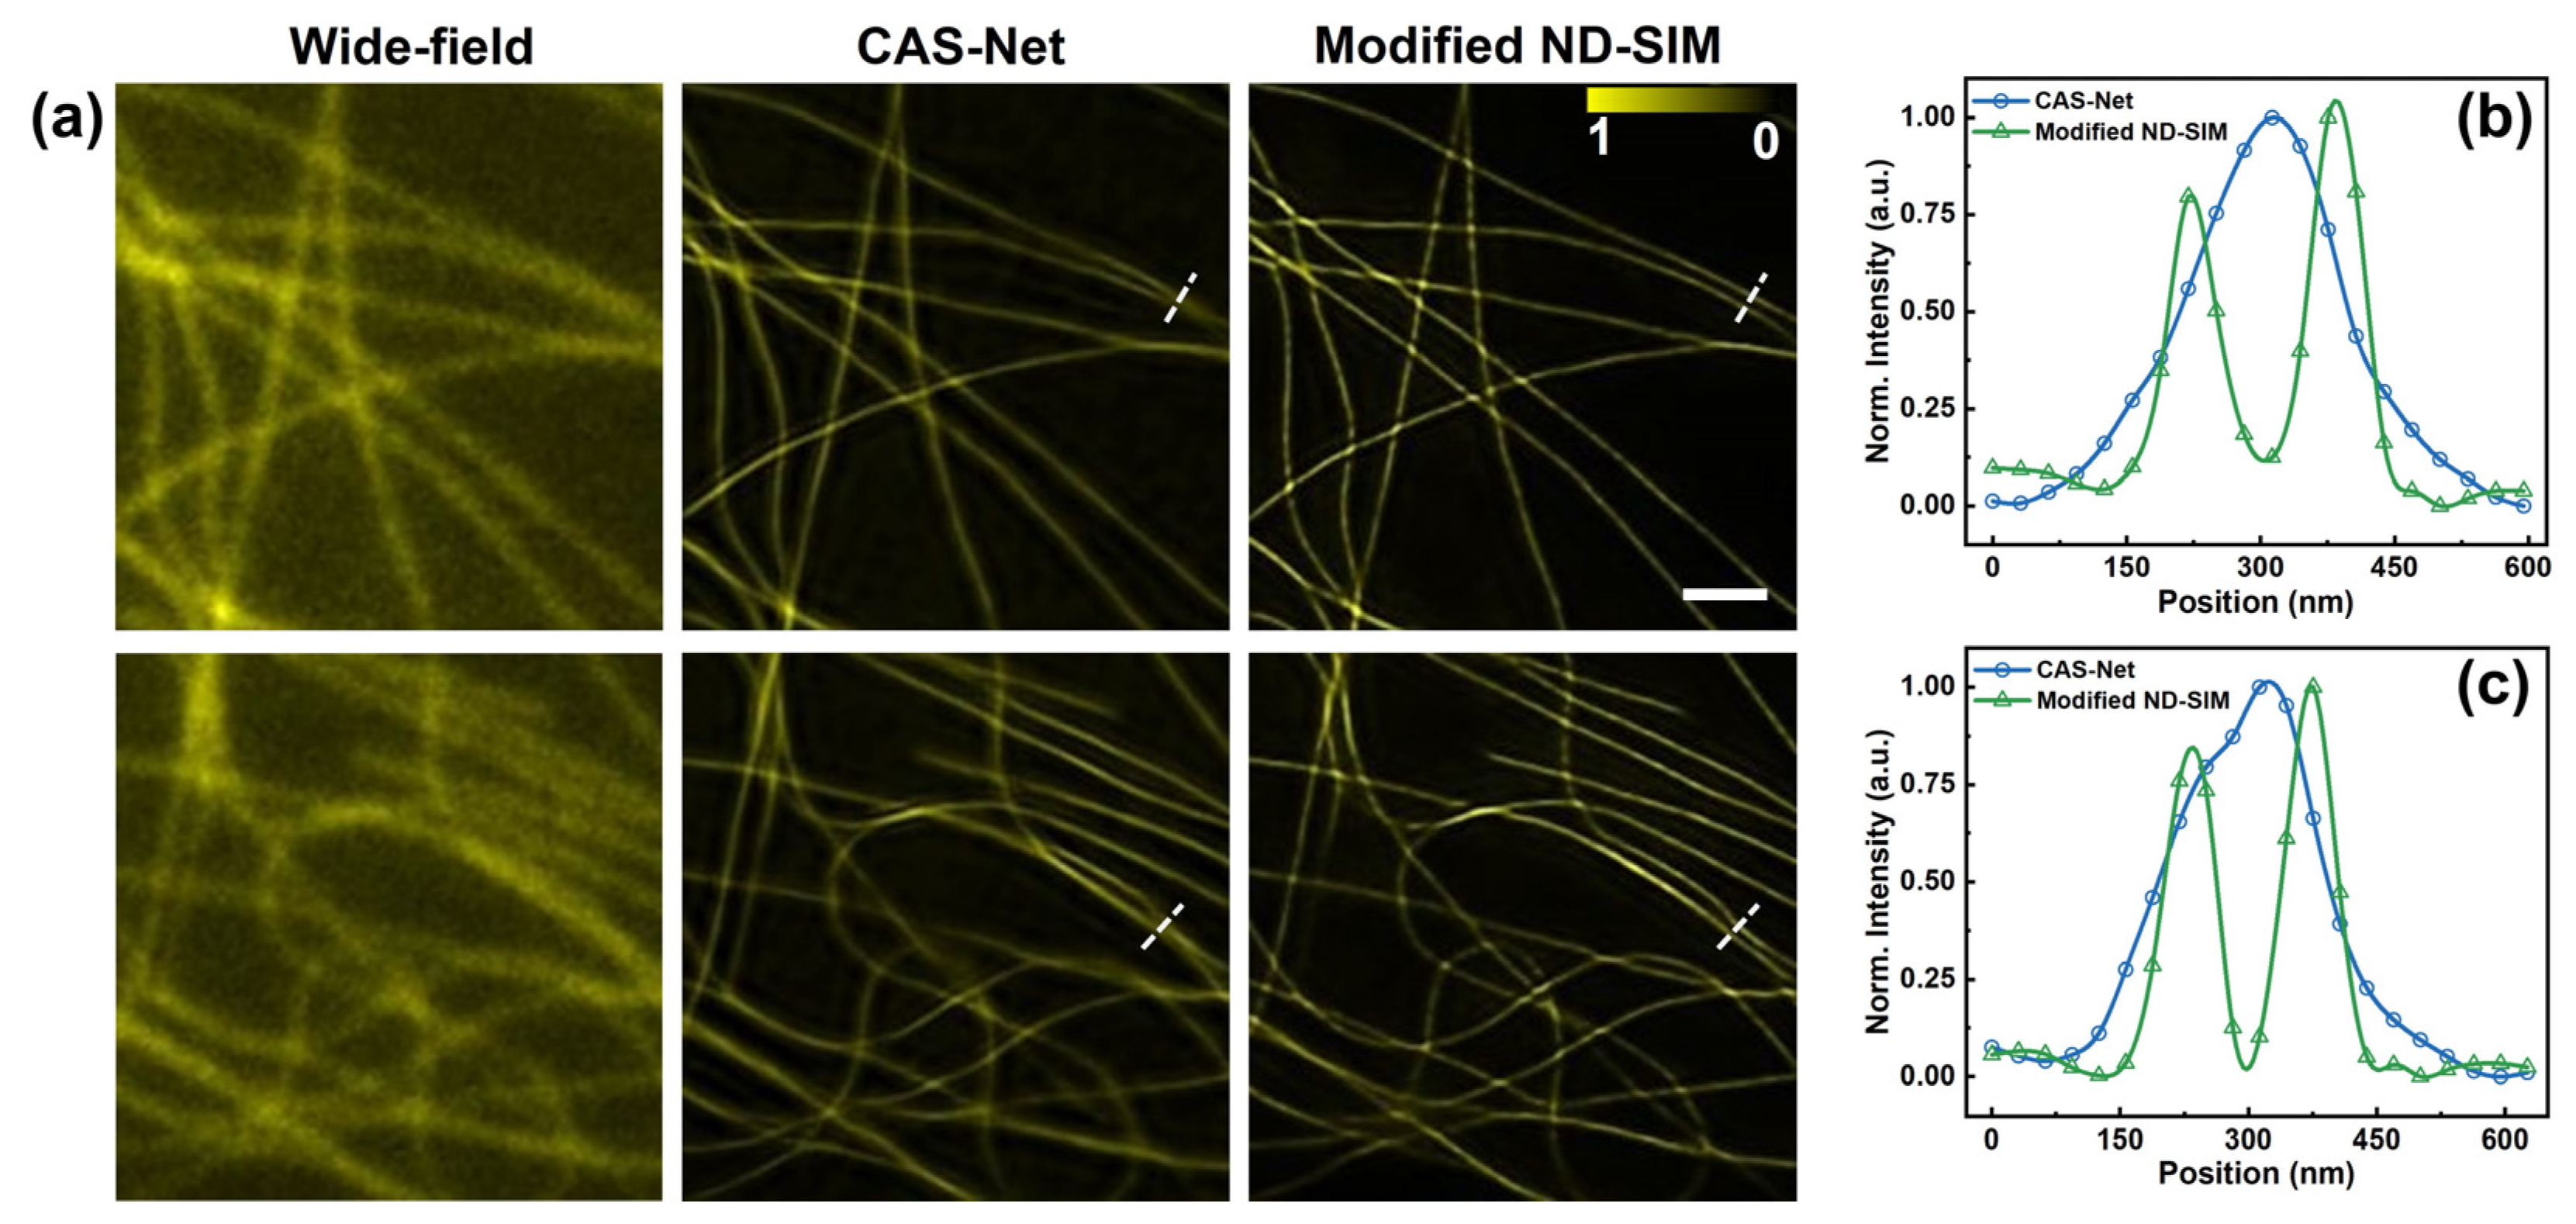
To follow up, we demonstrate the SR image of ND-SIM after being enhanced by an additional enhancing subnet [27]. For simplicity, we define the ND-SIM assisted with the enhancing subnet as a modified ND-SIM. We further systematically evaluated the images of wide-field, modified ND-SIM and CAS-Net in Figure 5a. These images were reconstructed using low-SNR raw images of microtubules, featuring an average photon count of 43 ± 16 (mean ± std, n = 9). In general, the CAS-Net and modified ND-SIM modes have significantly enhanced spatial resolutions compared to the wide-field image. It clearly shows that the output images generated by modified ND-SIM have higher spatial resolution compared to the CAS-Net. This conclusion is further confirmed by analyzing the line profiles crossing two neighboring microtubules in Figure 5b,c, where the blue and green curves represent CAS-Net and modified ND-SIM modes. The two microtubules are clearly distinguishable in the modified ND-SIM image whereas they are not resolvable in the CAS-Net image.

Figure 5.
Image reconstruction of microtubules using modified ND-SIM after being incorporated by an enhancing subnet of CAS-Net. (a) Wide-field, CAS-Net, and modified ND-SIM images of two representative areas (up and down) of the sample. (b,c) The normalized intensity profiles along the dash lines in (a). The scale bar in (a) is 1 μm.
3.3. ND-SIM Reconstruction for Different Subcellular Organelles
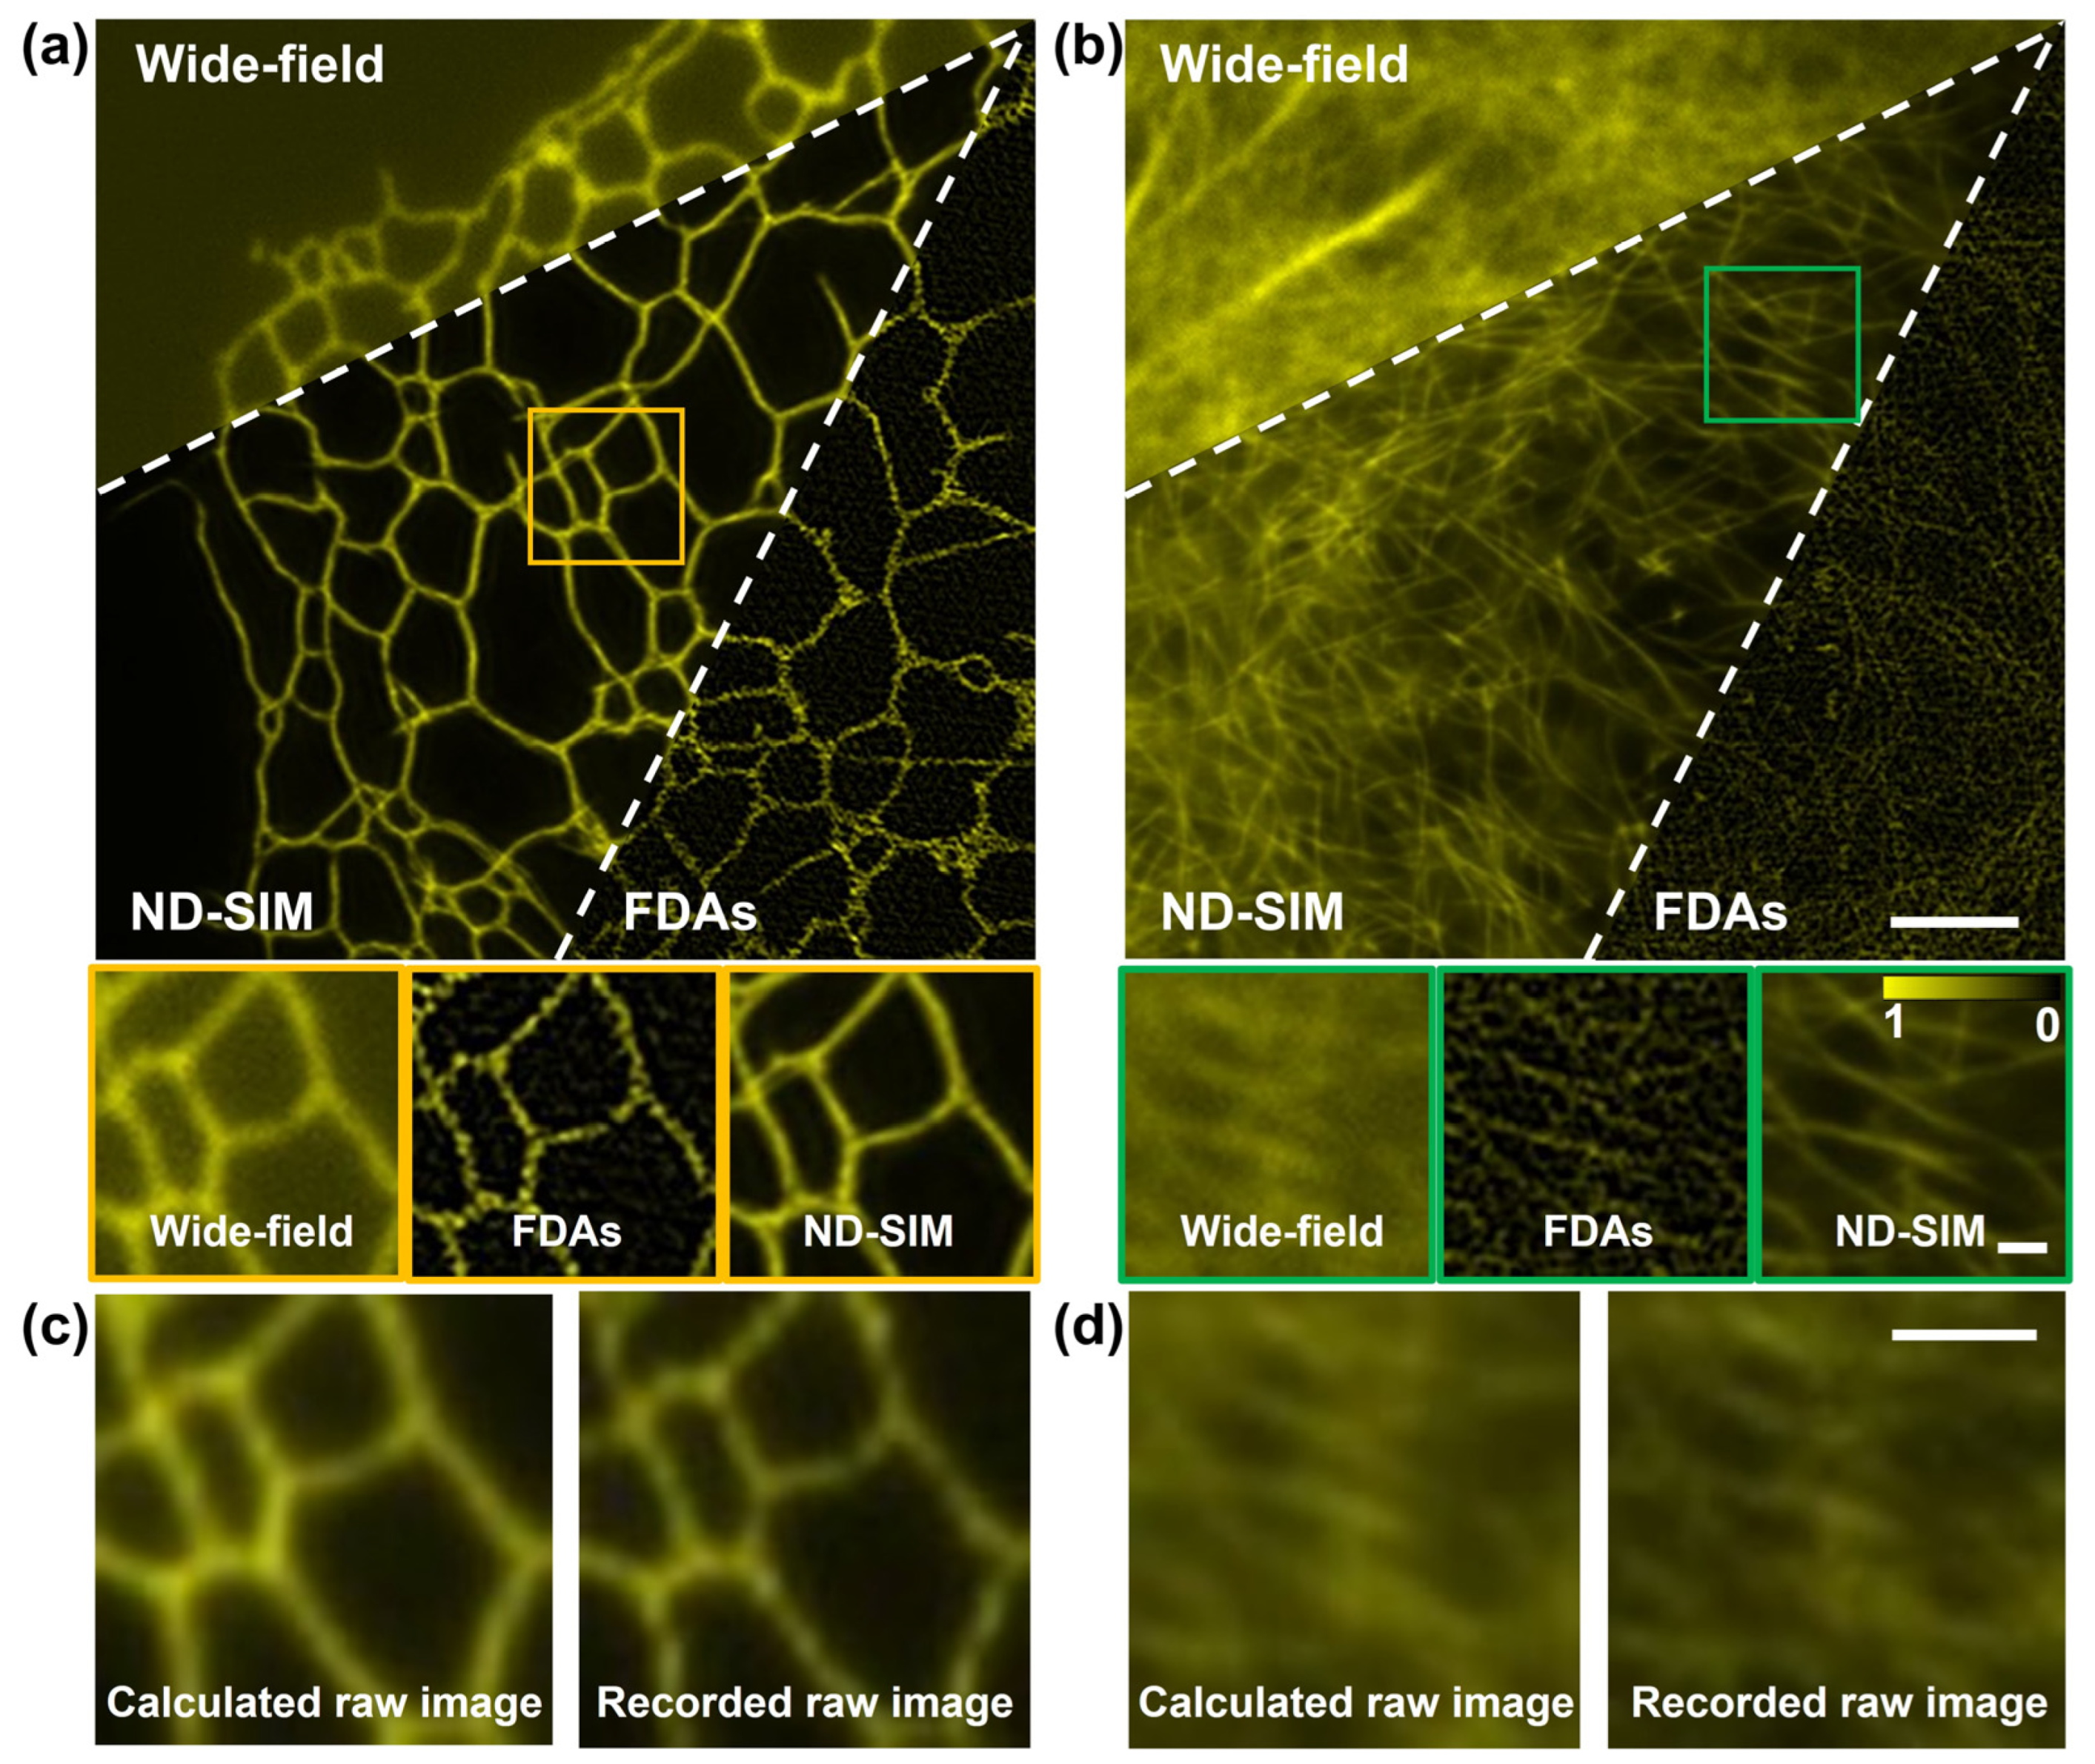
We also verified the performance of ND-SIM in SR image reconstruction for diverse structural samples. For this purpose, the training dataset was generated using two distinct sample types, namely clathrin-coated pits and microtubules. To assess the generality of our proposed ND-SIM, we conducted SR image reconstruction on F-actin filaments and ER samples, which are not included in the training dataset. Figure 6a,b show the results of F-actin filaments and ER, reconstructed using the wide-field, FDA, and ND-SIM modalities. The yellow and green boxes are zoomed in upon and shown with the insets at the bottom of (a) and (b). In the ND-SIM image, the F-actin and ER show fine and continuous structures in a clean background. By contrast, these structures show artifacts in the FDA image. Furthermore, as shown in the magnified insets of Figure 6b, dense F-actin cytoskeletons are better resolved in the ND-SIM images compared to the FDA images. This conclusion is further confirmed by comparing the recorded raw image (the ground truth, obtained with the SI with an azimuth of 0° and phase shifts of 0) and the calculated raw image using the ND-SIM-reconstructed image and SIM imaging physical model, as shown in Figure 6c,d. In conclusion, ND-SIM exhibits its adaptability to diverse structural samples that do not appear in the training dataset.
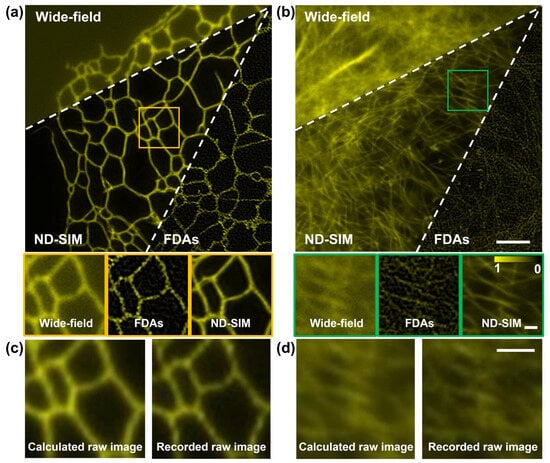
Figure 6.
Test of ND-SIM and FDAs for SR image reconstruction of different structures. (a,b) wide-field, FDA, and ND-SIM images of the ER and F-actin filaments. The second row of (a,b) is the magnified boxes in (a,b). (c,d) The recorded raw image (left) and the calculated raw image (right) obtained using SIM imaging physical model of ER and F-actin filaments. The scale bar in the first row of (b) is 3 μm, the scale bar in the second row of (b) is 0.5 μm, and the scale bar in (d) is 1 μm.
4. Discussion
In this work, we presented a denoise network (entitled ND-SIM) to obtain a denoised SR image for SIM under low-light exposure. ND-SIM trains the denoiser with noisy SR-SIM images reconstructed using FDAs and ground truth SR images obtained with a high-light-exposure recording. Eventually, the experimental results demonstrated that the ND-SIM could obtain super-resolution SIM images with less noise and fewer artifacts in extremely low-light conditions (average photon count per pixel ranges from 25 to 100). Compared with the end-to-end DFCAN approach, the ND-SIM, combining FDAs for initial reconstruction and RCAN for denoising, yields a more precise reconstruction of fine structures and low noise levels. Furthermore, the ND-SIM shows a good performance across diverse structural samples. We envisage that ND-SIM will be widely used to reconstruct SR images for different biological samples.
Author Contributions
X.L. and J.L. set up the neuron network and performed the data analysis. S.A., J.L., J.Z., J.L., Y.M., K.W., L.S. and K.Z. contributed to the data analysis. X.L. wrote the manuscript. P.G. supervised the project and wrote the manuscript with X.L. All authors have read and agreed to the published version of the manuscript.
Funding
The authors acknowledge the support from the National Key Research and Development Program of China (2021YFF0700303); the National Natural Science Foundation of China (NSFC 62075177, 62105251, 12104354, 62305259); the Key Research and Development Program of Shaanxi (2024GH-ZDXM-05); the Natural Science Foundation of Shaanxi Province (2023JCQN0731, 2023JCYB518); the Natural Science Basic Research Program of Shaanxi (No.2023-JC-QN-0765); and the Fundamental Research Funds for the Central Universities (QTZX23024, QTZX23013, XJS222803, QTZX23008, ZYTS24093 and XJSJ23137).
Institutional Review Board Statement
Not applicable.
Informed Consent Statement
Not applicable.
Data Availability Statement
Dataset available on request from the authors.
Conflicts of Interest
The authors declare no conflicts of interest.
References
- Moore, A.S.; Coscia, S.M.; Simpson, C.L.; Ortega, F.E.; Wait, E.C.; Heddleston, J.M.; Nirschl, J.J.; Obara, C.J.; Guedes-Dias, P.; Boecker, C.A. Actin cables and comet tails organize mitochondrial networks in mitosis. Nature 2021, 591, 659–664. [Google Scholar] [CrossRef] [PubMed]
- Phillips, M.J.; Voeltz, G.K. Structure and function of ER membrane contact sites with other organelles. Nat. Rev. Mol. Cell Biol. 2016, 17, 69–82. [Google Scholar] [CrossRef] [PubMed]
- Prinz, W.A.; Toulmay, A.; Balla, T. The functional universe of membrane contact sites. Nat. Rev. Mol. Cell Biol. 2020, 21, 7–24. [Google Scholar] [CrossRef] [PubMed]
- Heintzmann, R.; Cremer, C.G. Laterally modulated excitation microscopy: Improvement of resolution by using a diffraction grating. In Proceedings of the Optical Biopsies and Microscopic Techniques III; Society of Photo Optical: Bellingham, WC, USA, 1999; pp. 185–196. [Google Scholar]
- Blom, H.; Widengren, J. Stimulated emission depletion microscopy. Chem. Rev. 2017, 117, 7377–7427. [Google Scholar] [CrossRef] [PubMed]
- Rego, E.H.; Shao, L.; Macklin, J.J.; Winoto, L.; Johansson, G.A.; Kamps-Hughes, N.; Davidson, M.W.; Gustafsson, M.G. Nonlinear structured-illumination microscopy with a photoswitchable protein reveals cellular structures at 50-nm resolution. Proc. Natl. Acad. Sci. USA 2012, 109, E135–E143. [Google Scholar] [CrossRef] [PubMed]
- Gao, P.; Prunsche, B.; Zhou, L.; Nienhaus, K.; Nienhaus, G.U. Background suppression in fluorescence nanoscopy with stimulated emission double depletion. Nat. Photonics 2017, 11, 163–169. [Google Scholar] [CrossRef]
- Heintzmann, R.; Huser, T. Super-resolution structured illumination microscopy. Chem. Rev. 2017, 117, 13890–13908. [Google Scholar] [CrossRef] [PubMed]
- Rust, M.J.; Bates, M.; Zhuang, X. Sub-diffraction-limit imaging by stochastic optical reconstruction microscopy (STORM). Nat. Methods 2006, 3, 793–796. [Google Scholar] [CrossRef] [PubMed]
- Klar, T.A.; Jakobs, S.; Dyba, M.; Egner, A.; Hell, S.W. Fluorescence microscopy with diffraction resolution barrier broken by stimulated emission. Proc. Natl. Acad. Sci. USA 2000, 97, 8206–8210. [Google Scholar] [CrossRef]
- Huang, X.; Fan, J.; Li, L.; Liu, H.; Wu, R.; Wu, Y.; Wei, L.; Mao, H.; Lal, A.; Xi, P. Fast, long-term, super-resolution imaging with Hessian structured illumination microscopy. Nat. Biotechnol. 2018, 36, 451–459. [Google Scholar] [CrossRef]
- Markwirth, A.; Lachetta, M.; Mönkemöller, V.; Heintzmann, R.; Hübner, W.; Huser, T.; Müller, M. Video-rate multi-color structured illumination microscopy with simultaneous real-time reconstruction. Nat. Commun. 2019, 10, 4315. [Google Scholar] [CrossRef] [PubMed]
- Chen, X.; Zhong, S.; Hou, Y.; Cao, R.; Wang, W.; Li, D.; Dai, Q.; Kim, D.; Xi, P. Superresolution structured illumination microscopy reconstruction algorithms: A review. Light Sci. Appl. 2023, 12, 172. [Google Scholar] [CrossRef]
- Müller, M.; Mönkemöller, V.; Hennig, S.; Hübner, W.; Huser, T. Open-source image reconstruction of super-resolution structured illumination microscopy data in ImageJ. Nat. Commun. 2016, 7, 10980. [Google Scholar] [CrossRef] [PubMed]
- Lal, A.; Shan, C.; Xi, P. Structured illumination microscopy image reconstruction algorithm. IEEE J. Sel. Top. Quantum Electron. 2016, 22, 50–63. [Google Scholar] [CrossRef]
- Wen, G.; Li, S.; Wang, L.; Chen, X.; Sun, Z.; Liang, Y.; Jin, X.; Xing, Y.; Jiu, Y.; Tang, Y. High-fidelity structured illumination microscopy by point-spread-function engineering. Light Sci. Appl. 2021, 10, 70. [Google Scholar] [CrossRef] [PubMed]
- Qian, J.; Cao, Y.; Bi, Y.; Wu, H.; Liu, Y.; Chen, Q.; Zuo, C. Structured illumination microscopy based on principal component analysis. ELight 2023, 3, 4. [Google Scholar] [CrossRef]
- Fan, J.; Huang, X.; Li, L.; Tan, S.; Chen, L. A protocol for structured illumination microscopy with minimal reconstruction artifacts. Biophys. Rep. 2019, 5, 80–90. [Google Scholar] [CrossRef]
- Hoffman, D.P.; Betzig, E. Tiled reconstruction improves structured illumination microscopy. BioRxiv 2020, BioRxiv:2020.01.06.895318. [Google Scholar]
- Zhao, W.; Zhao, S.; Li, L.; Huang, X.; Xing, S.; Zhang, Y.; Qiu, G.; Han, Z.; Shang, Y.; Sun, D.E.; et al. Sparse deconvolution improves the resolution of live-cell super-resolution fluorescence microscopy. Nat. Biotechnol. 2022, 40, 606–617. [Google Scholar] [CrossRef] [PubMed]
- Jin, L.; Liu, B.; Zhao, F.; Hahn, S.; Dong, B.; Song, R.; Elston, T.C.; Xu, Y.; Hahn, K.M. Deep learning enables structured illumination microscopy with low light levels and enhanced speed. Nat. Commun. 2020, 11, 1934. [Google Scholar] [CrossRef] [PubMed]
- Christensen, C.N.; Ward, E.N.; Lu, M.; Lio, P.; Kaminski, C.F. ML-SIM: Universal reconstruction of structured illumination microscopy images using transfer learning. Biomed. Opt. Express 2021, 12, 2720–2733. [Google Scholar] [CrossRef] [PubMed]
- Qiao, C.; Li, D.; Liu, Y.; Zhang, S.; Liu, K.; Liu, C.; Guo, Y.; Jiang, T.; Fang, C.; Li, N. Rationalized deep learning super-resolution microscopy for sustained live imaging of rapid subcellular processes. Nat. Biotechnol. 2023, 41, 367–377. [Google Scholar] [CrossRef] [PubMed]
- Qiao, C.; Li, D.; Guo, Y.; Liu, C.; Jiang, T.; Dai, Q.; Li, D. Evaluation and development of deep neural networks for image super-resolution in optical microscopy. Nat. Methods 2021, 18, 194–202. [Google Scholar] [CrossRef] [PubMed]
- Rahaman, N.; Baratin, A.; Arpit, D.; Draxler, F.; Lin, M.; Hamprecht, F.; Bengio, Y.; Courville, A. On the spectral bias of neural networks. In International Conference on Machine Learning; PMLR: London, China, 2019; pp. 5301–5310. [Google Scholar]
- Zhang, Y.; Li, K.; Li, K.; Wang, L.; Zhong, B.; Fu, Y. Image super-resolution using very deep residual channel attention networks. In Proceedings of the European Conference on Computer Vision (ECCV), Munich, Germany, 8–14 September 2018; pp. 286–301. [Google Scholar]
- Liu, X.; Li, J.; Li, J.; Ali, N.; Zhao, T.; An, S.; Zheng, J.; Ma, Y.; Qian, J.; Zuo, C. A cascaded deep network for reconstruction of structured illumination microscopy. Opt. Laser Technol. 2024, 170, 110224. [Google Scholar] [CrossRef]
- Descloux, A.; Grußmayer, K.S.; Radenovic, A. Parameter-free image resolution estimation based on decorrelation analysis. Nat. Methods 2019, 16, 918–924. [Google Scholar] [CrossRef] [PubMed]
- Dabov, K.; Foi, A.; Katkovnik, V.; Egiazarian, K. Image denoising by sparse 3-D transform-domain collaborative filtering. IEEE Trans. Image Process. 2007, 16, 2080–2095. [Google Scholar] [CrossRef]
- Zhang, Y.; Zhu, Y.; Nichols, E.; Wang, Q.; Zhang, S.; Smith, C.; Howard, S. A poisson-gaussian denoising dataset with real fluorescence microscopy images. In Proceedings of the IEEE/CVF Conference on Computer Vision and Pattern Recognition, Long Beach, CA, USA, 15–20 June 2019; pp. 11710–11718. [Google Scholar]

Disclaimer/Publisher’s Note: The statements, opinions and data contained in all publications are solely those of the individual author(s) and contributor(s) and not of MDPI and/or the editor(s). MDPI and/or the editor(s) disclaim responsibility for any injury to people or property resulting from any ideas, methods, instructions or products referred to in the content. |
© 2024 by the authors. Licensee MDPI, Basel, Switzerland. This article is an open access article distributed under the terms and conditions of the Creative Commons Attribution (CC BY) license (https://creativecommons.org/licenses/by/4.0/).