Article

Dynamic Measurement of Flowing Microparticles in Microfluidics Using Pulsed Modulated Digital Holographic Microscopy

1
School of Physics, Xidian University, Xi’an 710071, China
2
Key Laboratory of Optoelectronic Perception of Complex Environment, Ministry of Education, Xi’an 710071, China
3
Engineering Research Center of Functional Nanomaterials, Universities of Shaanxi Province, Xi’an 710071, China
4
Laboratory of Photonics Technology for Information, School of Electronic Science and Engineering, Xi’an Jiaotong University, Xi’an 710049, China
*
Authors to whom correspondence should be addressed.
These authors contributed equally to this work.
Photonics 2025, 12(5), 411; https://doi.org/10.3390/photonics12050411
Submission received: 13 February 2025 / Revised: 21 March 2025 / Accepted: 21 April 2025 / Published: 24 April 2025
(This article belongs to the Special Issue Advanced Quantitative Phase Microscopy: Techniques and Applications)

Abstract

:
We propose a pulsed modulated digital holographic microscopy (PM-DHM) technique for the dynamic measurement of flowing microparticles in microfluidic systems. By digitally tuning the pulse width and the repetition rate of a laser source within a single-frame exposure, this method enables the recording of multiple images of flowing microparticles at different time points within a single hologram, allowing the quantification of velocity and acceleration. We demonstrate the feasibility of PM-DHM by measuring the velocity, acceleration, and forces exerted on PMMA microspheres and red blood cells flowing in microfluidic chips. Compared to traditional frame-sampling-based imaging methods, this technique has a much higher time resolution (in a range of microseconds) that is limited only by the pulse duration. This method demonstrates significant potential for high-throughput label-free flow cytometry detection and offers promising applications in drug development and cell analysis.

1. Introduction

In recent years, the integration of digital holographic microscopy (DHM) with microfluidics has emerged as a powerful technique for the rapid detection of biological cell morphology and the acquisition of multidimensional dynamic information [1,2,3,4,5]. DHM, based on holographic principles, uses coherent illumination to illuminate samples and a camera to capture the interference pattern generated between the object and reference beams. This interference pattern allows for the reconstruction of both amplitude and phase information, resulting in a three-dimensional image of the microscopic object. The advantages of DHM lie on its non-invasive, auto-focus 3D imaging capability, which enables the observation of dynamic microscopic particles over extended periods without disrupting the natural state of the sample [6,7]. Over the past two decades, DHM has become an essential tool for quantitative phase imaging of biological and non-biological samples, providing non-contact, label-free measurements [5,8,9,10,11]. Its applications have proliferated across various fields, driven by advancements in high-performance image sensors and ultrashort pulse lasers, which have significantly enhanced DHM’s performance.
With the advent of high-performance image sensors and ultrashort pulse lasers, various new types of DHMs have been continuously developed and the performance and capabilities of DHM have been significantly enhanced [12,13,14,15,16,17]. Meanwhile, microfluidic technology using miniaturized devices allows for the manipulation and inspection of extremely small volumes of fluid (typically ranging from milliliters to picoliters), inviting broad applications in chemistry, biology, and medical research, including molecular diagnostics, biofilms, analyte detection, and in vitro observation of cancer cell behavior [18,19,20,21,22,23,24,25,26]. When synergistically combined with DHM, microfluidics enables precise control of the microfluidic environment, allowing researchers to simulate and observe cellular responses under conditions close to physiological reality. This integrated approach is particularly well-suited for label-free, dynamic 3D imaging studies of live cells. For instance, in the study of microcirculatory dynamics in biological blood flow, the adhesion of blood cells to the blood vessel wall during flow plays a crucial role in cellular function [27,28,29,30]. Nevertheless, traditional fluorescence flow cytometry often requires large volumes of samples and reagents, which is both costly and demands complex equipment [31]. Thus, the integration of DHM with microfluidics presents an optimal solution for obtaining comprehensive multidimensional dynamic information about biological cell fluids in a label-free manner.
In the context of microscopy, capturing dynamic events using cameras and lasers introduces several challenges, including motion blur, insufficient illumination, and frame rate limitation. Motion blur arises when objects move during a long exposure time [32,33,34,35,36]. Although decreasing the camera’s exposure time can reduce blur, it will also increase image noise and reduce image contrast. Traditional image acquisition techniques often necessitate capturing multiple consecutive frames to record dynamics at different time points, such as particle tracking velocimetry or dual-beam phase correlation spectroscopy [37,38,39,40]. However, conventional sensors, which often have a frame rate below 1 kilohertz, may fall short in capturing fast dynamics. Additionally, real-time imaging of a fast process can also face other hardware limitations, including data transmission, storage, and power supply constraints.
To address these challenges, we have developed a novel pulsed modulated digital holographic microscopy (PM-DHM) technique for the real-time measurement of flowing microparticles in microfluidics. By digitally modulating the laser to flash multiple times within a single-frame exposure, this method records multiple images of flowing microparticles at different time points within a single hologram. Both the velocity and acceleration can be accessed by analyzing the hologram. We applied PM-DHM to flowing PMMA (polymethyl methacrylate) microspheres and red blood cells in microfluidic chips, quantifying their velocity, acceleration, and forces. Compared to traditional multi-frame imaging methods, this technique circumvents camera frame rate limitations and eliminates the need for high-speed cameras.

2. Materials and Methods

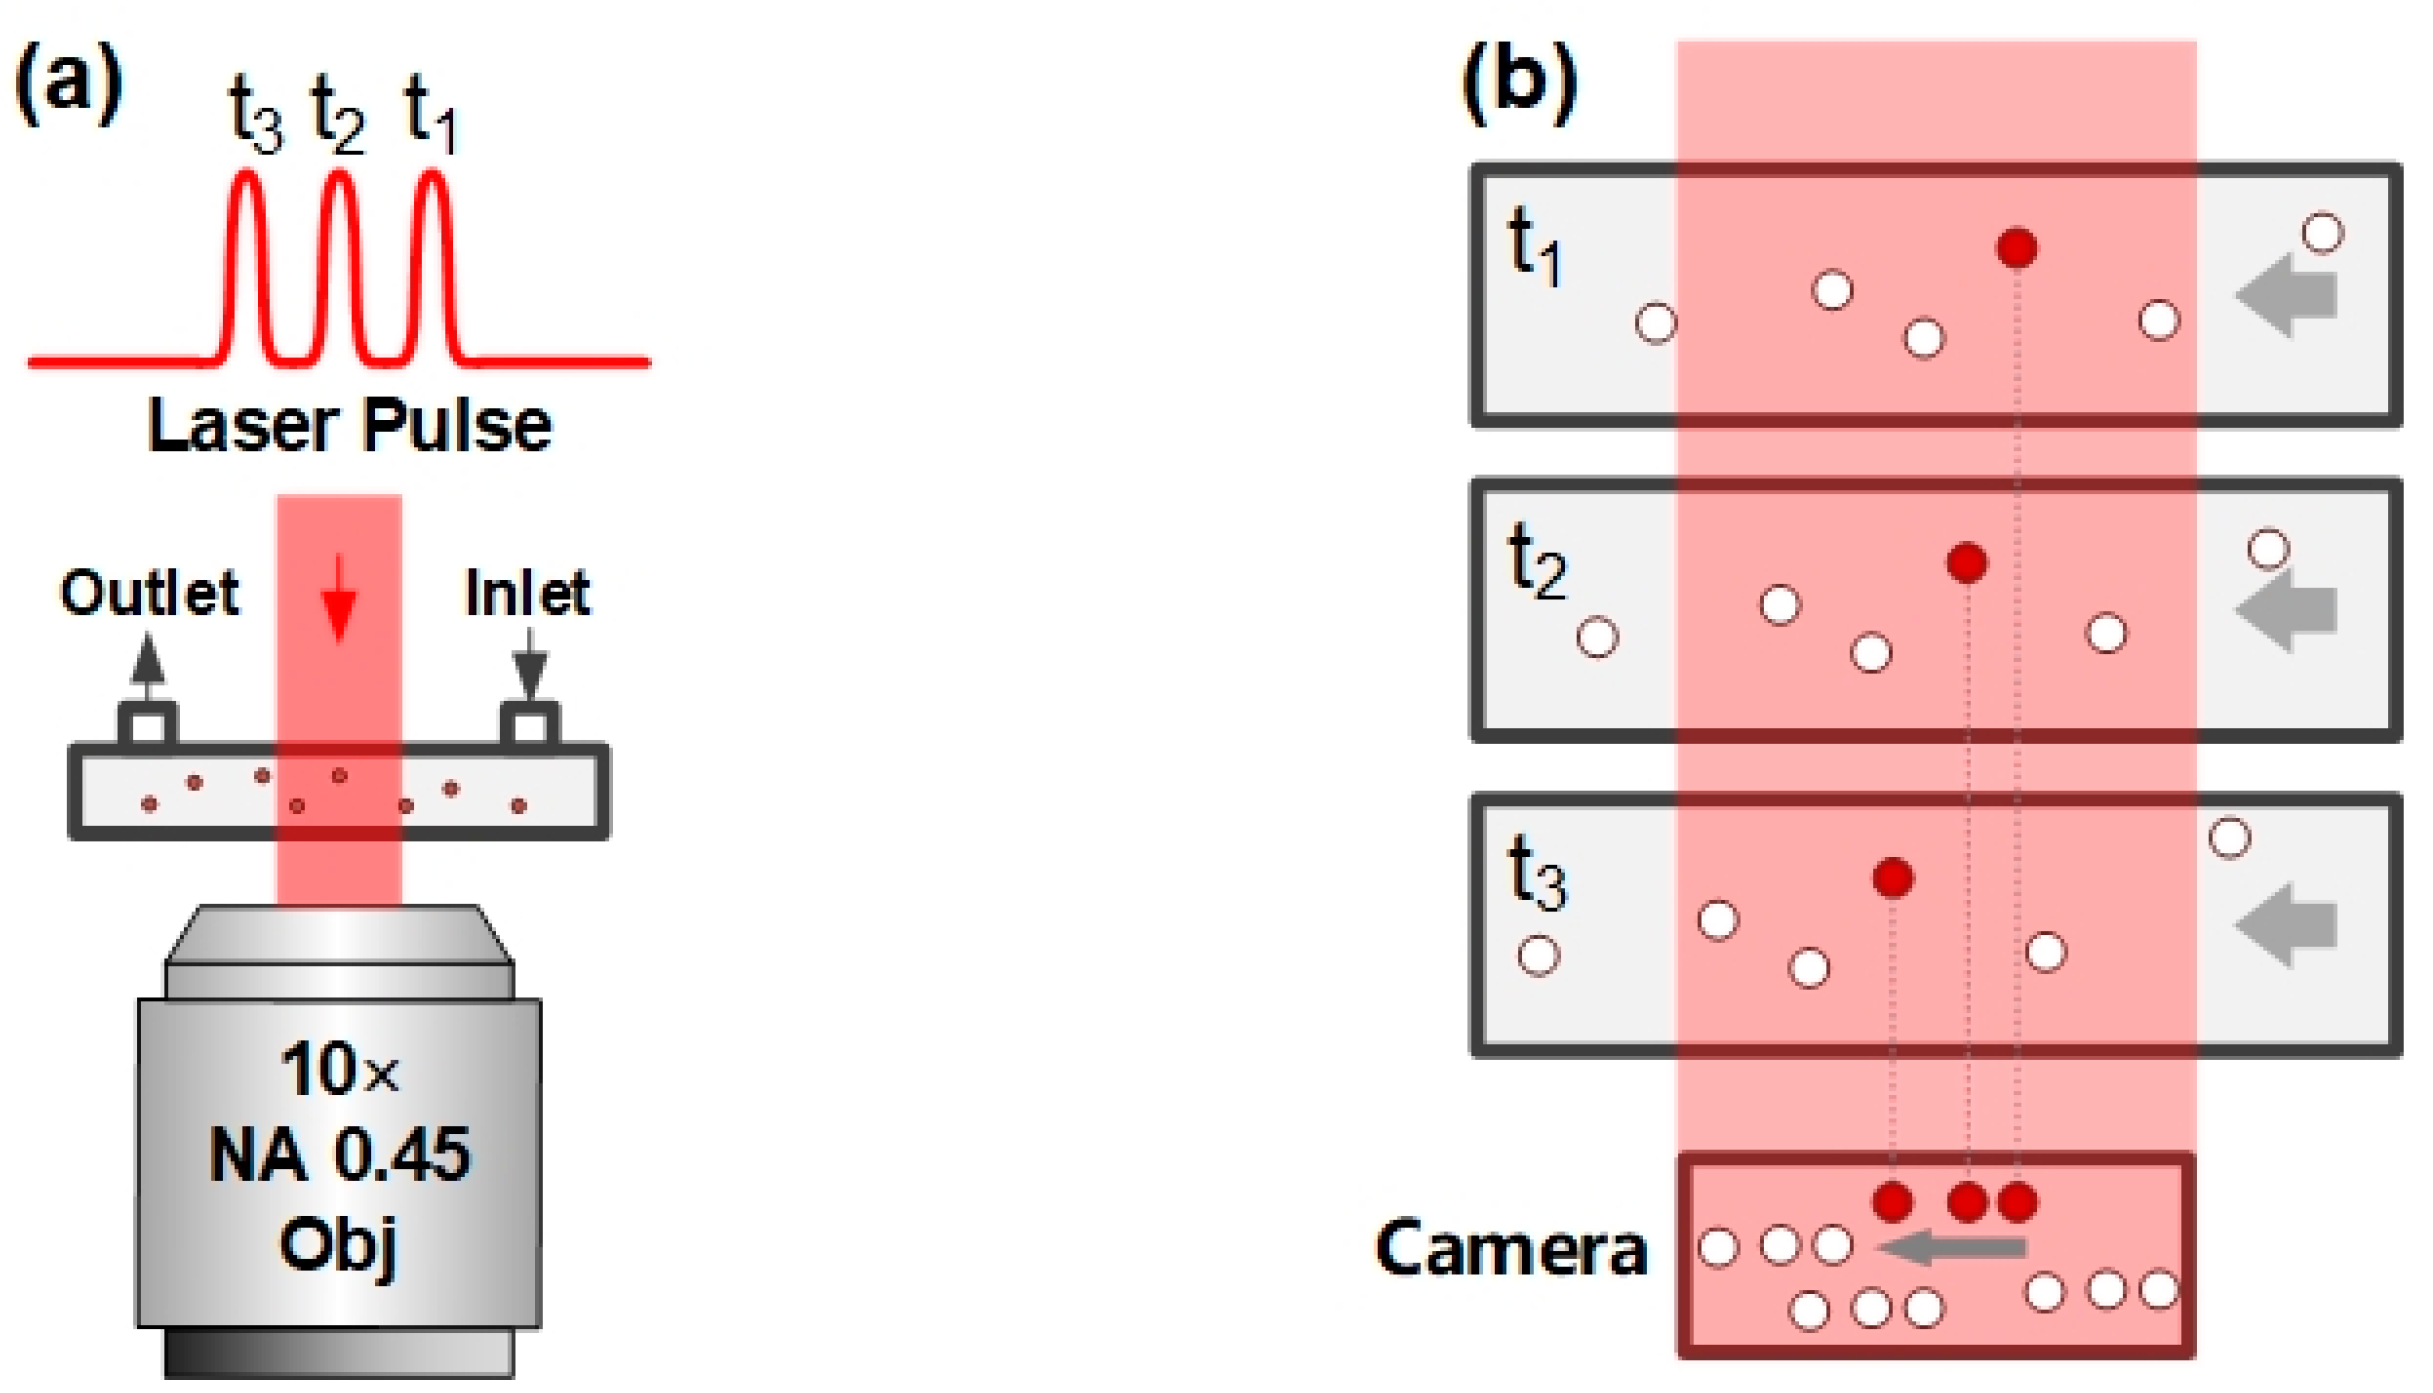
2.1. Principle of PM-DHM

To explain the operating principle of PM-DHM, a schematic diagram is provided in Figure 1. In this experimental setup, an external force drives microparticles suspended in a fluid as they flow through the microfluidic device. During this process, the digitally modulated laser pulse is activated multiple times (at t1, t2, and t3) within the camera’s single-frame exposure time, allowing for discrete illumination of all of the microparticles in the field of view, as shown in Figure 1a. Consequently, the camera’s exposure accumulation feature captures three images of each microparticle displaced along the flow pathway. Figure 1b illustrates a schematic representation of the same microparticle recorded at three different spatial positions during a single-frame exposure.
By applying fundamental physical principles, the velocity, acceleration, and force acting on the flowing microparticles can be determined from the recorded spatial positions and the known time parameters of pulsed light. It is essential to emphasize that accurately measuring the acceleration of flowing microparticles requires recording the same microparticle at different spatial positions and times at least three times within a single-frame exposure period, T C = N T L ,   N 3 . Here, T C is the camera’s exposure time; N is the number of laser lighting cycles; and T L is the period of the laser pulse, which is the reciprocal of the repetition rate f, i.e., f = 1 T L . In this paper, we conduct validation experiments using N = 3.
The spatial distance Δ r i j of a particle between two adjacent images illuminated by the laser pulse at times t i and t j (when i = 1 , j = 2 and i = 2 , j = 3 ) can be determined from the hologram. The velocity v i j of the microparticle between these two positions is calculated as v i j = Δ r i j / Δ t , where Δ t = t 3 t 2 = t 2 t 1 = T L represents the time interval, which is the period of the digitally modulated laser pulse. The acceleration a of the microsphere is then derived as a = v 23 v 12 / Δ t . Using Newton’s Second Law, the force acting on the microspheres can be calculated once the mass of the microparticles is known.

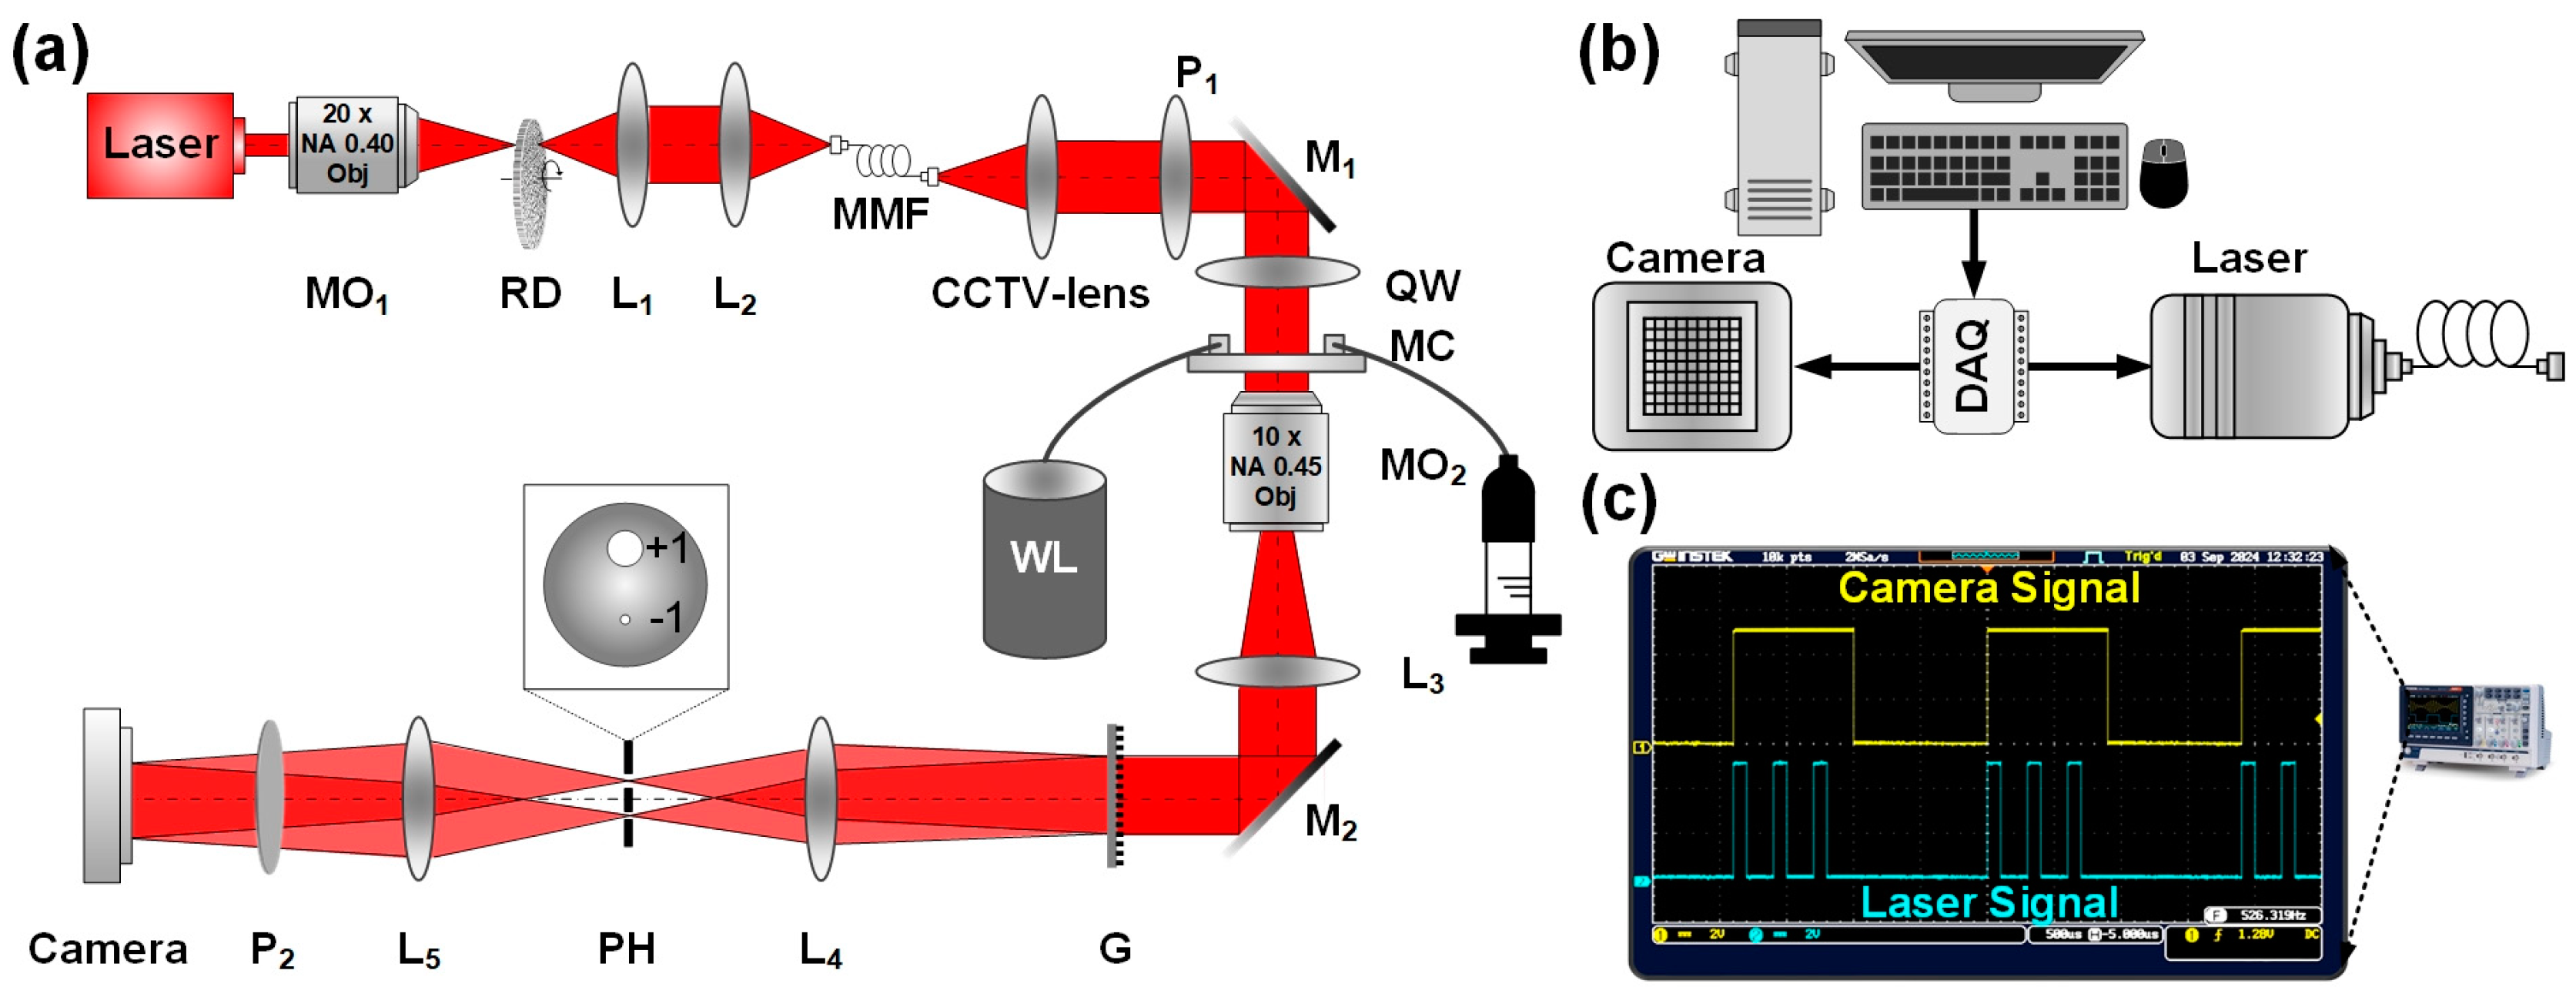
2.2. Optical Path and System Control

The detailed optical path setup is shown in Figure 2a. The imaging system has been modified from the one used in our previous studies [12,37]. The light is focused through a rotating ground glass (RD) diffuser onto a multimode fiber to generate dynamically scattered light. This dynamically scattered light acquires partially coherent light characteristics after being time-averaged. The dynamic speckle pattern on the ground glass is imaged by a telescope system onto the end face of the multimode fiber and coupled into the fiber. Following transmission through the fiber, the output light at the distal end is collimated by a CCTV lens, thereby generating partially coherent illumination (PCI) for PM-DHM. Polarizer 1 is positioned in the illumination path to modulate the light into a horizontally polarized state. The polarized illumination then passes through a quarter-wave plate before irradiating the specimen under test. The specimen is placed at the front focal plane of a telescope system composed of microscope objective 2 and lens 3, where an amplified real image is formed at the system’s back focal plane. A polarization grating positioned at this image plane diffractively splits the object wave into multiple beams propagating along the 0th, +1st, and −1st diffraction orders. At the back focal plane of lens 4, the +1st order diffracted beam passes through a large aperture in the spatial filter (preserving its spectral integrity) to serve as the object wave O(x, y). Meanwhile, the −1st order beam undergoes pinhole spatial filtering via lens 5, transforming into a collimated plane wave devoid of specimen information to function as the reference wave R(x, y). The object beam and reference beam eventually create an interference pattern on the CCD plane. In the optical path, since both the object and reference beams pass through exactly the same optical components, the impact of environmental vibrations on the system is minimal. This method uses a polarization grating to split the light through diffraction. By changing the polarization state of the incident light, the relative intensity between the object and reference beams can be adjusted, ensuring that the fringe contrast of the hologram reaches its maximum. The partially coherent light field generated by the rotating ground glass and multimode fiber effectively suppresses coherent noise in phase imaging, significantly improving the imaging signal-to-noise ratio. The microfluidic chip (MC) used in the experiments has channel dimensions of approximately 1.3 mm in width and 120 µm in height. By applying external pressure from the syringe, the particles are propelled through the microfluidic channel and into the waste liquid vial (WL). It is important to note that to achieve pulsed modulated illumination, the original system laser was replaced with a digitally modulated laser (FC-405/488/635-1.1W(EF60054), Changchun New Industry, Changchun, China). It is a continuous wave laser operating at a wavelength of 635 nm, with a maximum output power of 500 mW. Additionally, to synchronize the timing control of the laser and camera, a Data Acquisition (DAQ) device (DAQ-USB 6212, Austin, NI, USA) was integrated into the system as a control unit, as shown in Figure 2b. The pulsed modulated laser flashing is digitally governed by the external trigger signal in the form of TTL signals from the DAQ. The duty cycle, defined by the high-level and low-level times, can be set freely. LabVIEW was used to control the DAQ and to generate timing signals to synchronize the control system across all of the instruments. Specifically, the DAQ generated TTL signals with different high-level and low-level times to control the laser’s illumination and closure times as well as the camera’s external trigger acquisition. During the single-frame exposure time, the laser was modulated multiple times to generate laser pulses with the on-time ton and the off-time toff. Moreover, it is important to emphasize that during actual experiments, a global exposure mode of the camera is strongly recommended for better synchronization of the illumination and exposure. For this purpose, we used a CMOS camera (Mars8000S-46UM, Vision Datum, Hangzhou, China) operating in global exposure mode. Figure 2c illustrates the time relationship between camera exposure and pulsed modulated illumination as displayed on the oscilloscope.
To ensure proper synchronization, the illumination laser must turn on and off three times within the camera’s single-frame exposure time, sampling the motion of the microspheres during each laser lighting duration. The trigger signal applied to the camera and the laser’s digital modulation signal must satisfy the condition T C = 3 T L , where T L = T o n + T o f f . Here, Ton and Toff represent the laser on-time and off-time, which correspond to the high-level and low-level durations of the electronic signal from the DAQ, respectively. Accurate adjustment of both Ton and Toff is essential, as they must be tailored to the sample’s actual velocity and characteristics to minimize motion blur in the flowing sample.

3. Results and Discussion

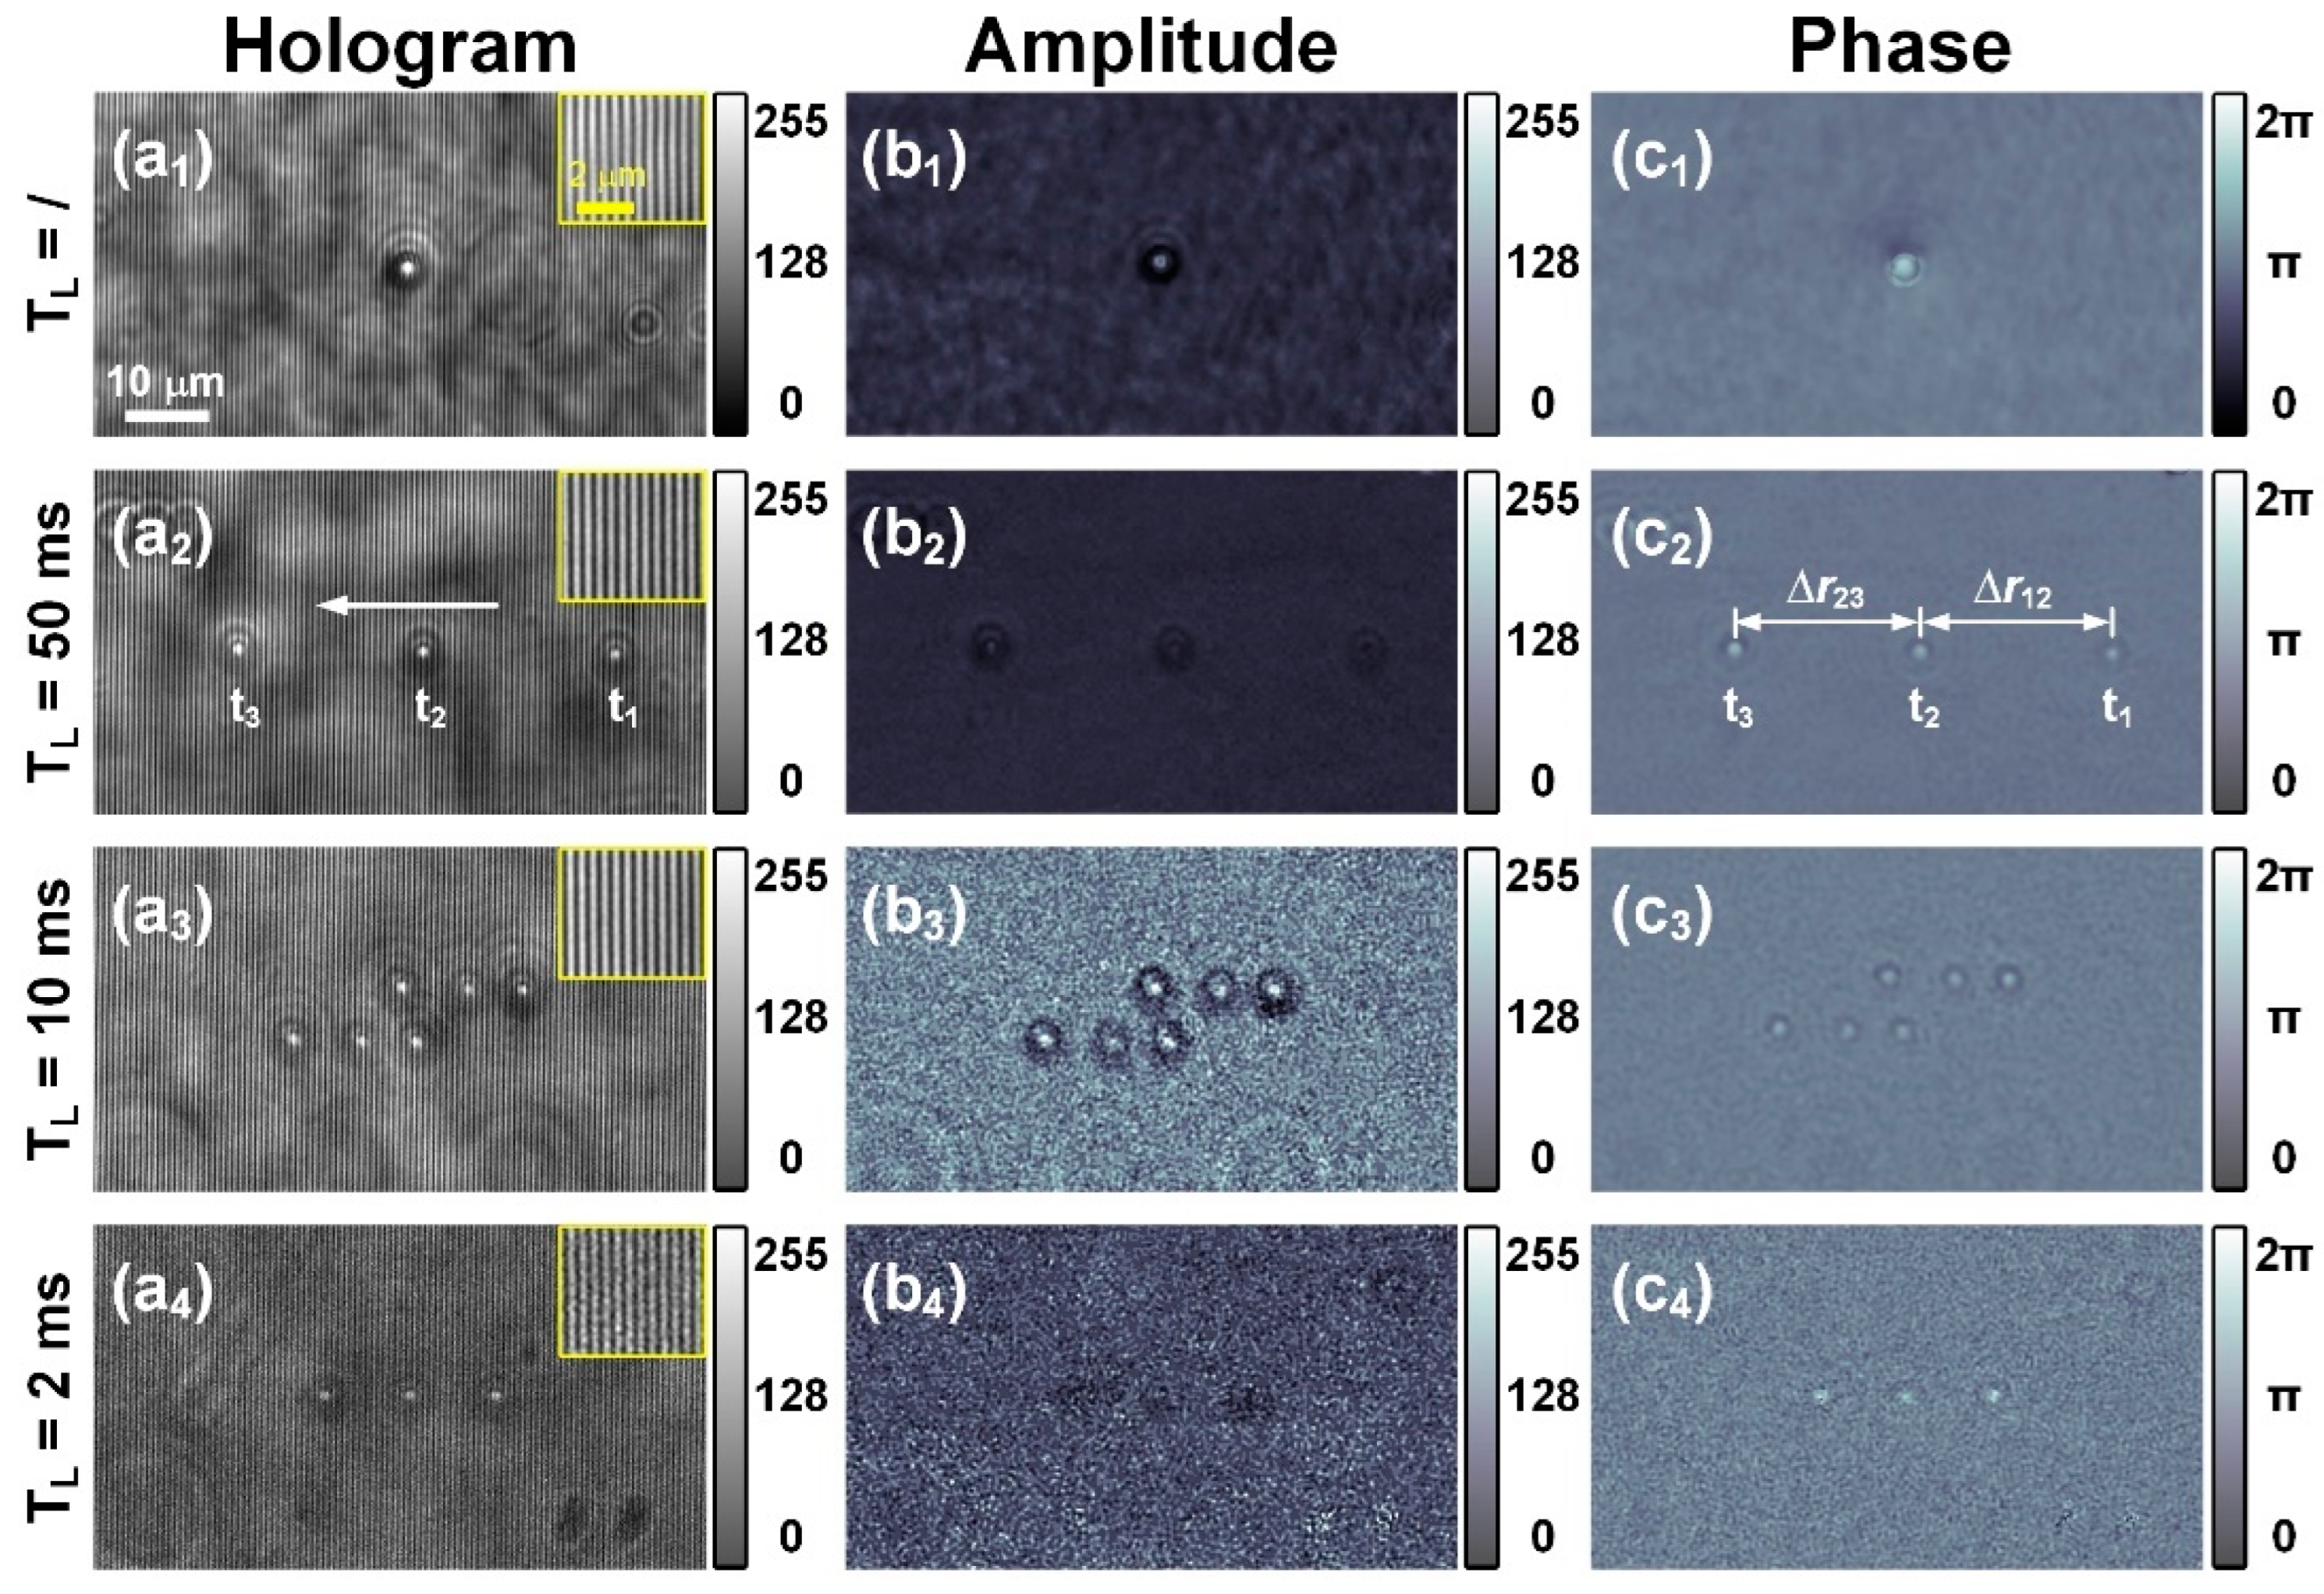
3.1. Measurement of Flowing PMMA Microspheres

To demonstrate the feasibility of the PM-DHM system for measuring flowing particles, 5-µm PMMA microspheres were suspended in pure water and then introduced into a microfluidic channel. PMMA microspheres are spherical particles fabricated from polymethyl methacrylate, an amorphous thermoplastic polymer material [41]. Figure 3 presents (a) digital holograms (b) reconstructed amplitude, and (c) phase images of PMMA microspheres. The illustration in the upper right corner of each hologram shows the magnified interference fringes of the object and reference light. It enables a clearer observation of the interference fringe’s clarity and contrast, which reflects the quality of the hologram. The phase images reflect the thickness of the particles and clearly depict the morphology of the PMMA microspheres. The field of view of all of the images is 76.8 × 43.2 mm2. The subscript “1” in the figure labels, i.e., Figure 3(a1–c1), indicates that the images are of a single static PMMA microsphere under non-pulse modulation. The camera’s exposure time is 10 ms. From Figure 3(c1), we can clearly observe the spherical morphology of PMMA.
The subscript “2–4” in the figure labels, Figure 3(a2–c4), indicates that the images are of flowing PMMA microspheres at different TL values obtained with PM-DHM, corresponding to TL values of 50 ms, 10 ms, and 2 ms, respectively. In these images, the particles generally move from right to left, as indicated by the arrow in Figure 3(a2). The dynamics of a flowing particle at three different time points (t1, t2, and t3) can be captured in a single hologram. The velocity, acceleration, and force acting on the flowing microparticles can be determined from the known period of the laser pulse and the recorded spatial positions in the images. For example, in Figure 3(a2–c2), the spatial distance Δ r 12 = 23.24   μ m , and Δ r 23 = 22.43   μ m with a time interval Δ t = T L = 50   ms . This gives the velocities as v 12 = Δ r 12 Δ t = 0.46   μ m / s and v 23 = Δ r 23 Δ t = 0.45   μ m / s . The acceleration can then be calculated as a = v 23 v 12 / Δ t = 0.32   mm / s 2 . Finally, using the density of the PMMA microspheres (1.18 g/cm³), the corresponding force is F = 0.38   fN . Table 1 summarizes the experimental parameters of PM-DHM, along with the measured velocity, acceleration, and force. The results indicate that under this system, only software parameter settings are required, without the need for hardware adjustments or experimental operations, and the PM-DHM system can achieve a wide range of speed measurements.
It is crucial to recognize that the selection of TL should be based on particle velocity. If TL is set too large, the particle may exit the observed area. Conversely, if TL is too small, the images of the particles may overlap. Therefore, we provide the following recommendations for choosing the appropriate TL.
The field of view is 330 × 330 μm. Assume the diameter of the particle is 5 μm and its velocity is on the order of ~mm/s. The displacement range between two adjacent frames in the field of view is Δ r 5 ,   162.5   μ m . The minimum displacement Δ r m i n = 5   μ m   ensures that the particle is completely separated between the two frames, allowing for the recovery of amplitude and phase. The maximum displacement   Δ r m ax = 162 . 5   μ m is determined by the imaging field of view of 330 μm. Therefore, under the limit condition, the particle moves uniformly across the field of view and completes three frames of imaging, with the maximum displacement between any two frames being less than 162.5 μm. Thus, the time interval between frames is   T L 5 ,   162.5   ms . If the particle moves approximately 10 μm between two adjacent frames, thus   T L = 10   ms . From another perspective, if T L = 10   ms ,   then based on Δ r 5 ,   162.5   μ m , the measurable velocity range is (0.5, 16.25) mm/s. This encompasses a wide range of velocities, so the method does not impose strict requirements on the TL or the frame rate.
It is evident that by modulating the period of the laser pulse T L , i.e., by adjusting the repetition rate, PM-DHM can capture dynamic measurements of flowing microparticles over a wide range of speeds. Reducing Ton helps mitigate motion blur. However, it also decreases illumination collection, leading to increased image noise and reduced contrast. Generally, compared to conventional intensity images, phase images exhibit higher contrast for the particles due to their different refractive indices relative to the immersion medium.
In addition, we analyzed the effect of pulse duration on the quality of the reconstructed PM-DHM images. PM-DHM was used to image PMMA microspheres flowing through a microfluidic channel. During the hologram exposure, three laser pulses illuminated the sample. Figure 4(a1–a4) show the reconstructed phase images of PMMA microspheres presented in Figure 3(c1–c4), respectively. Here, Figure 3(a1) serves as a benchmark, with an illumination time equal to the camera’s exposure time of 10 ms, as mentioned earlier. In Figure 3(a2–a4), microspheres were illuminated by pulses with durations Ton of 0.5 ms, 0.1 ms, and 0.02 ms, respectively. The force is generated by manually pressing the syringe. In the experiment, we can manually adjust the force to vary the speed of the particles and adjust the corresponding frame rate based on the sampling speed, as listed in Table 1.
Four profile lines across the center of the microspheres have been extracted, and the normalized phase is displayed in Figure 4. Subsequently, the signal-to-background ratio (SBR) was calculated by dividing the peak of the curve (signal) by the plateau of the curve (background). The comparison suggests that shorter pulses result in higher noise levels. It was found that the SBR decreases from 10.0 to 2.5 as the illumination time decreases from 10 ms to 0.02 ms. Therefore, a compromise between time resolution and SBR must be established for a given laser power in PM-DHM.

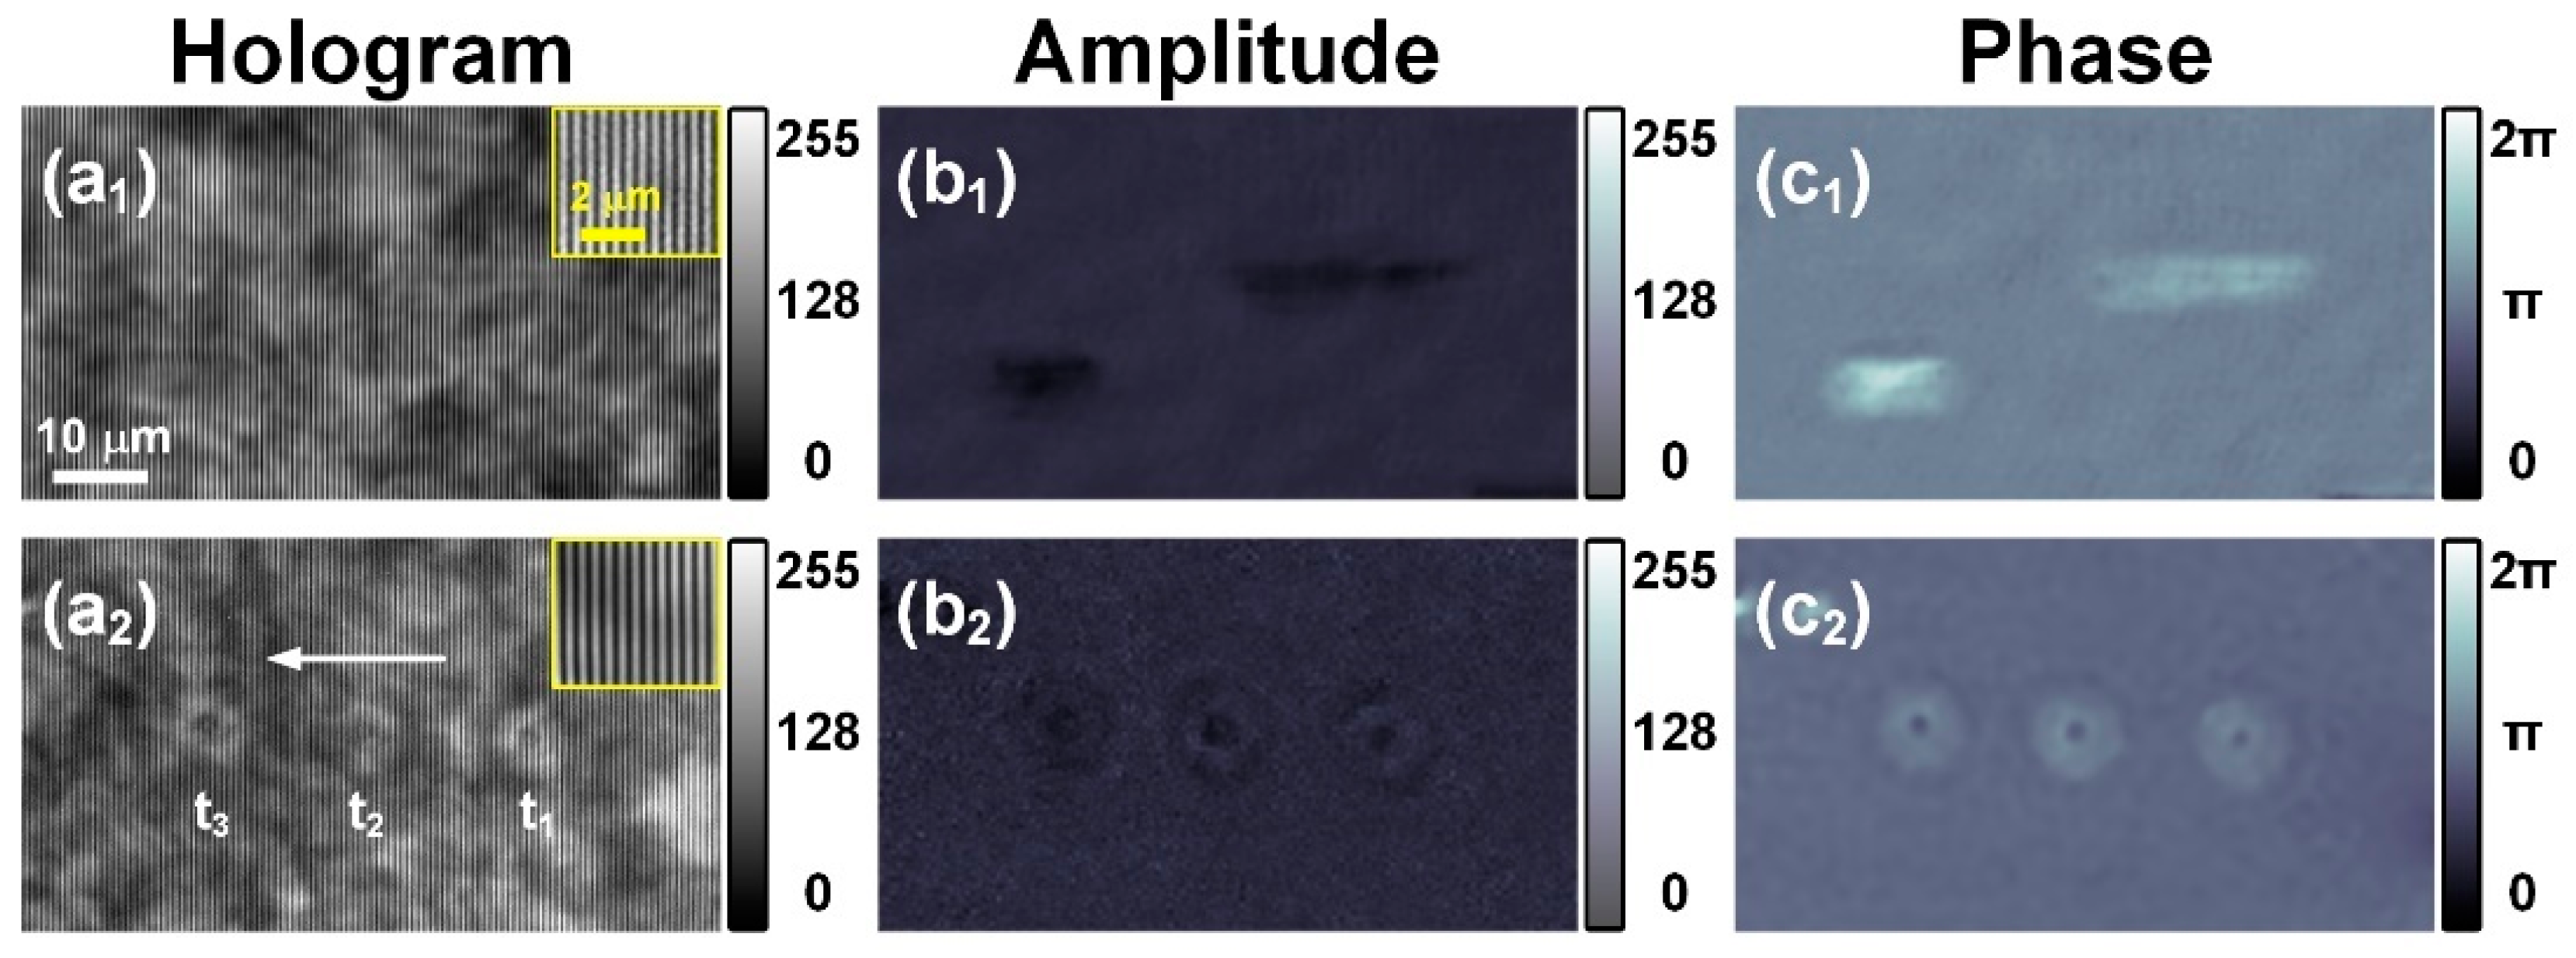
3.2. Measurement of Red Blood Cells

Eventually, PM-DHM was applied to imaging red blood cells flowing in a microfluidic channel. The blood cells were extracted from human blood, diluted with PBS, and pumped through the microfluidic channel. Figure 5 presents a comparison between non-pulsed modulated illumination Figure 5(a1–c1) and pulsed modulated illumination Figure 5(a2–c2), for which the same camera exposure time (TC = 301.5 ms) was used. In Figure 5(a1–c1), the laser was operated in continuous output mode (non-pulsed modulated illumination). In Figure 5(a2–c2), the laser operated in pulsed modulated mode, delivering three pulses within the exposure time, with Ton = 0.5 ms and Toff = 100 ms. The same cell was illuminated three times at t1, t2, and t3 during the exposure time of the camera, and consequently, there are three images of the cell at different positions in the hologram, as shown in Figure 5(a2). The illustration in the upper right corner of each hologram shows magnified interference fringes of the PM-DHM hologram. The field of view (FOV) of all the images is 76.8 × 43.2 mm2. The arrow indicates the direction of cell flow, and the cells maintain the same flow direction in all of the images. The comparison between Figure 5(a1–c1) and Figure 5(a2–c2) clearly demonstrates that PM-DHM technology can effectively suppress the tailing phenomenon of flowing red blood cells, compared to non-pulsed modulated DHM technology.
Comparing the measurement results of blood cells and PMMA highlights the advantages of holographic imaging in the field of transparent samples. Transparent materials interact with light in complex ways through refraction, reflection, and transmission. Conventional imaging can only capture intensity variations, providing a two-dimensional image of the external contours. In contrast, DHM can provide depth information or phase changes, allowing for the visualization of internal structures or details, especially in samples such as cells and biological membranes.
The phase image Figure 5(c2) clearly displays the doughnut shape of a red blood cell with a diameter of 8 μm. The velocity and acceleration of a flowing red blood cell were quantitatively measured: v12 = 0.17 mm/s, v23 = 0.16 mm/s, a = −0.08 mm/s2 by analyzing the displacement that occurred between t1, t2, and t3. Further, the force F = −8.72 × 10² fN is estimated considering the average mass of red blood cells in a healthy adult m = 1.09 × 10¹⁰ g [39].

4. Discussion

Compared to various holographic imaging methods such as Interference Scattering Microscopy (ISCAT), which detects interference signals between scattered light from the sample and a reference light, our proposed system enhances the scattering intensity through interference to achieve nanoscale sensitivity. However, it suffers from strong background noise, necessitating complex algorithms for suppression, and is limited to surface or near-field imaging. In contrast, Interference Reflection Microscopy (IRM) utilizes the interference of reflected light from the sample-substrate interface to detect refractive index changes at the interface. However, it is restricted to imaging near the interface and cannot penetrate thick samples. Another method, Diffraction Phase Microscopy (DPM), employs a diffraction grating to split light and combines it with a frequency-domain phase retrieval algorithm to extract quantitative phase information, making it suitable for observing fast dynamic processes such as red blood cell flow. However, its spatial resolution is constrained by the diffraction grating, and complex samples are prone to phase aliasing [42,43,44,45]. This study presents a novel approach termed pulsed modulated digital holographic microscopy (PM-DHM), which has been successfully applied to dynamic measurements of flowing microparticles once equipped with a microfluidic system. The use of partially coherent illumination in PM-DHM improves the signal-to-noise ratio and enables quantitative phase measurements. The common-path interference technique employed by the system further improves its resistance to external interference. Comparing our system to pulse digital holography for simultaneous three-dimensional dynamic deformation measurement, the latter typically requires recording a set of three digital holograms and quantitatively evaluating the phase difference between the two recorded images of each hologram using Fourier transform methods to obtain the three-dimensional dynamic deformation information of fixed samples. However, the application of this method is limited to imaging fixed samples. In contrast, PM-DHM can not only image flowing and highly transparent samples but also provide non-destructive, high-field-of-view, and high-resolution dynamic observation, thus overcoming the limitations of traditional holography in imaging flowing samples [46]. Compared to existing pulsed digital holography systems for imaging ultrafast processes, PM-DHM technology can perform dynamic measurements at different moments and locations of high-speed directed flowing microparticles. Additionally, the optical setup is simpler and less susceptible to environmental disturbances [47].
A key feature of PM-DHM is the ability to flash the laser pulse multiple times during the exposure of a hologram, and consequently provide insight into the velocity, acceleration, and force of a flowing sample.
The temporal resolution of PM-DHM is limited only by the pulse duration, and it effectively minimizes motion blur. Compared to traditional dynamic imaging techniques that require acquiring images at different time points through multiple consecutive frames, PM-DHM facilitates multi-dynamic measurements of microparticles within a single exposure. This approach overcomes the limitations of camera frame rates and eliminates the need for high-speed cameras. PM-DHM also offers flexibility in speed measurements without necessitating changes to the laser or camera hardware. By adjusting the laser’s repetition rate based on the expected speed of the microparticles, the system enables dynamic imaging across the desired speed range. Currently, the system can measure a maximum microsphere velocity of 5.81 mm/s, with a time resolution (the minimum Ton) of 20 µs. The spatial resolution of the system is 0.86 µm, which corresponds to the minimum detectable particle size. This is because the resolution in the imaging system is determined by both the optical resolution ( 0.61 λ N A = 0.86 µm) and the camera resolution (0.12 µm/pixel). The overall resolution follows the “bucket effect” principle, indicating that it is limited by the lower of the two resolutions. In terms of velocity measurement, an increase in the lateral size of particles can adversely affect the accuracy of these measurements. This effect is particularly significant for irregularly shaped particles, where errors in determining the central position of calibration samples become more pronounced, leading to increased inaccuracies in the results. Ultimately, the upper limit of particle size that the system can measure depends on the specific accuracy requirements of the measurement as well as the field of view.
In addition, compared to continuous illumination, pulsed illumination has a shorter duration of action, resulting in lower total energy exposure to the sample, thereby reducing light damage and phototoxicity. The instantaneous nature of pulsed illumination prevents heat accumulation, whereas continuous illumination can cause local heating of the sample due to prolonged exposure, leading to thermal damage, such as the disruption of cell structures. Due to its shorter duration, pulsed illumination reduces the likelihood of photochemical reactions (such as reactive oxygen species generation), especially in high-sensitivity samples like living cells or fluorescent proteins. When holographic imaging of fluorescence-labeled organisms, continuous illumination is more likely to induce photobleaching of fluorescent molecules, reducing the intensity and duration of imaging signals [48,49,50,51,52].
When the particle density is high, particles may overlap or obscure one another within the same field of view. This can lead to the mixing of holographic interference fringes, which impairs the extraction of phase information and results in blurred images where particles cannot be clearly distinguished or tracked. As a result, the accuracy of data analysis is compromised. To address this, particle concentration can be appropriately diluted and controlled to prevent excessive overlap, while still maintaining a sufficient particle count for effective analysis. Alternatively, particle sorting can be utilized to spatially separate the particles in the sample, thereby minimizing interference caused by overlap.
High-throughput flow cytometry technology has garnered significant attention for achieving rapid and large-scale data collection and analysis. The velocity and forces acting on particles significantly affect their detection accuracy and throughput. Optimizing the flow velocity can enhance detection accuracy while ensuring high throughput. Additionally, carefully controlling the forces can minimize cellular damage and improve the reliability of the data. Moreover, analyzing from the perspective of particle density, in a flowing environment, under high-density conditions, cell collisions and forces are more intense, which may lead to cell damage, morphological changes, or flow blockages. At low density, the forces acting on the cells are more dependent on the shear force of the fluid, with the forces being more dispersed and causing less interaction between cells, but the cells may be more significantly influenced by fluid dynamics. Therefore, controlling cell density and the forces acting on the cells is crucial for experimental results, especially in microfluidic technologies.
PM-DHM technology is a reliable method for measuring the speed of directed motion in microparticles. First, under the constraints of microfluidics, the overall direction of particle movement is typically consistent. Although random motions such as diffusion and Brownian motion occur during this process, their impact is minimal, especially under high-speed conditions. Second, this speed measurement method employs a direct approach based on definitions; speed is calculated by dividing displacement by time, making it more reliable compared to other indirect measurement methods such as frequency variations and sensor estimations. Third, pulsed illumination significantly reduces motion blur in particle imaging, creating favorable conditions for accurate particle positioning. Therefore, we believe that the results obtained using this method are indeed reliable. PM-DHM primarily relies on interference effects to track phase changes in the sample. Thus, it performs well under unidirectional flow conditions, making it particularly suitable for fluid dynamics studies. However, tracking random motion (such as Brownian motion) does present certain challenges. Brownian motion is caused by random displacements of particles due to thermal motion and typically requires high temporal resolution and sufficient spatial resolution to accurately capture its random trajectory. However, by improving imaging rates and refining data processing algorithms, for example by integrating high-frequency image acquisition with specialized tracking algorithms capable of identifying the sequence of frames in multi-frame imaging, it becomes possible to monitor and quantitatively analyze Brownian motion to a certain extent. While there are currently some limitations, PM-DHM still holds significant potential for advancing the study of Brownian motion, especially with further optimization of the technology and algorithms.
It is important to note that this study primarily serves as a proof-of-concept. Future research will focus on integrating tunable pulsed lasers to enable high-speed (m/s) dynamic measurements of microparticles with improved temporal resolution while also expanding the application of this technique to a broader range of biological and industrial systems. This method demonstrates significant potential for high-throughput label-free flow cytometry detection and offers promising applications in drug development and cell analysis.

Author Contributions

Conceptualization, P.G., L.Y. and X.W.; methodology, P.G. and X.W.; software, Y.L. (Yunze Lei); validation, X.W., Y.L. (Yunze Lei), Y.L. (Yuge Li) and K.Z.; formal analysis, Y.L. (Yuge Li); investigation, Y.L. (Yunze Lei); resources, J.Z. and S.A.; data curation, Y.L. (Yunze Lei), Y.L. (Yuge Li), K.Z., J.Z., K.W. and S.A.; writing—original draft preparation, Y.L. (Yunze Lei); writing—review and editing, P.G., X.W., Y.L. (Yunze Lei) and Y.L. (Yuge Li); visualization, X.W., Y.L. (Yunze Lei) and Y.L. (Yuge Li); supervision, P.G. and X.W.; project administration, P.G., X.W. and Y.M.; funding acquisition, P.G., X.W. and Y.M. All authors have read and agreed to the published version of the manuscript.

Funding

This research was funded by the National Natural Science Foundation of China (NSFC 62335018, 62105251); the Natural Science Basic Research Program of Shaanxi (Program No. 2023-JC-YB-518, 2022JQ-122, 2023-JC-QN-0731); the Key Research and Development Program of Shaanxi (2024GH-ZDXM-05), Xidian University Specially Funded Project for Interdisciplinary Exploration (TZJH2024040, TZJH2024044).

Institutional Review Board Statement

Not applicable.

Informed Consent Statement

Informed consent was obtained from all subjects involved in the study.

Data Availability Statement

The original contributions presented in this study are included in the article. Further inquiries can be directed to the corresponding authors.

Conflicts of Interest

The authors declare no conflicts of interest.

References

  1. Kim, J.; Barroso, Á.; Picazo-Bueno, J.Á.; Ketelhut, S.; Schnekenburger, J.; Kemper, B. Application of digital holographic microscopy for assessment of hydrodynamic focusing in a microfluidic chip. In Optica Digital Holography and Three-Dimensional Imaging 2024 (DH); Technical Digest Series; Optica Publishing Group: Washington, DC, USA, 2024; paper Tu2A.2. [Google Scholar]
  2. Zhou, H.; Yang, Z.; Yao, Z.; Cen, K. Application of digital holographic microscopy and microfluidic chips to the measurement of particle size distribution of fly ash after a wet electrostatic precipitator. Flow Meas. Instrum. 2018, 60, 24–29. [Google Scholar] [CrossRef]
  3. Cui, Y.T.; Wang, Z.; Sun, C.; Jiang, Z.Q. The measurement of flow rate of micro-fluid on-chip by digital holography. In Holography, Diffractive Optics, and Applications VII, Eighth International Conference on Graphic and Image Processing, Tokyo, Japan, 29–31 October 2016; SPIE: Bellingham, WA, USA, 2016; Volume 1002222. [Google Scholar]
  4. Evans, H.B.; Gorumlu, S.; Aksak, B.; Castillo, L.; Sheng, J. Holographic microscopy and microfluidics platform for measuring wall stress and 3D flow over surfaces textured by micro-pillars. Sci. Rep. 2016, 6, 28753. [Google Scholar] [CrossRef]
  5. Yu, X.; Hong, J.; Liu, C.G.; Kim, M.K. Review of digital holographic microscopy for three-dimensional profiling and tracking. Opt. Eng. 2014, 53, 112306. [Google Scholar] [CrossRef]
  6. Gao, P.; Yuan, C. Resolution enhancement of digital holographic microscopy via synthetic aperture: A review. Light. Adv. Manuf. 2022, 3, 105–112. [Google Scholar] [CrossRef]
  7. Tahara, T.; Quan, X.Y.; Otani, R.; Takaki, Y.; Matoba, O. Digital holography and its multidimensional imaging applications: A review. Microscopy 2018, 67, 55–67. [Google Scholar] [CrossRef]
  8. Wang, H.Y.; Dong, Z.; Wang, X.; Lou, Y.L.; Xi, S.X. Phase compensation in digital holographic microscopy using a quantitative evaluation metric. Opt. Commun. 2019, 430, 262–267. [Google Scholar] [CrossRef]
  9. Min, J.W.; Yao, B.L.; Ketelhut, S.; Engwer, C.; Greve, B.; Kemper, B. Simple and fast spectral domain algorithm for quantitative phase imaging of living cells with digital holographic microscopy. Opt. Lett. 2017, 42, 227–230. [Google Scholar] [CrossRef]
  10. Osten, W.G.; Faridian, A.; Gao, P.; Körner, K.; Naik, D.; Pedrini, G.; Singh, A.K.; Takeda, M.; Wilke, M. Recent advances in digital holography [Invited]. Appl. Opt. 2014, 53, G44–G63. [Google Scholar] [CrossRef]
  11. Kim, M.K. Principles and techniques of digital holographic microscopy. SPIE Rev. 2010, 1, 018005. [Google Scholar] [CrossRef]
  12. Zhuo, K.Q.; Wang, Y.; Wang, Y.; Wen, K.; Liu, M.; Ma, Y.; Zheng, J.J.; Gao, P. Partially Coherent Illumination Based Point-Diffraction Digital Holographic Microscopy Study Dynamics of Live Cells. Front. Phys. 2021, 9, 796935. [Google Scholar] [CrossRef]
  13. Byeon, H.; Go, T.; Lee, S.J. Deep learning-based digital in-line holographic microscopy for high resolution with extended field of view. Opt. Laser Technol. 2019, 113, 77–86. [Google Scholar] [CrossRef]
  14. Goud, B.K.; Shinde, D.D.; Udupa, D.V.; Krishna, C.M.; Rao, K.D.; Sahoo, N.K. Low cost digital holographic microscope for 3-D cell imaging by integrating smartphone and DVD optical head. Opt. Lasers Eng. 2019, 114, 1–6. [Google Scholar] [CrossRef]
  15. Kubota, T. 48 Years with holography. Opt. Rev. 2014, 21, 883–892. [Google Scholar] [CrossRef]
  16. Potter, J.C.; Xiong, Z.; McLeod, E. Clinical and biomedical applications of lensless holographic microscopy. Laser Photonics Rev. 2024, 18, 2400197. [Google Scholar] [CrossRef]
  17. Ozcan, A.; McLeod, E. Lensless imaging and sensing. Annu. Rev. Biomed. Eng. 2016, 18, 77–102. [Google Scholar] [CrossRef]
  18. Liao, Z.R.; Zhang, Y.; Li, Y.R.; Miao, Y.F.; Gao, S.M.; Lin, F.K.; Deng, Y.L.; Geng, L.N. Microfluidic chip coupled with optical biosensors for simultaneous detection of multiple analytes: A review. Biosens. Bioelectron. 2019, 126, 697–706. [Google Scholar] [CrossRef] [PubMed]
  19. Pousti, M.; Zarabadi, M.P.; Amirdehi, M.A.; Paquet-Mercier, F.; Greener, J. Microfluidic bioanalytical flow cells for biofilm studies: A review. Analyst 2019, 144, 68–86. [Google Scholar] [CrossRef]
  20. Sontheimer-Phelps, A.; Hassell, B.A.; Ingber, D.E. Modelling cancer in microfluidic human organs-on-chips. Nat. Rev. Cancer 2019, 19, 65–81. [Google Scholar] [CrossRef]
  21. Chen, P.; Kuo, K. High-throughput microfluidic systems for disease detection. J. Chin. Inst. Eng. 2013, 37, 670–675. [Google Scholar] [CrossRef]
  22. Lin, M.; Liu, Q.; Liu, C.; Qiao, X.; Shao, C.S.; Su, X.T. Label-free light-sheet microfluidic cytometry for the automatic identification of senescent cells. Biomed. Opt. Express 2018, 9, 1692–1703. [Google Scholar] [CrossRef]
  23. Ma, Y.; Dai, T.Q.; Lei, Y.Z.; Zhang, L.L.; Ma, L.; Liu, M.; An, S.; Zheng, J.J.; Zhuo, K.Q.; Kong, L.; et al. Panoramic quantitative phase imaging of adherent live cells in a microfluidic environment. Biomed. Opt. Express 2023, 14, 5182–5198. [Google Scholar] [CrossRef] [PubMed]
  24. Zhou, R.Y.; Bai, G.F.; Zhu, D.X.; Xu, Q.; Zhang, X.D.; Li, T.R.; Qian, Y.Y.; Bu, C.W. Pump-free SERS microfluidic chip based on an identification-competition strategy for ultrasensitive and efficient simultaneous detection of liver cancer-related microRNAs. Biomed. Opt. Express 2024, 15, 6469–6485. [Google Scholar] [CrossRef] [PubMed]
  25. Bissardon, C.; Mermet, X.; Quintard, C.; Sanjuan, F.; Fouillet, Y.; Bottausci, F.; Carriere, M.; Rivera, F.; Blandin, P. Selective plane illumination microscope dedicated to volumetric imaging in microfluidic chambers. Biomed. Opt. Express 2022, 13, 5261–5274. [Google Scholar] [CrossRef] [PubMed]
  26. Zhu, J.S.; Luo, J.H.; Hua, Z.L.; Feng, X.; Cao, X.W. SERS microfluidic chip integrated with double amplified signal off-on strategy for detection of microRNA in NSCLC. Biomed. Opt. Express 2024, 15, 594–607. [Google Scholar] [CrossRef]
  27. Gangaram-Panday, N.H.; Nijenhuis, L.H.; Fine, I.; Reiss, I.K.M.; Weteringen, W.V. A novel non-invasive method of measuring microcirculatory perfusion and blood velocity in infants: A pilot study. Sci. Rep. 2022, 12, 7459. [Google Scholar] [CrossRef]
  28. Ye, F.; Yin, S.C.; Li, M.R.; Li, Y.J.; Zhong, J.G. In-vivo full-field measurement of microcirculatory blood flow velocity based on intelligent object identification. J. Biomed. Opt. 2020, 25, 1–11. [Google Scholar] [CrossRef]
  29. Secomb, T.W. Blood Flow in the Microcirculation. Annu. Rev. Fluid Mech. 2017, 49, 443–461. [Google Scholar] [CrossRef]
  30. Omori, T.; Imai, Y.; Kikuchi, K.J.; Ishikawa, T.; Yamaguchi, T. Hemodynamics in the Microcirculation and in Microfluidics. Ann. Biomed. Eng. 2015, 43, 238–257. [Google Scholar] [CrossRef]
  31. Stavrakis, S.; Holzner, G.; Choo, J.; deMello, A. High-throughput microfluidic imaging flow cytometry. Curr. Opin. Biotechnol. 2019, 55, 36–43. [Google Scholar] [CrossRef]
  32. Tripathi, V.R.; Tibdewal, M.N.; Mishra, R. A survey on Motion Artifact Correction in Magnetic Resonance Imaging for Improved Diagnostics. SN Comput. Sci. 2024, 5, 281. [Google Scholar] [CrossRef]
  33. Huang, R.; Hong, K.; Yang, D.L.; Huang, G.H. Motion artifacts removal and evaluation techniques for functional near-infrared spectroscopy signals: A review. Front. Neurosci. 2022, 16, 878750. [Google Scholar] [CrossRef] [PubMed]
  34. Zaitsev, M.; Maclaren, J.; Herbst, M. Motion artifacts in MRI: A complex problem with many partial solutions. J. Magn. Reson. Imaging 2015, 42, 887–901. [Google Scholar] [CrossRef] [PubMed]
  35. Jimenez, D.; Pizarro, D.; Mazo, M. Single frame correction of motion artifacts in PMD-based time of flight cameras. Image Vis. Comput. 2014, 32, 1127–1143. [Google Scholar] [CrossRef]
  36. Xiong, Z.; Potter, C.J.; McLeod, E. High-speed lens-free holographic sensing of protein molecules using quantitative agglutination assays. ACS Sens. 2021, 6, 1208–1217. [Google Scholar] [CrossRef]
  37. Yu, L.; Wang, Y.; Wang, Y.; Zhuo, K.Q.; Liu, M.; Nienhaus, G.U.; Gao, P. Two-beam phase correlation spectroscopy: A label-free holographic method to quantify particle flow in biofluids. Photonics Res. 2023, 11, 757. [Google Scholar] [CrossRef]
  38. Le, A.V.; Fenech, M. Image-Based Experimental Measurement Techniques to Characterize Velocity Fields in Blood Microflows. Front. Physiol. 2022, 13, 886675. [Google Scholar] [CrossRef]
  39. Wereley, S.T.; Meinhart, C.D. Recent Advances in Micro-Particle Image Velocimetry. Annu. Rev. Fluid Mech. 2010, 42, 557–576. [Google Scholar] [CrossRef]
  40. Williams, S.J.; Park, C.; Wereley, S.T. Advances and applications on microfluidic velocimetry techniques. Microfluid. Nanofluidics 2010, 8, 709–726. [Google Scholar] [CrossRef]
  41. Zafar, M.S. Prosthodontic Applications of Polymethyl Methacrylate (PMMA): An Update. Polymers 2020, 12, 2299. [Google Scholar] [CrossRef]
  42. Available online: https://biology.stackexchange.com/questions/93703/what-is-the-mass-of-a-single-erythrocyte (accessed on 24 May 2020).
  43. Arroyo Ortega, J.; Cole, D.; Kukura, P. Interferometric scattering microscopy and its combination with single-molecule fluorescence imaging. Nat. Protoc. 2016, 11, 617–633. [Google Scholar] [CrossRef]
  44. Malm, J.; Giannaras, D.; Riehle, M.O.; Gadegaard, N.; Sjövall, P. Fixation and Drying Protocols for the Preparation of Cell Samples for Time-of-Flight Secondary Ion Mass Spectrometry Analysis. Anal. Chem. 2009, 81, 7197–7205. [Google Scholar] [CrossRef]
  45. Jafarfard, M.R.; Moon, S.; Tayebi, B.; Kim, D.Y. Dual-wavelength diffraction phase microscopy for simultaneous measurement of refractive index and thickness. Opt. Lett. 2014, 39, 2908–2911. [Google Scholar] [CrossRef]
  46. Schedin, S.; Pedrini, G.; Tiziani, H.J.; Mendoza Santoyo, F. Simultaneous three-dimensional dynamic deformation measurements with pulsed digital holography. Appl. Opt. 1999, 38, 7056. [Google Scholar] [CrossRef] [PubMed]
  47. Wang, X.; Zhai, H.; Mu, G. Pulsed digital holography system recording ultrafast process of the femtosecond order. Opt. Lett. 2006, 31, 1636. [Google Scholar] [CrossRef] [PubMed]
  48. Icha, J.; Weber, M.; Waters, J.C.; Norden, C. Phototoxicity in live fluorescence microscopy, and how to avoid it. BioEssays 2017, 39, 1700003. [Google Scholar] [CrossRef]
  49. Ashman, R.; Gu, M. Effect of ultrashort pulsed illumination on foci caused by a Fresnel zone plate. Appl. Opt. 2003, 42, 1852–1855. [Google Scholar] [CrossRef] [PubMed]
  50. Dover, J.S.; Bhatia, A.C.; Stewart, B.; Arndt, K.A. Topical 5-Aminolevulinic Acid Combined with Intense Pulsed Light in the Treatment of Photoaging. Arch. Dermatol. 2005, 141, 1247–1252. [Google Scholar] [CrossRef]
  51. Kang, S.; Duocastella, M.; Arnold, C.B. Variable optical elements for fast focus control. Nat. Photonics 2020, 14, 533–542. [Google Scholar] [CrossRef]
  52. Ebner, M.; Koch, P.A.; Haucke, V. Phosphoinositides in the control of lysosome function and homeostasis. Biochem. Soc. Trans. 2019, 47, 1173–1185. [Google Scholar] [CrossRef]
Figure 1. Schematic of the PM-DHM principle. (a) Pulsed modulated light illuminates the flowing suspension in a microfluidic system, with the pulse timings t1, t2, and t3. (b) The camera captures the dynamics of the flowing microparticles at multiple time points (t1, t2, and t3) within a single exposure. The red area represents the range illuminated by the laser. The dots indicate the samples to be tested, of which the red dot specifically marks the same particle imaged in multiple frames during a single exposure, illustrating the experimental principle. The direction of the arrows indicates the flow direction of the samples.
Photonics 12 00411 g001
Figure 2. Control principle of the PM-DHM. (a) Schematic diagram of the PM-DHM experimental setup. G, polarization grating; L1–L5, achromatic lens; M1 and M2, Mirrors; MMF, multimode fiber; MO1 and MO2, microscopic objectives; P1–P2, polarizers; PH, pinhole; WL, waste liquid vial; MC, microfluidic chip; QW, quarter-wave plate; RD, rotating diffuser. (b) Synchronization of timing control between the laser and camera using a DAQ device. (c) Time relationship between camera exposure and pulsed modulated illumination, as shown on the oscilloscope.
Photonics 12 00411 g002
Figure 3. Measurement of flowing PMMA microspheres with PM-DHM. (a) Digital holograms, (b) amplitude and (c) phase images of PMMA microspheres. The illustration in the upper right corner of each hologram shows magnified interference fringes of the object and reference light. (a1c1) are images of a single static PMMA microsphere under non-pulse modulation. The camera’s exposure time is equal to the illumination time of 10 ms. (a2c4) are images of flowing PMMA microspheres at different TL values obtained with PM-DHM, corresponding to TL values of 50 ms, 10 ms, and 2 ms, respectively. The microspheres were illuminated by pulses with durations Ton of 0.5 ms, 0.1 ms, and 0.02 ms, respectively. In these images, the particles generally move from right to left, as indicated by the arrow in (a2). The dynamics of a flowing particle at three different time points (t1, t2, and t3) can be captured in a single hologram.
Photonics 12 00411 g003
Figure 4. Reconstruction quality varying with illumination time. (a) Reconstructed phase images of a PMMA microsphere presented in Figure 3c. (b) The phase distribution along the four dash lines in (a). The signal-to-background ratio (SBR) was calculated when treating the peaks of the curves in (b) as the signal and the plateaus of the curves as the background. (b) Scalebar = 10 μm. The different colors of the borders in the phase images (a1a4) in (a) correspond directly to the colors of the curves in (b).
Photonics 12 00411 g004
Figure 5. Measurement of flowing red blood cells with PM-DHM. (a1c1) Hologram, the reconstructed amplitude image, and the reconstructed image of a red blood cell under the non-pulsed modulated illumination mode. (a2c2) Hologram, the reconstructed amplitude image, and the reconstructed image of a red blood cell under the pulsed modulated illumination mode. The direction of the arrows indicates the flow direction of the red blood cells.
Photonics 12 00411 g005
Table 1. Summary of PM-DHM Experimental Parameters and Calculated Results.
Case(a2)(a3)(a4)
TL (ms)50102
Ton (ms)0.50.10.02
v12 (mm/s)0.460.655.29
v23 (mm/s)0.450.735.12
a (mm/s2)−0.328.10−85
F (fN)−0.389.56100
The values in bold are the measurement results; the others are the experimental parameters employed. The force is generated by manually pressing the syringe. In the experiment, when the microparticles reach their maximum speed, the syringe is released, and the negative pressure inside the syringe generates a reverse force.
Disclaimer/Publisher’s Note: The statements, opinions and data contained in all publications are solely those of the individual author(s) and contributor(s) and not of MDPI and/or the editor(s). MDPI and/or the editor(s) disclaim responsibility for any injury to people or property resulting from any ideas, methods, instructions or products referred to in the content.

