Abstract
In this paper, a method for detection of crack locations and the width of basin insulators is proposed. Based on the optical frequency domain reflectometry (OFDR) system, the system utilizes an FBG with high feedback for strain as well as temperature, which is affixed to the surface of the tub insulator, and a common single-mode optical fiber, which is used for transmitting data and connected to the optical backscattering reflectometry interrogator. The interrogator measures the backscattered light from the FBG, which varies with temperature or strain. The method has been used to measure the location and width of several different cracks and can locate the crack position with a spatial resolution of 1 mm and measure the crack width with a resolution of 0.77 mm. The method has been used to measure the position and width of insulators. This method provides a simple and fast approach to crack detection in insulators.
1. Introduction
A gas-insulated switchgear (GIS), characterized by its high operational reliability, small footprint, high scalability, and convenient maintenance and repair, is an important part of the extra-high voltage transmission network, and its safe and reliable operation is crucial for the stability of a power system. As the core component of a GIS, the insulating cylinder plays the role of insulating support and isolating the air chamber, and its insulation performance is the most crucial issue in GIS design, production, and grid operation and maintenance departments [1]. However, operation experience shows that insulating cylinders have been involved in many flashover accidents along surfaces during operation, and the on-site monitoring measures have failed to provide early warning. The equipment reliability of insulating cylinders is also much lower than that of other components, such as basin insulators. With the continuous advancement of the UHV project, it is urgent to grasp the causes of insulating cylinder flashover and improve the insulation level of UHV GISs.
There are many sensors for detecting device strain and temperature, such as traditional optical time-domain reflectometer (OTDR) technology [2], and portable temperature sensors [3] can realize the measurement and monitoring of strain and temperature, but both have obvious shortcomings. Although an OTDR can reach a measurement distance of tens or even hundreds of kilometers, a spatial resolution measurement at the millimeter level has never been achieved, and the same portable temperature sensor cannot achieve distributed fine measurement due to its own size, i.e., it cannot achieve high-resolution measurement. OTDR technology and portable temperature sensors are unable to meet the needs of the current environment; therefore, there is an urgent need for a distributed measurement system with high accuracy, high sensitivity, and high anti-interference capability.
The OFDR based on Rayleigh scattering is a kind of distributed measurement system with high resolution and strong anti-jamming capability [4]. Compared with the OTDR, Brillouin optical time-domain reflectometer (BOTDR), and Brillouin optical time-domain analysis (BOTDA), which are distributed sensing technologies with spatial resolution in the order of cm, the OFDR has a resolution in the order of mm. In addition, the OFDR takes only a few seconds for a single scan, while other technologies take at least ten seconds.
Although the OFDR has a shorter measurement distance relative to the OTDR and other sensing measurements, its resolution is greater. OFDRs are used to test fiber-under-test (FUT) links for attenuation and defects, achieving millimeter-level spatial resolution over short distances in the order of tens to hundreds of meters. With the development of narrow-linewidth tunable lasers (TLs) and the in-depth study of phase noise suppression in the OFDR, the sensing range can reach the order of 100 km, and further temperature and strain measurements can be carried out. Among various fiber optic sensing technologies, the OFDR has good spatial resolution, measurement accuracy, and real-time sensing in short-distance measurement; thus, it has unique advantages in high-precision testing scenarios, such as precision equipment testing, component testing, and material and assembly testing. At present, OFDR sensing parameters have been expanded from temperature and pressure to vibration, refractive index, shape, and other aspects, which is of great significance in aerospace, intelligent structure, material processing, oil and gas pipeline leakage detection, optical network monitoring, and biomedical applications and other fields. The OFDR has attracted considerable attention due to its high spatial resolution, which can reach the millimeter scale [5] or even 10 μm [6]. In addition, in recent years, with a large number of scholars’ research on OFDR, the measurement sensing range of the OFDR has been increased to tens and hundreds of kilometers [7,8]. And there has been a discussion of crack measurements in materials such as concrete [9] and the relationship between crack size and OFDR results [10]. Since OFDR technology has the advantages of high spatial resolution and long sensing range, it can obtain the strain and temperature of multiple monitoring points at the same time, which overcomes the shortcomings of the traditional electronic sensors and the traditional optical sensors, and therefore the measurement of insulator cracks using an OFDR will be a reliable method.
2. Material and Methods
2.1. Principle of Crack Measurement
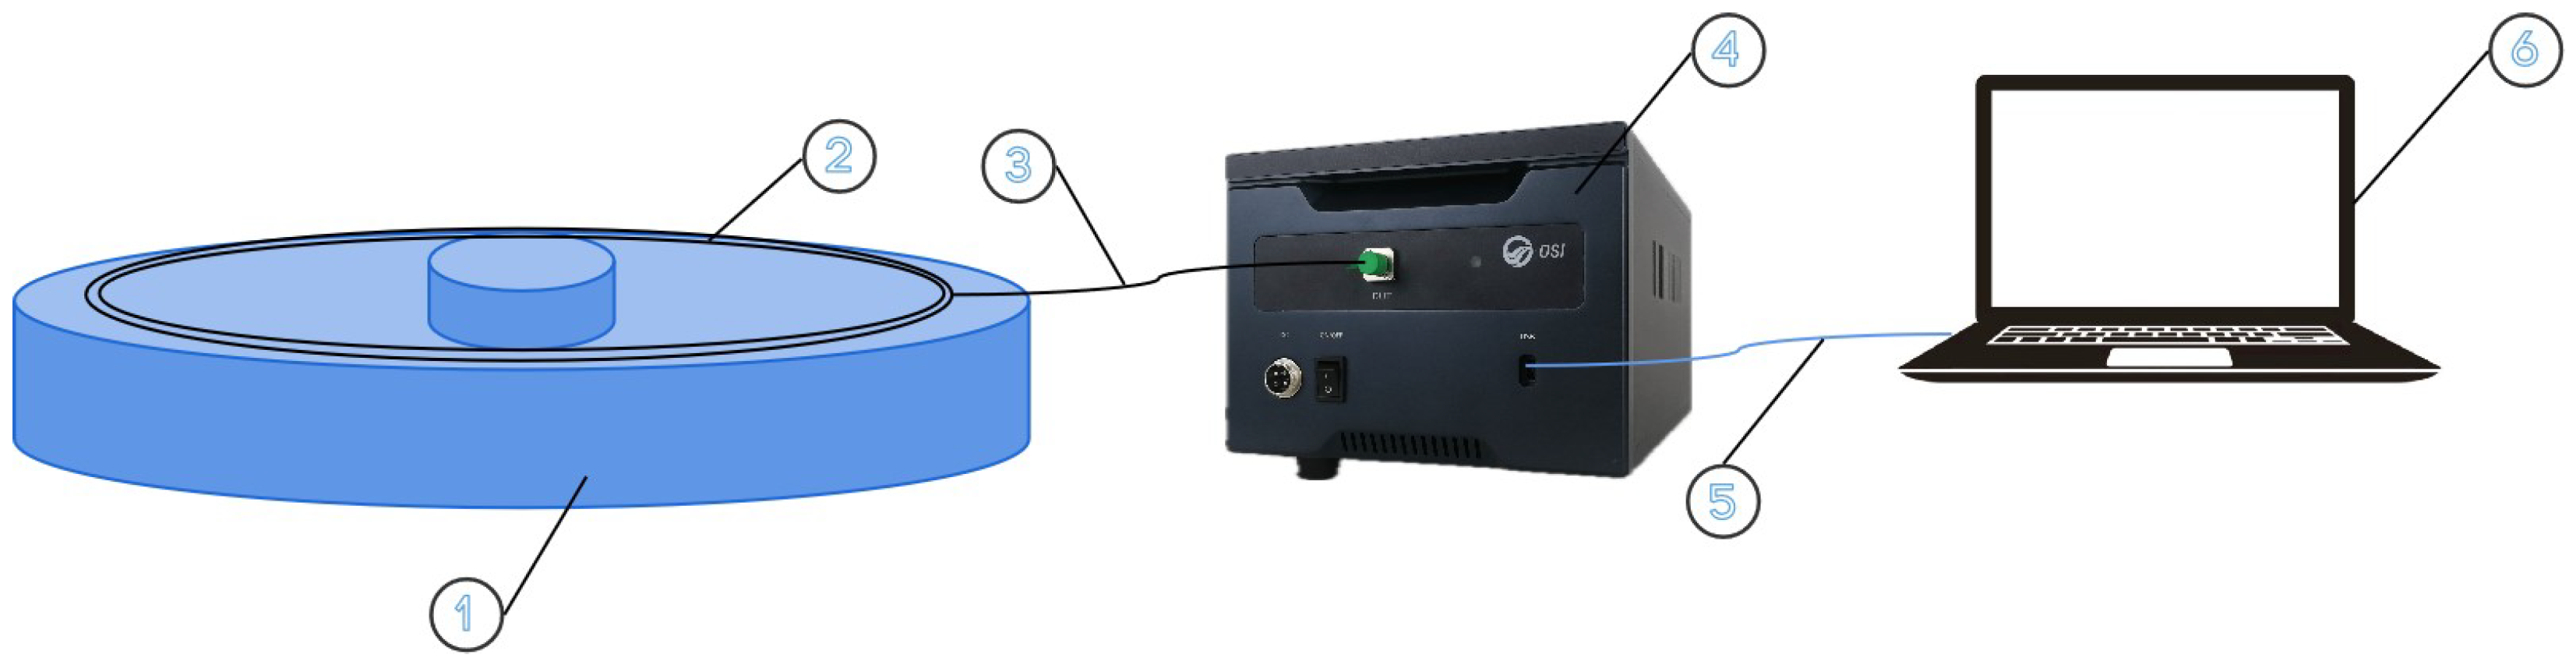
As shown in Figure 1, we pasted a weak-reflection fiber Bragg grating (WFBG) array with high feedback for strain and temperature on the surface of the tub insulator, fused another ordinary single-mode fiber for data transmission at one of the ends, and fused a coreless fiber at the end of the FBG through a fiber optic fusion splicer to attenuate the reflection of the tail end and to avoid the reflection of light during the detection of data. A weak-reflection fiber Bragg grating array is simply an FBG with a reflectivity of less than 0.01%, and the difference between ordinary single-mode sensing fibers is only the size of the reflected light. The other end of the single-mode fiber is an FC/APC patch cord for connecting to the OSI interrogator.

Figure 1.
Schematic diagram (1: potted insulator, 2: FBG, 3 single-mode fiber, 4: OSI interrogator, 5: Type-C cable, 6: laptop).
A WFBG is an FBG with reflectivity lower than 0.01%. The WFBG array integrates the ideas of conventional interference, inline interference, the fiber grating, and distributed fiber sensing and multiplexes thousands of WFBGs on a single optical fiber. WFBG reflectivity is usually less than 0.01%, with a bandwidth of 3 dB of 2 pm−8 nm, a grating length of 9 mm−10 cm, and a grating spacing of 1 mm minimum. The WFBG has low reflectivity and no fusion point, and compared with the ordinary FBG, the multiplexing ability is greatly enhanced due to its stronger reflective power. Since the reflected light is stronger than the Rayleigh scattered light, it can be compared with distributed fiber optic sensing, and the demodulation speed of the signal also has a greater advantage. Therefore, the weakly reflective fiber grating has great application prospects.
During the measurement of cracks on the surface of a potted insulator, the FBG senses both strain changes (due to squeezing underneath) and temperature changes (due to temperature changes in the environment). Both air pressure changes and temperature changes below the insulator cause changes in the strain on the insulator’s upper surface, and since crack measurements are based on strain measurements, changes in air pressure can be replaced by temperature changes, thus reducing the complexity of the experiment. Crack measurements are conducted by fixing the insulator to a hollow cylinder to simulate the situation of a basin insulator in a real GIS system, after which the strain changes on the insulator’s upper surface are measured by heating underneath the insulator. The interrogator receives light backscattered from each tiny sensing point of the FBG and measures its spectral shift induced by strain or temperature.
Rayleigh scattering is an intrinsic scattering loss caused by scale inhomogeneities or changes in the refractive index of the fiber material itself. Rayleigh scattering only occurs when the wavelength of the optical signal is greater than the inhomogeneous size of the fiber. In Rayleigh scattering, the collisions of the incident light with the molecules in the fiber are elastic collisions, so the scattered light frequency remains constant with the incident light frequency. The optical signal at the position inside the fiber can be expressed as:
where is the incident optical power at , is the attenuation coefficient of the transmission fiber, and the Rayleigh scattering loss is inversely proportional to the fourth power of the wavelength. Due to the presence of absorption attenuation, scattering attenuation, and other attenuation, the attenuation coefficient behaves as a function of position x and has :
Considering only the effect of absorption loss and Rayleigh scattering loss ,
The above equation can be obtained by bringing it into Equation (1):
When the Rayleigh scattering is the same at each position inside the fiber, the total Rayleigh scattering power at position x is
The Rayleigh backscattering power is
where S is the Rayleigh backscattering coefficient and is the average transmission loss of the transmission fiber.
As a result, the Rayleigh backscattered signal decays at a rate exponential to the distance. For a tested optical fiber, the relationship between the amount of change in the Rayleigh backscattering spectrum and the amount of change in external strain and temperature is given in Equation (8):
where
- —temperature scaling factor;
- —rain scaling factor;
- —amount of variation in Rayleigh spectral wavelength;
- —amount of Rayleigh spectral frequency variation;
- —amount of change in external temperature;
- —strain variation in the fiber.
When measuring strain- or temperature-induced spectral drift alone, the displacement of the spectrum is linearly related to the strain or temperature change, so the interrogator can provide a high resolution (1 mm in this paper). The FBG is applied spirally and along the radius on the upper surface of the tub insulator so that it can basically cover the cracks in all positions.
2.2. Crack Width Calibration
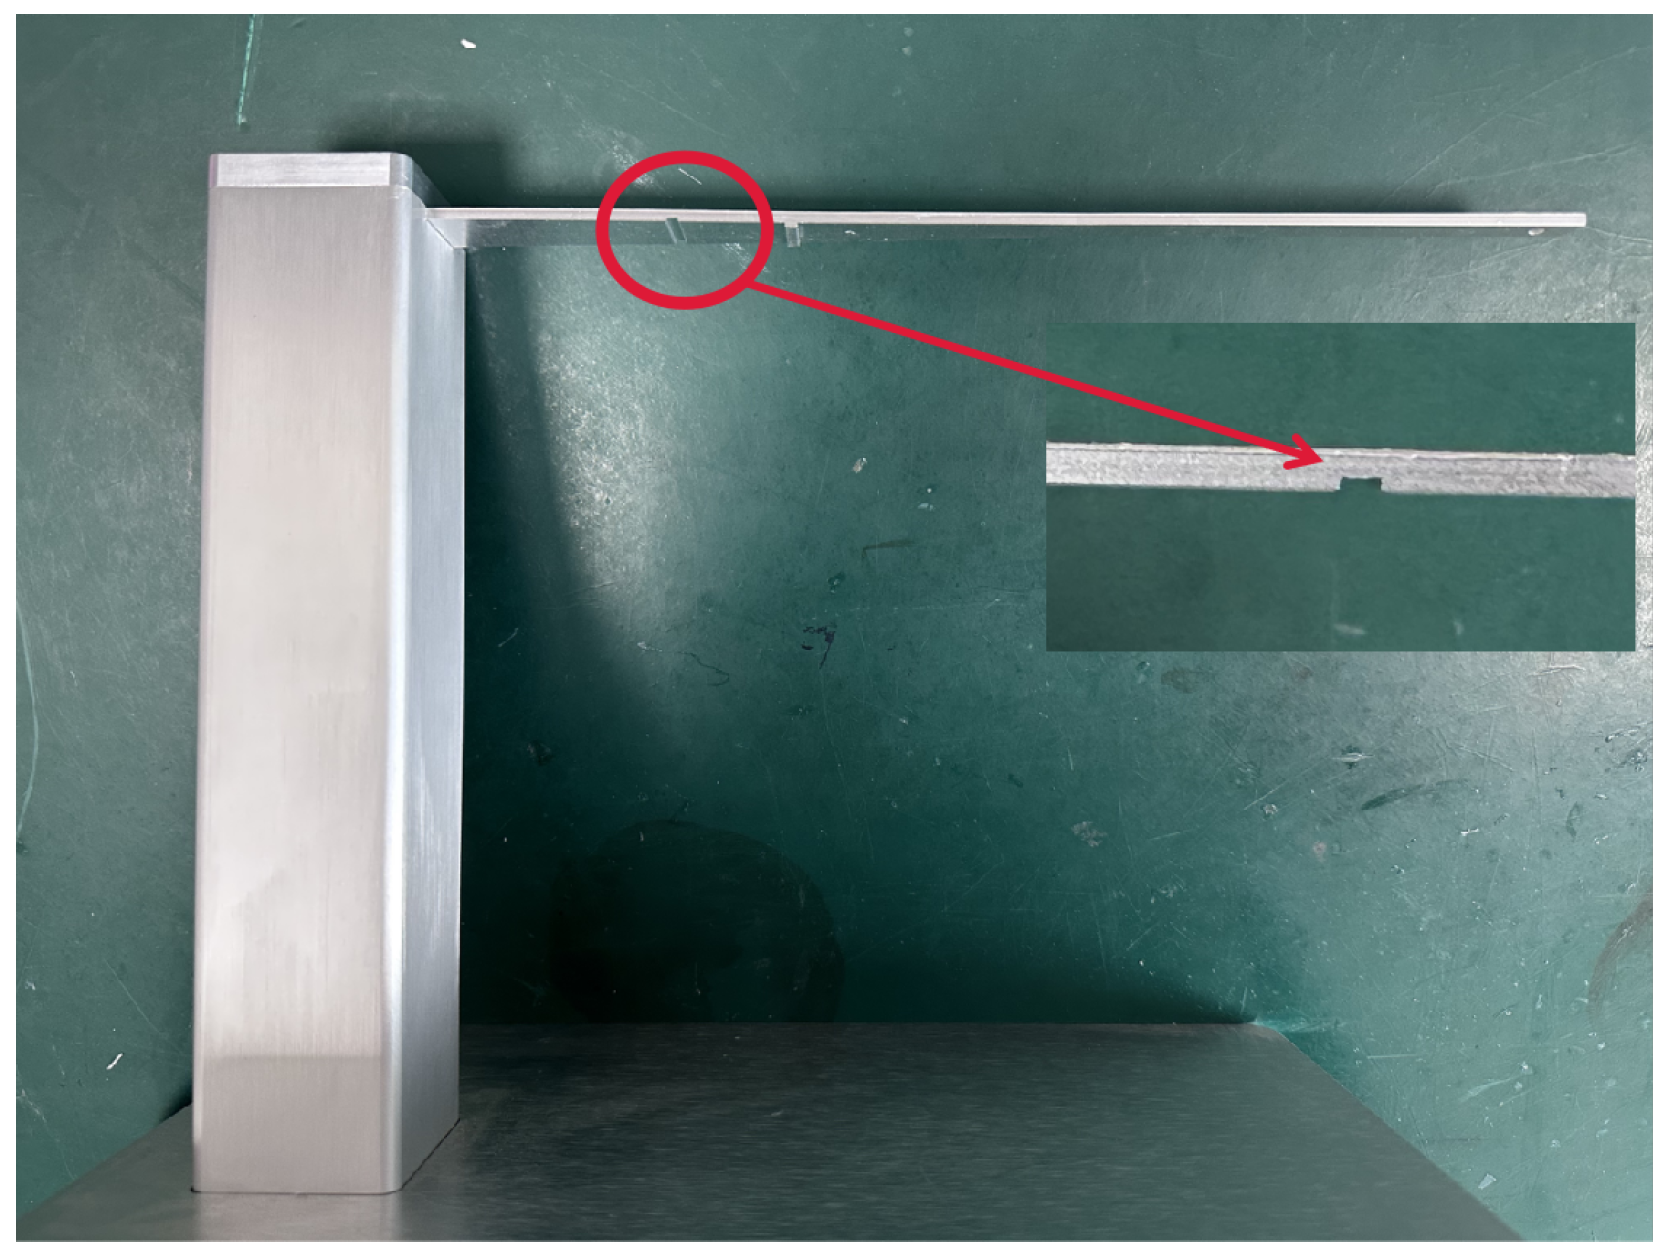
In order to find the relationship between the spectral drift detected by the interrogator and the crack width, the coefficient between the two is needed. The FBG used for sensing was pasted on the upper surface of an equal-strength beam with a crack, as shown in Figure 2.

Figure 2.
Physical diagram of equal strength beam.
When the equal-strength beam deforms, either the optical fiber pasted on the upper surface or the lower surface produces strain, and the magnitude of the strain is related to the degree of deformation of the equal-strength beam and has no relationship with the position, which is determined by the nature of the equal-strength beam itself: the strain on the arms of the equal-strength beam is always equal. When there is a defect on the outer surface of the equal-strength beam, the strain at the defect location is significantly different from the strain elsewhere, so the location of the defect can be determined based on this property, and experiments can be conducted on equal-strength beams with different defects to discover the relationship between the size of the defect and the strain. The specific phenomenon is shown in the Supplementary Materials video. Using the SMF to connect the equal strength beams and interrogator, the strain values at the cracks of five different strength beams with crack widths of 2 mm, 2.5 mm, 3 mm, 3.5 mm, and 4 mm were measured. When pressing on the end of the equal-strength beam, a downward bend occurs, which causes a positive strain in the sensing fiber on the upper surface. By comparing the strain values of the strength beams with different crack sizes, the relationship between the width of the crack and the half-width of the wave peak at the corresponding location can be found, and the strength beam strains are shown in Figure 3. The depth of each of these equal-strength beams is 1 mm, since the depth of the crack does not affect the width of the crack because of the relationship between the crack width and the magnitude of the strain.
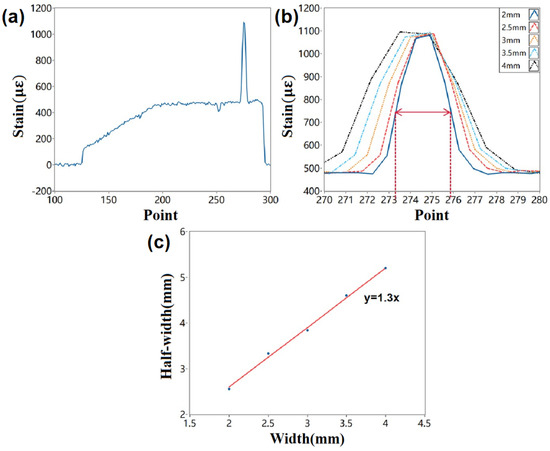
Figure 3.
(a): Strain in a 3 mm crack strength beam; (b) strain corresponding to cracks of different sizes; (c) relationship between half-width of strain values and crack widths.
The strain values in Figure 3a represent the overall strain distribution on the upper surface of the strength beam, where point 125−190 is the cantilever beam part, and the strain value becomes larger as it gets closer to the fixed end; point 190−295 is the strength beam part, and the strain value is always the same on the whole beam; and the protruding part in the middle is the crack which causes the strain value to increase. The spatial resolution represented by each point during strain measurement is 1.28 mm. Strength beams with different cracks show different phenomena in the strain diagrams, and the larger the crack, the wider the appearance of the bulge, as shown in Figure 3b. The strain values of the strength beams with different cracks are the same throughout the whole beam, and the bulge in the middle is caused by the crack. According to the calculation, the peak half-widths of the upward bulges caused by five different cracks are 2, 2.6, 3, 3.6, and 4.1 points, i.e., 2.56, 3.33, 3.84, 4.6, and 5.2 mm. Through the results of the five measurements, the relationship between the widths of the cracks and the peak half-widths of the waves at the corresponding positions can be approximated as follows:
where l is the half-width of the strain value and d is the actual width of the crack. The minimum spatial scale that the OSI system can measure is 1 mm, and the corresponding crack width is 0.77 mm, so the measurement accuracy of the crack size is 0.77 mm.
2.3. Measurement of Basin Insulators
It is difficult to maintain a consistent internal temperature distribution in insulators during fabrication due to their size, which can lead to uneven pressure distribution during internal curing and ultimately cracks during system operation. Since most of the pot insulators are made of compliant glass fiber materials, the insulation support function of the cracked pot insulators cannot be maintained, which affects the normal operation of the whole power supply system. Therefore, if cracks in insulators can be localized and their generation and size monitored, these accidents can be avoided.
Depending on the size of the insulator, OFDR technology with high spatial resolution and high strain accuracy is well suited for distributed measurements on the insulator surface.
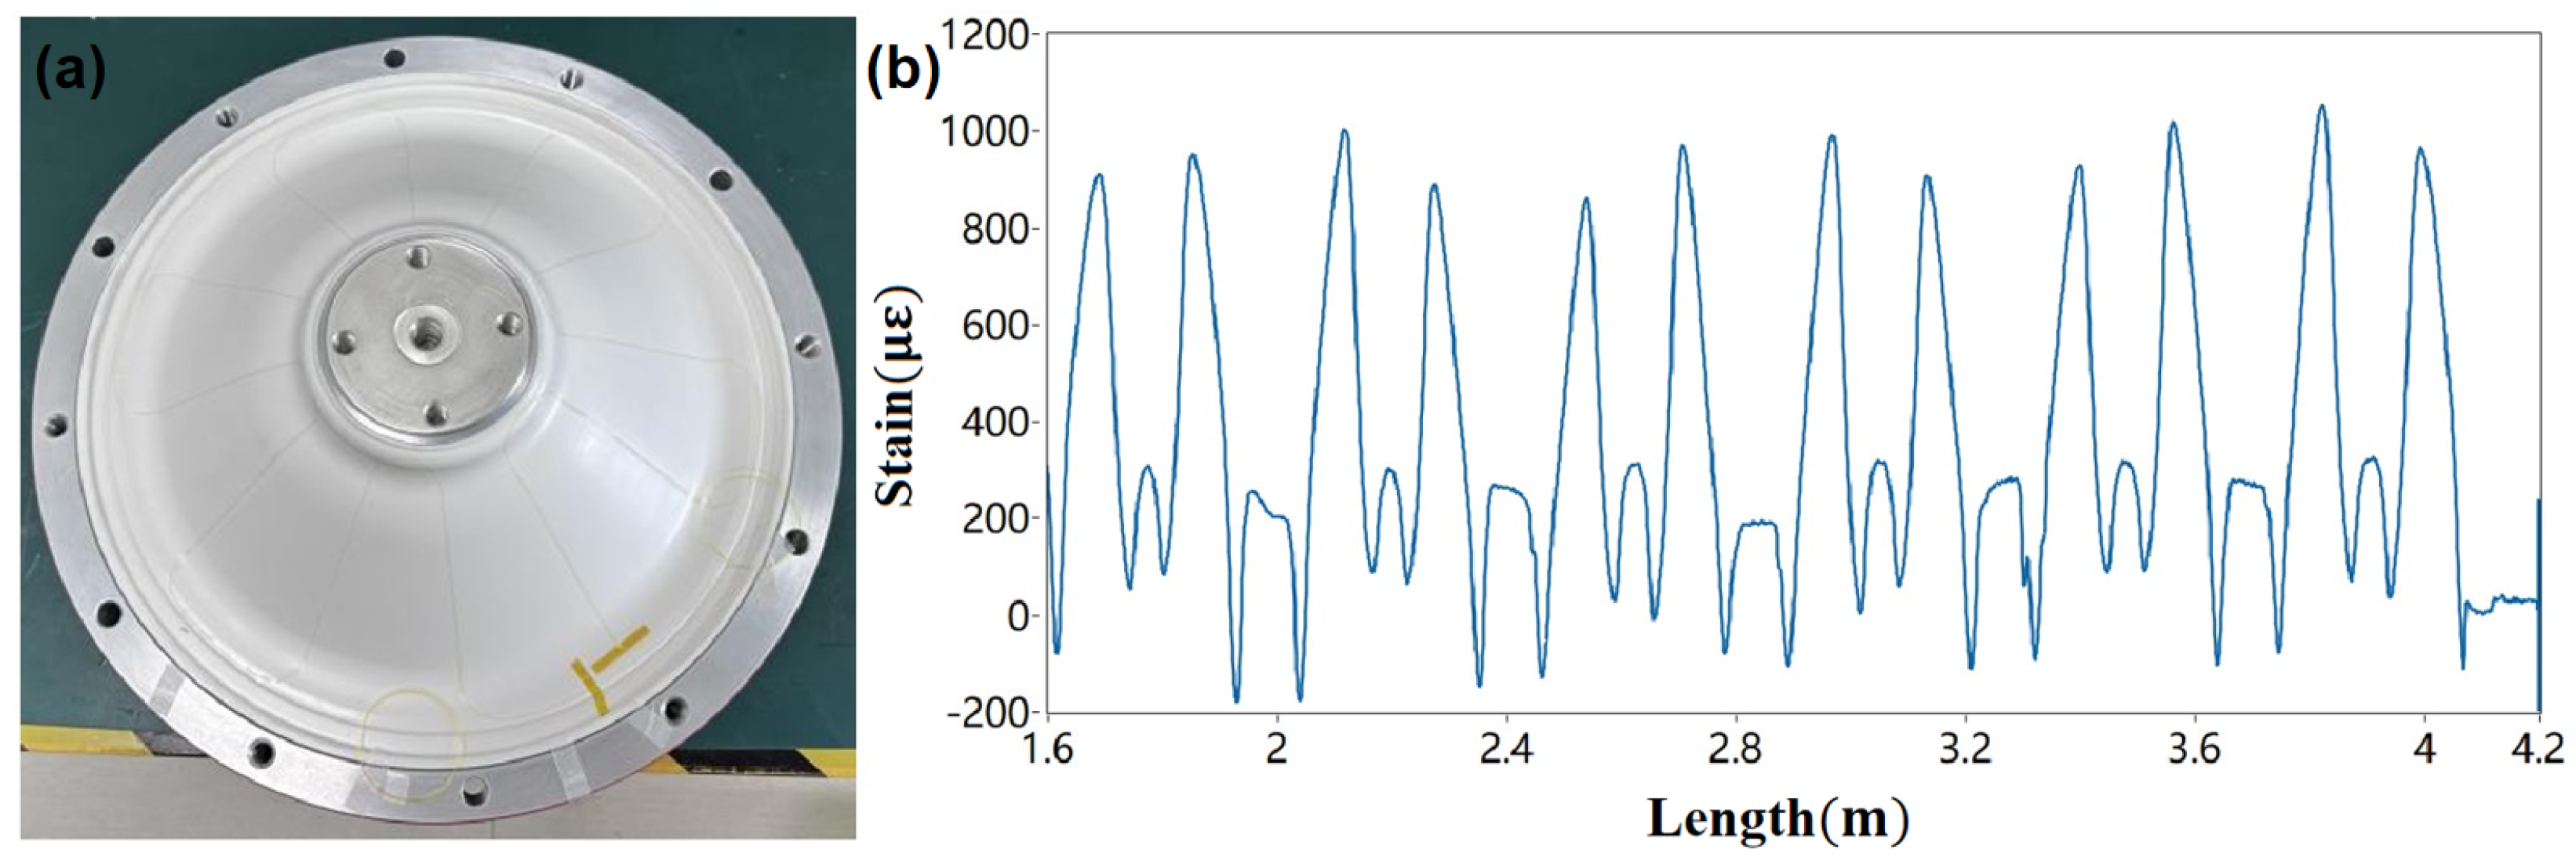
The upper surface of the tub insulator of Figure 1 is shown in Figure 4a, where the metal edge of the tub insulator is fixed to a hollow cylinder. When heating the lower surface of the insulator from the inside of the cylinder, the heated insulator expands, and thus the FBG on the upper surface undergoes a change in strain as shown in Figure 4b, where the peaks of the strain curve correspond to the insulator waist and the troughs correspond to the top and bottom. Since the FBG on the upper surface is periodically pasted, the strain value is also somewhat periodic. The FBG pasted on the upper surface of the insulator is affected by both temperature and strain, and the relationship is shown in Equation (8).
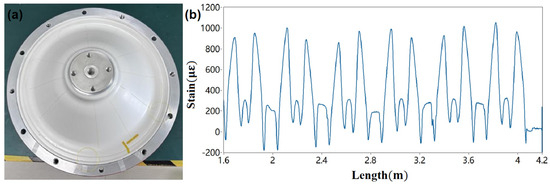
Figure 4.
(a): Schematic of the insulator upper surface; (b): strain values of the insulator upper surface after heating in the crack-free condition.
Both temperature and strain cause different strain values in the FBG from the normal surface due to the presence of cracks, so the FBG strain at the insulator cracks shows an upward convex or downward concave phenomenon.
3. Results and Discussion
Taking the connection of the FBG and SMF as the starting point, which is noted as 0 m, the measurement range of the insulator’s upper surface is 1.3−4.2 m. The distributed strain on the insulator’s upper surface can be determined from the corresponding strain values at each point with the points on the insulator’s upper surface, as shown in Figure 5a.
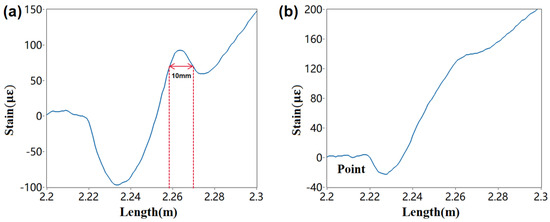
Figure 5.
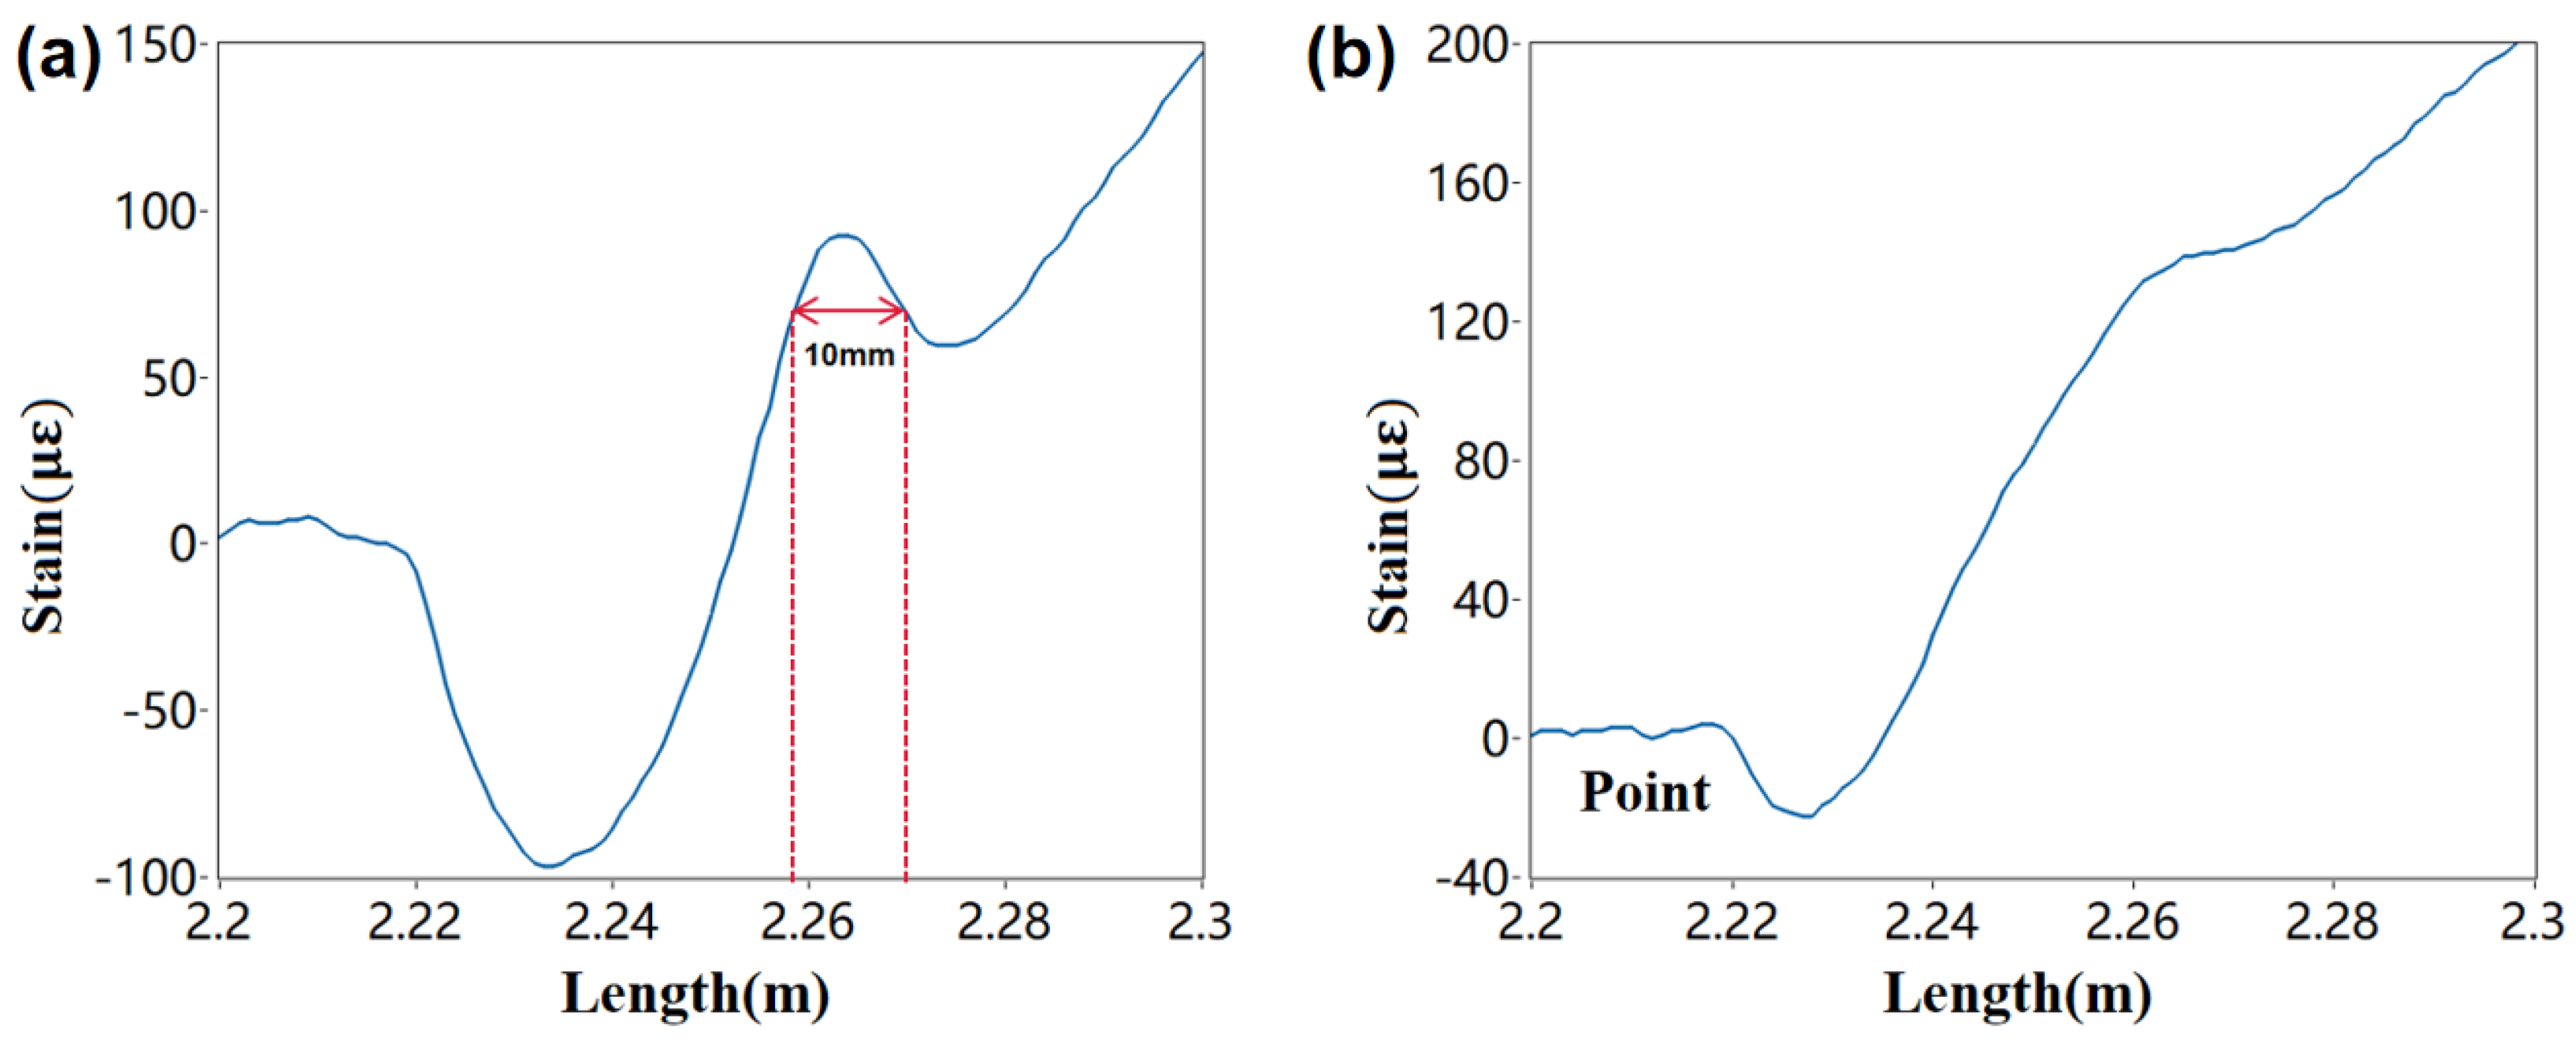
(a): Strain values at the cracks of insulators with cracks during heating; (b): strain values at the cracks of insulators with cracks after heating and resting for ten minutes.
When the insulator is cracked, the bulge on the upper surface of the heated insulator is different from the overall strain, similar to that at 2.26 m in Figure 5b. When the heating stops, the temperature of the insulator starts to be distributed uniformly, and the thermal expansion and contraction caused by the temperature starts to contract, so the strain generated by deformation gradually becomes smaller, and at the same time the strain generated by the temperature starts to be homogenized, and finally there is a very small bulge like that at the point of 2.26 m in Figure 5b.
According to Equation (9), the width of the crack is related to the half-width of the peak of the strain curve, and comparing the strains at different places on the upper surface of the insulator, it can be found that there is an upward convexity generated by the crack at 2.26 m. The half-width at 2.26 m in Figure 5a is 10 mm, and the actual measured insulator crack width is 7 mm, which is fully consistent with the conclusion of Equation (9).
4. Conclusions
This paper provides an insulator crack monitoring system and method based on OFDR technology in which the OFDR distributed fiber optic sensor, which is simple in structure, easy to operate, and stable in performance, has a strong anti-interference ability and high sensitivity, and at the same time, it has a long service life and is easy to install, so it can be used in a wide range of applications. The OFDR distributed fiber optic sensor externally takes the epoxy as a protective layer, which is more secure and not easily damaged. The OFDR distributed fiber optic sensor in this paper can accurately locate the crack opening position; precisely determine the crack opening width through the peak strain half-width; monitor the insulator cracks in real time, achieving the purpose of monitoring the crack position at the millimeter level; achieve a resolution of 0.77 mm in the detection of crack width; and reduce the cost of monitoring insulators at the same time.
Supplementary Materials
The following supporting information can be downloaded at: https://www.mdpi.com/article/10.3390/photonics11090854/s1, Video S1: demonstration video of a crack.
Author Contributions
Conceptualization, J.Z., Y.W., A.Y. and W.L.; writing—original draft preparation, J.Z.; writing—review and editing, J.Z., Y.W., A.Y., W.L. and L.X.; funding acquisition, L.X. All authors have read and agreed to the published version of the manuscript.
Funding
This research was funded by the 2021 technical research general project from the Shenzhen Science and Technology Innovation Committee [grant number: GJHZ20210705142540011].
Institutional Review Board Statement
Not applicable.
Informed Consent Statement
Not applicable.
Data Availability Statement
The data of this study are available from the corresponding author upon request.
Conflicts of Interest
The authors declare no conflicts of interest.
References
- Ma, G.; Qin, W.; Du, Y.; Zhou, H.; Li, Y.; Yan, C.; Li, C. A Centimeter Resolution GIS Insulator Strain Distribution Measurement Method Based on OFDR. IEEE Sensors J. 2018, 19, 2962–2969. [Google Scholar] [CrossRef]
- Barnoski, M.; Rourke, M.; Jensen, S.M.; Melville, R.T. Optical time domain reflectometer. Appl. Opt. 1977, 16, 2375–2379. [Google Scholar] [CrossRef] [PubMed]
- Pertijs, M.A.; Huijsing, J. Precision Temperature Sensors in CMOS Technology; Springer: Dordrecht, The Netherlands, 2006. [Google Scholar]
- Eickhoff, W.F.; Ulrich, R.J.A.P.L. Optical frequency domain reflectometry in single-mode fiber. Appl. Phys. Lett. 1981, 39, 693–695. [Google Scholar] [CrossRef]
- Wang, B.; Fan, X.; Wang, S.; Du, J.; He, Z. Millimeter-resolution long-range OFDR using ultra-linearly 100 GHz-swept optical source realized by injection-locking technique and cascaded FWM process. Opt. Express 2017, 25, 3514–3524. [Google Scholar] [CrossRef] [PubMed]
- Park, Y.; Ahn, T.-J.; Kieffer, J.-C.; Azaña, J. Optical frequency domain reflectometry based on real-time Fourier transformation. Opt. Express 2007, 15, 4597–4616. [Google Scholar] [CrossRef] [PubMed]
- Koshikiya, Y.; Fan, X.; Ito, F. Long Range and cm-Level Spatial Resolution Measurement Using Coherent Optical Frequency Domain Reflectometry With SSB-SC Modulator and Narrow Linewidth Fiber Laser. J. Light. Technol. 2008, 26, 3287–3294. [Google Scholar] [CrossRef]
- Fan, X.; Koshikiya, Y.; Ito, F. Centimeter-level spatial resolution over 40 km realized by bandwidth-division phase-noise-compensated OFDR. Opt. Express 2011, 19, 19122–19128. [Google Scholar] [CrossRef] [PubMed]
- You, R.; Ren, L.; Song, G. A novel OFDR-based distributed optical fiber sensing tape: Design, optimization, calibration and application. Smart Mater. Struct. 2020, 29, 105017. [Google Scholar] [CrossRef]
- Zhao, L.; You, R.; Ren, L. Inverse finite element method and support vector regression for automated crack detection with OFDR-Distributed fiber optic sensors. Measurement 2024, 234, 114916. [Google Scholar] [CrossRef]

Disclaimer/Publisher’s Note: The statements, opinions and data contained in all publications are solely those of the individual author(s) and contributor(s) and not of MDPI and/or the editor(s). MDPI and/or the editor(s) disclaim responsibility for any injury to people or property resulting from any ideas, methods, instructions or products referred to in the content. |
© 2024 by the authors. Licensee MDPI, Basel, Switzerland. This article is an open access article distributed under the terms and conditions of the Creative Commons Attribution (CC BY) license (https://creativecommons.org/licenses/by/4.0/).