


Abstract
Reliable multicomponent analysis has become an increasingly important objective in surface-enhanced Raman spectroscopy (SERS) as analytical applications extend beyond the detection of predefined molecular targets. However, identifying and quantifying multiple constituents within chemically complex samples remains challenging because SERS spectra do not directly represent the underlying chemical composition. Instead, they are shaped by selective molecular representation at plasmonic interfaces and the superposition of signals from multiple constituents, creating an inherently ambiguous relationship between spectral observations and the chemical system being analyzed. This review examines the physicochemical origins of these challenges and the analytical strategies developed to overcome them. Existing approaches are organized according to their primary analytical function, encompassing selective interfacial control, physical separation, computational analysis, and integrated analytical workflows. Each strategy is evaluated in the context of the specific analytical limitations it addresses, providing a structured perspective on the capabilities and remaining challenges of multicomponent SERS analysis.
1. Introduction
Surface-enhanced Raman spectroscopy (SERS) combines molecule-specific vibrational fingerprints with plasmonic signal enhancement to enable highly sensitive chemical analysis. In metallic nanostructures, the excitation of localized surface plasmon resonances generates strongly enhanced electromagnetic fields near the surface, thereby amplifying Raman scattering by several orders of magnitude and allowing molecular identification at trace concentrations and, under optimized conditions, even at the single-molecule level [1,2,3,4,5]. More broadly, engineering surface plasmon resonances and their associated electromagnetic fields has enabled diverse photonic applications, including plasmonic sensing and resonant optical absorption [6,7]. This combination of sensitivity and chemical specificity has established SERS as a versatile analytical platform for clinical diagnostics, food safety, environmental monitoring, and forensic science, where reliable molecular information must often be obtained from limited sample quantities [8,9].
As SERS has become established across diverse analytical applications, the questions it is expected to answer have also evolved. Many contemporary analytical problems no longer involve isolated molecular targets but chemically complex biological and environmental systems. Diagnostically and chemically meaningful information increasingly arises from the collective behavior of multiple molecular constituents rather than from any single analyte alone. Consequently, analytical methods are increasingly expected to characterize minimally processed samples while preserving their native molecular composition. These emerging analytical demands have expanded the role of SERS beyond highly sensitive molecular detection toward the characterization of complex molecular systems. Recent studies have begun to explore this direction in applications such as exosome profiling for lung cancer diagnosis [10], urine-based discrimination of renal cell carcinoma [11], and bacterial identification in complex biological matrices [12,13].
Meeting these emerging analytical demands is fundamentally challenging because a SERS measurement does not represent all molecular constituents within a complex specimen equally. Instead, only molecules that access plasmonically active regions contribute substantially to the measured signal, and their representation is further shaped by interfacial interactions [14,15,16,17]. Furthermore, the measured spectrum represents the superposition of Raman signals from multiple molecular species, often with substantial spectral overlap [18]. Together, selective molecular representation and spectral superposition fundamentally complicate the interpretation of multicomponent SERS spectra and have motivated the development of analytical strategies that improve the reliability of molecular identification, discrimination, and quantification in chemically complex samples [19,20].
To address these challenges, a wide range of analytical strategies has been developed. Some approaches regulate molecular representation at the plasmonic interface, whereas others reduce chemical complexity before spectral acquisition or computationally resolve spectral ambiguity after measurement. Increasingly, these complementary strategies are integrated into unified analytical workflows, with artificial intelligence playing an expanding role in spectral interpretation. Rather than focusing on individual analytical or computational techniques in isolation, this review examines multicomponent SERS from the perspective of the analytical challenges that arise during molecular representation and spectral interpretation. Accordingly, we categorize current strategies by the specific challenges they address, providing a framework for comparing selective interfacial control, physical separation, computational inference, and integrated analytical workflows. This challenge-oriented perspective highlights the strengths, limitations, and complementary roles of these approaches and identifies opportunities for further development of reliable multicomponent SERS analysis.
The review therefore progresses from the physicochemical origins of analytical ambiguity to the strategies developed to address the resulting analytical challenges. We first examine how molecular representation at the plasmonic interface and spectral complexity shape multicomponent SERS measurements. We then evaluate selective interfacial control, physical separation, computational inference, and integrated analytical workflows as complementary strategies for addressing these challenges. Finally, we consider the remaining limitations and future directions toward reliable multicomponent SERS analysis.
2. The Origins of Chemical Complexity in Multicomponent SERS
The fundamental difficulty of multicomponent SERS arises from the selective nature of plasmon-enhanced signal generation. Unlike conventional Raman spectroscopy, which samples all molecules within the illuminated volume, SERS selectively amplifies only those molecules located within plasmonically active hotspots [1,21]. The measured spectrum therefore reflects a selectively represented interfacial molecular population rather than the sample as a whole. Understanding multicomponent SERS therefore requires consideration of both molecular representation at the plasmonic interface and the formation of the measured spectrum. These two aspects are discussed in the following sections.
2.1. Molecular Representation at the Plasmonic Interface
Surface-enhanced Raman spectroscopy generates molecular signals through localized plasmonic field enhancement rather than uniform excitation of the sample. Although both electromagnetic and chemical enhancement contribute to signal amplification, the electromagnetic mechanism dominates in most plasmonic substrates because localized surface plasmon resonances generate intense near fields that enhance Raman scattering by several orders of magnitude [1,21,22]. Since these electromagnetic fields are confined to nanoscale gaps and junctions between plasmonic nanostructures, only molecules located within these hotspots contribute substantially to the measured spectrum, whereas molecules outside these regions contribute little regardless of their abundance. Consequently, access to plasmonically active hotspots becomes the first determinant of molecular representation in SERS.
Once multiple molecular species reach the plasmonic interface, hotspot occupancy is governed primarily by interfacial adsorption rather than by bulk concentration. Molecular affinity, adsorption kinetics, and competitive adsorption determine which species preferentially occupy the limited number of plasmonically active sites and therefore dominate the measured spectrum. Adsorption-equilibrium models further show that hotspot occupancy is governed by surface adsorption equilibria rather than by bulk concentration alone (Figure 1A,B) [17,18]. As a result, increasing the concentration of a molecule does not necessarily lead to a proportional increase in its surface population or SERS intensity because adsorption sites are limited and different molecular species compete for access to them.
Figure 1.
Interfacial adsorption governs molecular representation at the plasmonic interface through competitive adsorption and adsorption equilibrium. (A) Conceptual illustration of competitive adsorption between BTAH and BPE on an Ag-HfO2-CNT SERS substrate, showing normalized SERS intensity as a function of concentration ratio. Reproduced with permission from ref. [17], Copyright 2017 American Chemical Society. (B) Representative adsorption models describing heterogeneous adsorption equilibria at plasmonic interfaces, comparing single-site, dual-site, and dual-arrangement Langmuir fits to SERS peak area as a function of concentration. Reproduced with permission from ref. [18], Copyright 2015 American Chemical Society. (C) Chemical structures and characteristic SERS spectra of the bipyridine isomers 2,2′-bpy and 4,4′-bpy (left), together with time-dependent SERS mapping of their binary mixture at high concentration (middle) and the corresponding spectral analysis of mixed and pure adsorption events (right), illustrating how competitive adsorption at the plasmonic interface produces spectral events that alternate over time rather than a signal that scales proportionally with concentration. Reproduced with permission from ref. [23], Copyright 2016 The Royal Society of Chemistry.
This behavior has been demonstrated across a wide range of multicomponent systems. In binary adsorption experiments, strongly adsorbing molecules can dominate the measured spectrum even when competing species are present at substantially higher concentrations [17], and adsorption-equilibrium studies consistently show that Raman intensity scales with surface population rather than bulk concentration [18]. A mixture of bipyridine isomers illustrates this dynamic directly: time-resolved SERS spectra revealed mixed and pure spectral events alternating over time as the two isomers competed for the same hotspots, rather than signals that scaled proportionally with concentration (Figure 1C) [23].
These physicochemical processes establish the molecular population that ultimately generates the SERS signal. Consequently, the measured spectrum cannot be assumed to directly represent the molecular composition or relative abundance of a multicomponent sample. Instead, it reflects the molecular population established at the plasmonic interface. Having established how this interfacial population is selected, we next consider how signals from these molecules combine to form the measured spectrum and introduce a distinct level of analytical ambiguity.
2.2. Composite Spectral Interpretation
Once the contributing molecular population has been established at the plasmonic interface, a separate challenge arises in interpreting how its signals are expressed in the measured spectrum. Multiple molecular contributions may overlap, while interfacial interactions and matrix effects can further modify their spectral expression. Consequently, determining which molecular species give rise to the observed spectral features becomes a second fundamental challenge in multicomponent SERS analysis.
The most direct source of ambiguity is spectral overlap. Because Raman spectra from multiple molecular species are recorded simultaneously, individual bands often overlap within the same spectral region. Structurally related compounds frequently share similar vibrational modes, as illustrated by SERS spectra of bile acid species that differ only in their hydroxyl substitution pattern and remain difficult to distinguish using characteristic bands alone, becoming separable only when the entire spectral profile is considered (Figure 2A) [24]. As the number of contributing species increases, direct peak assignment becomes progressively less reliable.
Beyond this issue of overlapping contributions, the measured spectrum is further complicated because SERS spectral features depend strongly on molecular interactions at the plasmonic interface. Molecular orientation, electronic coupling, adsorption geometry, and local chemical environment can modify relative band intensities, peak positions, and line shapes compared with conventional Raman spectra [25]. Consequently, identical molecules may produce different spectral signatures under different experimental conditions, whereas different molecules may generate similar spectral responses when measured under comparable interfacial conditions (Figure 2B) [26]. The measured spectrum therefore reflects not only molecular identity but also the physicochemical conditions under which the signal is generated.
Matrix effects introduce an additional layer of complexity by influencing both spectral formation and interfacial molecular representation. Matrix constituents contribute additional Raman bands, fluorescence, and background while simultaneously modifying molecular adsorption and local electromagnetic enhancement. In biological samples, proteins readily adsorb onto plasmonic nanoparticles to form a protein corona that limits target access to plasmonic hotspots. Studies of melamine detection in milk and small-molecule analysis in serum demonstrate that protein corona formation can substantially attenuate, or even eliminate, target signals (Figure 2C) [27,28]. Matrix effects therefore alter both the molecular population established at the plasmonic interface and the spectral features ultimately recorded.
Figure 2.
Major sources of spectral ambiguity in multicomponent SERS. (A) Spectral overlap between structurally similar bile acid species, illustrated by SERS spectra of five bile acids differing by as little as a single hydroxyl group. Adapted from ref. [24] under a Creative Commons Attribution 4.0 International License (CC BY 4.0). (B) Adsorption-induced spectral variability associated with molecular orientation on a Ag nanorod, showing how distinct vibrational modes and their relative peak intensities shift with the number of adsorbed clusters. The colored arrows denote different vibrational modes and their corresponding Raman bands. Adapted from ref. [26] under a Creative Commons Attribution 4.0 International License (CC BY 4.0). (C) Matrix effects arising from protein corona formation, showing how melamine SERS signals are attenuated in the presence of different proteins (α-La, β-Lg, BSA) relative to a protein-free control. The black, red, green, and blue spectra correspond to the protein-free control, α-La, β-Lg, and BSA conditions, respectively. Adapted with permission from ref. [28], Copyright 2024 American Chemical Society.
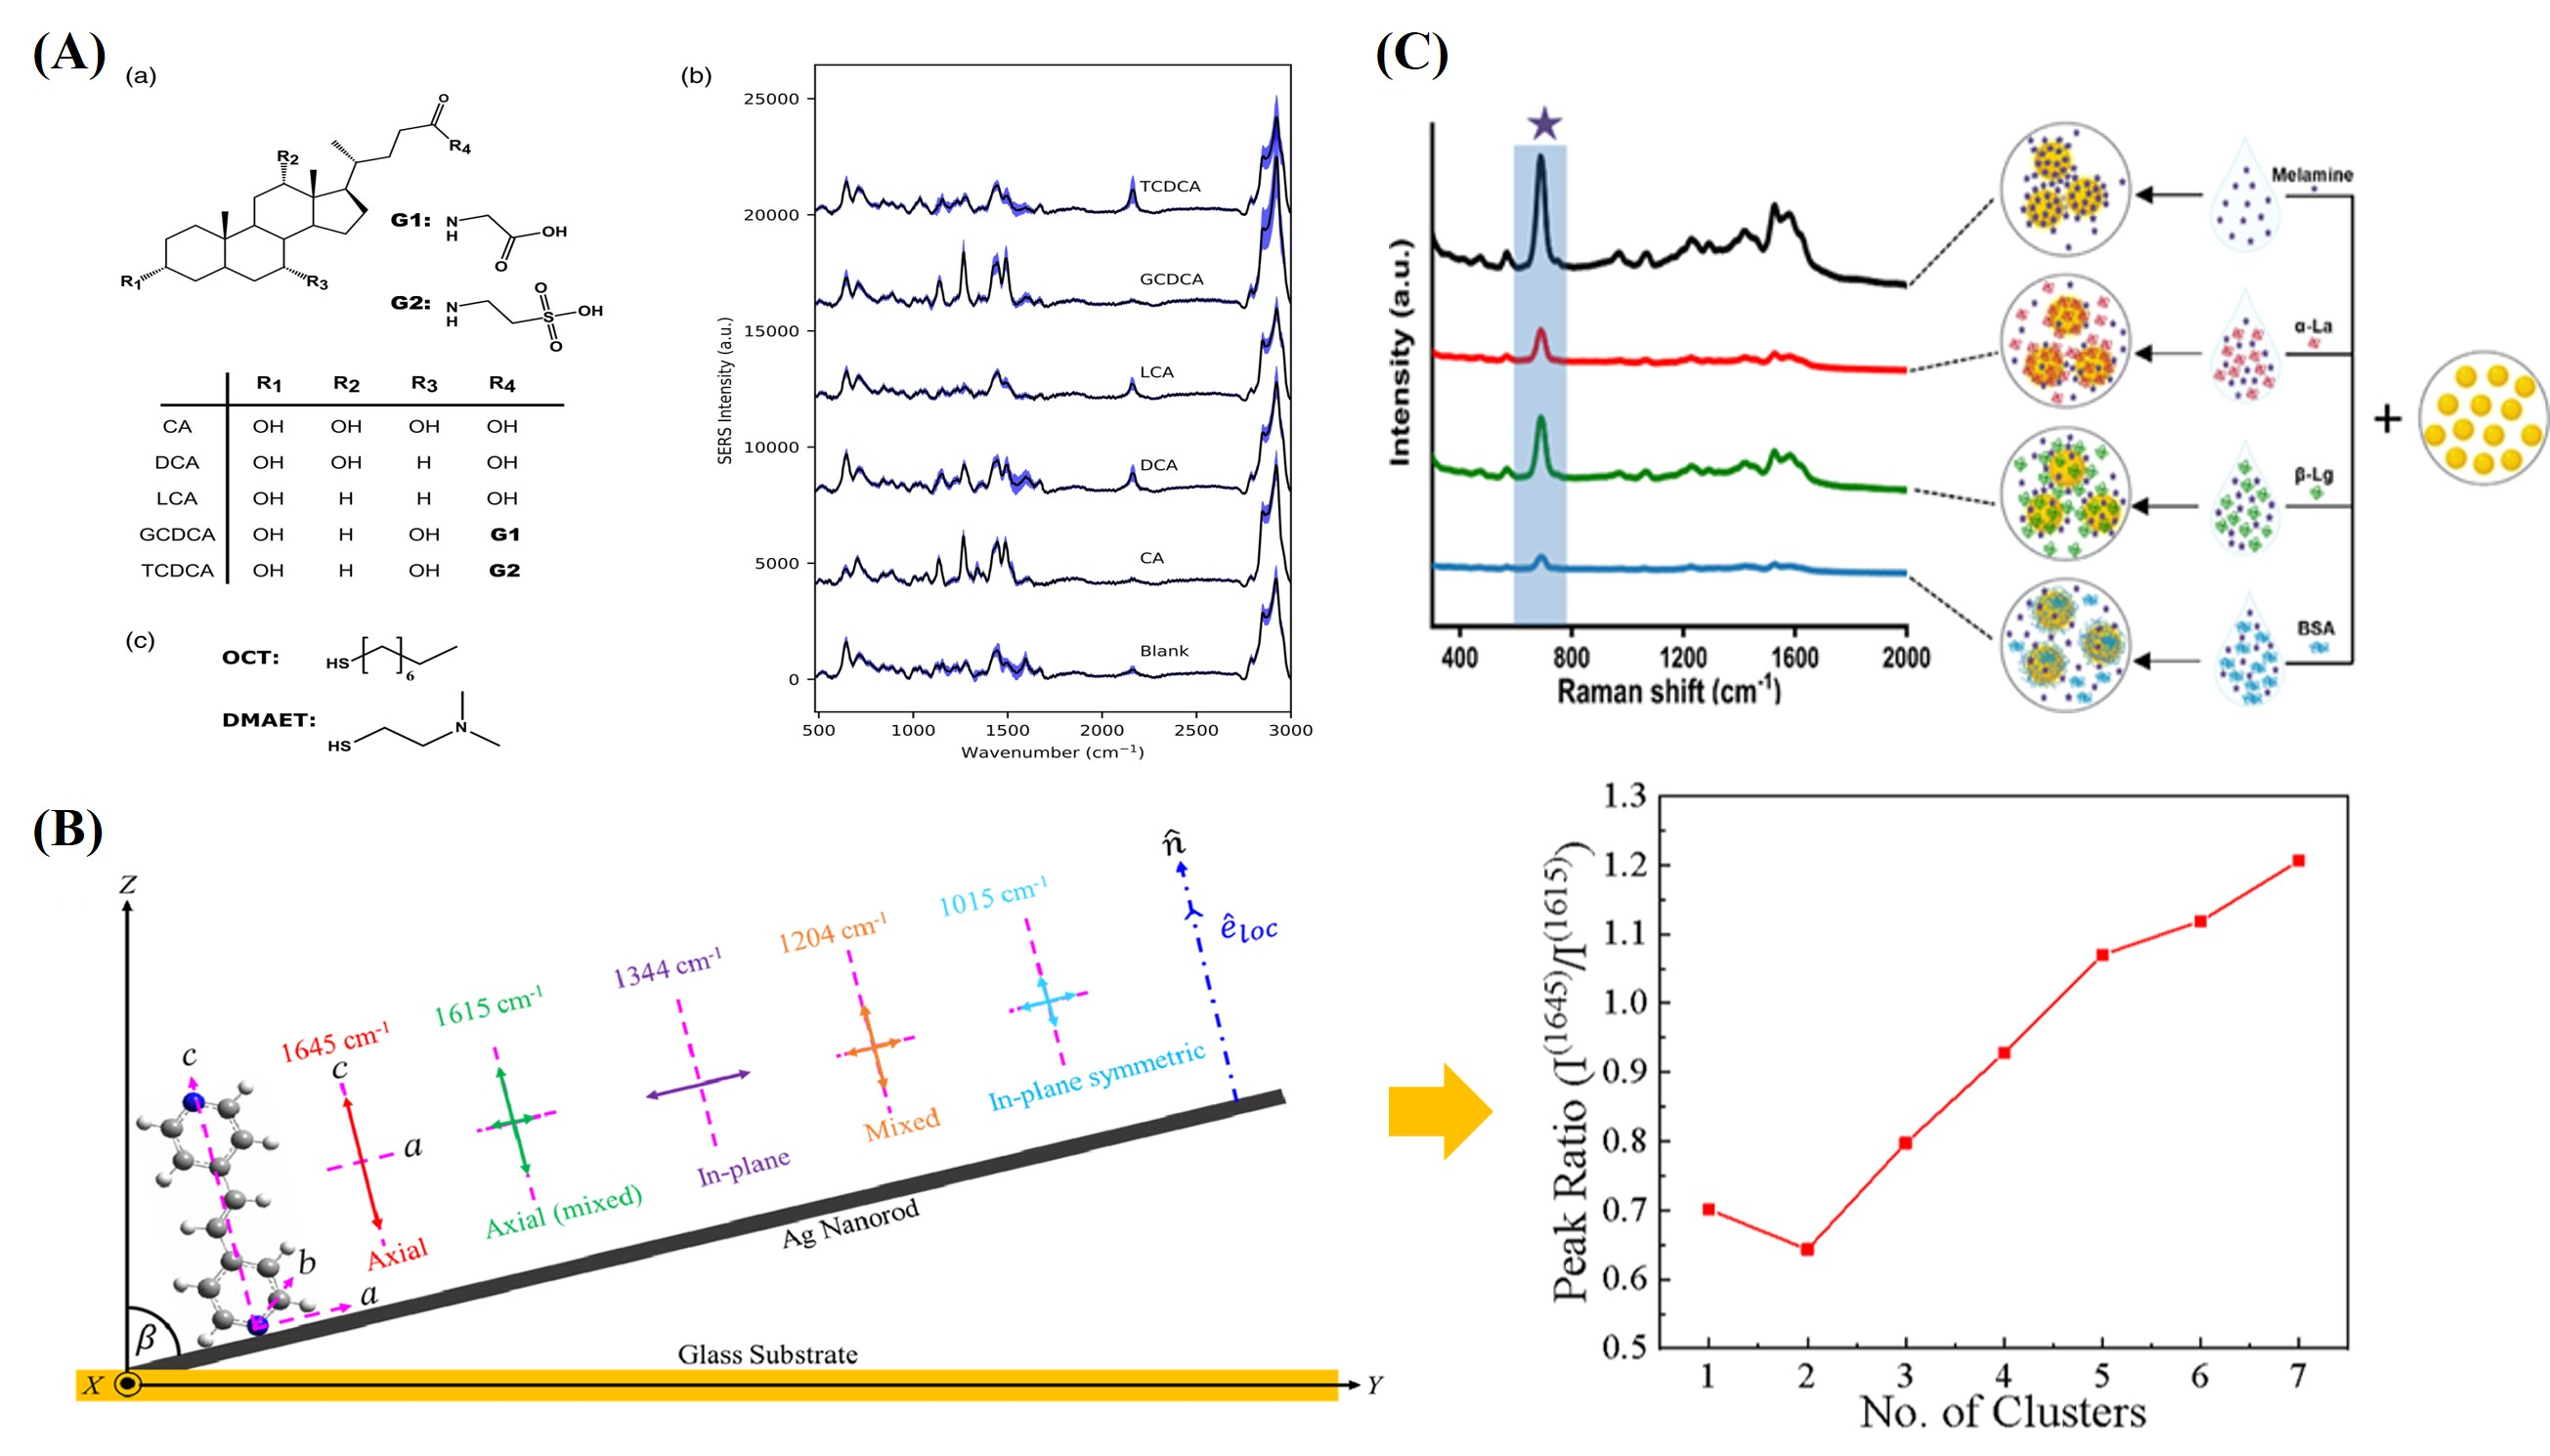
Taken together, spectral overlap, adsorption-induced spectral variability, and matrix effects prevent a simple one-to-one correspondence between the molecular population established at the plasmonic interface and the measured SERS spectrum. A given spectral variation may arise from changes in molecular composition, competitive adsorption, molecular orientation, local electromagnetic enhancement, or matrix composition, while different combinations of these factors can produce similar spectral responses. Reliable interpretation therefore requires analytical strategies that either simplify the measured spectrum, introduce additional experimental constraints, or computationally resolve the remaining ambiguity. The following section discusses these complementary approaches.
3. Complementary Strategies for Multicomponent SERS Analysis
A wide range of analytical strategies has been developed to address the challenges outlined in Section 2. These strategies operate at different stages of multicomponent SERS analysis, from molecular representation at the plasmonic interface to the interpretation of composite spectra. Some regulate molecular representation before signal generation, whereas others reduce chemical complexity before or during spectral acquisition; computational methods instead interpret composite spectra after measurement. More recently, these strategies have increasingly been integrated into unified analytical workflows, with artificial intelligence playing an expanding role in spectral interpretation, multimodal data integration, and experimental optimization. Table 1 provides a comparative overview of these strategies, including their operating principles, key advantages, limitations, and suitable application scenarios.
Table 1.
Comparison of complementary analytical strategies for multicomponent SERS analysis.
3.1. Selective Interfacial Control
Selective interfacial control simplifies multicomponent analysis by deliberately restricting which molecular species contribute to the measured SERS signal. Rather than attempting to characterize every constituent within a complex sample, this strategy selectively enriches predefined target molecules at plasmonically active hotspots while suppressing competing species. Because only molecules occupying these hotspots contribute substantially to the measured signal, controlling molecular access before signal generation provides a direct means of improving analytical specificity (Figure 3).
Figure 3.
Schematic illustration of selective interfacial control in multicomponent SERS. Molecular recognition and physicochemical selection preferentially enrich target molecules at plasmonically active hotspots while suppressing competing species, resulting in a simplified SERS spectrum with improved analytical specificity. Arrows indicate the sequential progression from a complex sample to selective interfacial control, target enrichment at hotspots, and the resulting simplified SERS spectrum. Colors and symbols identifying the different molecular species are defined in the figure legend.
The central principle is to regulate molecular access to the plasmonic interface. This can be achieved through highly specific molecular recognition or through broader physicochemical partitioning. Affinity ligands, including aptamers, antibodies, molecularly imprinted polymers (MIPs), and supramolecular hosts such as cucurbiturils, selectively capture predefined targets at the plasmonic interface, ensuring that molecular recognition and electromagnetic enhancement occur within the same nanoscale region [29,30,31,32,33,34,35,36,37,38]. Representative examples include aptamer-functionalized substrates for Staphylococcus aureus detection [29], antibody-functionalized SERS nanoparticles for multiplexed bacterial quantification in biofluids (Figure 4A) [39], multiplexed pathogen assays using aptamer-conjugated magnetic particles [30], and MIP-based SERS sensors for selective small-molecule recognition (Figure 4B) [32,33,34,35]. When highly specific recognition is unnecessary or unavailable, charge-selective, size-selective, and antifouling interfaces provide an alternative means of restricting molecular access by suppressing nonspecific adsorption while maintaining access for target molecules [40,41,42]. For example, low-biofouling interfaces have enabled the simultaneous detection of multiple tumor-associated proteins in human serum by minimizing protein occupation of hotspot regions [40]. Although these approaches differ substantially in implementation, they share the same objective of preferentially enriching target molecules at plasmonically active hotspots before signal generation.
Figure 4.
Representative molecular recognition strategies for selective interfacial control in multicomponent SERS. (A) Antibody-functionalized SERS nanoparticles selectively accumulate on bacterial membranes, producing a time-dependent increase in SERS intensity that enables multiplex bacterial quantification in biofluids. In the kinetic plot, red and blue arrows indicate SERS intensity and particle density, respectively. Adapted from ref. [39] under a Creative Commons Attribution 4.0 International License (CC BY 4.0). (B) Molecularly imprinted polymer (MIP)-based recognition of TNT through selective molecular imprinting. The bidirectional arrow illustrates template removal and rebinding in the MIP recognition process. Representative SERS spectra were recorded for (a) MIP, (b) control A, and (c) control B after incubation in a 4.0 × 10⁻⁴ M TNT solution. Spectra are offset for clarity, and the dashed lines indicate characteristic TNT bands. Adapted from ref. [32] under an MDPI Open Access license (CC BY 4.0).
Controlling molecular access alone, however, does not ensure selective detection. Analytical performance ultimately depends on whether the captured molecules are positioned within regions of strong electromagnetic enhancement. Hotspot density, nanogap geometry, and plasmon-resonance matching are therefore integral to selective interface design. Lithographically fabricated and highly ordered nanoparticle arrays provide substantially more reproducible hotspot distributions than stochastic colloidal aggregates [43,44,45,46], whereas tuning the plasmon resonance to the excitation wavelength maximizes the enhancement experienced by captured molecules [14,47]. Beyond reproducibility within individual substrates, variations between independently fabricated batches [48] and changes in substrate performance during storage [49,50] can further affect SERS signal consistency. Inter-batch reproducibility and storage stability remain important practical considerations in SERS substrate design. Molecular selectivity and plasmonic design should therefore be considered complementary elements of the same analytical strategy.
By deliberately limiting which molecular species contribute to the measured spectrum, selective interfacial control substantially simplifies the analytical problem and enables reliable detection or quantification of predefined targets within chemically complex samples. Its strength, however, derives from restricting the analytical scope. Rather than determining the complete composition of an unknown mixture, this strategy selectively interrogates molecules of interest while suppressing competing species. More comprehensive characterization therefore requires complementary approaches that physically separate molecular components or computationally resolve the remaining spectral complexity.
3.2. Physical Separation
Physical separation addresses chemical complexity from a different perspective. Instead of controlling which molecules contribute to the measured spectrum, physical separation reduces the number of molecules contributing to each measurement by separating complex mixtures before SERS acquisition. Each separated fraction therefore produces a simpler spectrum with reduced interfacial competition and spectral overlap.
Chromatographic separation provides the clearest example of this principle. In thin-layer chromatography coupled with SERS (TLC-SERS), mixture components are first resolved along a chromatographic plate, after which plasmonic nanoparticles or substrates are applied to each separated zone individually. The migration coordinate introduces an additional dimension of analytical information that complements spectral fingerprints, allowing components with overlapping Raman bands to be distinguished by their spatial position. Representative applications include the identification of eleven illegal drug adulterants in anti-rheumatic health foods [51], on-site detection of four antidiabetic adulterants in botanical supplements [52], and multicomponent analysis of food and environmental samples [53,54]. By separating molecular species before they interact with the plasmonic interface, chromatographic methods substantially reduce ambiguity that cannot be resolved from a single composite spectrum.
The same principle can be implemented by separating analytes in time rather than space. Capillary electrophoresis coupled with surface-enhanced resonance Raman spectroscopy resolves charged molecules according to their migration time before spectral acquisition, enabling sequential analysis of closely related analytes [55]. Microfluidic platforms extend this concept by integrating separation, enrichment, washing, and SERS detection within a single device [56]. Representative examples include array-assisted chips for multiplexed gas sensing [57], microfluidic immunoassays for the simultaneous detection of multiple interleukins in human plasma (Figure 5A) [58], and microfluidic SERS platforms combined with deep learning for cancer-derived exosome classification [59]. Recent waveguide-integrated SERS devices further combine optical excitation, signal collection, fluidic handling, and SERS detection within a single photonic platform while maintaining physically separated analytical channels [60]. These approaches preserve the advantages of continuous and parallel analysis while reducing the spectral complexity encountered during SERS measurement.
Figure 5.
Representative separation and multiplexed detection strategies for multicomponent SERS analysis. (A) Multiplex immuno-SERS for simultaneous detection of multiple targets. (a) Antibody-functionalized Ag-Au nanoparticles enable parallel or simultaneous multiplex detection schemes. (b) Representative SERS spectra of individual and multiplexed nanoparticle-reporter conjugates show distinct bands for each Raman reporter, p-MBA, FC, and DTNB. (c) Reporter band intensities vary systematically with interleukin concentration. Adapted from ref. [58] under a Creative Commons Attribution 4.0 International License (CC BY 4.0). (B) Magnetic separation-assisted SERS for analyte enrichment and improved detection. (a) CoFe2O4@HNTs-AuNPs are synthesized by coprecipitation, silane modification, and gold nanoparticle self-assembly, then used for magnetic solid-phase extraction followed by SERS detection. (b) SERS intensity increases and reaches a higher plateau for CoFe2O4@HNTs/AuNPs than for HNTs/AuNPs alone, reflecting improved enrichment kinetics. Adapted with permission from ref. [61], Copyright 2020 American Chemical Society.
Physical separation can also be achieved by simplifying the chemical environment before SERS measurement. Solid-phase extraction and magnetic separation selectively transfer analytes into cleaner fractions while removing interfering matrix components. Magnetic SERS composites, for example, capture analytes directly from complex samples before magnetic recovery and subsequent SERS analysis. Representative applications include aromatic amine detection using CoFe2O4@HNTs/AuNP composites (Figure 5B) [61] and label-free monitoring of carbamazepine and clozapine in human serum [62]. In these systems, analyte enrichment and matrix removal occur simultaneously, reducing competitive adsorption and improving the correspondence between spectral intensity and analyte abundance.
Physical separation nevertheless has practical limitations. Separation is rarely complete, closely related compounds may co-migrate, recovery efficiencies differ among analytes, and simplified fractions may still retain residual matrix components. Additional processing steps can increase analysis time, introduce analyte loss, and alter adsorption equilibria before SERS measurement. Consequently, physical separation reduces, but does not eliminate, the analytical complexity of multicomponent SERS. Residual spectral overlap and matrix effects frequently remain, requiring computational approaches to extract molecular information that cannot be resolved through physical separation alone.
3.3. Chemometric and AI-Driven Inference
Selective interfacial control and physical separation improve multicomponent SERS analysis by reducing chemical complexity before spectral acquisition and thereby producing spectra that are easier to interpret. In contrast, this section focuses on computational strategies that extract chemically meaningful information directly from acquired composite SERS spectra. Advances in chemometrics and artificial intelligence have substantially expanded the range of analytical information that can be inferred from these complex spectra. Depending on the analytical objective, computational methods can support sample classification, constituent identification, component quantification, and reliability assessment (Figure 6).
Figure 6.
Conceptual overview of computational inference in multicomponent SERS analysis. Composite SERS spectra are analyzed through four complementary computational tasks: sample classification, constituent identification, component quantification, and reliability assessment. Together, these approaches support accurate, interpretable, and reliable analysis of chemically complex samples.
3.3.1. Pattern Recognition for Sample Classification
Individual Raman bands often provide insufficient information to distinguish complex samples because each spectral feature may be influenced by spectral overlap, adsorption-induced variability, and matrix effects. Computational classification therefore evaluates the overall spectral pattern of a composite SERS spectrum rather than individual spectral features. An unknown spectrum is compared with spectral patterns learned from representative sample classes, and the computational model predicts the class to which the spectrum most likely belongs. This analytical strategy forms the basis of pattern recognition in multicomponent SERS.
A wide range of unsupervised and supervised computational methods has been developed for whole-spectrum classification. Principal component analysis summarizes the dominant sources of spectral variation and reveals clustering among spectra, whereas supervised approaches, including support-vector machines, random forests, and deep neural networks, learn decision boundaries between predefined sample classes [63,64,65,66,67,68]. A representative example is the classification of six foodborne bacterial species using SERS [13]. Principal component analysis applied directly to the raw spectra failed to separate all six species because of extensive spectral overlap. After first-derivative and standard normal variate preprocessing reduced baseline and scattering variability, linear discriminant analysis successfully distinguished Gram-positive and Gram-negative bacteria, individual genera, and even closely related Listeria species with an average accuracy of 95.65% on an independent test set (Figure 7). Similar computational frameworks have also been applied to classify heavy-metal contamination, dye mixtures, and explosive residues [69,70].
Figure 7.
Representative computational workflow for SERS-based bacterial classification. (A) Representative raw SERS spectra acquired from bacterial samples. (B) PCA score plots of the raw spectra and spectra after first-derivative and standard normal variate (SNV) preprocessing, illustrating progressively improved class separation. (C) Classification performance of the supervised model evaluated using confusion matrices for the training and test datasets, with an average classification accuracy of 95.65%. Adapted from ref. [13] under a Creative Commons Attribution 4.0 International License (CC BY 4.0).
Pattern recognition classifies composite SERS spectra at the level of the overall spectral pattern, providing a robust framework for sample classification without requiring assignment of individual Raman bands. The resulting classification, however, remains a spectrum-level prediction. Although spectra belonging to different sample classes can be distinguished, the computational model does not identify which spectral features, molecular constituents, or physicochemical processes are responsible for the observed separation. Consequently, additional analytical approaches are required when molecular-level interpretation of composite spectra is needed.
3.3.2. Constituent-Level Spectral Interpretation
Many analytical applications require identification of the molecular constituents contributing to a composite SERS spectrum. Unlike whole-spectrum classification, constituent-level interpretation seeks to determine how individual molecular constituents contribute to the measured spectral profile. This task is substantially more challenging because multiple constituents contribute simultaneously to the measured spectrum, and their spectral signatures frequently overlap. Computational approaches therefore attempt to separate constituent-specific information from composite spectra to support molecular-level interpretation.
Multivariate curve resolution with alternating least squares (MCR-ALS) represents a classical approach for this task, decomposing mixture datasets into estimated pure-component spectra and their contribution profiles without requiring complete prior knowledge of the individual components [71]. It has been applied to resolve overlapping spectral contributions in multicomponent SERS hyperspectral imaging [72]. More recently, autoencoder neural networks have been developed for hyperspectral unmixing. In this framework, an encoder estimates the fractional abundance of each constituent, and a decoder reconstructs the composite spectrum from endmember representations under an assumed mixing model (Figure 8) [73]. Benchmarked against synthetic and experimental Raman datasets, this approach achieved higher accuracy, robustness, and computational efficiency than conventional unmixing methods. Related computational approaches, including independent component analysis, multi-label learning, and attention-based architectures, pursue the same analytical objective through complementary strategies [64,65,66,67,73,74,75].
Figure 8.
Autoencoder-based hyperspectral unmixing for Raman spectral analysis. (A) Conceptual framework of hyperspectral unmixing, in which measured Raman spectra are decomposed into endmember spectra and their corresponding fractional abundances. (B) Autoencoder architecture for unsupervised spectral unmixing, where the encoder estimates fractional abundances and the decoder reconstructs the measured spectra through learned endmember representations. (C) Representative encoder architectures, including fully connected, convolutional, denoising, and attention-based networks. (D) Representative decoder models implementing different spectral mixing assumptions, including linear, bilinear, polynomial post-nonlinear, post-nonlinear, and additive post-nonlinear mixing. Red annotations indicate the constraints imposed on the latent abundance vectors and decoder weights. Reproduced from ref. [73] under a Creative Commons Attribution 4.0 International License (CC BY 4.0).
Constituent-level interpretation remains constrained by the non-unique relationship between composite spectra and their underlying molecular composition. Similar spectral signatures, adsorption-induced spectral variation, intermolecular interactions, and measurement variability may produce multiple constituent combinations that are consistent with the observed spectrum. Consequently, computational decomposition alone does not establish molecular composition. Constituent-level interpretation should therefore be supported by complementary evidence, including reference spectra, orthogonal analytical measurements, or physicochemical constraints, to ensure that the inferred molecular contributions remain chemically consistent with the measured sample.
3.3.3. Component Quantification
For many analytical applications, identifying the molecular constituents of a complex sample is insufficient without quantitative information on their relative or absolute abundance. Computational quantification addresses this objective by relating composite SERS spectra to constituent concentration. Establishing this relationship is inherently challenging because SERS intensity is determined not only by analyte concentration but also by adsorption behavior, hotspot distribution, competitive interactions, and matrix composition. Computational models therefore seek to learn quantitative relationships between composite spectral responses and constituent abundance despite these nonlinear sources of variation.
A variety of computational approaches have been developed for quantitative analysis of multicomponent SERS spectra. Classical chemometric methods, particularly partial least-squares regression, provide robust quantification for relatively well-controlled multicomponent systems, whereas ensemble-learning methods and deep neural networks have extended quantitative analysis to increasingly complex mixtures [63,76,77,78,79,80,81]. A representative example is the quantitative analysis of aqueous mixtures containing ciprofloxacin, doxycycline, and levofloxacin using a hybrid deep-learning framework (Figure 9) [80]. A convolutional neural network first distinguished seven antibiotic combinations with an accuracy of 98.68%, after which a non-negative elastic net model estimated the relative abundance of each antibiotic within the mixture. Shapley additive explanations further indicated that the model relied on chemically relevant spectral regions rather than incidental spectral variation, supporting the chemical interpretability of the model. This example demonstrates that constituent identification and component quantification can be integrated within a unified computational workflow to extract complementary information from the same composite SERS spectrum. Across these and related approaches, quantitative performance can be improved when experimental designs incorporate internal references, homogeneous substrates, ratiometric normalization, or endogenous standards that reduce variability unrelated to analyte concentration [82,83,84,85].
Figure 9.
Workflow for component quantification of a three-component antibiotic mixture (ciprofloxacin, doxycycline, levofloxacin). Colors distinguish the different spectra, samples, and mixture compositions throughout the workflow. Reproduced from ref. [80] under a Creative Commons Attribution-Non-Commercial-No-Derivatives 4.0 International License (CC BY-NC-ND 4.0).
Reliable quantification depends on the validity of the calibration relationship established during model development. Calibration samples should cover the concentration ranges and component ratios expected in the intended application, including conditions in which changes in one constituent alter the spectral response of another through competitive adsorption [86]. For complex samples, matrix-matched calibration is particularly important because standards prepared in simple solvents may not reproduce the adsorption competition, background signals, and matrix-induced spectral changes encountered in authentic specimens. Model evaluation should also separate calibration from validation, using independent samples that were not involved in model fitting or parameter selection. Ultimately, quantitative validity should be confirmed in authentic or representative samples through recovery, precision, and reproducibility studies across the concentration range relevant to the intended application. These considerations define the chemical and experimental domain within which quantitative predictions can be considered reliable.
3.3.4. Reliability and Chemical Validity of Multicomponent Inference
The chemometric and AI-driven strategies described above enable the classification, interpretation, and quantification of multicomponent SERS spectra. Their analytical value, however, depends not only on predictive performance but also on whether the resulting inferences remain robust and chemically meaningful. High accuracy within a given dataset does not necessarily ensure reliable analysis, particularly when dataset size or sample diversity is limited. Computational models may learn relationships that do not persist across untested component ratios, concentration ranges, matrix conditions, substrate batches, or measurement platforms. Reliable multicomponent analysis therefore requires two complementary criteria: generalization beyond the calibration space and chemical validity of the spectral features underlying the prediction.
Generalization should be evaluated using independent validation data that are not involved in model development or parameter optimization. Separately acquired external datasets provide a particularly stringent assessment, particularly when these datasets incorporate variations in component identity, relative abundance, concentration, sample matrix, substrate batch, or measurement platform. Evaluation across independently prepared substrates and different instruments is particularly relevant to SERS, where variations in plasmonic enhancement and measurement conditions can alter spectral characteristics. Strategies such as data augmentation, domain adaptation, calibration transfer, and federated learning can further improve robustness when spectra are acquired across different substrates, instruments, or measurement conditions [87,88,89,90,91,92,93,94,95,96,97,98]. Chemical validity can be examined using feature-attribution methods such as SHAP and gradient-based visualization, together with vibrational assignments or orthogonal analytical measurements [8,99,100,101,102,103,104,105,106]. These approaches help determine whether model predictions are based on spectral features that can be reasonably associated with the relevant constituents rather than on dataset-specific correlations. Ultimately, the reliability of chemometric and AI-driven multicomponent SERS analysis depends on whether models can maintain their predictive performance across changing mixture conditions while preserving chemically valid relationships between spectral features and individual constituents. These considerations become increasingly consequential as artificial intelligence is embedded within the integrated analytical workflows discussed next.
3.4. Integrated Workflows for Next-Generation Multicomponent Analysis
The strategies discussed thus far address different stages of multicomponent SERS analysis but do not completely resolve the chemical ambiguity inherent in composite spectra when implemented independently. Selective interfacial control influences which molecules contribute to the measured spectrum, physical separation reduces spectral overlap before measurement, and computational analysis extracts information from the resulting spectral complexity. Consequently, increasing attention has shifted toward integrated analytical workflows that combine complementary analytical strategies.
The analytical value of integration lies in combining complementary sources of information that progressively constrain chemical interpretation throughout the analytical process. A representative example is Exosome-SERS-AI, an integrated liquid biopsy platform in which size-exclusion chromatography first isolates exosomes from plasma to minimize matrix interference, SERS captures the molecular fingerprint of the purified vesicles, and deep-learning classifiers extract diagnostic information that cannot be resolved through direct peak assignment alone (Figure 10) [107]. This workflow illustrates how sample purification and computational interpretation can address different sources of complexity before and after SERS measurement, respectively.
Figure 10.
Exosome-SERS-AI, an integrated liquid biopsy workflow combining physical separation, SERS detection, and AI-based classification for multi-cancer diagnosis. (A) Plasma exosomes are isolated by size-exclusion chromatography and profiled by SERS to generate an exosome fingerprint map, from which cancer-type-specific scores are computed for simultaneous multi-cancer diagnosis. (B) A two-step deep learning framework first classifies cancer presence from the fingerprint map using a multiple-instance-learning (MIL)-based classifier, then determines the tissue of origin among six cancer types using an ensemble of dedicated classifiers. Arrows indicate the analytical workflow, while colors distinguish the cancer-type-specific scores and the two diagnostic steps. Reproduced from ref. [107] under a Creative Commons Attribution 4.0 International License (CC BY 4.0).
A similar logic underlies TLC-SERS, in which chromatographic separation preserves component identity, SERS provides molecular specificity, and chemometric or deep-learning analysis resolves the residual spectral overlap remaining after incomplete separation [108,109]. Fang et al. demonstrated this approach for mixtures of four pesticides, thiram, triadimefon, benzimidazole, and thiamethoxam, using a TLC plate modified with a monolayer of silver nanoparticles [109]. Following chromatographic separation, the individual pesticides were identified from the TLC-SERS spectra using a convolutional neural network combined with spectral-angle similarity analysis. In this case, TLC reduced the initial mixture complexity, while SERS and computational analysis provided molecular identification of the separated components. Hou et al. further combined TLC-SERS imaging with machine-vision analysis for multiplex detection of five-component mixtures [108]. Similar principles apply to spatially resolved Raman and SERS imaging, where spatial information enables computational models to distinguish constituent distributions that cannot be inferred from spectral information alone [73,74]. Microfluidic platforms further integrate controlled transport, compartmentalization, enrichment, and in situ SERS detection, allowing spectral responses to be interpreted within a well-defined analytical sequence [57,58].
The objective of workflow integration is not simply to combine multiple analytical techniques, but to reduce the chemical ambiguity that remains after each analytical step. Each component of the workflow should therefore contribute complementary information that cannot be obtained from the preceding steps, progressively narrowing the range of chemically plausible interpretations. Additional analytical stages inevitably increase experimental complexity, calibration requirements, and opportunities for error propagation, particularly where AI-driven classification or quantification governs the final diagnostic or analytical output. Effective integrated workflows should therefore be designed so that every analytical component provides independent information that justifies its inclusion and so that the reliability of any embedded computational inference remains verifiable.
4. Conclusions and Perspectives
Multicomponent analysis has become an increasingly important objective in surface-enhanced Raman spectroscopy as analytical interest shifts from predefined targets toward chemically complex samples. Under these conditions, the analytical challenge extends beyond detecting low-abundance molecules to establishing a reliable correspondence between measured SERS spectra and the underlying chemical system. This challenge arises because measured spectra reflect selective molecular representation at plasmonic interfaces, spectral overlap among multiple constituents, and matrix-dependent spectral variation, all of which complicate direct chemical interpretation.
Current analytical developments increasingly address these challenges through complementary strategies acting at different stages of the analytical process. Rather than relying on a single analytical solution, recent advances combine improvements in molecular representation, spectral simplification, and computational interpretation to progressively reduce chemical ambiguity. Collectively, these developments have substantially expanded the analytical capability of SERS for complex samples while also demonstrating that reliable multicomponent analysis depends on integrating complementary sources of analytical information rather than maximizing the performance of any individual technique.
Despite these advances, important challenges remain before multicomponent SERS can become a routine analytical tool for authentic biological, environmental, food, and forensic samples. Many current computational approaches rely primarily on statistical relationships between spectra and analytical outputs, whereas the physicochemical processes governing SERS signal generation remain only weakly represented during model development. Molecular adsorption, competitive surface interactions, plasmonic field enhancement, molecular orientation, and mass transport determine which molecular species contribute to measured spectra and how their spectral responses are expressed. These processes therefore represent fundamental components of the analytical system rather than experimental variability to be compensated for during data analysis. Future computational models are expected to benefit from incorporating these physicochemical constraints directly into spectral interpretation, enabling analytical predictions that remain more robust across different substrates, sample matrices, and experimental conditions. Continued integration of interfacial engineering, separation science, spectroscopy, and physics-informed computational analysis is therefore likely to provide a more reliable route toward multicomponent SERS analysis than further improvements in any single analytical strategy.
Author Contributions
Conceptualization, H.L. and H.N.; investigation, H.L.; writing (original draft preparation), H.L.; writing (review and editing), H.L.; visualization, H.L.; supervision, H.N. All authors have read and agreed to the published version of the manuscript.
Funding
This research received no external funding.
Data Availability Statement
No new data were created or analyzed in this study. Data sharing is not applicable to this article.
Acknowledgments
This work was supported by the Seoul National University of Science and Technology.
Conflicts of Interest
The authors declare no conflict of interest.
References
- Moskovits, M. Surface-Enhanced Spectroscopy. Rev. Mod. Phys. 1985, 57, 783–826. [Google Scholar] [CrossRef] [Scilit]
- Willets, K.A.; Van Duyne, R.P. Localized Surface Plasmon Resonance Spectroscopy and Sensing. Annu. Rev. Phys. Chem. 2007, 58, 267–297. [Google Scholar] [CrossRef] [Scilit] [PubMed]
- Ding, S.-Y.; Yi, J.; Li, J.-F.; Ren, B.; Wu, D.-Y.; Panneerselvam, R.; Tian, Z.-Q. Nanostructure-Based Plasmon-Enhanced Raman Spectroscopy for Surface Analysis of Materials. Nat. Rev. Mater. 2016, 1, 16021. [Google Scholar] [CrossRef] [Scilit]
- Nie, S.; Emory, S.R. Probing Single Molecules and Single Nanoparticles by Surface-Enhanced Raman Scattering. Science 1997, 275, 1102–1106. [Google Scholar] [CrossRef] [Scilit] [PubMed]
- Le Ru, E.C.; Etchegoin, P.G. Single-Molecule Surface-Enhanced Raman Spectroscopy. Annu. Rev. Phys. Chem. 2012, 63, 65–87. [Google Scholar] [CrossRef] [Scilit] [PubMed]
- Zha, Y.; Cheng, S. Tunable High-Sensitivity Mid-Infrared Perfect Absorber with Five Resonance Peaks Based on Nested Circular and Elliptical Ring Graphene Surface Plasmons. Phys. B Condens. Matter 2026, 739, 418929. [Google Scholar] [CrossRef] [Scilit]
- Li, Y.; Liu, W.; Liu, R.; Gao, J.; Feng, J.; Xu, S.; Li, Z.; Jiang, S.; Du, X. 3D Hybrid Arrayed Ag/MOF Multi-Plasmon Resonant Cavity System for High-Performance SPR Sensing. Opt. Laser Technol. 2023, 167, 109825. [Google Scholar] [CrossRef] [Scilit]
- Langer, J.; Jimenez De Aberasturi, D.; Aizpurua, J.; Alvarez-Puebla, R.A.; Auguié, B.; Baumberg, J.J.; Bazan, G.C.; Bell, S.E.J.; Boisen, A.; Brolo, A.G.; et al. Present and Future of Surface-Enhanced Raman Scattering. ACS Nano 2020, 14, 28–117. [Google Scholar] [CrossRef] [Scilit] [PubMed]
- Pérez-Jiménez, A.I.; Lyu, D.; Lu, Z.; Liu, G.; Ren, B. Surface-Enhanced Raman Spectroscopy: Benefits, Trade-Offs and Future Developments. Chem. Sci. 2020, 11, 4563–4577. [Google Scholar] [CrossRef] [Scilit] [PubMed]
- Shin, H.; Oh, S.; Hong, S.; Kang, M.; Kang, D.; Ji, Y.; Choi, B.H.; Kang, K.-W.; Jeong, H.; Park, Y.; et al. Early-Stage Lung Cancer Diagnosis by Deep Learning-Based Spectroscopic Analysis of Circulating Exosomes. ACS Nano 2020, 14, 5435–5444. [Google Scholar] [CrossRef] [Scilit] [PubMed]
- Buhas, B.A.; Toma, V.; Beauval, J.-B.; Andras, I.; Couți, R.; Muntean, L.A.-M.; Coman, R.-T.; Maghiar, T.A.; Știufiuc, R.-I.; Lucaciu, C.M.; et al. Label-Free SERS of Urine Components: A Powerful Tool for Discriminating Renal Cell Carcinoma through Multivariate Analysis and Machine Learning Techniques. Int. J. Mol. Sci. 2024, 25, 3891. [Google Scholar] [CrossRef] [Scilit] [PubMed]
- Ho, C.-S.; Jean, N.; Hogan, C.A.; Blackmon, L.; Jeffrey, S.S.; Holodniy, M.; Banaei, N.; Saleh, A.A.E.; Ermon, S.; Dionne, J. Rapid Identification of Pathogenic Bacteria Using Raman Spectroscopy and Deep Learning. Nat. Commun. 2019, 10, 4927. [Google Scholar] [CrossRef] [Scilit] [PubMed]
- Zuo, H.; Sun, Y.; Huang, M.; Marie Fowler, S.; Liu, J.; Zhang, Y.; Mao, Y. Classification and Identification of Foodborne Bacteria in Beef by Utilising Surface-Enhanced Raman Spectroscopy Coupled with Chemometric Methods. Foods 2024, 13, 3688. [Google Scholar] [CrossRef] [Scilit] [PubMed]
- Xue, R.-S.; Dai, J.-Y.; Wang, X.-J.; Chen, M.-Y. Research Progress of Surface-Enhanced Raman Scattering (SERS) Technology in Food, Biomedical, and Environmental Monitoring. Photonics 2025, 12, 809. [Google Scholar] [CrossRef] [Scilit]
- Dos Santos, D.P.; Sena, M.M.; Almeida, M.R.; Mazali, I.O.; Olivieri, A.C.; Villa, J.E.L. Unraveling Surface-Enhanced Raman Spectroscopy Results through Chemometrics and Machine Learning: Principles, Progress, and Trends. Anal. Bioanal. Chem. 2023, 415, 3945–3966. [Google Scholar] [CrossRef] [Scilit] [PubMed]
- Deriu, C.; Fabris, L. A Surface Chemistry Perspective on SERS: Revisiting the Basics to Push the Field Forward. Chem. Soc. Rev. 2025, 54, 5224–5247. [Google Scholar] [CrossRef] [Scilit] [PubMed]
- Altun, A.O.; Bond, T.; Pronk, W.; Park, H.G. Sensitive Detection of Competitive Molecular Adsorption by Surface-Enhanced Raman Spectroscopy. Langmuir 2017, 33, 6999–7006. [Google Scholar] [CrossRef] [Scilit] [PubMed]
- Tripathi, A.; Emmons, E.D.; Fountain, A.W.; Guicheteau, J.A.; Moskovits, M.; Christesen, S.D. Critical Role of Adsorption Equilibria on the Determination of Surface-Enhanced Raman Enhancement. ACS Nano 2015, 9, 584–593. [Google Scholar] [CrossRef] [Scilit] [PubMed]
- Bell, S.E.J.; Charron, G.; Cortés, E.; Kneipp, J.; De La Chapelle, M.L.; Langer, J.; Procházka, M.; Tran, V.; Schlücker, S. Towards Reliable and Quantitative Surface-Enhanced Raman Scattering (SERS): From Key Parameters to Good Analytical Practice. Angew. Chem. Int. Ed. 2020, 59, 5454–5462. [Google Scholar] [CrossRef] [Scilit] [PubMed]
- Sloan-Dennison, S.; Wallace, G.Q.; Hassanain, W.A.; Laing, S.; Faulds, K.; Graham, D. Advancing SERS as a Quantitative Technique: Challenges, Considerations, and Correlative Approaches to Aid Validation. Nano Converg. 2024, 11, 33. [Google Scholar] [CrossRef] [Scilit] [PubMed]
- Ding, S.-Y.; You, E.-M.; Tian, Z.-Q.; Moskovits, M. Electromagnetic Theories of Surface-Enhanced Raman Spectroscopy. Chem. Soc. Rev. 2017, 46, 4042–4076. [Google Scholar] [CrossRef] [Scilit] [PubMed]
- Barbillon, G. Applications of Shell-Isolated Nanoparticle-Enhanced Raman Spectroscopy. Photonics 2021, 8, 46. [Google Scholar] [CrossRef] [Scilit]
- Yan, X.; Li, P.; Yang, L.; Liu, J. Time-Dependent SERS Spectra Monitoring the Dynamic Adsorption Behavior of Bipyridine Isomerides Combined with Bianalyte Method. Analyst 2016, 141, 5189–5194. [Google Scholar] [CrossRef] [Scilit] [PubMed]
- Lebrun, A.; Fortin, H.; Fontaine, N.; Fillion, D.; Barbier, O.; Boudreau, D. Pushing the Limits of Surface-Enhanced Raman Spectroscopy (SERS) with Deep Learning: Identification of Multiple Species with Closely Related Molecular Structures. Appl. Spectrosc. 2022, 76, 609–619. [Google Scholar] [CrossRef] [Scilit] [PubMed]
- Muniz-Miranda, M.; Muniz-Miranda, F.; Menziani, M.C.; Pedone, A. Can DFT Calculations Provide Useful Information for SERS Applications? Molecules 2023, 28, 573. [Google Scholar] [CrossRef] [Scilit] [PubMed]
- Kumar, A.; Ma, F.; Chen, X.; Zhao, Y. Understanding SERS Spectral Shape Variability through Substrate Optics, Molecular Orientation, and Unsupervised Clustering. J. Phys. Chem. C 2026, 130, 4852–4867. [Google Scholar] [CrossRef] [Scilit] [PubMed]
- Mi, S.; Du, Y.; Gao, F.; Yuan, S.; Yu, H.; Guo, Y.; Cheng, Y.; Li, G.; Yao, W. Probing the Effect of Protein Corona on SERS Signals: Insights from Melamine Detection in Milk Matrix. Food Chem. 2024, 459, 140416. [Google Scholar] [CrossRef] [Scilit] [PubMed]
- Mi, S.; Hu, X.; Yuan, S.; Yu, H.; Guo, Y.; Cheng, Y.; Yao, W. Unveiling the Correlation between Protein, Protein Corona, and Target Signal Loss in SERS Detection. Anal. Chem. 2024, 96, 19768–19777. [Google Scholar] [CrossRef] [Scilit] [PubMed]
- Zhu, A.; Ali, S.; Xu, Y.; Ouyang, Q.; Chen, Q. A SERS Aptasensor Based on AuNPs Functionalized PDMS Film for Selective and Sensitive Detection of Staphylococcus Aureus. Biosens. Bioelectron. 2021, 172, 112806. [Google Scholar] [CrossRef] [Scilit] [PubMed]
- Sun, F.; Pang, K.; Yang, K.; Zheng, L.; Wang, M.; Wang, Y.; Chen, Q.; Ye, Z.; Liang, P.; Yu, X. Aptamer-Conjugated Magnetic Nanoparticles Integrated with SERS for Multiplex Salmonella Detection. Biosensors 2025, 15, 464. [Google Scholar] [CrossRef] [Scilit] [PubMed]
- Wang, J.; Guo, S.; Park, E.; Lee, S.; Park, Y.; Han, X.X.; Zhao, B.; Jung, Y.M. SERS-Based Aptamer Sensing Strategy for Diabetes Biomarker Detection. Anal. Chem. 2024, 96, 20082–20089. [Google Scholar] [CrossRef] [Scilit] [PubMed]
- Holthoff, E.L.; Stratis-Cullum, D.N.; Hankus, M.E. A Nanosensor for TNT Detection Based on Molecularly Imprinted Polymers and Surface Enhanced Raman Scattering. Sensors 2011, 11, 2700–2714. [Google Scholar] [CrossRef] [Scilit] [PubMed]
- Yeganegi, A.; Fardindoost, S.; Tasnim, N.; Hoorfar, M. Molecularly Imprinted Polymers (MIP) Combined with Raman Spectroscopy for Selective Detection of Δ9-Tetrahydrocannabinol (THC). Talanta 2024, 267, 125271. [Google Scholar] [CrossRef] [Scilit] [PubMed]
- Zhang, H.; Sun, D.; Wen, Y.; Wang, M.; Huang, J.; Lian, Z.; Li, J. Molecularly Imprinted SERS Plasmonic Sensor for the Detection of Malachite Green. Biosensors 2025, 15, 329. [Google Scholar] [CrossRef] [Scilit] [PubMed]
- Ma, J.; Yan, M.; Feng, G.; Ying, Y.; Chen, G.; Shao, Y.; She, Y.; Wang, M.; Sun, J.; Zheng, L.; et al. An Overview on Molecular Imprinted Polymers Combined with Surface-Enhanced Raman Spectroscopy Chemical Sensors toward Analytical Applications. Talanta 2021, 225, 122031. [Google Scholar] [CrossRef] [Scilit] [PubMed]
- Chio, W.-I.K.; Xie, H.; Zhang, Y.; Lan, Y.; Lee, T.-C. SERS Biosensors Based on Cucurbituril-Mediated Nanoaggregates for Wastewater-Based Epidemiology. TrAC Trends Anal. Chem. 2022, 146, 116485. [Google Scholar] [CrossRef] [Scilit]
- Chen, G.-Y.; Sun, Y.-B.; Shi, P.-C.; Liu, T.; Li, Z.-H.; Luo, S.-H.; Wang, X.-C.; Cao, X.-Y.; Ren, B.; Liu, G.-K.; et al. Revealing Unconventional Host–Guest Complexation at Nanostructured Interface by Surface-Enhanced Raman Spectroscopy. Light Sci. Appl. 2021, 10, 85. [Google Scholar] [CrossRef] [Scilit] [PubMed]
- Sim, M.; Kim, H.; Noh, H. Plasmonic ELISA for Tear Biomarkers: Etching in Plasmonic Paper with Dual-Signal Readout. Plasmonics 2024, 20, 2881–2893. [Google Scholar] [CrossRef] [Scilit]
- Pazos-Perez, N.; Pazos, E.; Catala, C.; Mir-Simon, B.; Gómez-de Pedro, S.; Sagales, J.; Villanueva, C.; Vila, J.; Soriano, A.; García De Abajo, F.J.; et al. Ultrasensitive Multiplex Optical Quantification of Bacteria in Large Samples of Biofluids. Sci. Rep. 2016, 6, 29014. [Google Scholar] [CrossRef] [Scilit] [PubMed]
- Zou, M.; Li, Q.; Ji, X.; Ding, C. Low Biofouling Strategy for Simultaneous Determination of Two Proteins Related to One Tumor in Human Serum. Sens. Actuators B Chem. 2024, 416, 136004. [Google Scholar] [CrossRef] [Scilit]
- Wu, Z.; Wang, Z.; Xie, H.; Wang, Y.; He, H.; Nie, S.; Ye, J.; Lin, L. Raman-Guided Bronchoscopy: Feasibility and Detection Depth Studies Using Ex Vivo Lung Tissues and SERS Nanoparticle Tags. Photonics 2022, 9, 429. [Google Scholar] [CrossRef] [Scilit]
- Kang, Y.; Kim, H.J.; Lee, S.H.; Noh, H. Paper-Based Substrate for a Surface-Enhanced Raman Spectroscopy Biosensing Platform—A Silver/Chitosan Nanocomposite Approach. Biosensors 2022, 12, 266. [Google Scholar] [CrossRef] [Scilit] [PubMed]
- Wu, L.; Wang, W.; Zhang, W.; Su, H.; Liu, Q.; Gu, J.; Deng, T.; Zhang, D. Highly Sensitive, Reproducible and Uniform SERS Substrates with a High Density of Three-Dimensionally Distributed Hotspots: Gyroid-Structured Au Periodic Metallic Materials. npg Asia Mater. 2018, 10, e462. [Google Scholar] [CrossRef] [Scilit]
- Cong, S.; Wang, Z.; Gong, W.; Chen, Z.; Lu, W.; Lombardi, J.R.; Zhao, Z. Electrochromic Semiconductors as Colorimetric SERS Substrates with High Reproducibility and Renewability. Nat. Commun. 2019, 10, 678. [Google Scholar] [CrossRef] [Scilit] [PubMed]
- Feng, K.; Chen, Z.; Chen, Z.; Shen, J.; Li, H. Composite Structure of Ag Colloidal Particles and Au Sinusoidal Nanograting with Large-Scale Ultra-High Field Enhancement for SERS Detection. Photonics 2021, 8, 415. [Google Scholar] [CrossRef] [Scilit]
- Wang, C.; Cui, T.; Liu, Z.; Lin, Y.; Tang, S.; Shao, L.; Chen, H.; Shen, Y.; Deng, S. Molybdenum Truncated Cone Arrays with Localized Surface Plasmon Resonance for Surface-Enhanced Raman Scattering Application. Photonics 2024, 11, 950. [Google Scholar] [CrossRef] [Scilit]
- Qi, Z.; Li, J.; Chen, P.; Zhang, L.; Ji, K. Tunable High-Q Factor Substrate for Selectively Enhanced Raman Scattering. Photonics 2022, 9, 755. [Google Scholar] [CrossRef] [Scilit]
- Kumar, S.; Namura, K.; Kumaki, D.; Tokito, S.; Suzuki, M. Highly Reproducible, Large Scale Inkjet-Printed Ag Nanoparticles-Ink SERS Substrate. Results Mater. 2020, 8, 100139. [Google Scholar] [CrossRef] [Scilit]
- Yan, S.; Chen, L.; Zhang, Z. Utilizing Freeze-Thaw-Ultrasonication to Prepare Mesoporous Silica-Encapsulated Colloidal Silver Nanoaggregates with Long-Term Surface-Enhanced Raman Spectroscopy Activity. Sensors 2025, 25, 1840. [Google Scholar] [CrossRef] [Scilit] [PubMed]
- Bachenheimer, L.; Scherzer, R.; Elliott, P.; Stagon, S.; Gasparov, L.; Huang, H. Degradation Mechanism of Ag Nanorods for Surface Enhanced Raman Spectroscopy. Sci. Rep. 2017, 7, 16282. [Google Scholar] [CrossRef] [Scilit] [PubMed]
- Yang, F.; Wang, C.; Yu, H.; Guo, Y.; Cheng, Y.; Yao, W.; Xie, Y. Establishment of the Thin-Layer Chromatography-Surface-Enhanced Raman Spectroscopy and Chemometrics Method for Simultaneous Identification of Eleven Illegal Drugs in Anti-Rheumatic Health Food. Food Biosci. 2022, 49, 101842. [Google Scholar] [CrossRef] [Scilit]
- Zhu, Q.; Cao, Y.; Cao, Y.; Chai, Y.; Lu, F. Rapid On-Site TLC–SERS Detection of Four Antidiabetes Drugs Used as Adulterants in Botanical Dietary Supplements. Anal. Bioanal. Chem. 2014, 406, 1877–1884. [Google Scholar] [CrossRef] [Scilit] [PubMed]
- Han, C.; Wang, Q.; Yao, Y.; Zhang, Q.; Huang, J.; Zhang, H.; Qu, L. Thin Layer Chromatography Coupled with Surface Enhanced Raman Scattering for Rapid Separation and On-Site Detection of Multi-Components. J. Chromatogr. A 2023, 1706, 464217. [Google Scholar] [CrossRef] [Scilit] [PubMed]
- Zhang, M.; Yu, Q.; Guo, J.; Wu, B.; Kong, X. Review of Thin-Layer Chromatography Tandem with Surface-Enhanced Raman Spectroscopy for Detection of Analytes in Mixture Samples. Biosensors 2022, 12, 937. [Google Scholar] [CrossRef] [Scilit] [PubMed]
- Arráez Román, D.; Efremov, E.; Ariese, F.; Segura Carretero, A.; Gooijer, C. Interfacing Capillary Electrophoresis and Surface-Enhanced Resonance Raman Spectroscopy for the Determination of Dye Compounds. Anal. Bioanal. Chem. 2005, 382, 180–185. [Google Scholar] [CrossRef] [Scilit] [PubMed]
- Yu, X.; Park, S.; Lee, S.; Joo, S.-W.; Choo, J. Microfluidics for Disease Diagnostics Based on Surface-Enhanced Raman Scattering Detection. Nano Converg. 2024, 11, 17. [Google Scholar] [CrossRef] [Scilit] [PubMed]
- Yang, K.; Zong, S.; Zhang, Y.; Qian, Z.; Liu, Y.; Zhu, K.; Li, L.; Li, N.; Wang, Z.; Cui, Y. Array-Assisted SERS Microfluidic Chips for Highly Sensitive and Multiplex Gas Sensing. ACS Appl. Mater. Interfaces 2020, 12, 1395–1403. [Google Scholar] [CrossRef] [Scilit] [PubMed]
- Kamińska, A.; Winkler, K.; Kowalska, A.; Witkowska, E.; Szymborski, T.; Janeczek, A.; Waluk, J. SERS-Based Immunoassay in a Microfluidic System for the Multiplexed Recognition of Interleukins from Blood Plasma: Towards Picogram Detection. Sci. Rep. 2017, 7, 10656. [Google Scholar] [CrossRef] [Scilit] [PubMed]
- Chen, H.; Liu, H.; Xing, L.; Fan, D.; Chen, N.; Ma, P.; Zhang, X. Deep Learning-Driven Microfluidic-SERS to Characterize the Heterogeneity in Exosomes for Classifying Non-Small Cell Lung Cancer Subtypes. ACS Sens. 2025, 10, 2872–2882. [Google Scholar] [CrossRef] [Scilit] [PubMed]
- Gao, D.; Liu, J.; Liu, X.; He, K.; Ma, Z.; Liu, H.; Wang, J.; Zhang, Q.; Huang, Z.; Luo, M.; et al. Emerging Frontiers in SERS-Integrated Optical Waveguides: Advancing Portable and Ultra-Sensitive Detection for Trace Liquid Analysis. Light Sci. Appl. 2025, 14, 389. [Google Scholar] [CrossRef] [Scilit] [PubMed]
- Zhang, H.; Lai, H.; Wu, X.; Li, G.; Hu, Y. CoFe2 O4 @HNTs/AuNPs Substrate for Rapid Magnetic Solid-Phase Extraction and Efficient SERS Detection of Complex Samples All-in-One. Anal. Chem. 2020, 92, 4607–4613. [Google Scholar] [CrossRef] [Scilit] [PubMed]
- Feng, J.; Zhou, P.; Qin, C.; Chen, R.; Chen, Q.; Li, L.; Chen, J.; Cheng, H.; Huang, W.; Cao, J. Magnetic Solid-Phase Extraction-Based Surface-Enhanced Raman Spectroscopy for Label-Free Therapeutic Drug Monitoring of Carbamazepine and Clozapine in Human Serum. Spectrochim. Acta Part A Mol. Biomol. Spectrosc. 2024, 310, 123924. [Google Scholar] [CrossRef] [Scilit] [PubMed]
- Guo, M.; Li, M.; Fu, H.; Zhang, Y.; Chen, T.; Tang, H.; Zhang, T.; Li, H. Quantitative Analysis of Polycyclic Aromatic Hydrocarbons (PAHs) in Water by Surface-Enhanced Raman Spectroscopy (SERS) Combined with Random Forest. Spectrochim. Acta Part A Mol. Biomol. Spectrosc. 2023, 287, 122057. [Google Scholar] [CrossRef] [Scilit] [PubMed]
- Yu, Y.; Lu, W.; Yao, X.; Jiang, Y.; Li, J.; Yang, M.; Huang, X.; Tang, X. Machine Learning-Integrated Surface-Enhanced Raman Spectroscopy Analysis of Multicomponent Dye Mixtures. Spectrochim. Acta Part A Mol. Biomol. Spectrosc. 2025, 332, 125806. [Google Scholar] [CrossRef] [Scilit] [PubMed]
- Lin, C.; Zheng, C.; Fan, B.; Wang, C.; Zhao, X.; Wang, Y. Machine Learning-Assisted SERS Sensor for Fast and Ultrasensitive Analysis of Multiplex Hazardous Dyes in Natural Products. J. Hazard. Mater. 2025, 482, 136584. [Google Scholar] [CrossRef] [Scilit] [PubMed]
- Yang, Y.; Cui, J.; Kumar, A.; Luo, D.; Murray, J.; Jones, L.; Chen, X.; Hülck, S.; Tripp, R.A.; Zhao, Y. Multiplex Detection and Quantification of Virus Co-Infections Using Label-Free Surface-Enhanced Raman Spectroscopy and Deep Learning Algorithms. ACS Sens. 2025, 10, 1298–1311. [Google Scholar] [CrossRef] [Scilit] [PubMed]
- Atta, S.; Li, J.Q.; Vo-Dinh, T. Multiplex SERS Detection of Polycyclic Aromatic Hydrocarbon (PAH) Pollutants in Water Samples Using Gold Nanostars and Machine Learning Analysis. Analyst 2023, 148, 5105–5116. [Google Scholar] [CrossRef] [Scilit] [PubMed]
- Qi, Y.; Hu, D.; Jiang, Y.; Wu, Z.; Zheng, M.; Chen, E.X.; Liang, Y.; Sadi, M.A.; Zhang, K.; Chen, Y.P. Recent Progresses in Machine Learning Assisted Raman Spectroscopy. Adv. Opt. Mater. 2023, 11, 2203104. [Google Scholar] [CrossRef] [Scilit]
- Park, S.; Lee, J.; Khan, S.; Wahab, A.; Kim, M. Machine Learning-Based Heavy Metal Ion Detection Using Surface-Enhanced Raman Spectroscopy. Sensors 2022, 22, 596. [Google Scholar] [CrossRef] [Scilit] [PubMed]
- Byram, C.; Moram, S.S.B.; Soma, V.R. SERS Based Detection of Multiple Analytes from Dye/Explosive Mixtures Using Picosecond Laser Fabricated Gold Nanoparticles and Nanostructures. Analyst 2019, 144, 2327–2336. [Google Scholar] [CrossRef] [Scilit] [PubMed]
- Felten, J.; Hall, H.; Jaumot, J.; Tauler, R.; De Juan, A.; Gorzsás, A. Vibrational Spectroscopic Image Analysis of Biological Material Using Multivariate Curve Resolution–Alternating Least Squares (MCR-ALS). Nat. Protoc. 2015, 10, 217–240. [Google Scholar] [CrossRef] [Scilit] [PubMed]
- Mamián-López, M.B.; Poppi, R.J. SERS Hyperspectral Imaging Assisted by MCR-ALS for Studying Polymeric Microfilms Loaded with Paracetamol. Microchem. J. 2015, 123, 243–251. [Google Scholar] [CrossRef] [Scilit]
- Georgiev, D.; Fernández-Galiana, Á.; Vilms Pedersen, S.; Papadopoulos, G.; Xie, R.; Stevens, M.M.; Barahona, M. Hyperspectral Unmixing for Raman Spectroscopy via Physics-Constrained Autoencoders. Proc. Natl. Acad. Sci. USA 2024, 121, e2407439121. [Google Scholar] [CrossRef] [Scilit] [PubMed]
- Lobanova, E.G.; Lobanov, S.V. Efficient Quantitative Hyperspectral Image Unmixing Method for Large-Scale Raman Micro-Spectroscopy Data Analysis. Anal. Chim. Acta 2019, 1050, 32–43. [Google Scholar] [CrossRef] [Scilit] [PubMed]
- Li, B.; Zappalá, G.; Dumont, E.; Boisen, A.; Rindzevicius, T.; Schmidt, M.N.; Alstrøm, T.S. Nitroaromatic Explosives’ Detection and Quantification Using an Attention-Based Transformer on Surface-Enhanced Raman Spectroscopy Maps. Analyst 2023, 148, 4787–4798. [Google Scholar] [CrossRef] [Scilit] [PubMed]
- Hou, M.; Huang, Y.; Ma, L.; Zhang, Z. Quantitative Analysis of Single and Mix Food Antiseptics Basing on SERS Spectra with PLSR Method. Nanoscale Res. Lett. 2016, 11, 296. [Google Scholar] [CrossRef] [Scilit] [PubMed]
- Wang, X.; Jiang, S.; Liu, Z.; Sun, X.; Zhang, Z.; Quan, X.; Zhang, T.; Kong, W.; Yang, X.; Li, Y. Integrated Surface-Enhanced Raman Spectroscopy and Convolutional Neural Network for Quantitative and Qualitative Analysis of Pesticide Residues on Pericarp. Food Chem. 2024, 440, 138214. [Google Scholar] [CrossRef] [Scilit] [PubMed]
- Hegde, A.; Hajikhani, M.; Snyder, J.; Cheng, J.; Lin, M. Leveraging SERS and Transformer Models for Simultaneous Detection of Multiple Pesticides in Fresh Produce. ACS Appl. Mater. Interfaces 2025, 17, 2018–2031. [Google Scholar] [CrossRef] [Scilit] [PubMed]
- Jiang, S.; Li, Q.; Quan, X.; Xing, Y.; Huang, Y.; Mu, X.; Meng, Y.; Wu, G.; Ju, T.; Chu, Y.; et al. Integrated Surface-Enhanced Raman Spectroscopy and Machine Learning for Identification and Quantification of Multi-Target Pesticide Residues in Fruit Juices. Food Chem. 2026, 498, 147143. [Google Scholar] [CrossRef] [Scilit] [PubMed]
- Yuan, Q.; Yao, L.-F.; Tang, J.-W.; Ma, Z.-W.; Mou, J.-Y.; Wen, X.-R.; Usman, M.; Wu, X.; Wang, L. Rapid Discrimination and Ratio Quantification of Mixed Antibiotics in Aqueous Solution through Integrative Analysis of SERS Spectra via CNN Combined with NN-EN Model. J. Adv. Res. 2025, 69, 61–74. [Google Scholar] [CrossRef] [Scilit] [PubMed]
- Lebrun, A.; Lavoie-Cardinal, F.; Boudreau, D. Surface-Enhanced Raman Spectroscopy Semi-Quantitative Molecular Profiling with a Convolutional Neural Network. Appl. Spectrosc. 2026, 80, 35–50. [Google Scholar] [CrossRef] [Scilit] [PubMed]
- Shen, W.; Lin, X.; Jiang, C.; Li, C.; Lin, H.; Huang, J.; Wang, S.; Liu, G.; Yan, X.; Zhong, Q.; et al. Reliable Quantitative SERS Analysis Facilitated by Core–Shell Nanoparticles with Embedded Internal Standards. Angew. Chem. Int. Ed. 2015, 54, 7308–7312. [Google Scholar] [CrossRef] [Scilit] [PubMed]
- Zhao, F.; Wang, W.; Zhong, H.; Yang, F.; Fu, W.; Ling, Y.; Zhang, Z. Robust Quantitative SERS Analysis with Relative Raman Scattering Intensities. Talanta 2021, 221, 121465. [Google Scholar] [CrossRef] [Scilit] [PubMed]
- Fu, H.; Bao, H.; Zhang, H.; Zhao, Q.; Zhou, L.; Zhu, S.; Wei, Y.; Li, Y.; Cai, W. Quantitative Surface-Enhanced Raman Spectroscopy for Field Detections Based on Structurally Homogeneous Silver-Coated Silicon Nanocone Arrays. ACS Omega 2021, 6, 18928–18938. [Google Scholar] [CrossRef] [Scilit] [PubMed]
- Cheng, H.-W.; Tsai, H.-M.; Wang, Y.-L. Exploiting Purine as an Internal Standard for SERS Quantification of Purine Derivative Molecules Released by Bacteria. Anal. Chem. 2023, 95, 16967–16975. [Google Scholar] [CrossRef] [Scilit] [PubMed]
- Yang, L.; Zhang, M.; Lv, R.; Yang, R.; Huang, Y.; Yang, X.; Li, P.; Zhou, Z.; Li, Z. Ratiometric Surface-Enhanced Raman Spectroscopy Quantitative Detection Based on Interfacial Competitive Adsorption. Langmuir 2026, 42, 10470–10476. [Google Scholar] [CrossRef] [Scilit] [PubMed]
- Lange, C.; Borisyak, M.; Kögler, M.; Born, S.; Ziehe, A.; Neubauer, P.; Bournazou, M.N.C. Comparing Machine Learning Methods on Raman Spectra from Eight Different Spectrometers. Spectrochim. Acta Part A Mol. Biomol. Spectrosc. 2025, 334, 125861. [Google Scholar] [CrossRef] [Scilit] [PubMed]
- Lilek, D.; Zimmermann, D.; Steininger, L.; Musso, M.; Wilts, B.D.; Gamsjaeger, S.; Hermann, D.; Wiesner, C.; Grünfelder, A.; Herbinger, B.; et al. Machine Learning of Raman Spectroscopic Data: Comparison of Different Validation Strategies. J. Raman Spectrosc. 2025, 56, 867–877. [Google Scholar] [CrossRef] [Scilit]
- Wu, M.; Wang, S.; Pan, S.; Terentis, A.C.; Strasswimmer, J.; Zhu, X. Deep Learning Data Augmentation for Raman Spectroscopy Cancer Tissue Classification. Sci. Rep. 2021, 11, 23842. [Google Scholar] [CrossRef] [Scilit] [PubMed]
- Chung, J.; Zhang, J.; Saimon, A.I.; Liu, Y.; Johnson, B.N.; Kong, Z. Imbalanced Spectral Data Analysis Using Data Augmentation Based on the Generative Adversarial Network. Sci. Rep. 2024, 14, 13230. [Google Scholar] [CrossRef] [Scilit] [PubMed]
- Pavlou, E.; Kourkoumelis, N. Deep Adversarial Data Augmentation for Biomedical Spectroscopy: Application to Modelling Raman Spectra of Bone. Chemom. Intell. Lab. Syst. 2022, 228, 104634. [Google Scholar] [CrossRef] [Scilit]
- Kim, Y.; Lee, W. Distributed Raman Spectrum Data Augmentation System Using Federated Learning with Deep Generative Models. Sensors 2022, 22, 9900. [Google Scholar] [CrossRef] [Scilit] [PubMed]
- Yao, H.; Luo, W.; Wang, X. Adversarial Contrastive Domain-Generative Learning for Bacteria Raman Spectrum Joint Denoising and Cross-Domain Identification. Eng. Appl. Artif. Intell. 2025, 148, 110426. [Google Scholar] [CrossRef] [Scilit]
- Zhang, Z.; Liu, Y.; Chen, C.; Lv, X.; Chen, C. Unsupervised Domain Adaptation with Raman Spectroscopy for Rapid Autoimmune Disease Diagnosis. Sensors 2025, 25, 6186. [Google Scholar] [CrossRef] [Scilit] [PubMed]
- Lai, J.; Li, M.; Chen, S.; Long, J.; Chen, Y.; Lu, H.; Zou, C.; Zhang, Z. Calibration Transfer of Deep Learning Models among Multiple Raman Spectrometers via Low-Rank Adaptation. Anal. Chem. 2025, 97, 19009–19018. [Google Scholar] [CrossRef] [Scilit] [PubMed]
- Kamran, J.; Hniopek, J.; Bocklitz, T. Transfer-Learning Deep Raman Models Using Semiempirical Quantum Chemistry. J. Chem. Inf. Model. 2025, 65, 6632–6643. [Google Scholar] [CrossRef] [Scilit] [PubMed]
- Mahmud, S.; Sayem, F.R.; Hassan, M.; Yang, Y.; Chowdhury, M.E.H.; Zughaier, S.M.; Bensaali, F.; Zhao, Y. Deep Learning-Based Cross-Device Standardization of Surface-Enhanced Raman Spectroscopy for Enhanced Bacterial Recognition. Spectrochim. Acta Part A Mol. Biomol. Spectrosc. 2026, 347, 126931. [Google Scholar] [CrossRef] [Scilit] [PubMed]
- Coca-Lopez, N.; Alcolea-Rodriguez, V.; Bañares, M.A.; Brockhauser, S.; Gorenflot, J.; Henderson, A.; Hildebrandt, R.; Jeliazkova, N.; Kochev, N.; Lozano Diz, E.; et al. Artificial Intelligence-Powered Raman Spectroscopy through Open Science and FAIR Principles. ACS Nano 2025, 19, 38189–38218. [Google Scholar] [CrossRef] [Scilit] [PubMed]
- Chin, C.-L.; Chang, C.-E.; Chao, L. Interpretable Multiscale Convolutional Neural Network for Classification and Feature Visualization of Weak Raman Spectra of Biomolecules at Cell Membranes. ACS Sens. 2025, 10, 2652–2666. [Google Scholar] [CrossRef] [Scilit] [PubMed]
- Selvaraju, R.R.; Cogswell, M.; Das, A.; Vedantam, R.; Parikh, D.; Batra, D. Grad-CAM: Visual Explanations from Deep Networks via Gradient-Based Localization. In Proceedings of the 2017 IEEE International Conference on Computer Vision (ICCV), Venice, Italy, 22–29 October 2017; IEEE: New York, NY, USA, 2017; pp. 618–626. [Google Scholar]
- Shi, G.; Wu, H.; Luo, S.; Lu, X.; Ren, B.; Zhang, Q.; Lin, W.; Chen, R.; Guo, P.; Chen, H.; et al. 1D Gradient-Weighted Class Activation Mapping, Visualizing Decision Process of Convolutional Neural Network-Based Models in Spectroscopy Analysis. Anal. Chem. 2023, 95, 9959–9966. [Google Scholar] [CrossRef] [Scilit] [PubMed]
- Rossberg, N.; Gautam, R.; Komolibus, K.; O’Sullivan, B.; Visentin, A. Explainable AI-Based Feature Selection Approaches for Raman Spectroscopy. Diagnostics 2025, 15, 2063. [Google Scholar] [CrossRef] [Scilit] [PubMed]
- Zaki, J.K.; Tomasik, J.; McCune, J.A.; Bahn, S.; Lió, P.; Scherman, O.A. Explainable Deep Learning Framework for SERS Bioquantification. ACS Sens. 2025, 10, 6597–6606. [Google Scholar] [CrossRef] [Scilit] [PubMed]
- Chen, H.; Wang, L.; Fan, D.; Ma, P.; Zhang, X.; Lin, K. SERS Mapping Combined with Explainable Deep Learning for Exosome Analysis to Enhance Lung Cancer Detection. Analyst 2025, 150, 4332–4341. [Google Scholar] [CrossRef] [Scilit] [PubMed]
- Shen, Z.; Xie, L.; Hou, Y.; Liang, J.; Jia, Y.; Zhang, H.; Sun, Z.; Du, J.; He, Z.; Liu, C.; et al. An Interpretable SERS–AI Platform for Rapid and Quantitative Diagnosis of Polymicrobial UTIs: Powered by Positively Charged Plasmonic Nanoparticles and Attention-Based Deep Learning. Adv. Sci. 2025, 12, e13502. [Google Scholar] [CrossRef] [Scilit] [PubMed]
- Srivastava, S.; Wang, W.; Zhou, W.; Jin, M.; Vikesland, P.J. Machine Learning-Assisted Surface-Enhanced Raman Spectroscopy Detection for Environmental Applications: A Review. Environ. Sci. Technol. 2024, 58, 20830–20848. [Google Scholar] [CrossRef] [Scilit] [PubMed]
- Shin, H.; Choi, B.H.; Shim, O.; Kim, J.; Park, Y.; Cho, S.K.; Kim, H.K.; Choi, Y. Single Test-Based Diagnosis of Multiple Cancer Types Using Exosome-SERS-AI for Early Stage Cancers. Nat. Commun. 2023, 14, 1644. [Google Scholar] [CrossRef] [Scilit] [PubMed]
- Hou, X.; Sivashanmugan, K.; Zhao, Y.; Zhang, B.; Wang, A.X. Multiplex Sensing of Complex Mixtures by Machine Vision Analysis of TLC-SERS Images. Sens. Actuators B Chem. 2022, 357, 131355. [Google Scholar] [CrossRef] [Scilit] [PubMed]
- Fang, G.; Hasi, W.; Lin, X.; Han, S. Automated Identification of Pesticide Mixtures via Machine Learning Analysis of TLC-SERS Spectra. J. Hazard. Mater. 2024, 474, 134814. [Google Scholar] [CrossRef] [Scilit] [PubMed]
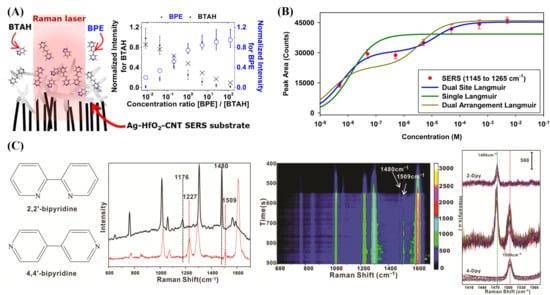
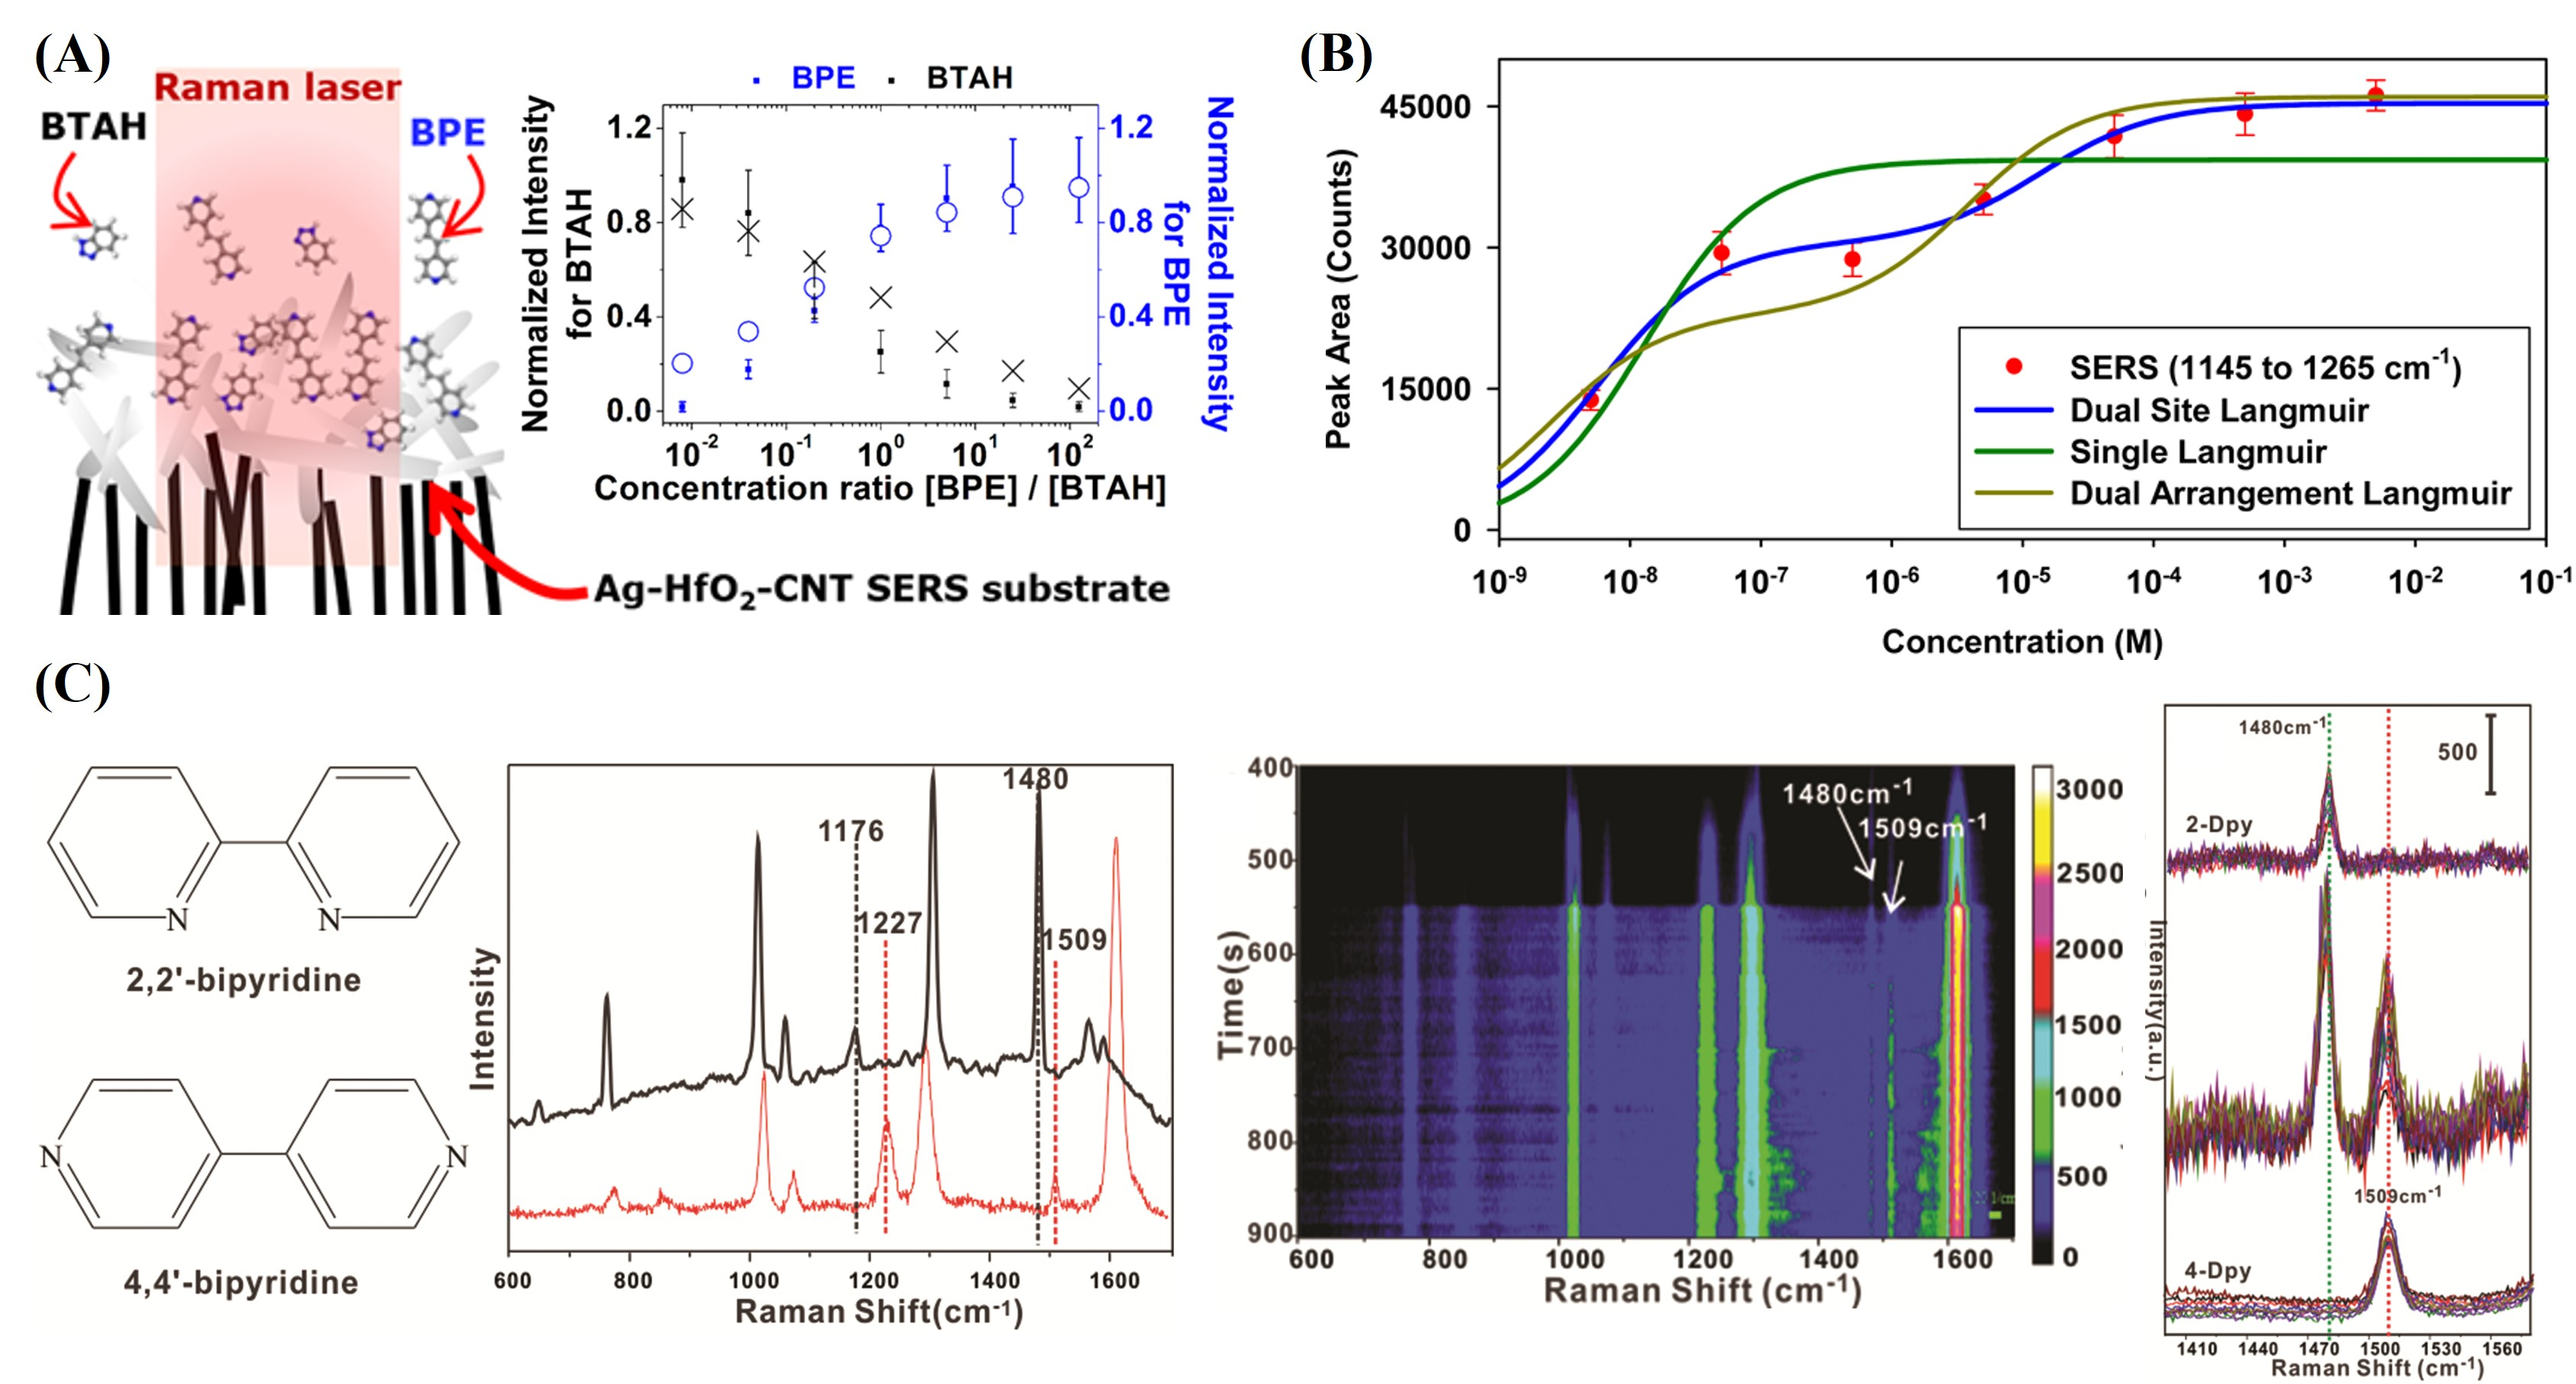
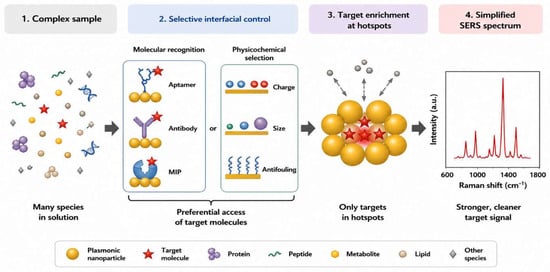
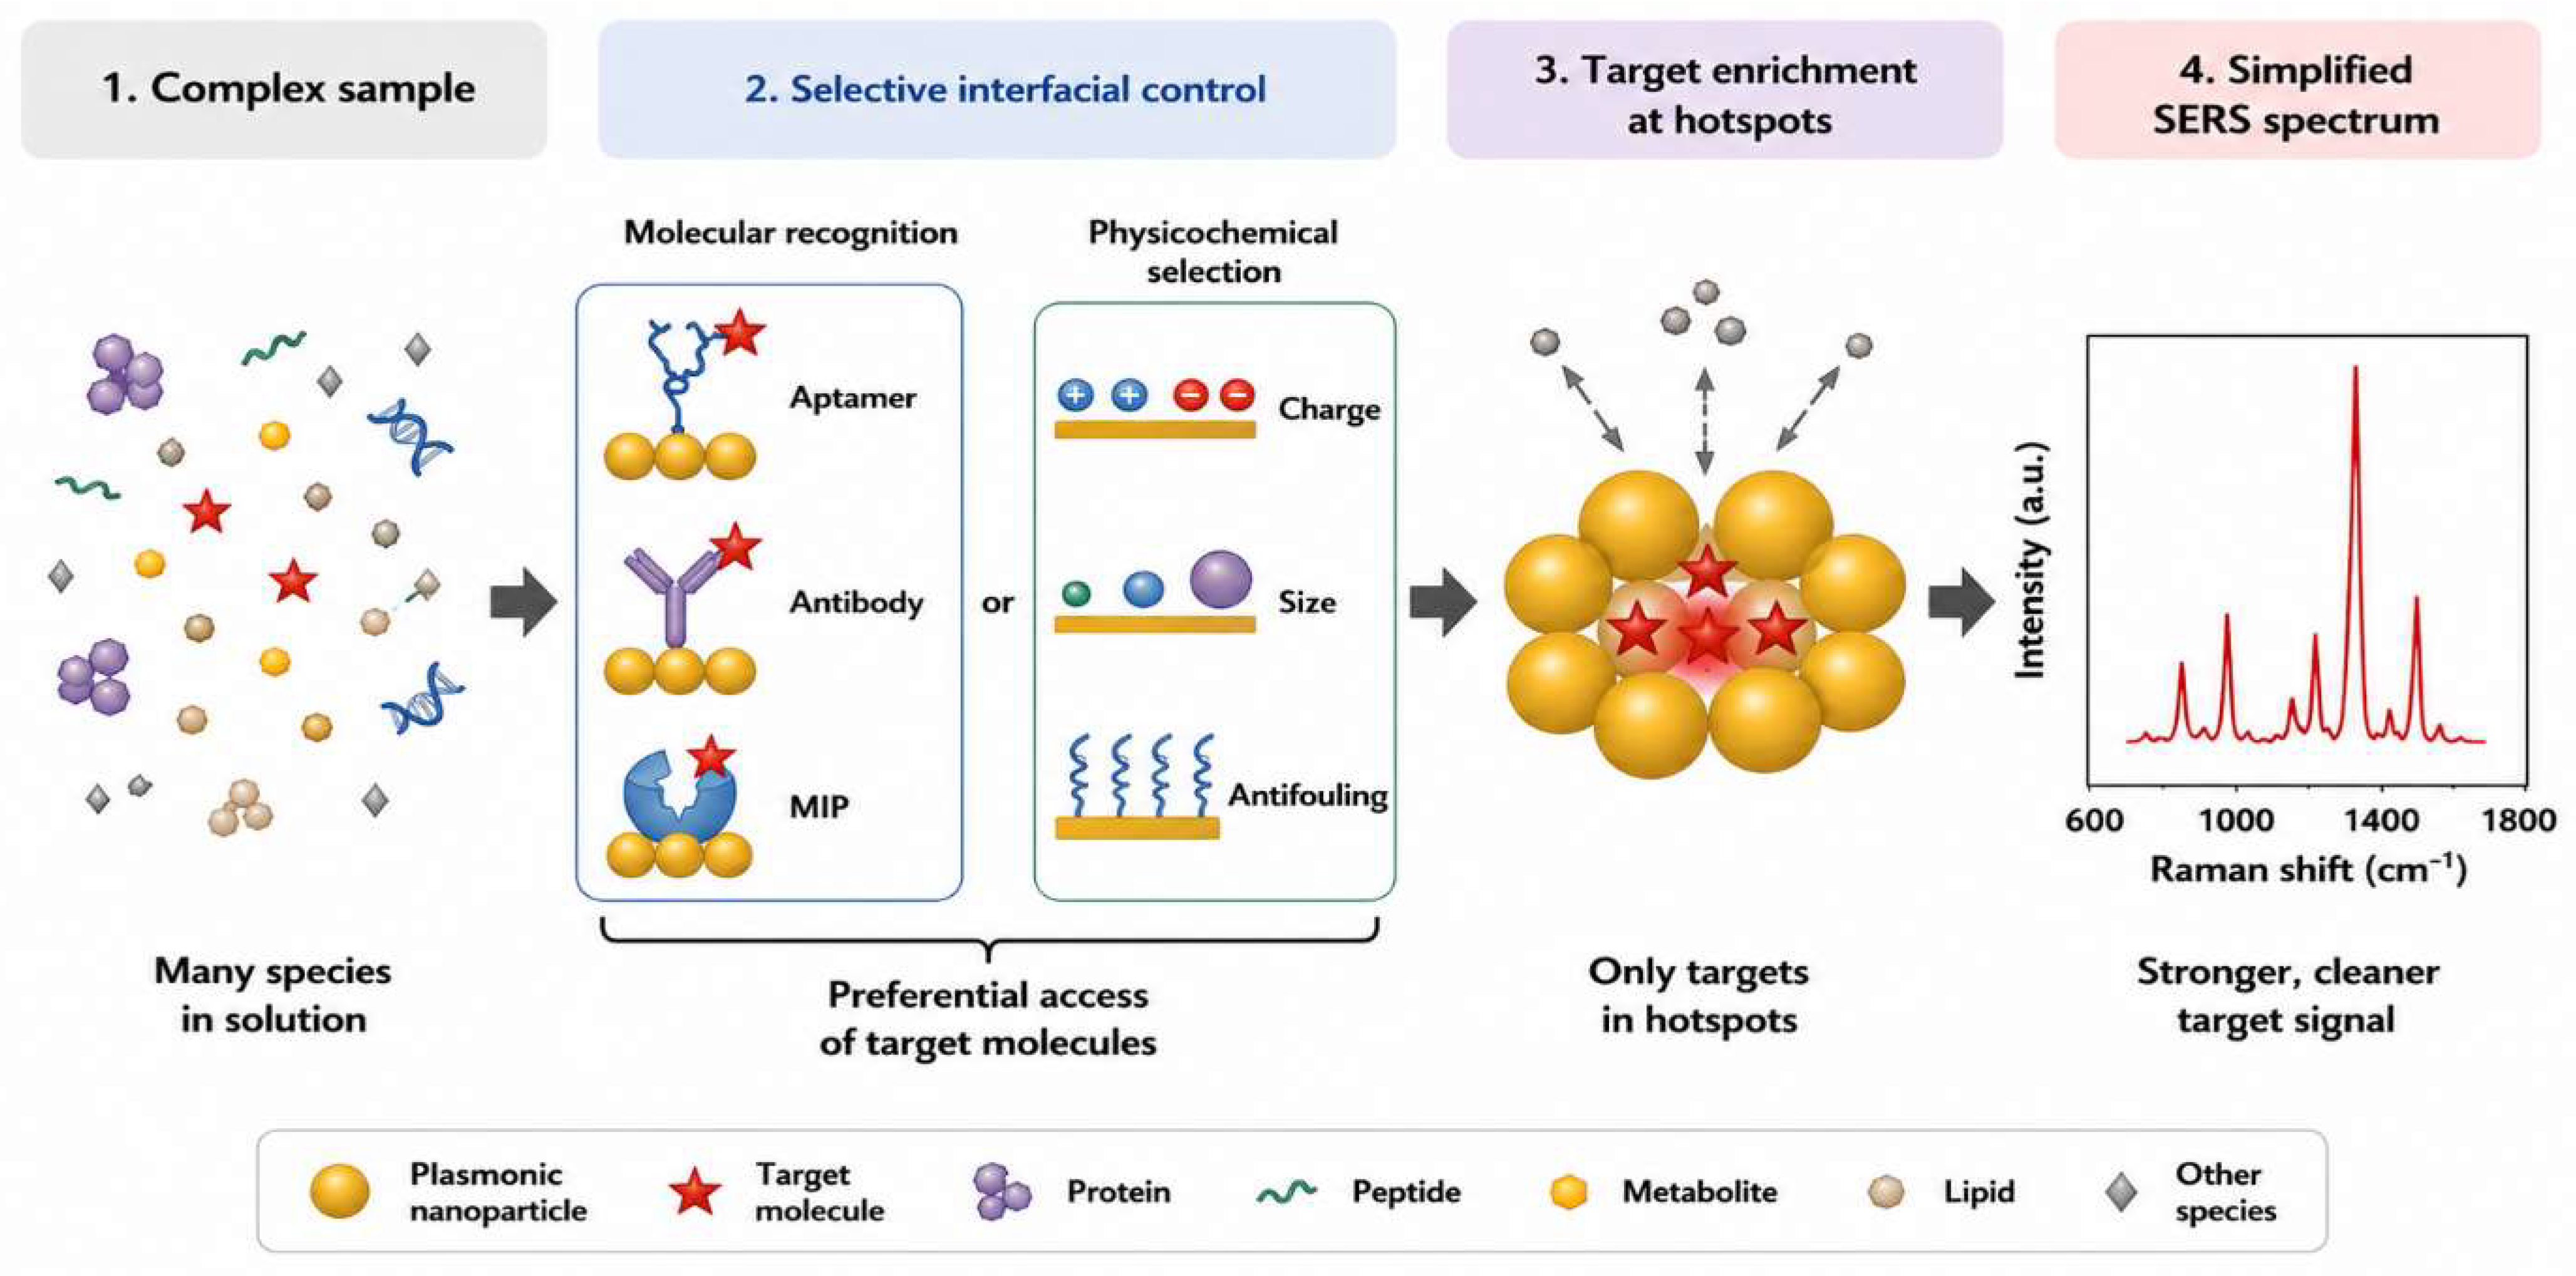
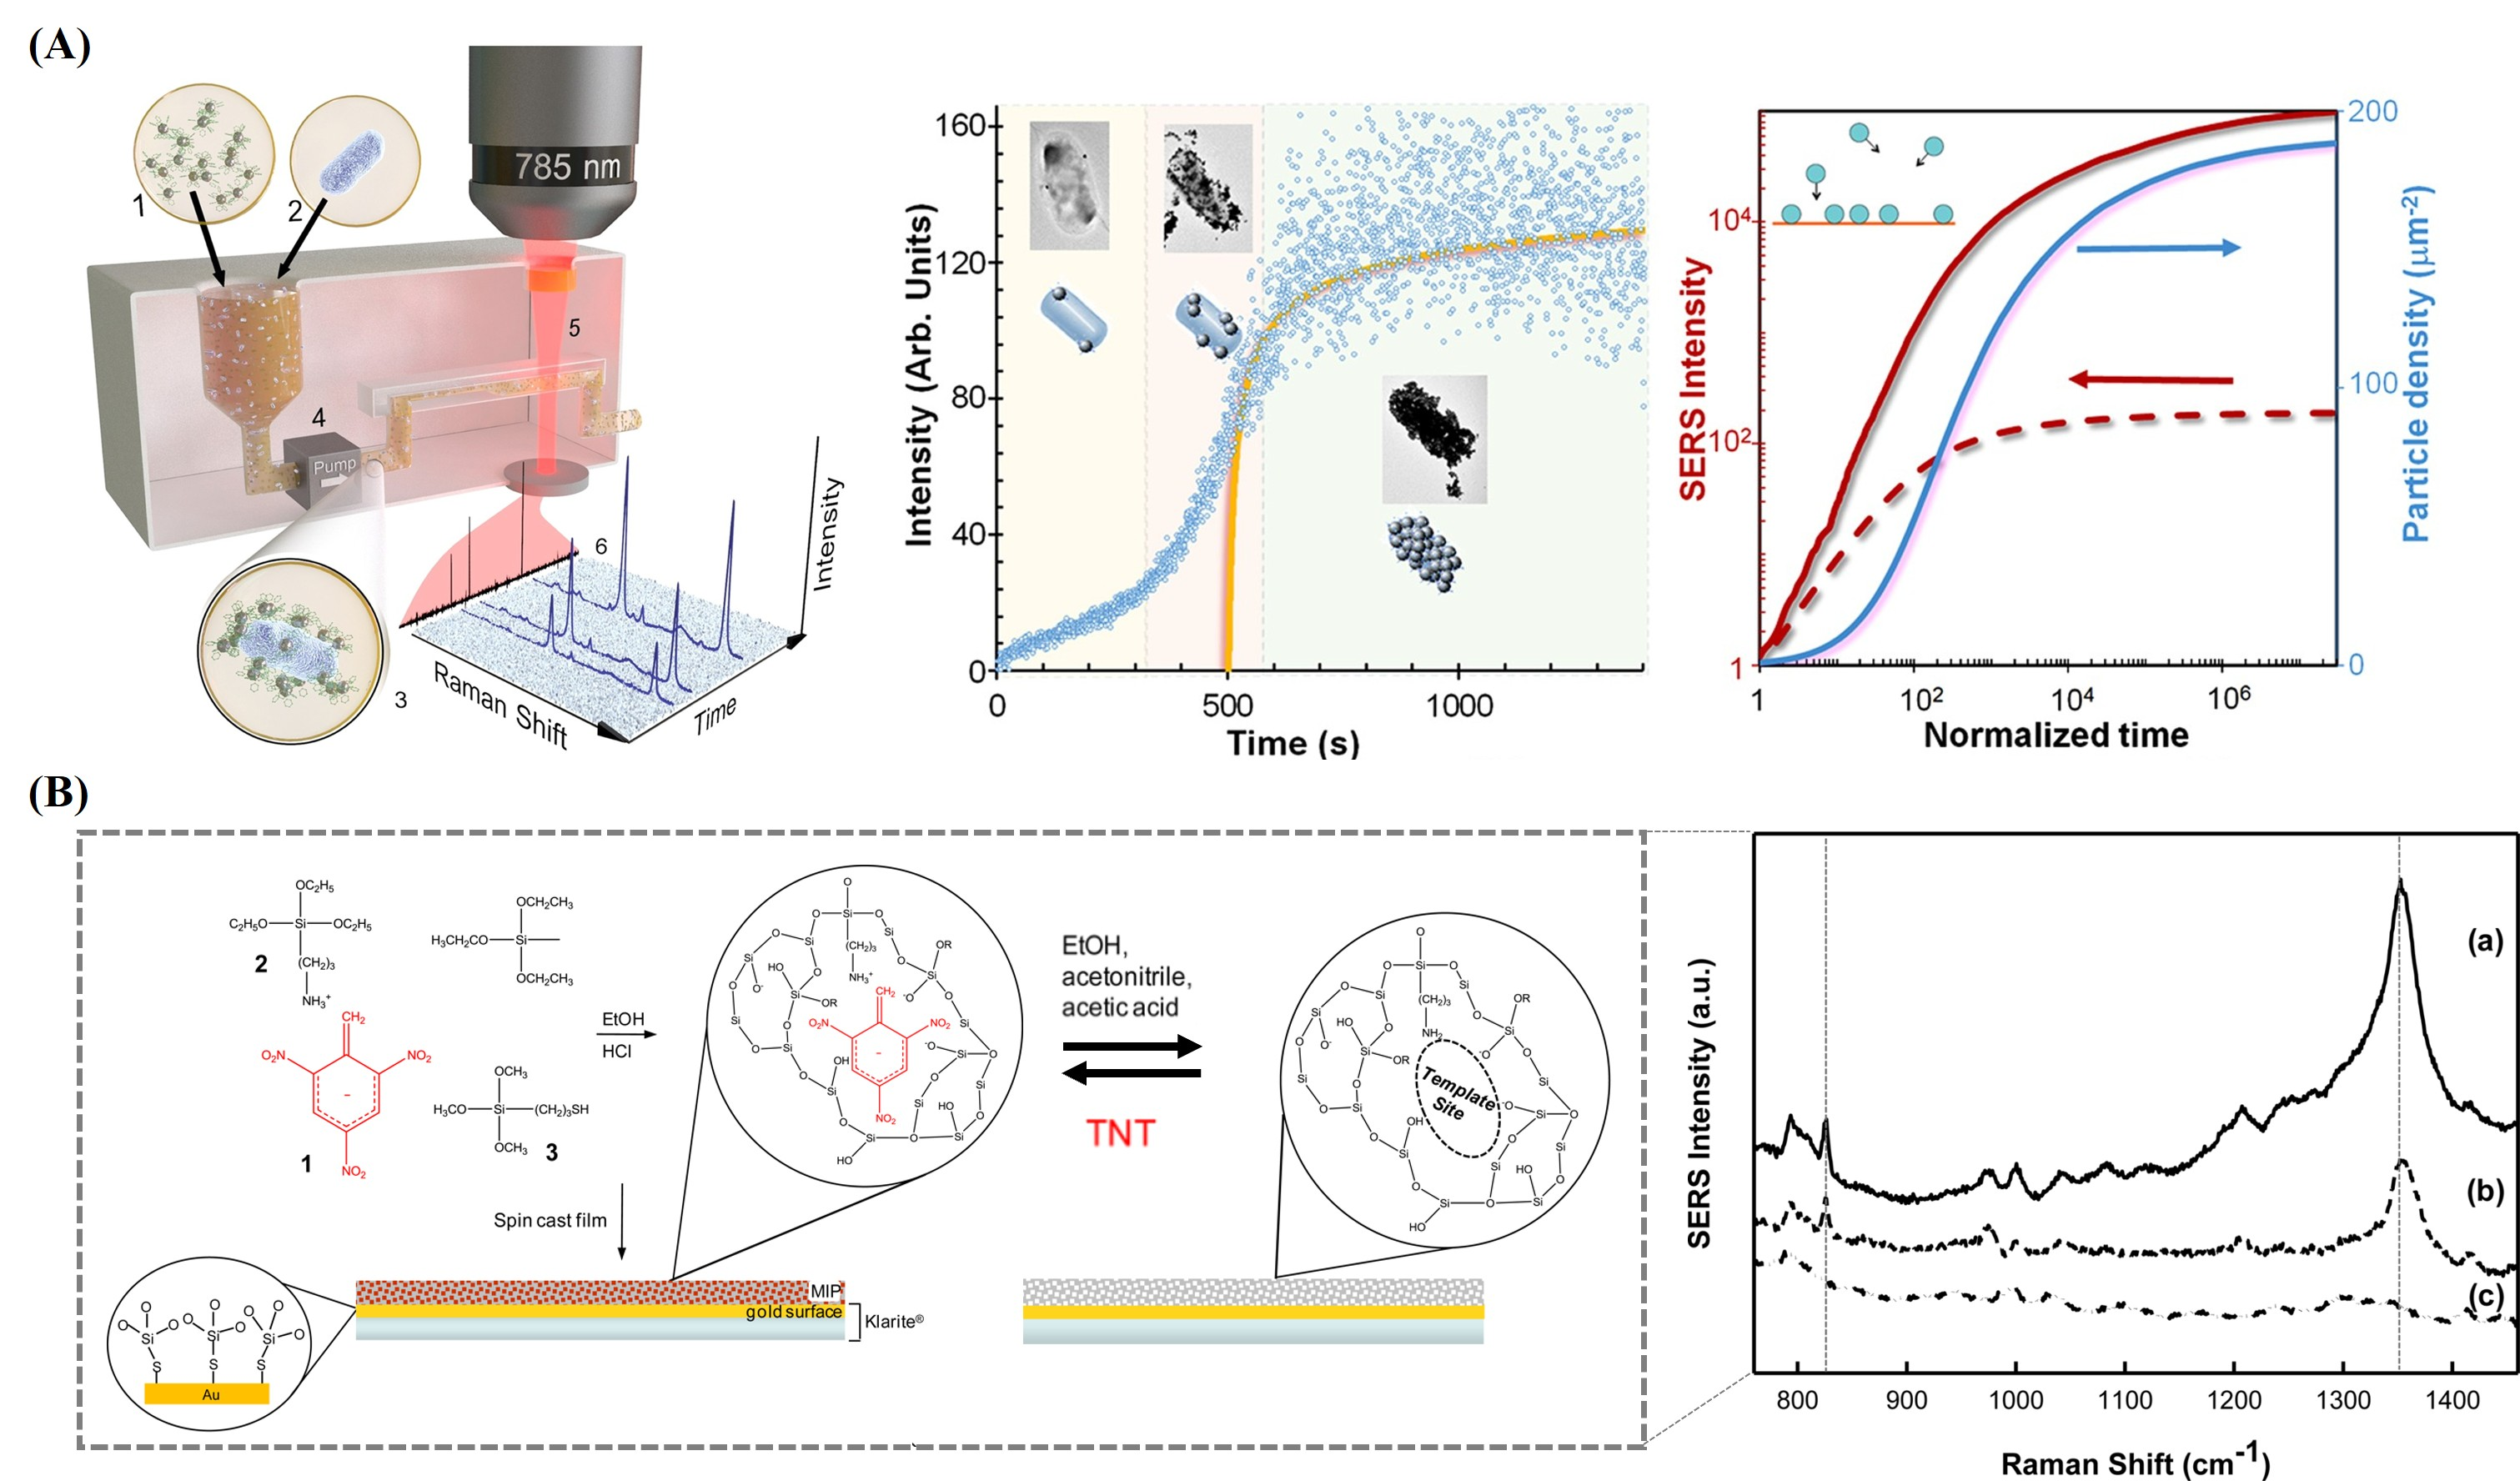
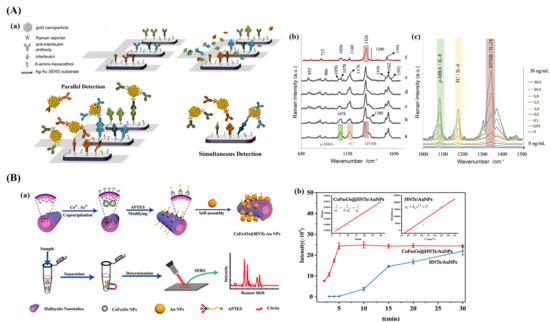
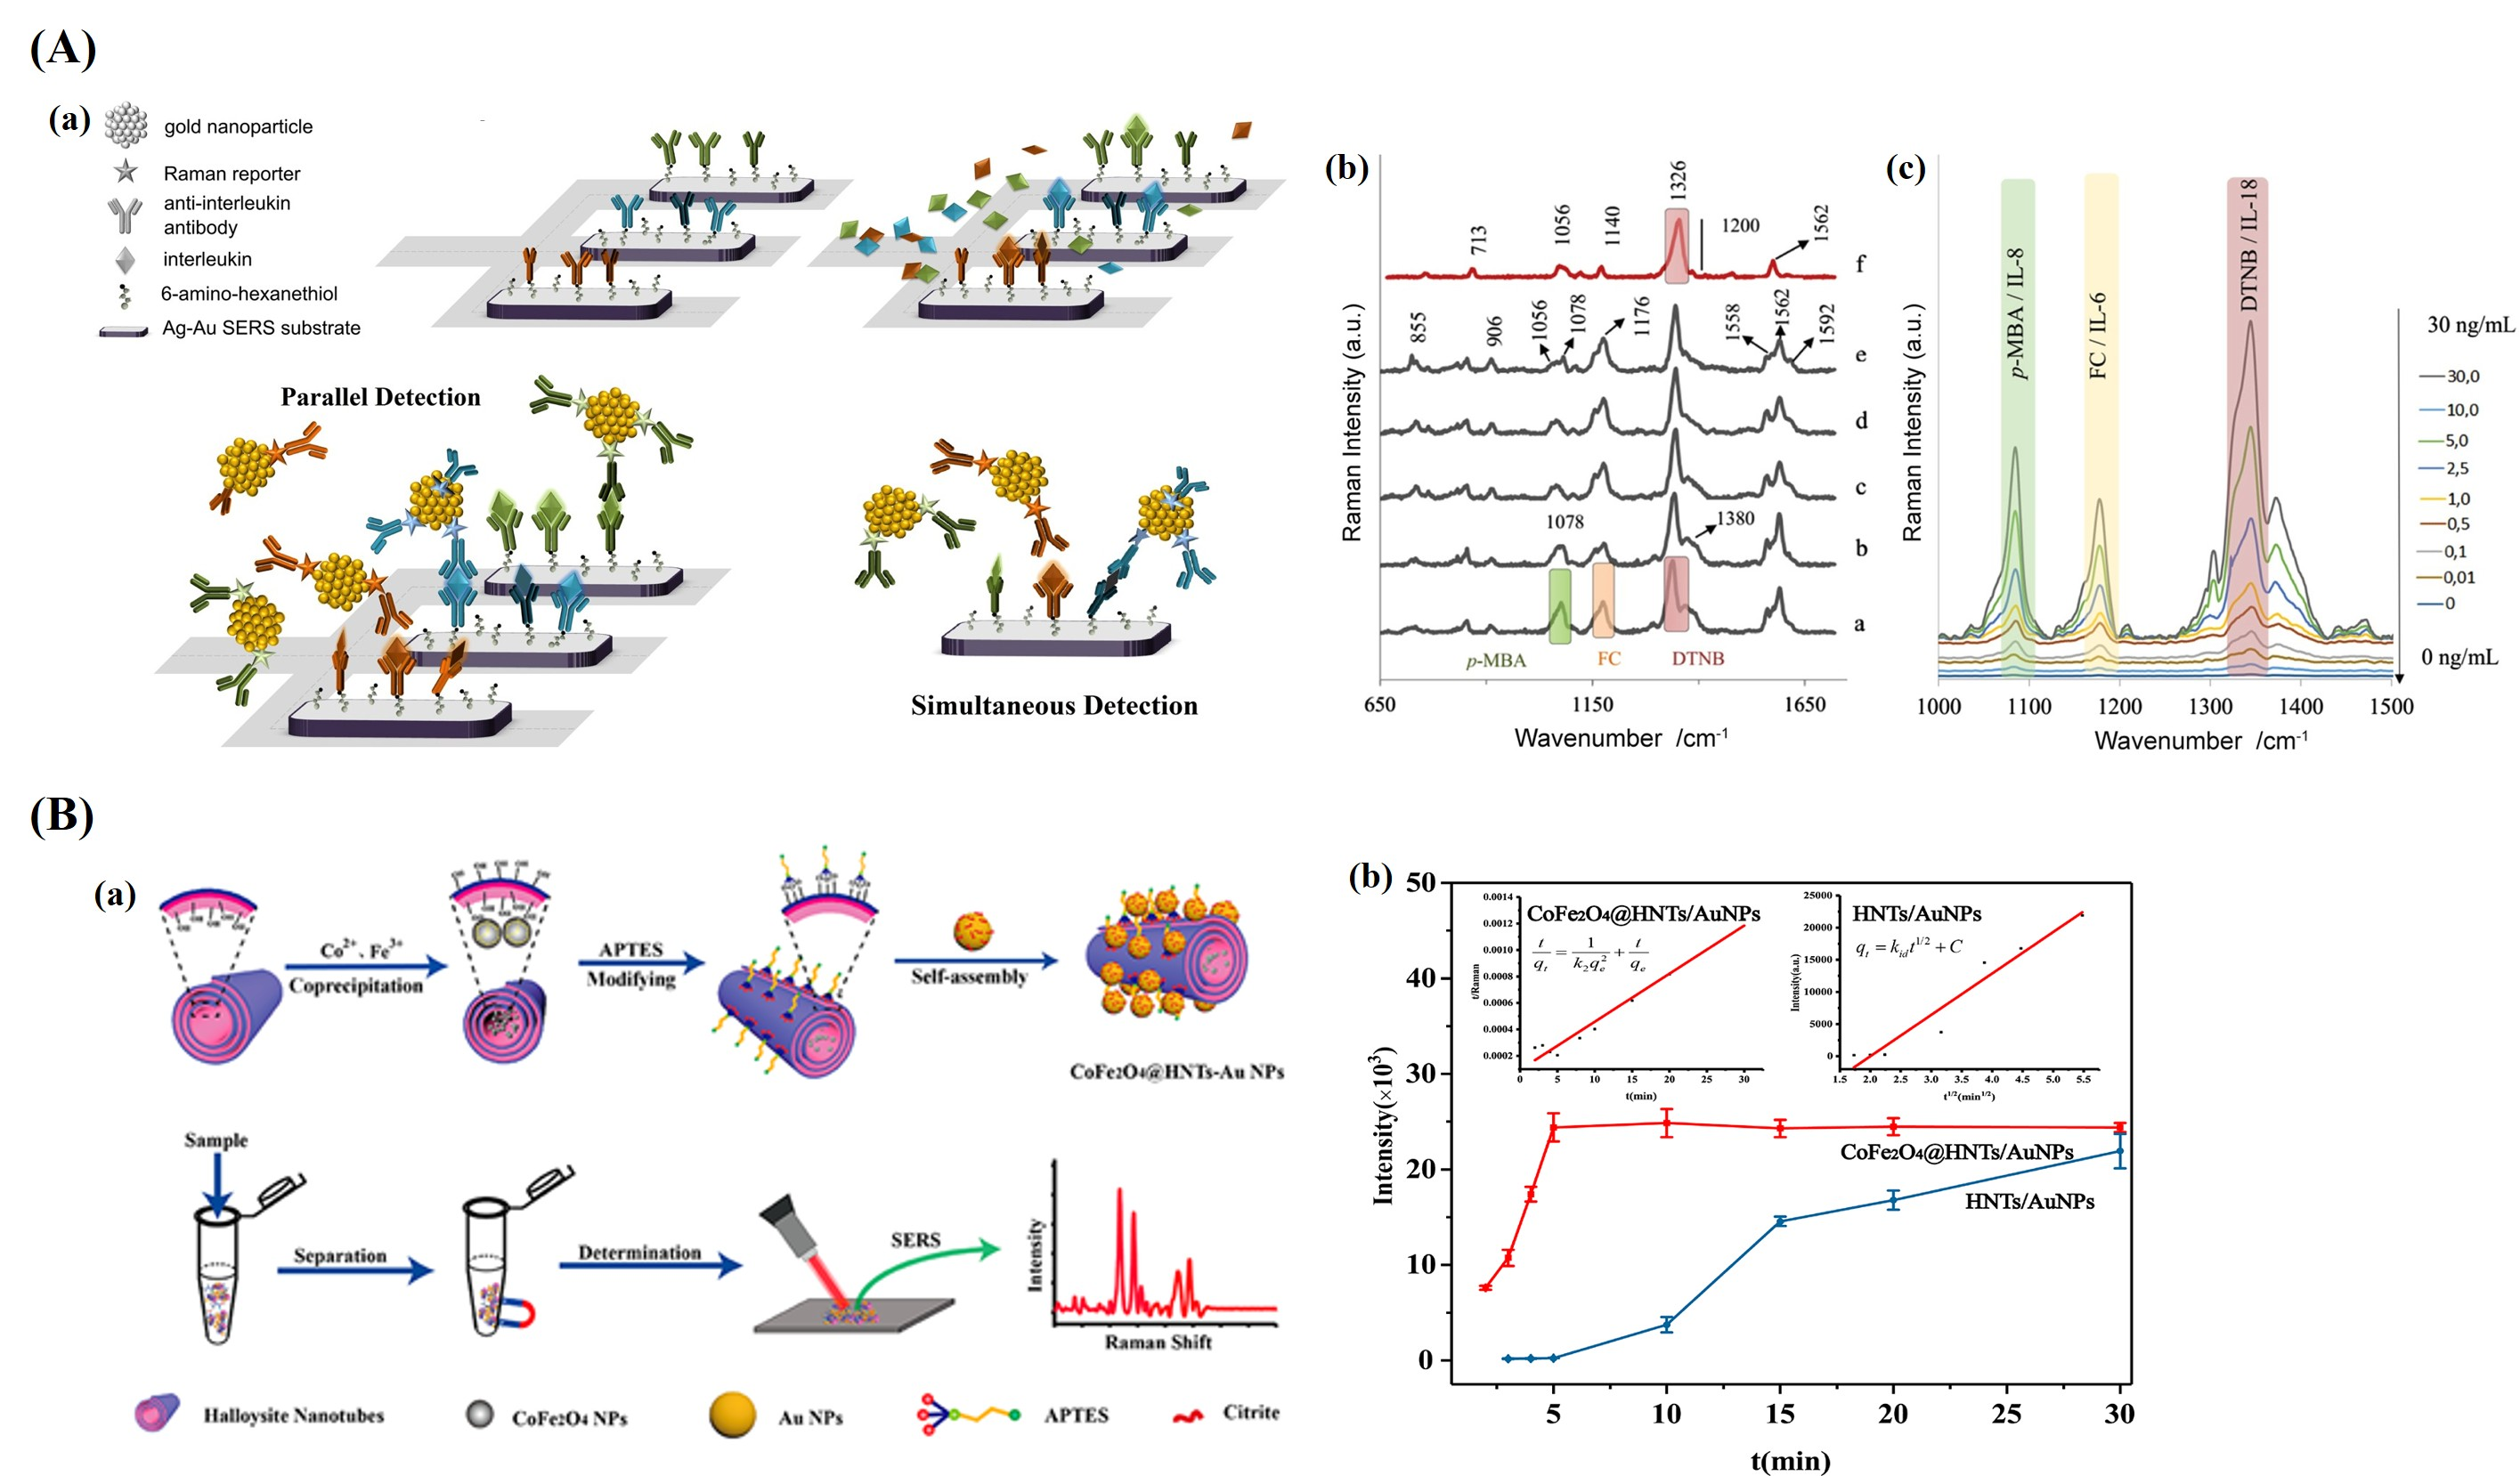
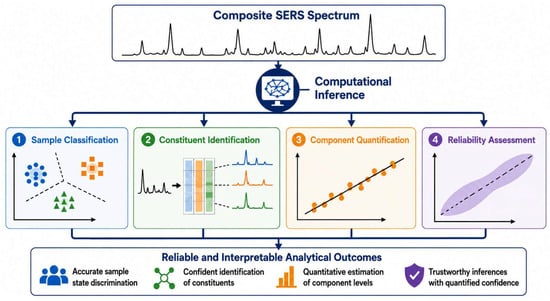
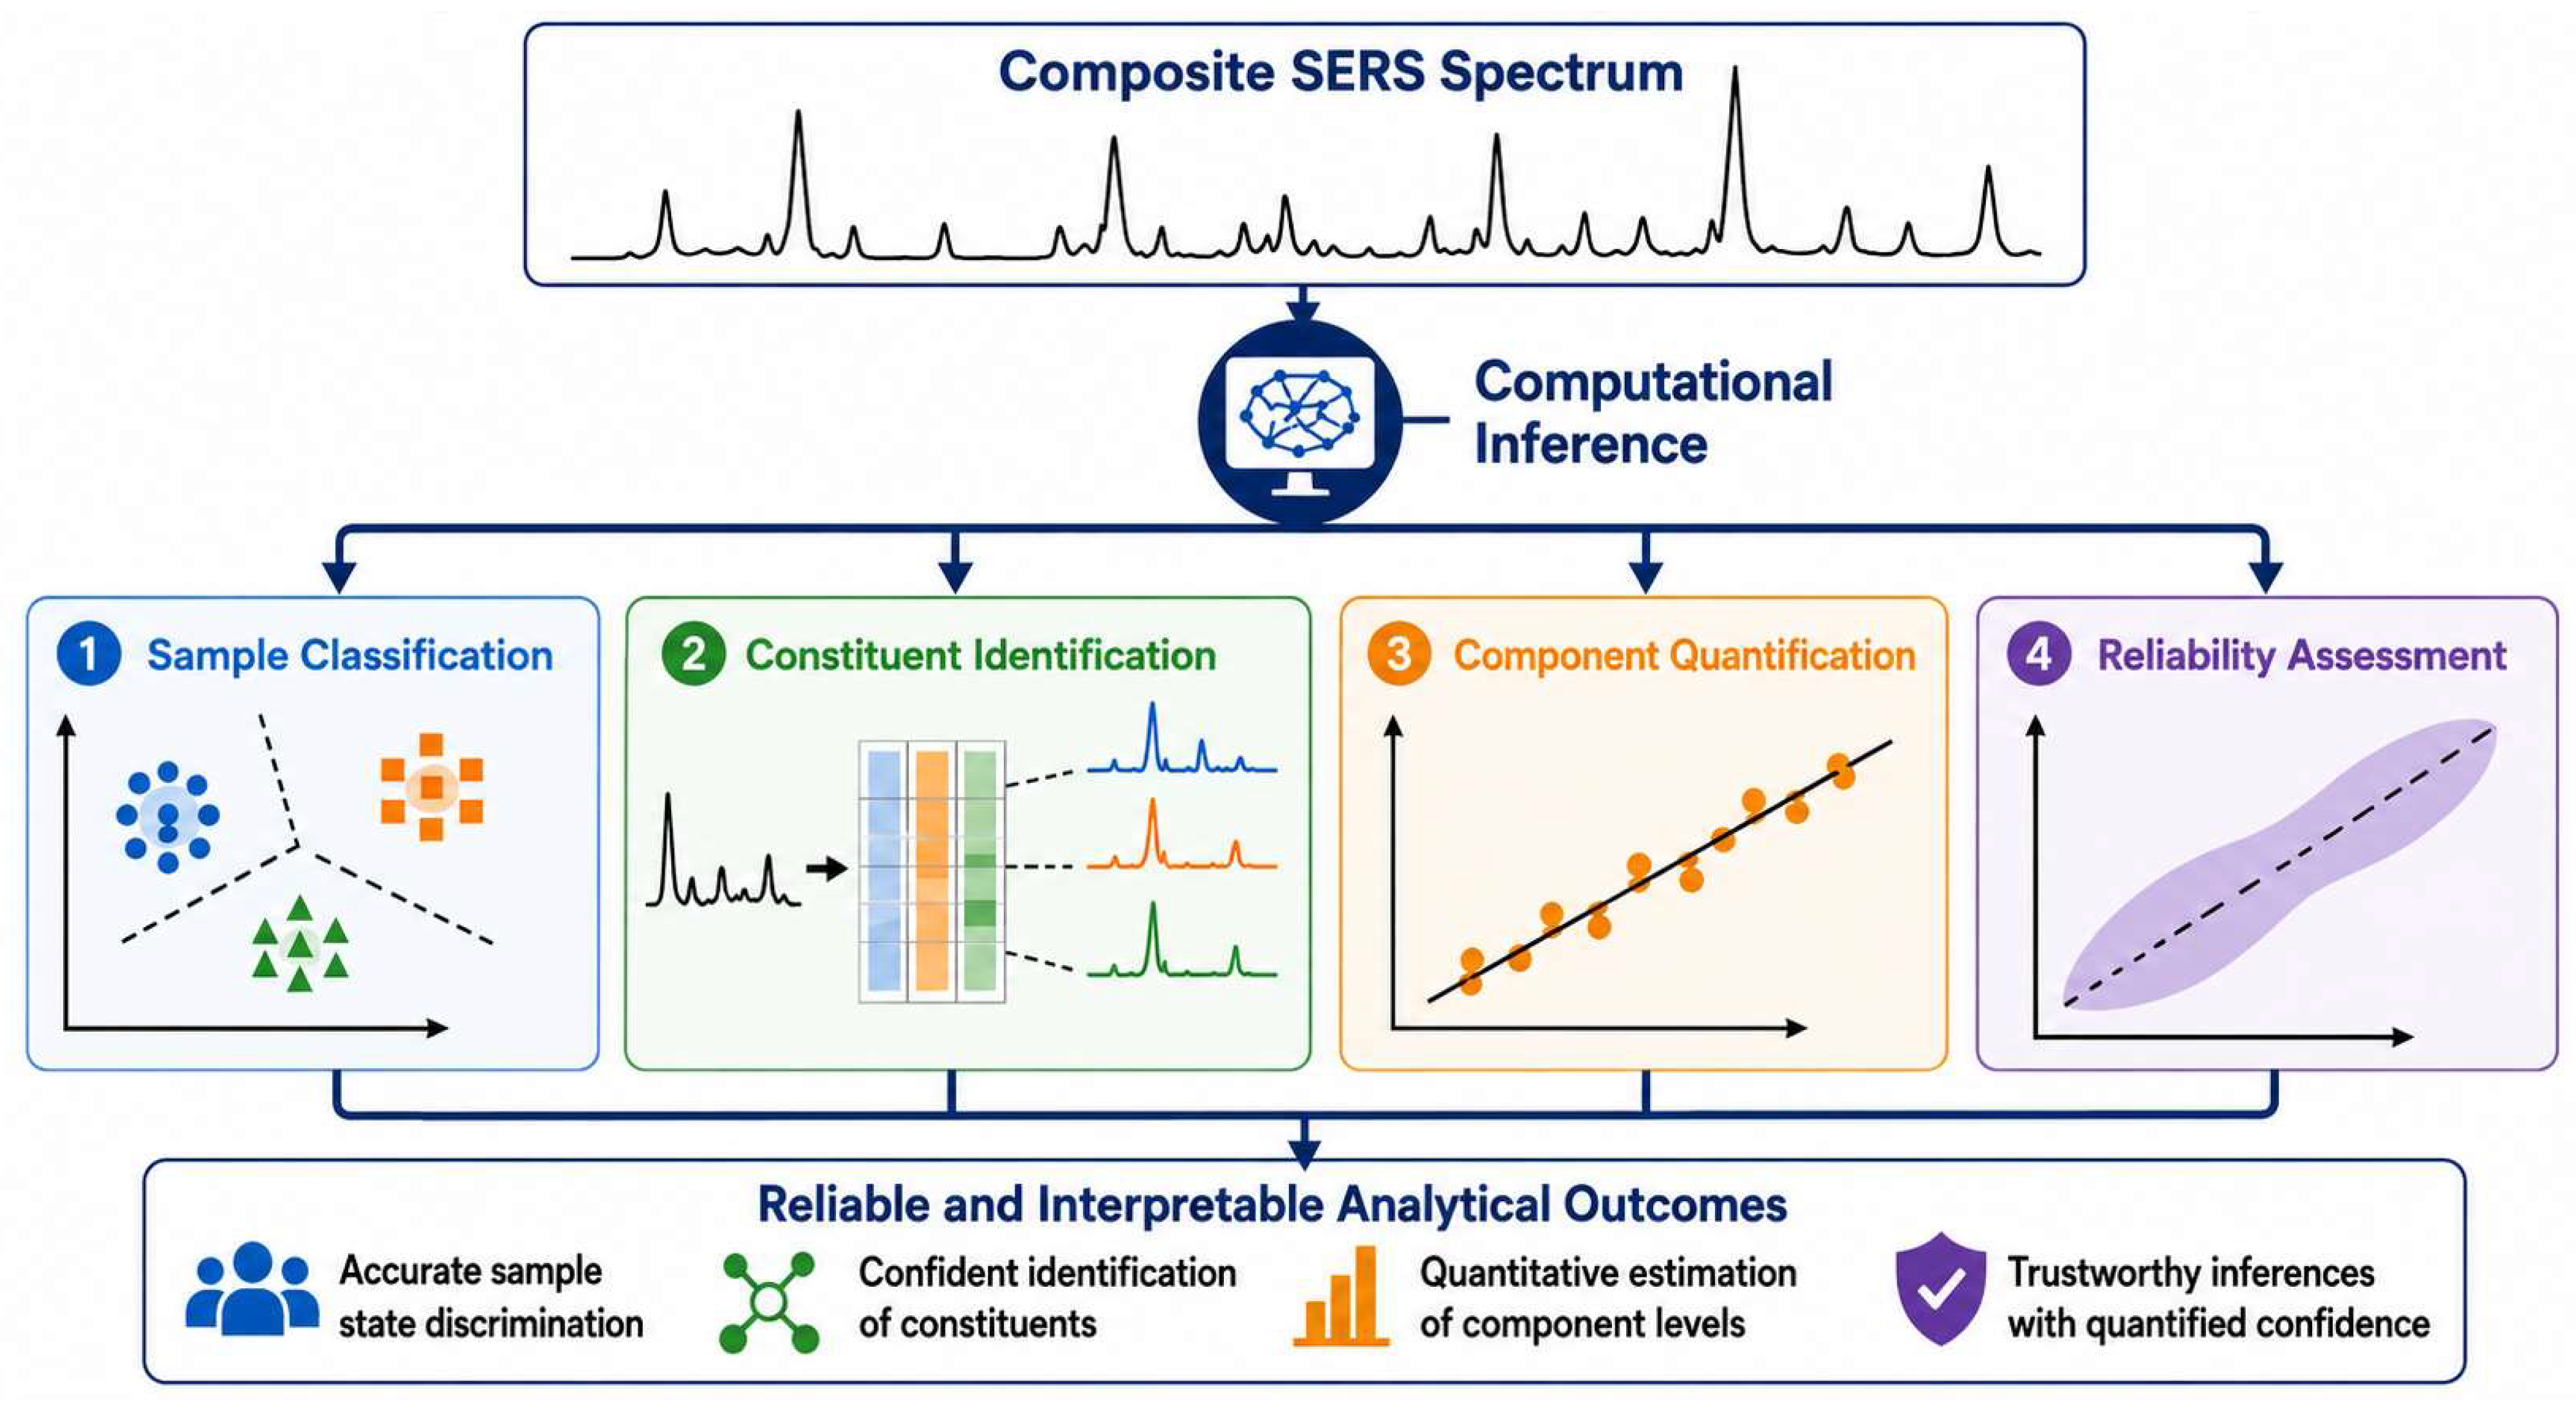
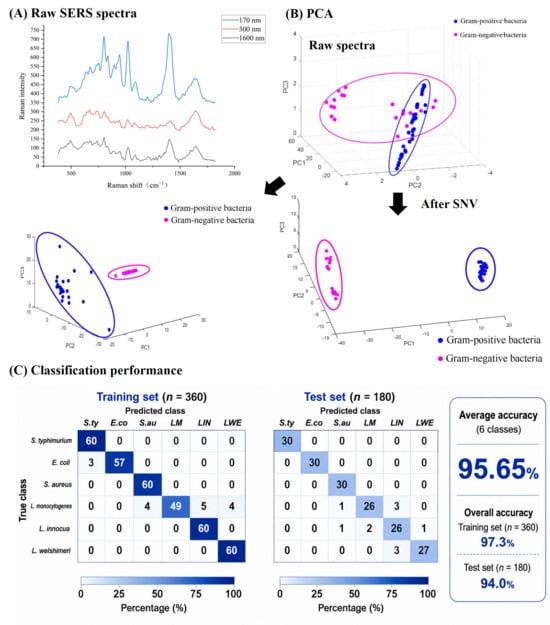
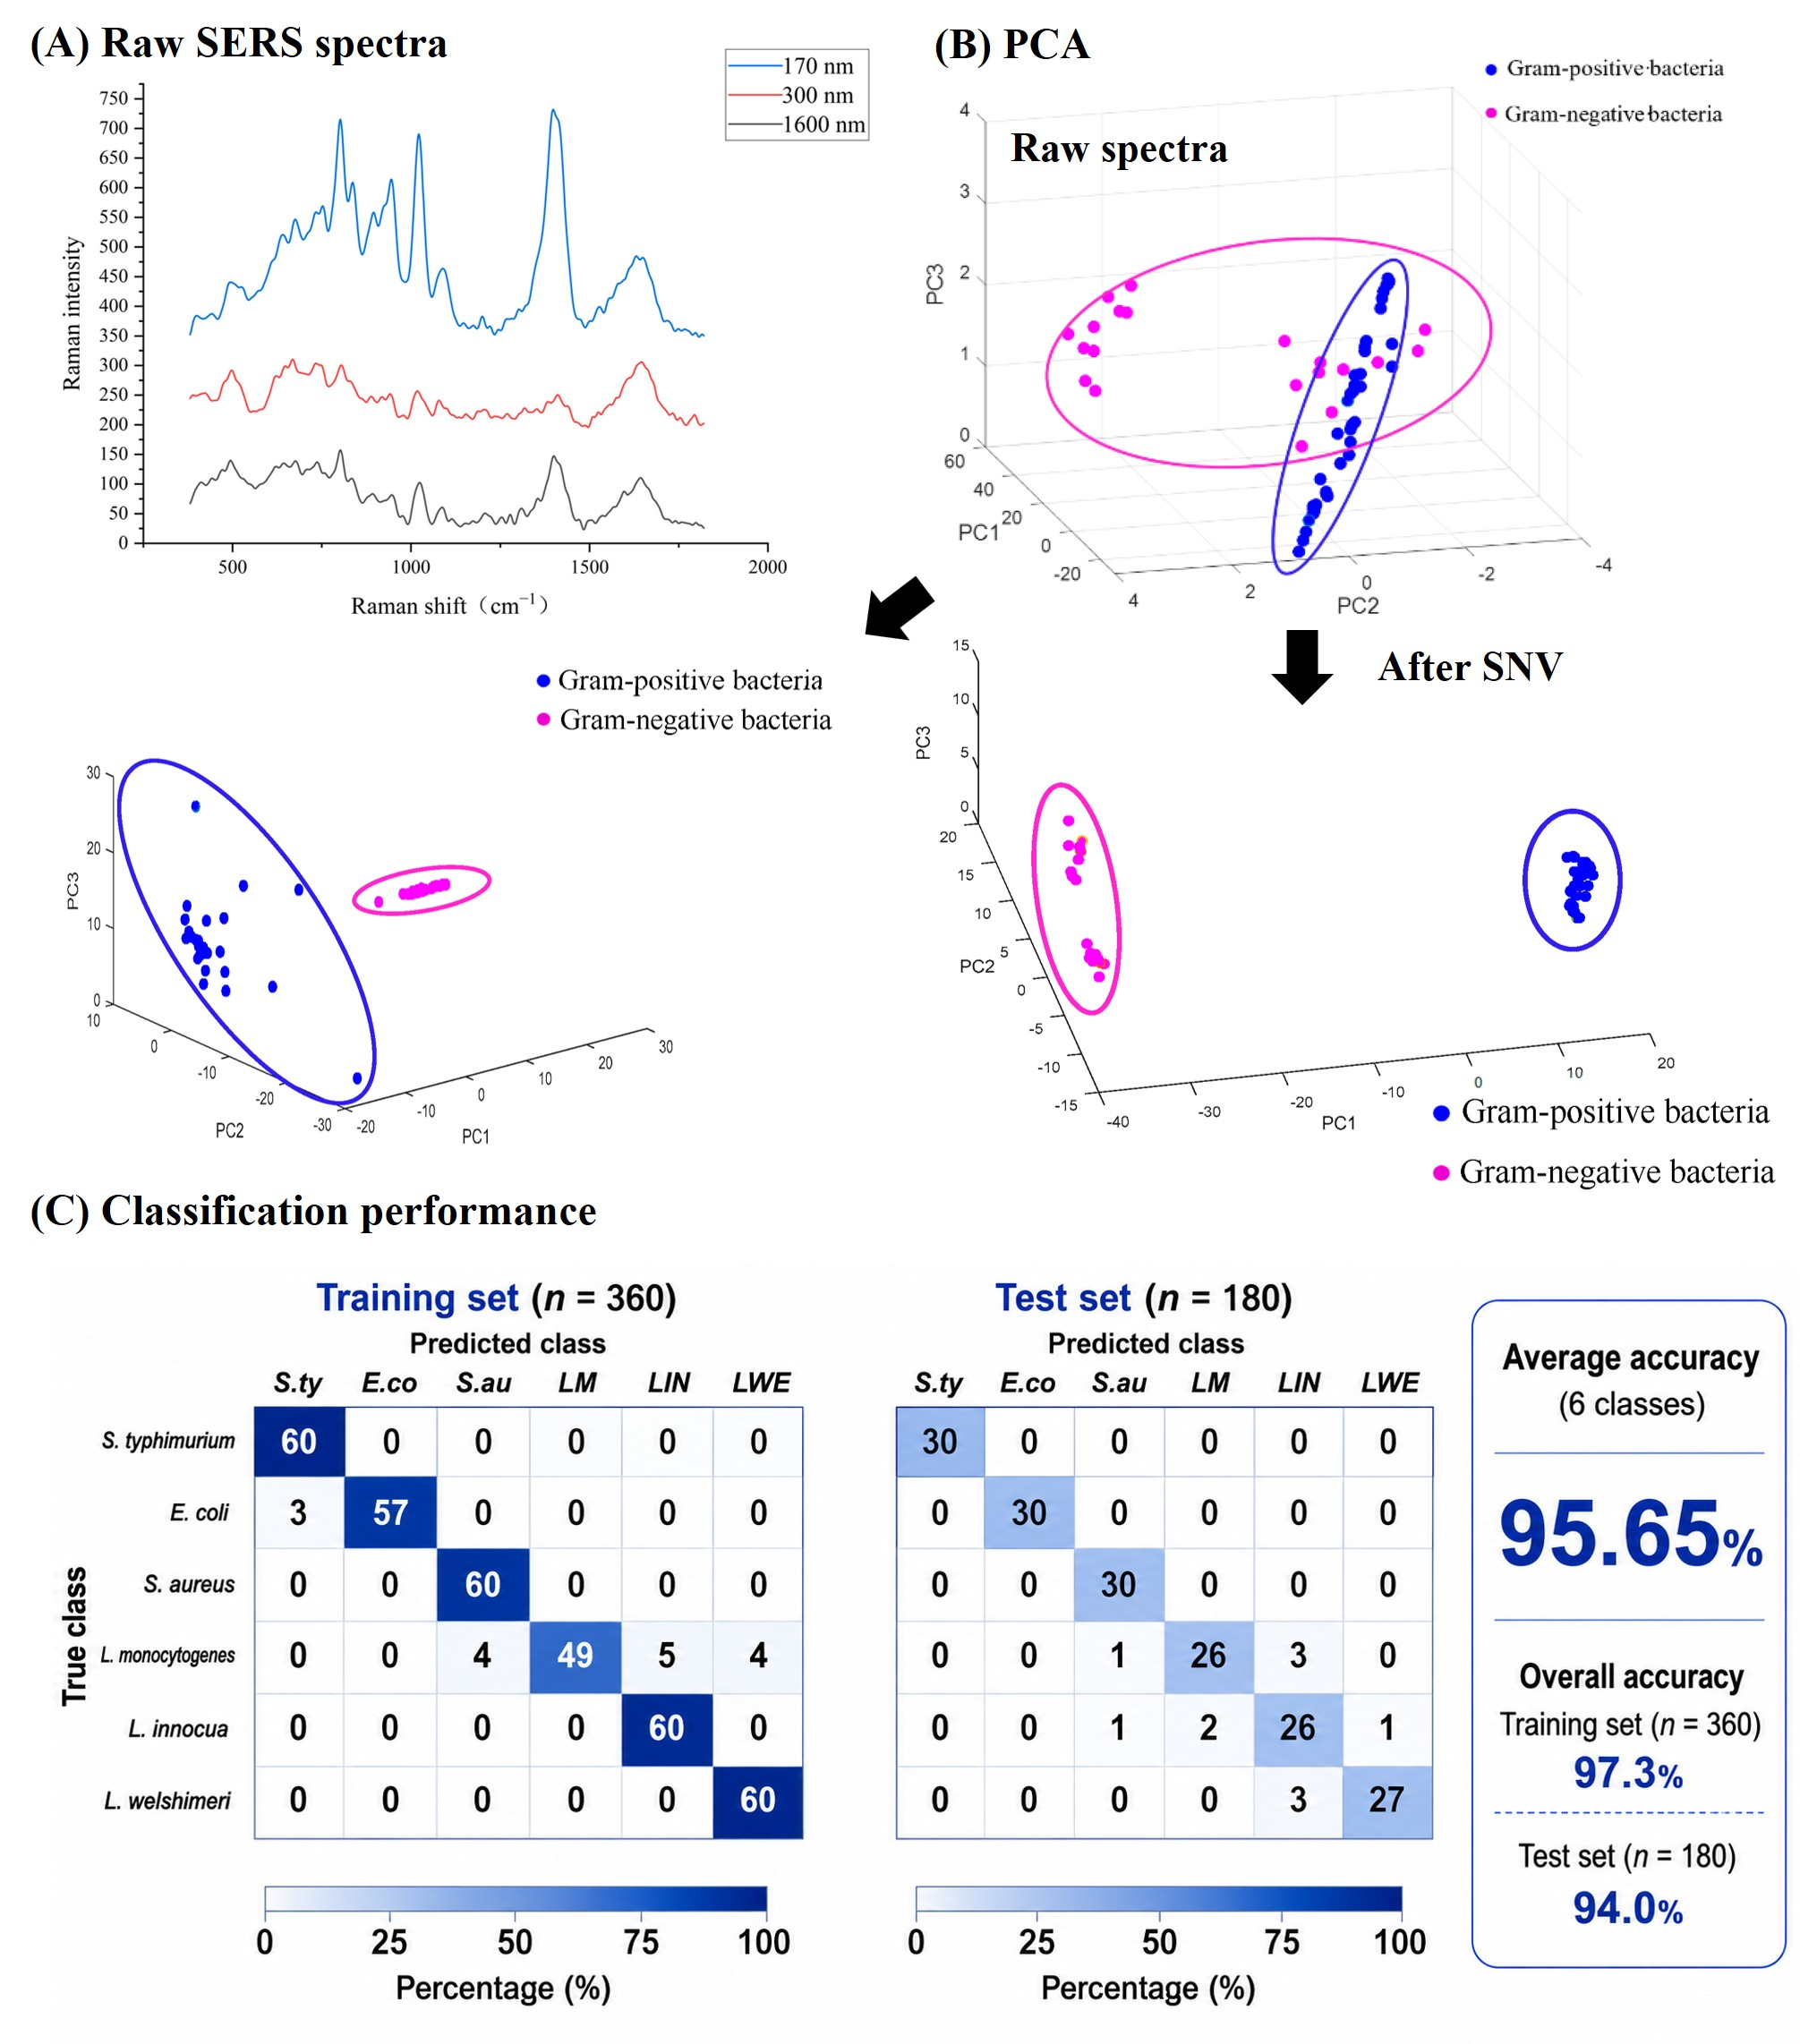
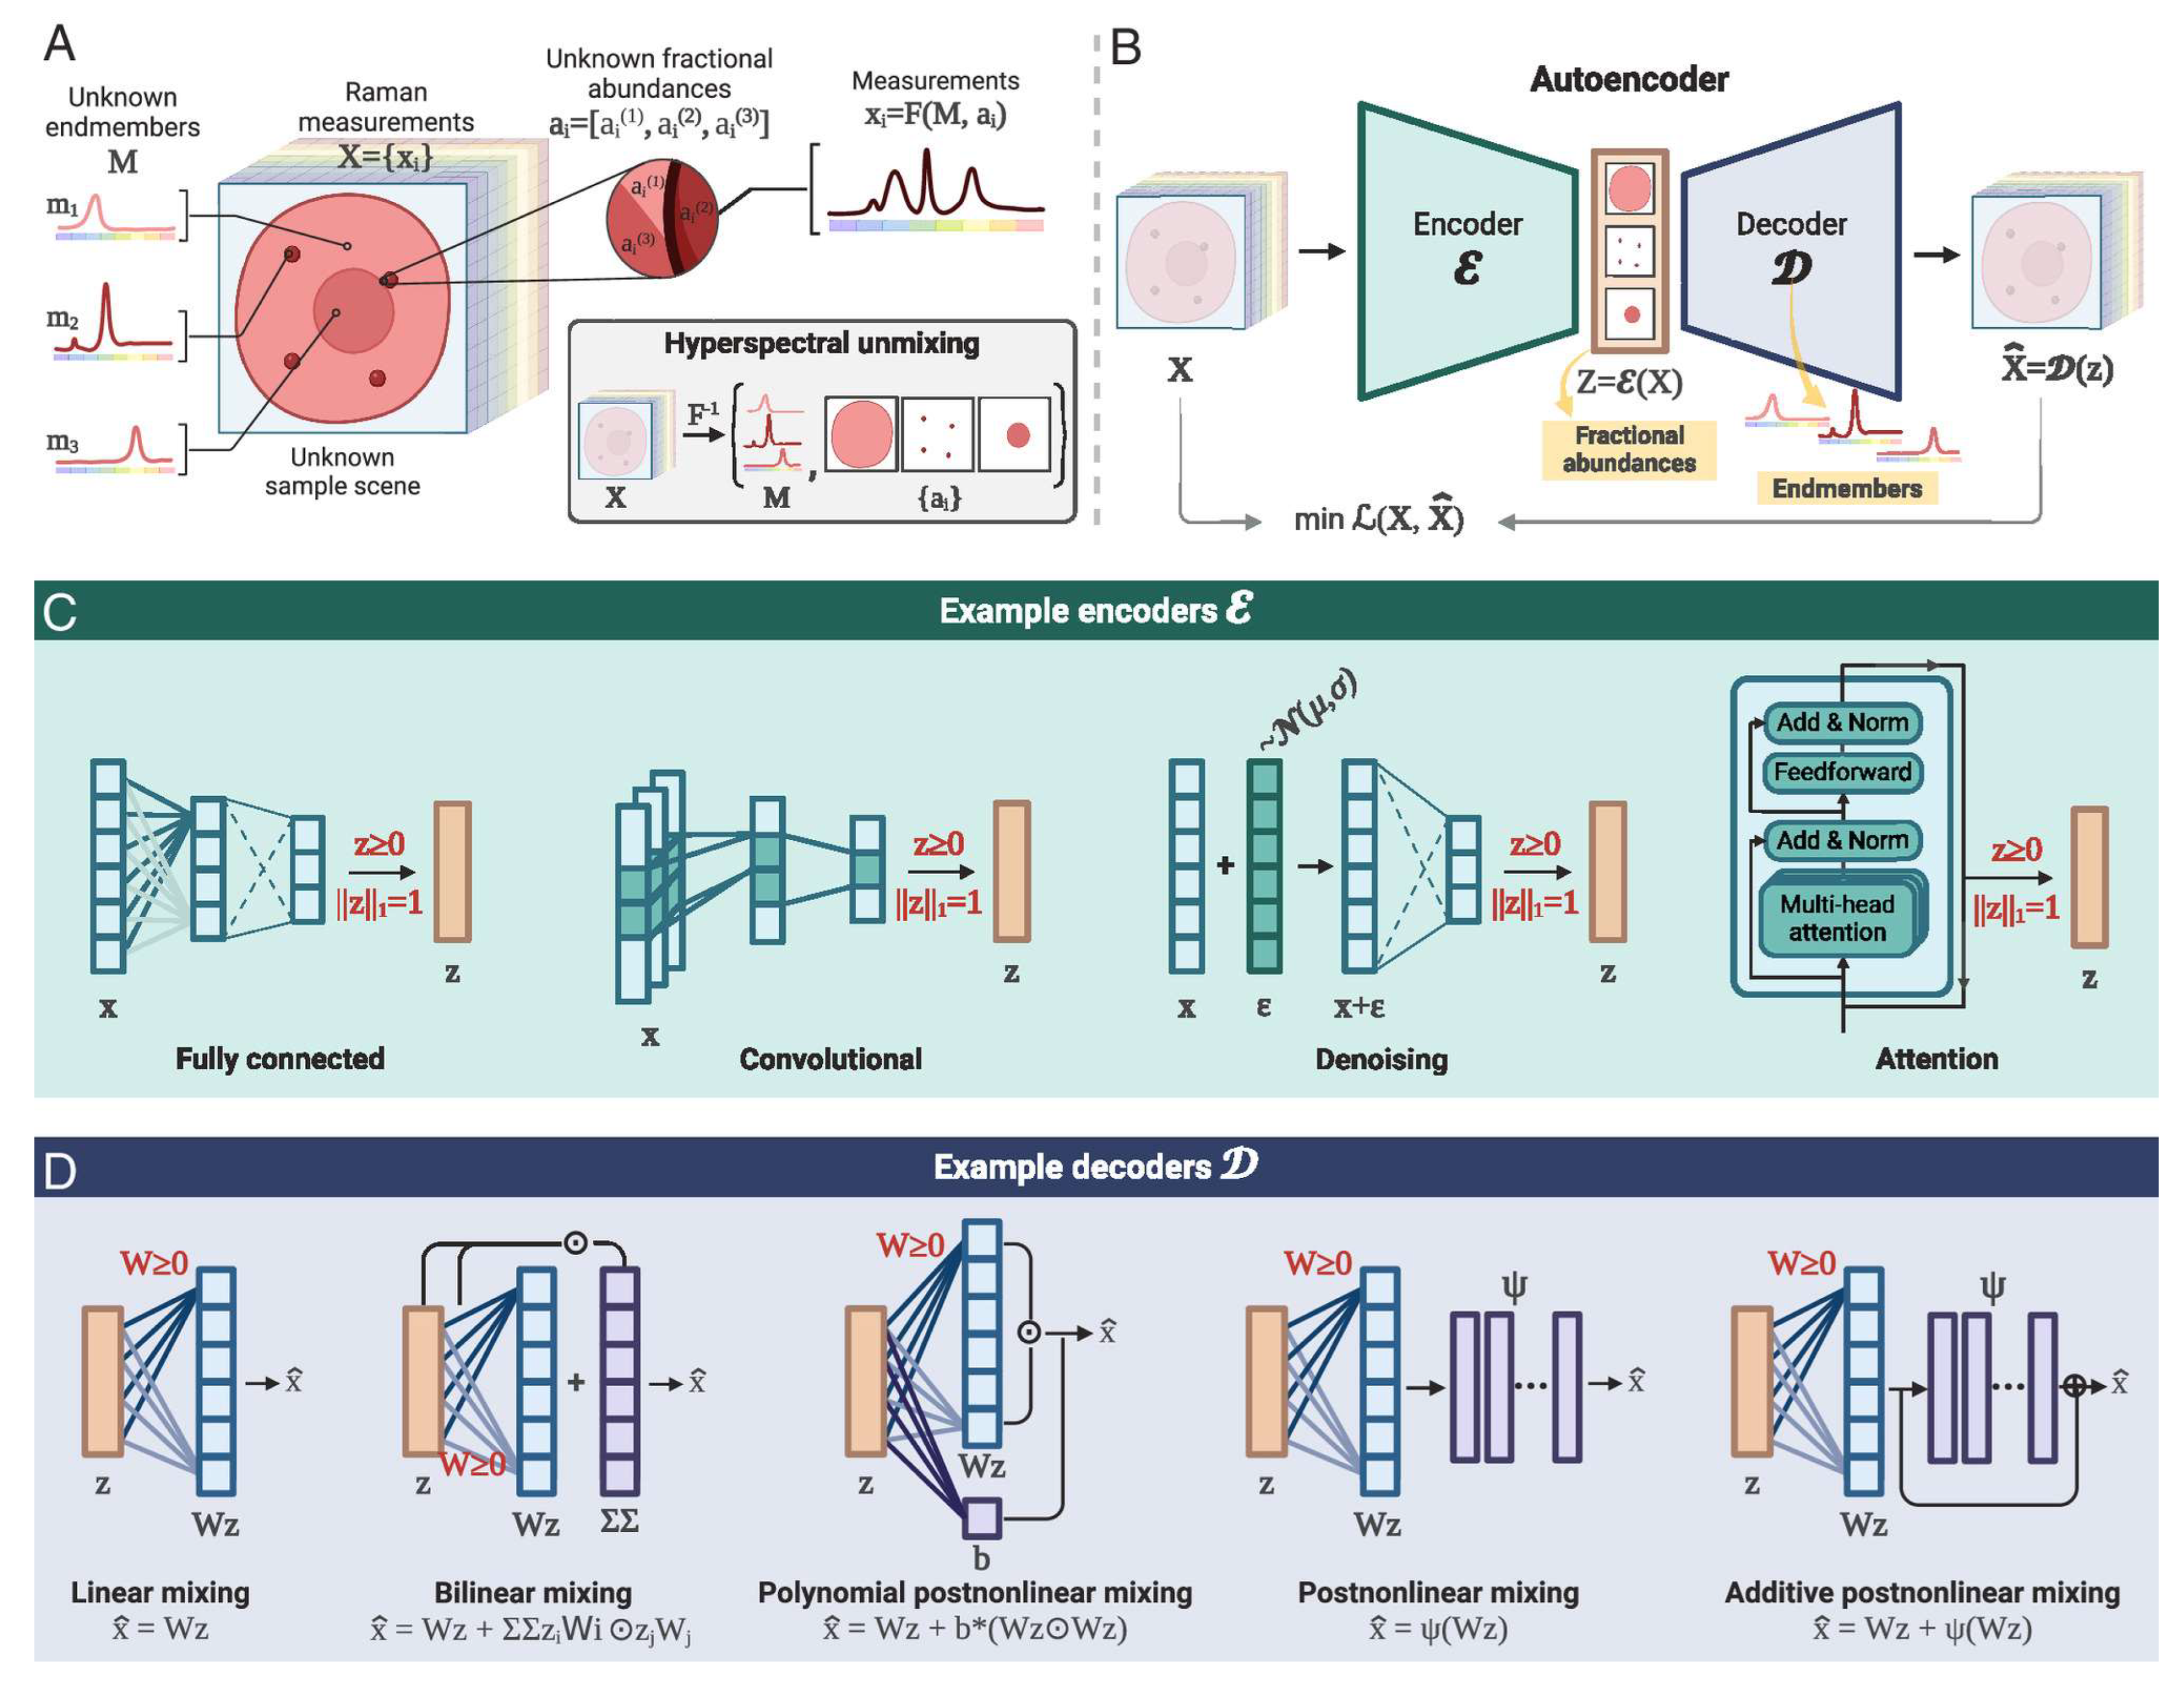
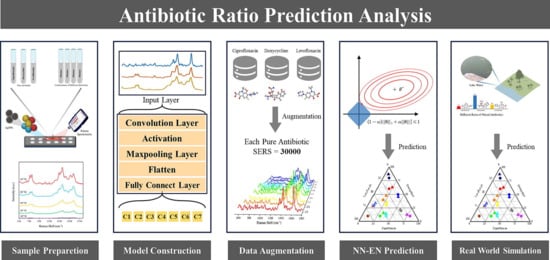
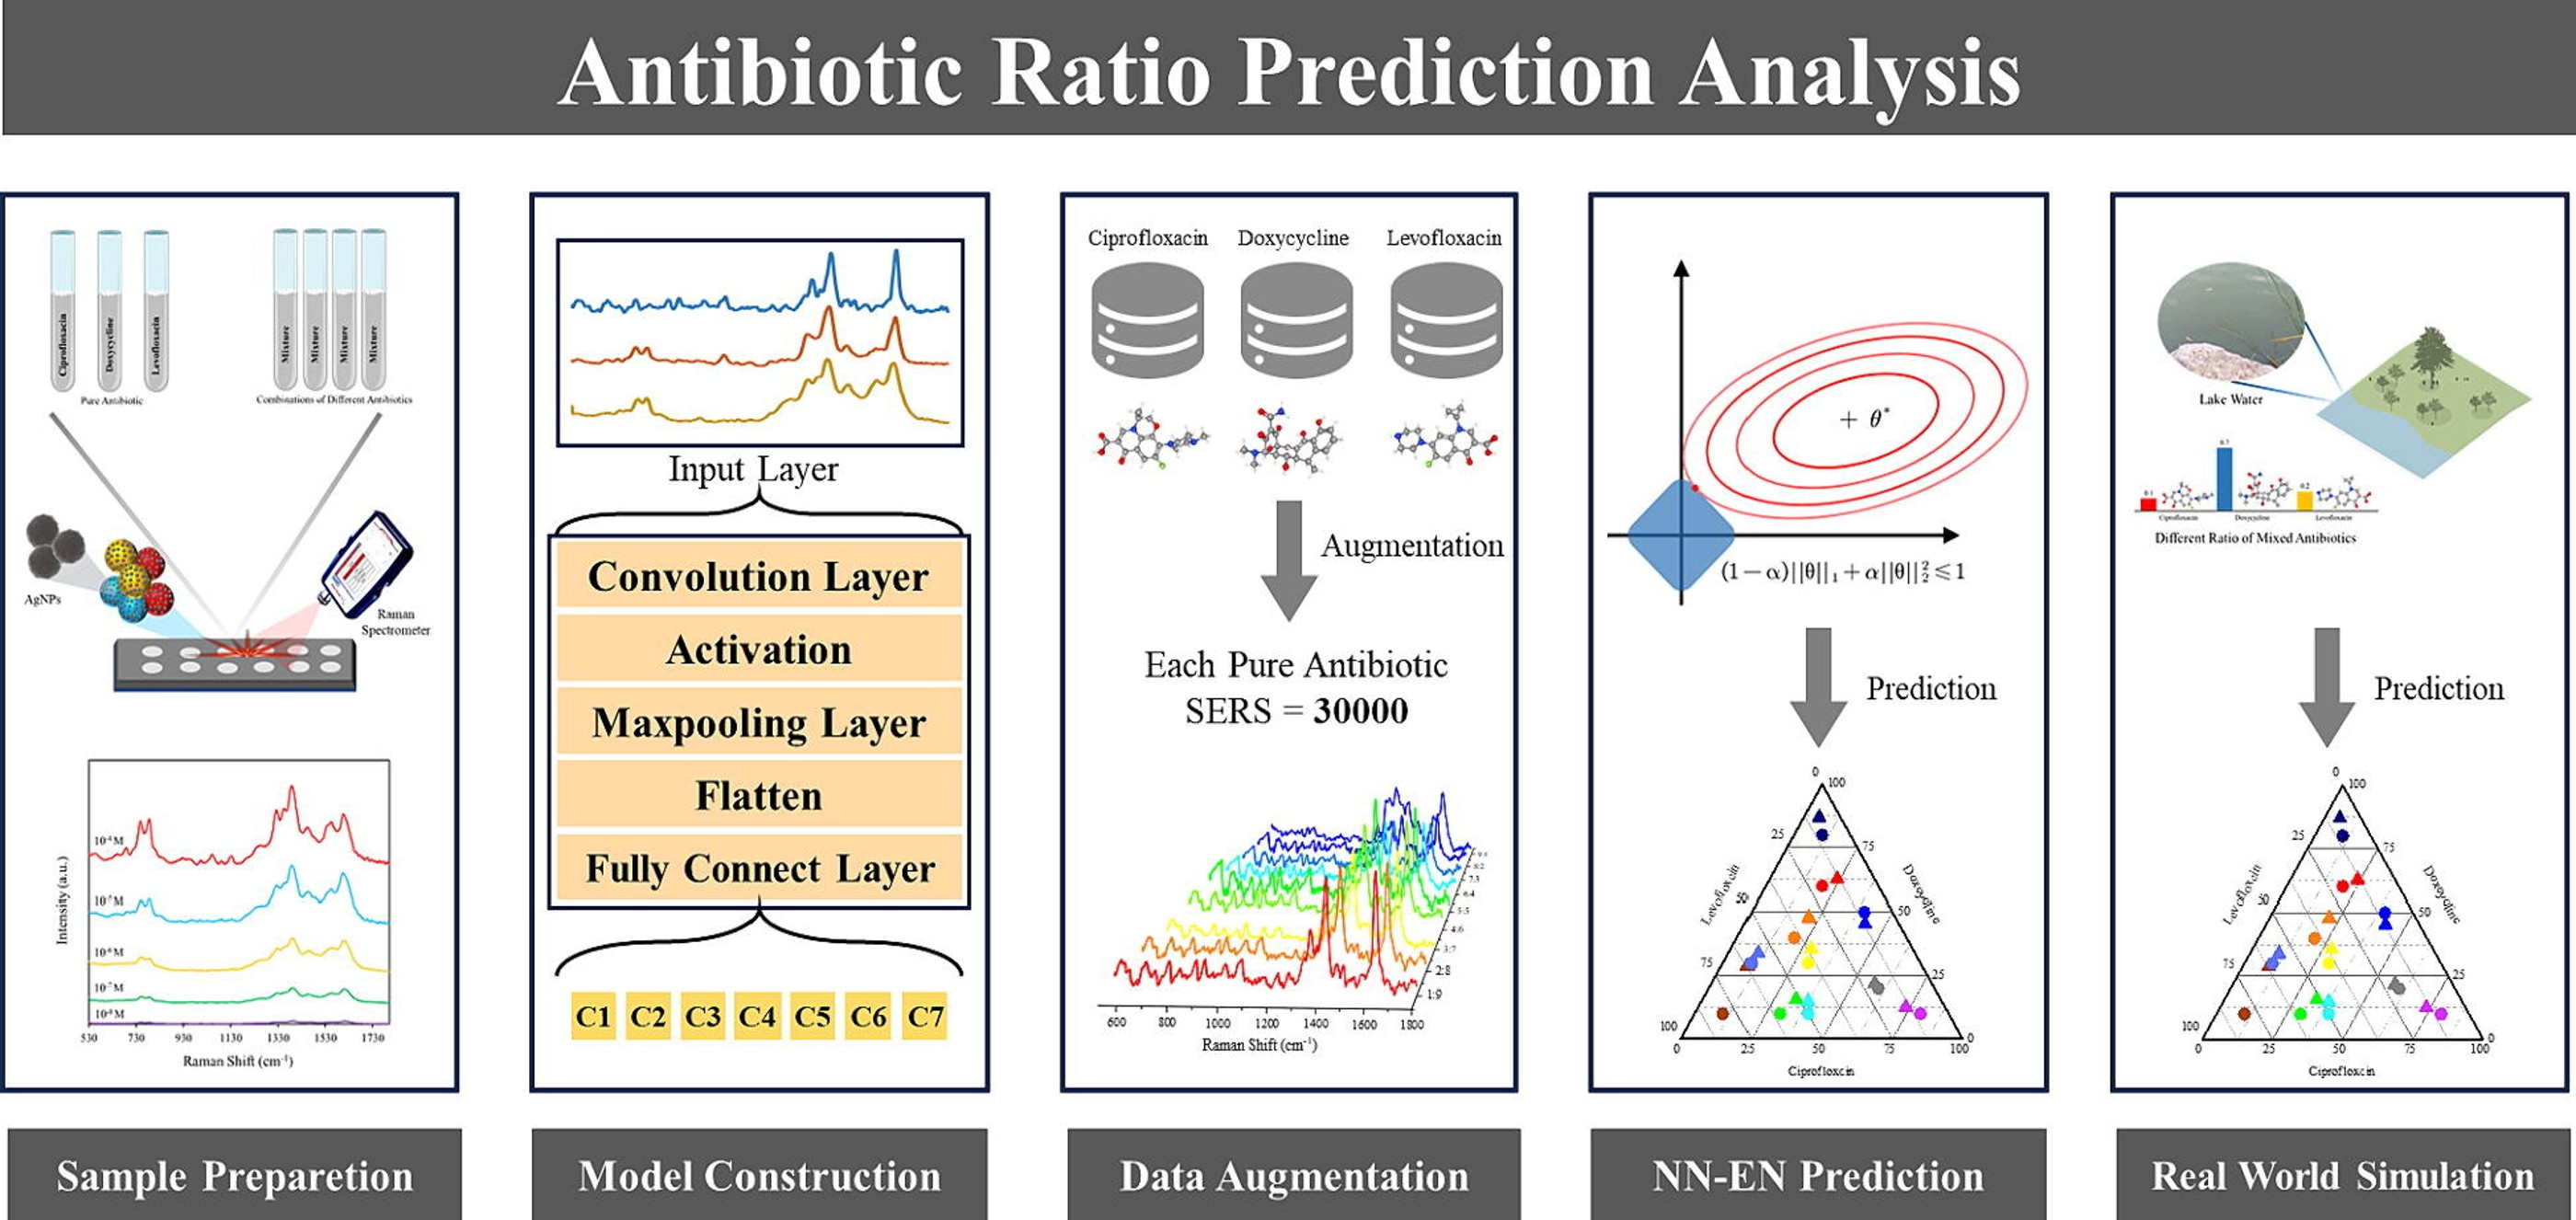
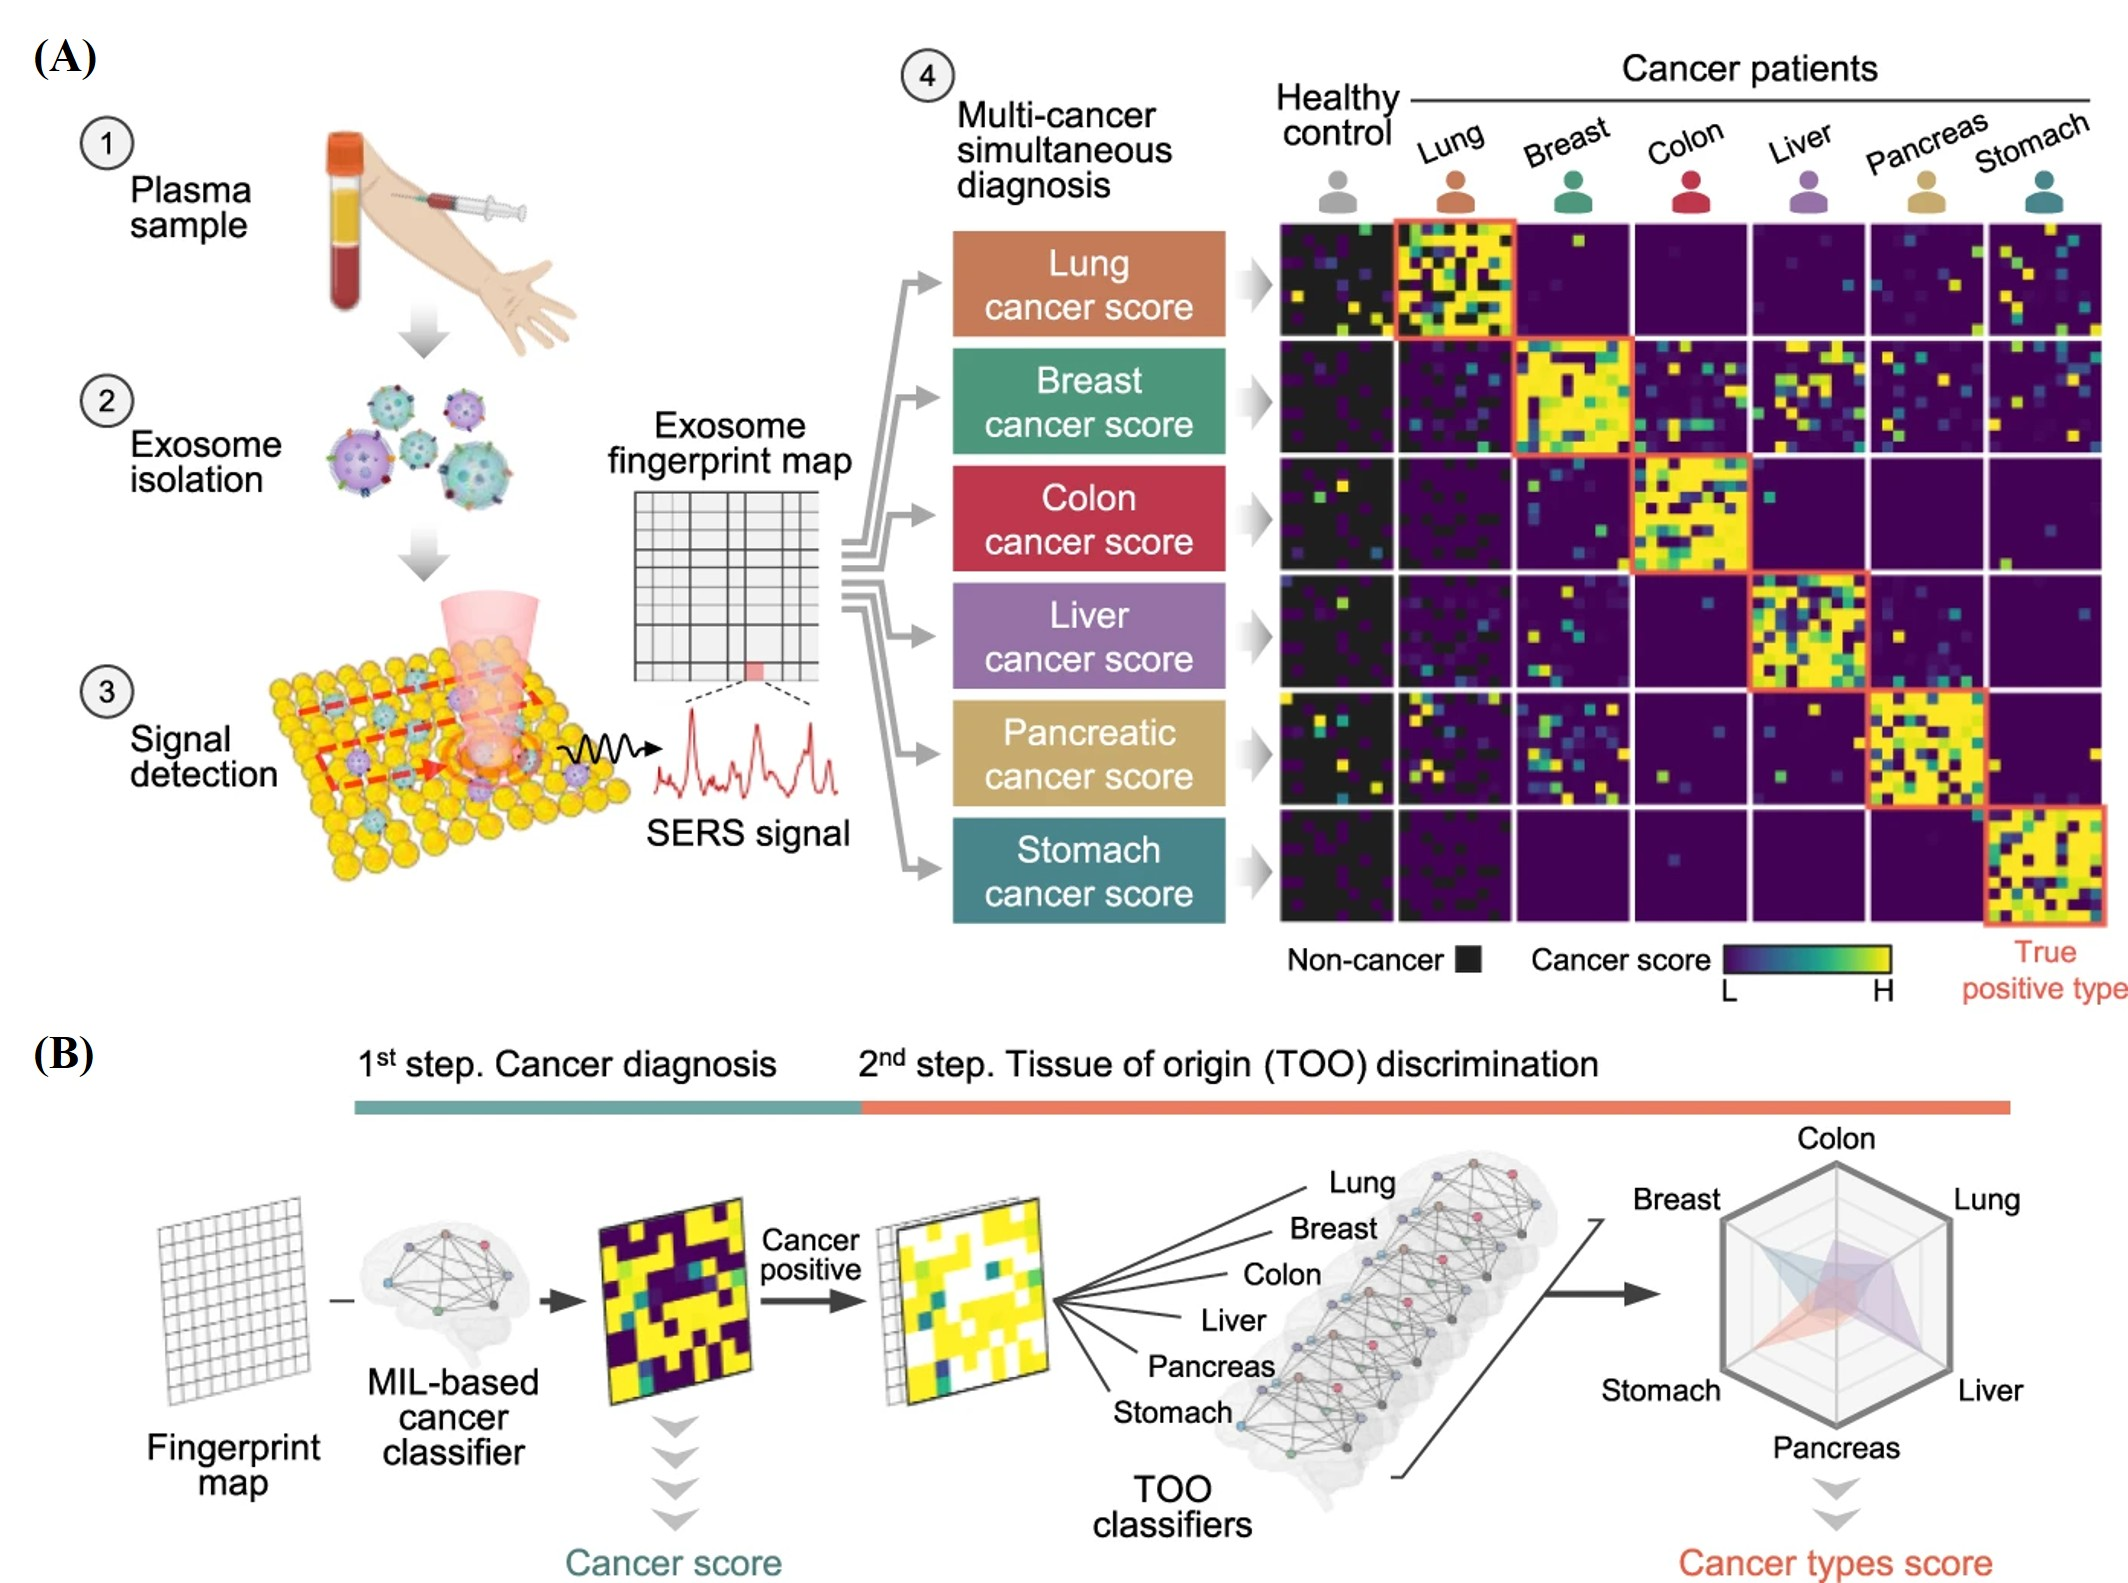

Disclaimer/Publisher’s Note: The statements, opinions and data contained in all publications are solely those of the individual author(s) and contributor(s) and not of MDPI and/or the editor(s). MDPI and/or the editor(s) disclaim responsibility for any injury to people or property resulting from any ideas, methods, instructions or products referred to in the content. |
© 2026 by the authors. Licensee MDPI, Basel, Switzerland. This article is an open access article distributed under the terms and conditions of the Creative Commons Attribution (CC BY) license.