Abstract
The outbreak of the new coronavirus (SARS-CoV-2) infection has become a global public health crisis. Antigen detection strips (colloidal gold) can be widely used in novel coronavirus clinical screening and can even be extended to home self-testing, which provides a practical and effective way for people to obtain health status information away from the crowd. In this paper, a colloidal gold detection system without complex devices is proposed, which is based on smartphone usage along with a mobile-phone software embedded with normalization algorithms and a special designed background paper. The basic principle of the device relies on image processing. First, the data of the green channel of the image captured by a smartphone are selected to be processed. Second, the calibration curves are established using standard black and white card, and the calibration values under different detection environments are obtained by calibration curves. Finally, to verify the validity of the proposed method, various standard solutions with different concentrations are tested. Results show that this method can eliminate the influence of different environments on the test results, the test results in different detection environments have good stability and the variation coefficients are less than 5%. It fully proves that the detection system designed in this paper can detect the result of colloidal gold immunochromatographic strip in time, conveniently and accurately in different environments.
1. Introduction
Point-of-care testing (POCT) is defined as medical diagnostic testing at or near the point of care, which has become a major challenge in the 21st century [1,2]. Antigen detection strip (colloidal gold) can be widely used in novel coronavirus clinical screening and can even be extended to home self-testing [3]. With the rapid development of colloidal gold technology, biomaterials science, and clinical medicine, combined with the technical advantages of various fields, researchers have made significant progress in the field of disease detection and prevention [4,5,6]. Additionally, among many methods, optical detection performs well in POCT, because it can simply provide high-resolution microscopic and macroscopic information in a short time [7,8]. Fluoresence and chemiluminescence are two of the most common optical detection techniques, but they usually require fluoresence, confocal microscopy, or high-sensitivity optical sensors [9]. Other traditional detection methods such as chemiluminescent immunoassy, enzyme-linked immunosorbent assay, and electro-chemiluminescence immunoassay require specialized equipment and professional personnel, making them unsuitable for POCT. Therefore, it is necessary for a cheap, simple, and convenient optical detection method to be developed.
In the past ten years, with the increasing popularity of intelligent electronic products in people’s lives, smartphones have developed rapidly, and their computing power has been continuously improved. This popularity is crucial in providing an opportunity for its application in portable detection [10,11]. In smartphones, optical technology combined with colloidal gold technology can be used to detect a variety of analytes. Ana I. Barbosa et al. introduced a new power-free, flexible, smartphone-based, prostate-specific antigen detection system that can provide reliable measurements for prostate cancer screening and detection in remote areas outside laboratory facilities [12]. Vinoth Kumar Rajendran et al. developed an immunochromatographic test paper based on the fluorescence reading of a smartphone for the detection of foodborne pathogenic bacteria salmonella and Escherichia coli O157 [13]. Wei Xiao et al. designed a smartphone-based reader and used a 3D printer to quantitatively assess AuNPs-LFIS [14]. The basic principle of the devise was relying on a smartphone’s ambient light sensor (SPALS). The result showed good consistency with the results of conventional image analysis approaches, and compared with the traditional analysis method, the developed AuNPs-LFIS reader is easier operated, lower cost, and more portable. However, these detection systems still need a specific lighting environment and auxiliary devices or complicated operation. The design and manufacture of auxiliary devices remain expensive and challenging. In the device design and manufacture, the main concern of users is that devices should be easy to operate, comfortable to carry, and require no professional personnel to operate [15,16], but these aspects are not included enough, which often contradicts the manufacturing cost [17]. However, now, smartphones can collect images in real time and use applications to analyze and process data. Therefore, the use of a smartphone itself as a detection and analysis instrument can significantly reduce the cost of detection technology, decrease detection time, and broaden the detection field.
In this paper, we have developed a method based on smartphone to the measure the solution concentration; the lamotrigine is taken as an example. The proposed detection system is composed of a gold immuno-chromatographic strip (GICS) [18] or antigen–antibody reaction, a background detection paper, and a smartphone for capturing images. The principle behind this method is as follows: (1) capture images of colloidal gold with the smartphone camera. (2) Segment the image and identify each area of the detection system. (3) Process the green channel of the collected area. (4) Establish the calibration curves by using standard black and white card and obtain the calibration values of T-line under different detection environments by calibration curves. (5) Obtain the different concentrations of solutions by the fitting curve between the calibration values of T-line and the standard concentration solution.
2. Methods
2.1. Detection Principle and Structure of GICS
In a typical GICS, gold-labeled colloidal antibodies are fixed on the conjugate pad before detection, which can be washed away in any buffer solution. The antigen for the specific colloidal gold-labeled antibody is fixed on the testing line (T-line), while the antibody for the labeled binding antibody is fixed on the control line (C-line). If the sample solution without antigen is added to the detection area, the labeled gold antibody conjugate reacts specifically with the antigen on the T-line, and fixes the colloidal gold conjugate, finally forms a red band on the T-line. Additionally, if the sample solution contains antigen, the color intensity of the T-line decreases with the increase in the target concentration in the sample. The color intensity of the T-line, which is inversely related to the amount of solution concentration, allowed us to quantify the amount of target substance in the sample, and its concentration can be determined by the strength of the T-line [19]. The signal of the C-line was used to assess the validity of the assay. Figure 1 shows a schematic of the GICS.
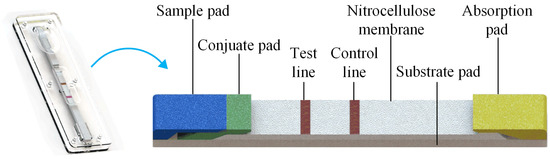
Figure 1.
Schematic of the GICS; if the sample solution contains antigen, the antigen epitopes on the gold-labeled antibody will compete with the target and the antigen on the T-line. The color intensity of the T-line decreases with the increase in the target concentration in the sample. Free colloidal gold conjugates react specifically with C-line antibodies and form red bands at C-line, while buffer or excess solution is absorbed by the absorption pad.
2.2. Absorption Characteristics of Colloidal Gold
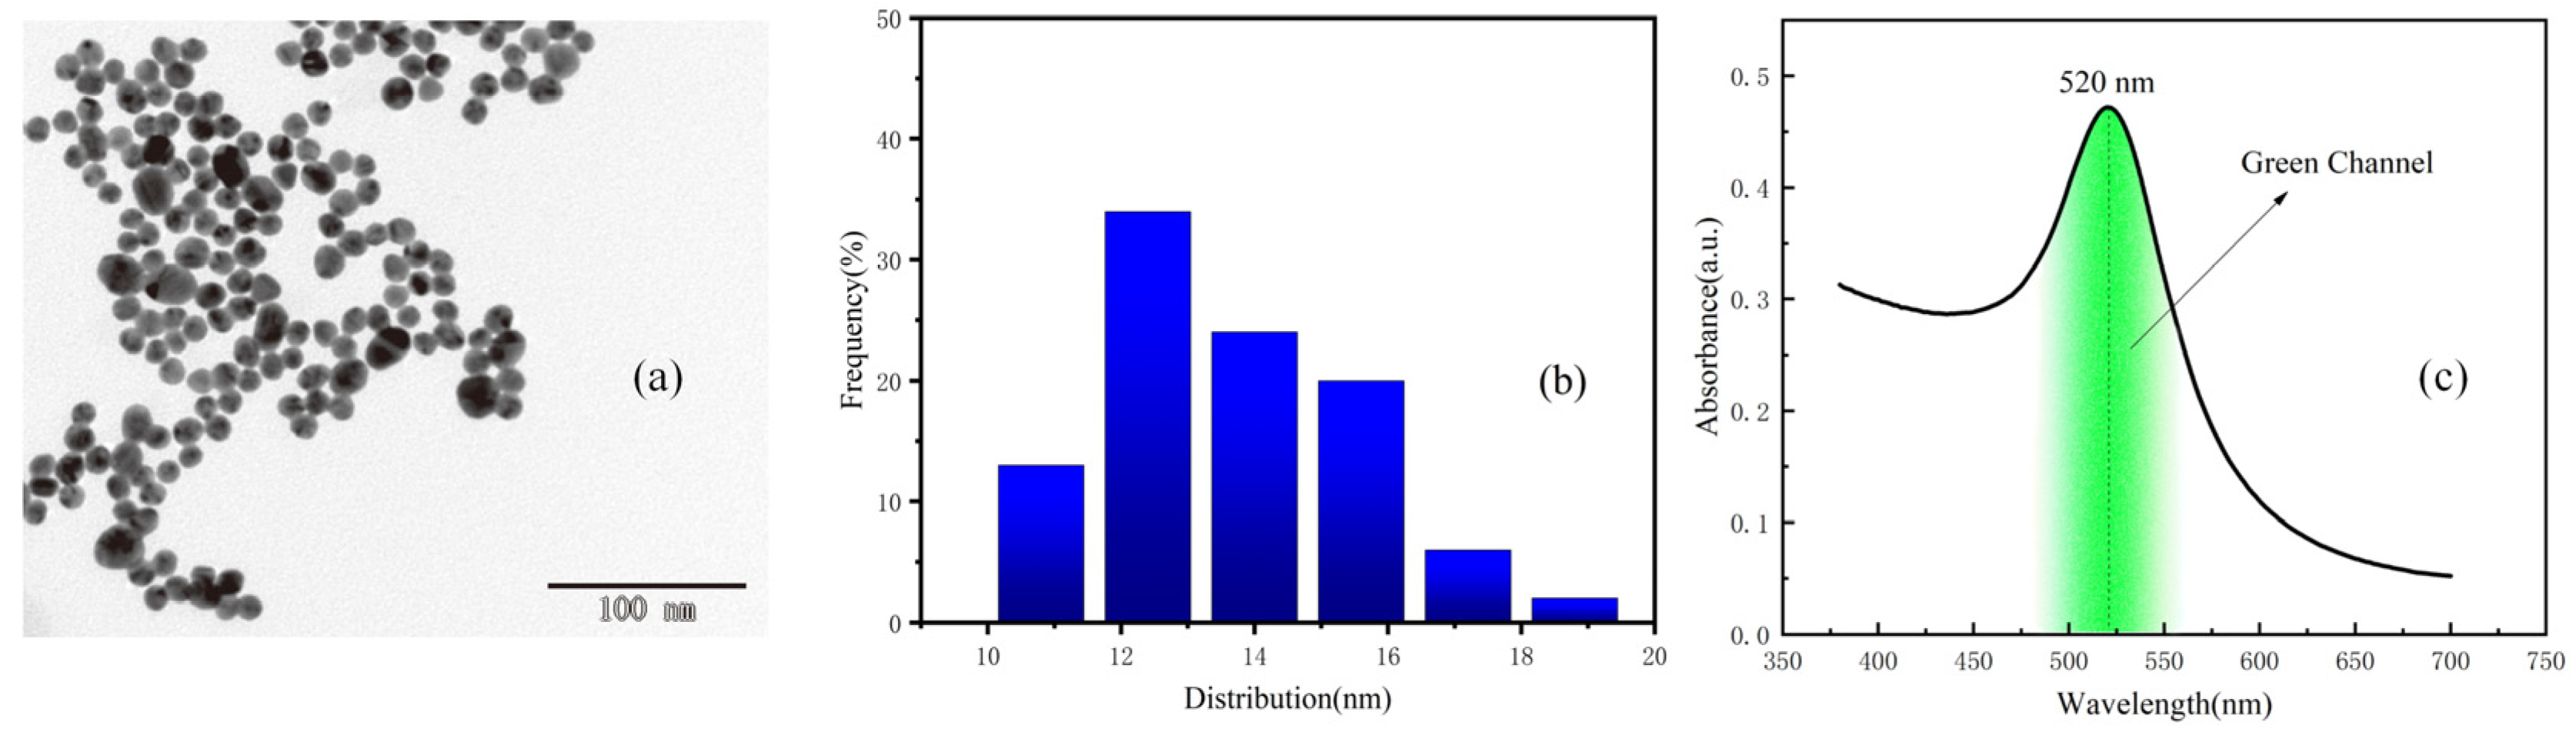
According to transmission electron microscope (TEM) (Figure 2a) readings and the size distribution diagram (Figure 2b), the size distribution of colloidal gold in the sample solution is roughly uniform, ranging from 10 nm to 20 nm. Within this range, the color of colloidal gold solution is purple-red, as the solution most widely appeared. Colloidal gold has a single absorption peak in the visible range, with a wavelength ranging from 510 to 550 nm [20,21,22]. Colloidal gold selectively absorbs green light, and the absorption peak of colloidal gold selected in this experiment is 520 nm. The UV–visible absorption spectra of gold colloidal nano-particles are shown in Figure 2c. The green channel image was processed and analyzed in this paper.

Figure 2.
(a) TEM image of the colloidal gold sample solution. (b) Size distribution of the colloidal gold sample solution. (c) The UV–Visible absorption spectra of gold colloidal nanoparticles.
2.3. Environmental Compensation
The images captured by smartphones are significantly affected by environmental illumination intensity, cell phone sensors, different shooting backgrounds, and other factors [23]. To reduce the environmental interference, this paper presents an environmental compensation method based on gray reference chart. We designed a reference chart (gray value from 0–255) containing 11 gray regions with known gray values and compensated for ambient light difference in the subsequent data processing. In this paper, it is referred to as standard grayscale card. A green channel mapping algorithm was built, and the measurement intensity L1 under arbitrary ambient light was converted to L2 under a standard environment by using a mapping algorithm. We will illustrate later that the 11-region reference chart is sufficient to build a conversion curve to eliminate differences in ambient light.
The reflectivity of objects is invariable in different detection environments. Thus, when the external environment changes, the reflectivity of T-line is invariable. The standard grayscale card and the reagent strip is exactly under the same external environment. A corresponding relationship is observed between the reflectivity of the reagent strip T-line and C-line and the reflectivity of the standard grayscale card (the gray value of the standard grayscale card). Consequently, the theoretical gray value of T-line and C-line can be obtained according to the corresponding relationship between the actual gray value of the standard grayscale card and the theoretical gray value. The standard grayscale card is used in view of the reflectivity of objects is invariable in different environments. In different environments, the standard gray value is fitted with the actual gray value. The fitting curve shows good fitting and linearity. Thus, the standard gray scale card is replaced by the standard black and white card.
2.4. The Procedure of Detection
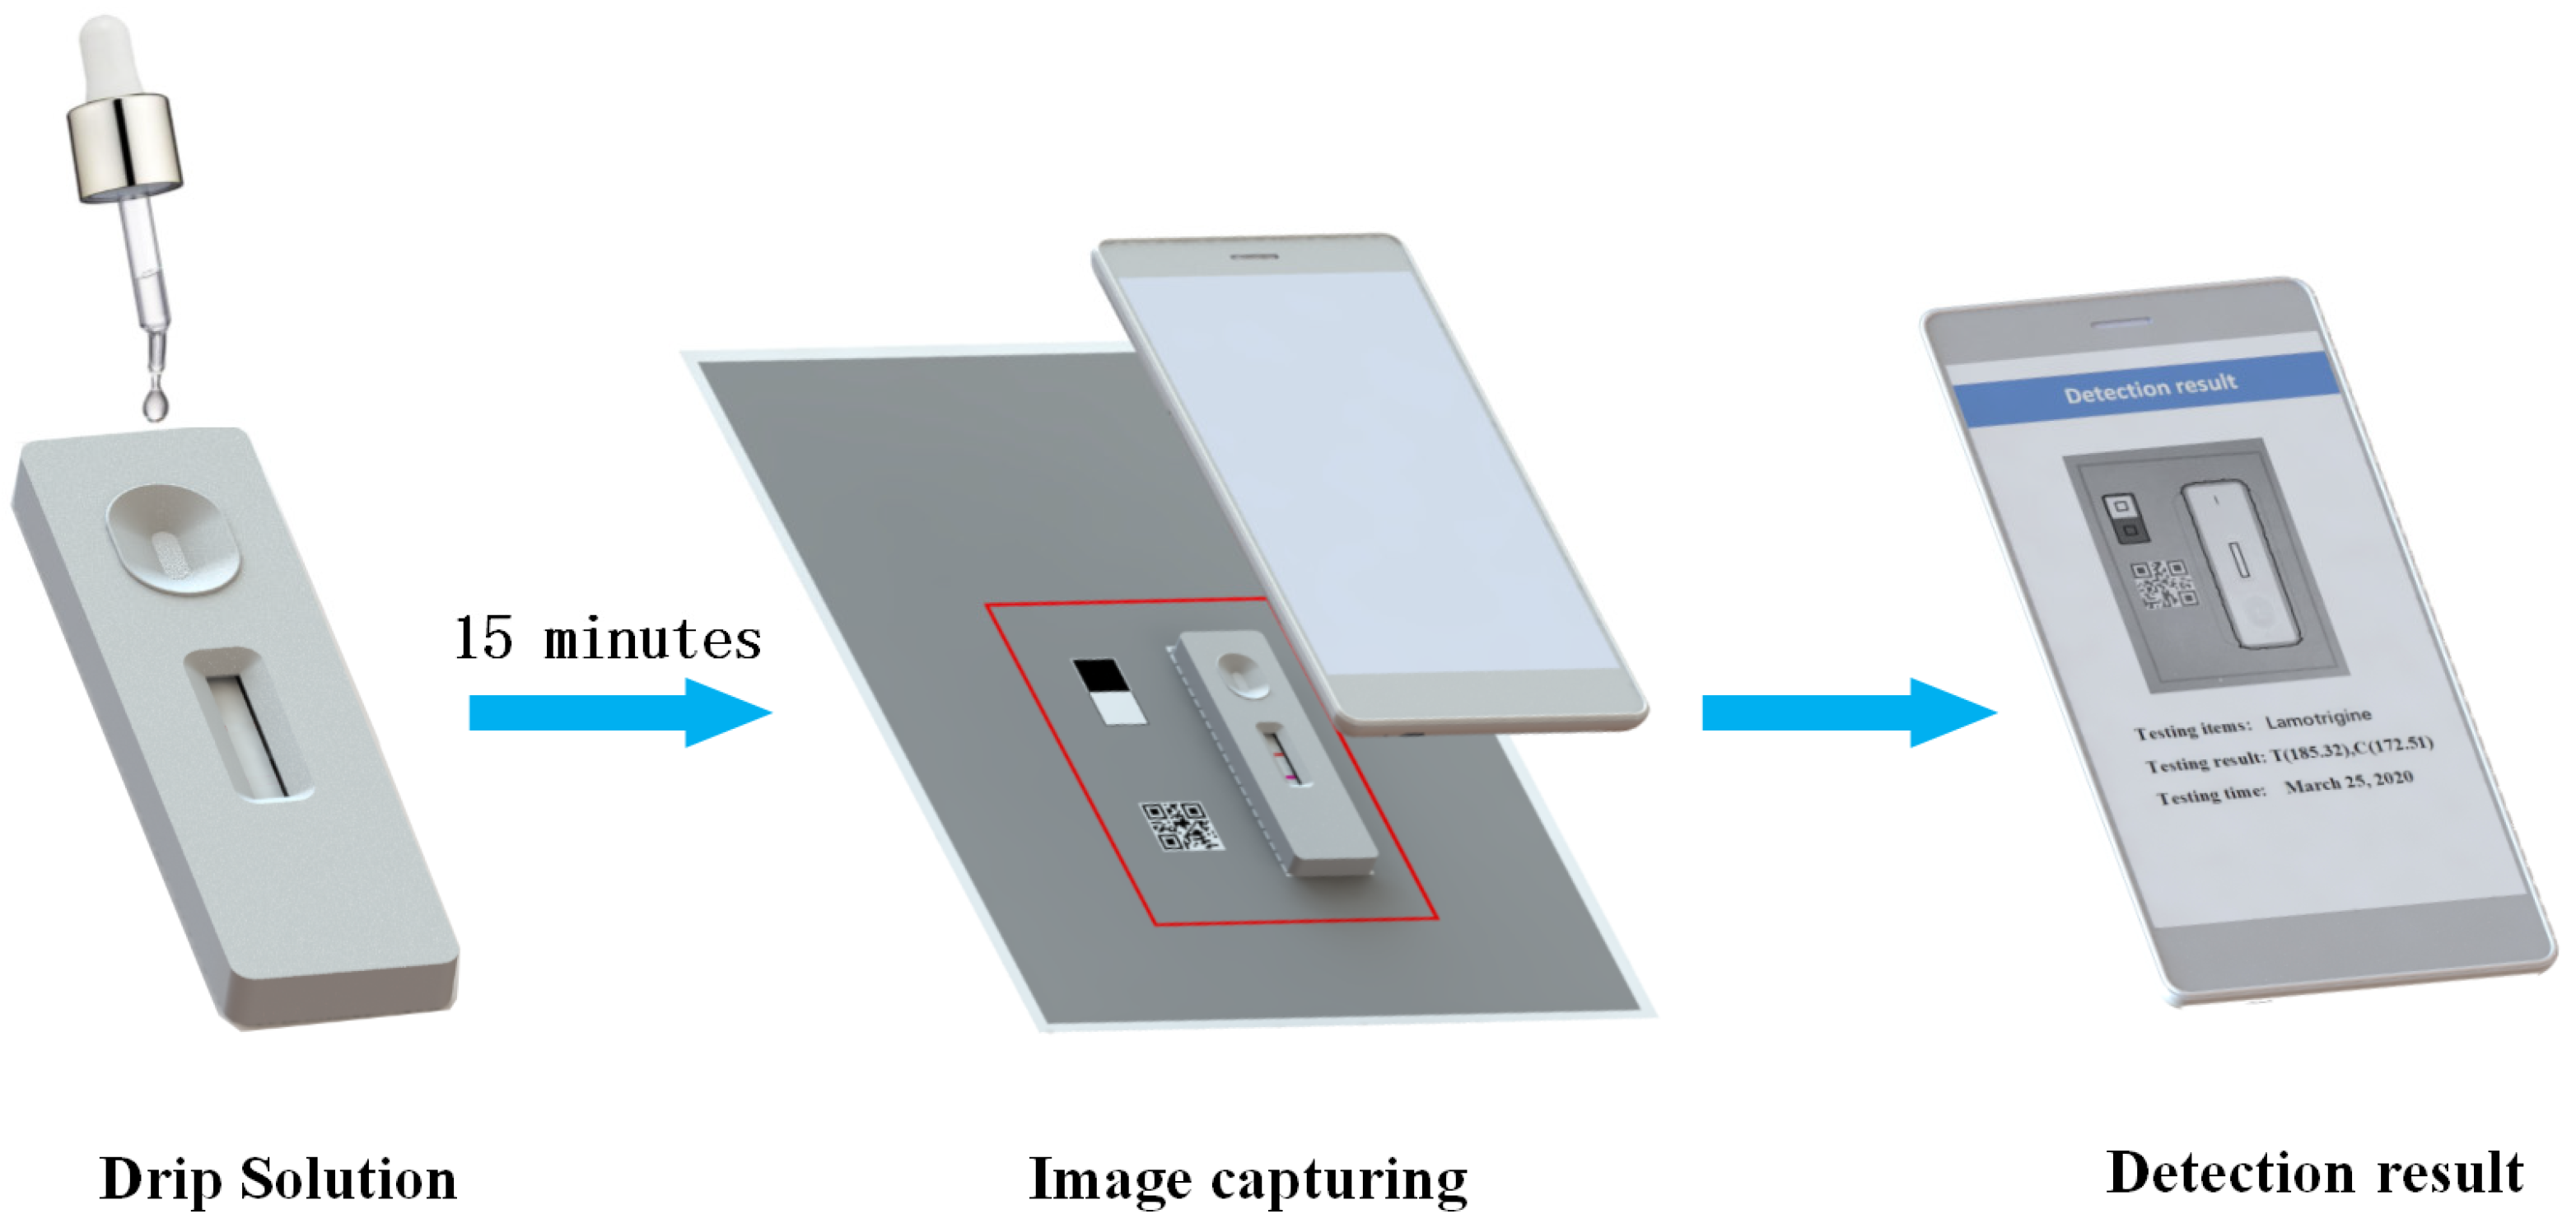
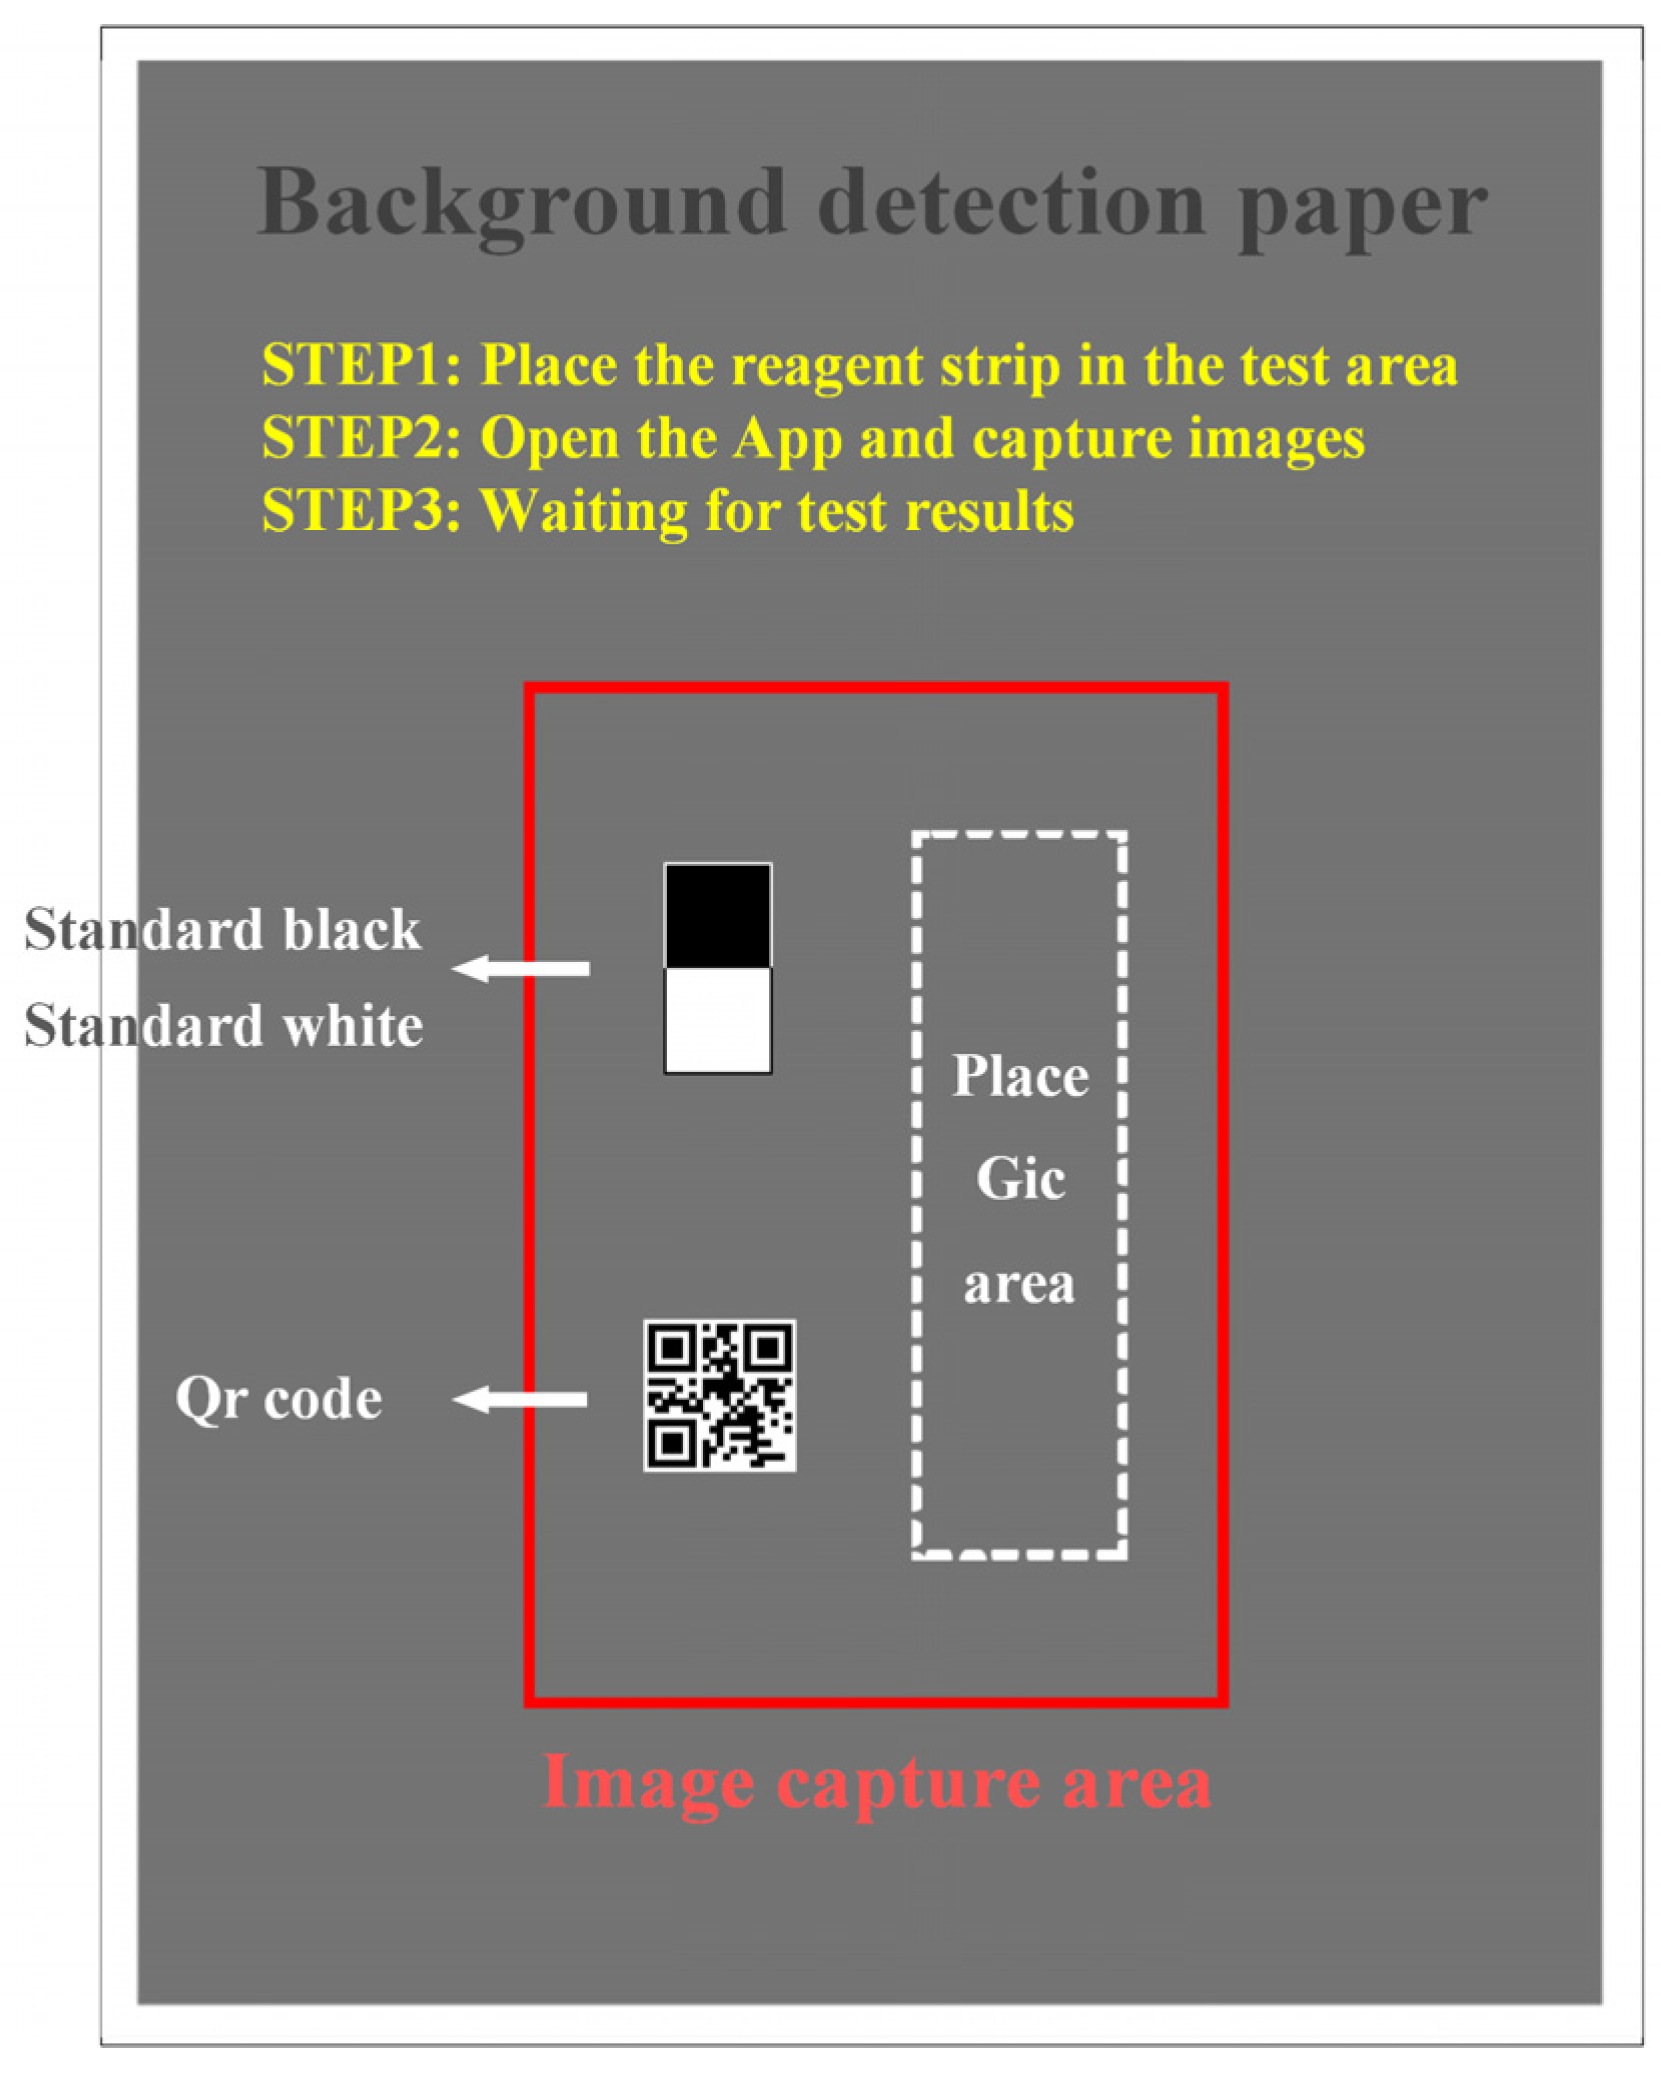
In short, the testing process is as follows. First, drip standard solution of a known concentration on the sample pad of the GICS. After about 15 min, put the GICS right on the placing area. Second, open the application, click the detection button, and enter the detection scanning interface. Next, align the detection frame on the screen with the detection area on the background detection paper; after reaching a certain resolution, the software will automatically open the camera and capture the image, and then the image will procced by application and produce a detection result. Figure 3 shows the procedure of detection.
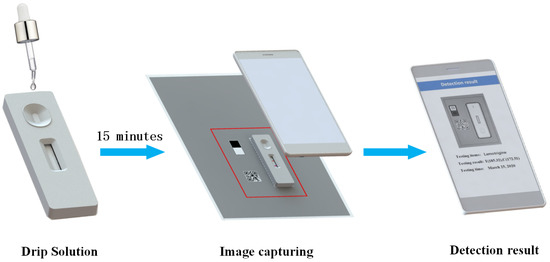
Figure 3.
The procedure of detection.
2.5. Detection Algorithm
The application program analyzes the captured pictures and processes the algorithm to obtain the detection results. In short, the algorithm flow is as follows: (1) the green channel of the captured image is processed. (2) The image is divided into 3 areas with OpenCV algorithm, including black and white card, sample pad, and detection result area, which contains 2 lines. The one near the sample pad is identified as T-line, yet the other is identified as C-line. (3) The gray value of standard black and white card, T-line, and C-line are calculated. (4) The calibration curve is established using standard black and white card, and the calibration values of T-line under different detection environments is obtained by calibration curves.
2.6. Other Influencing Factors
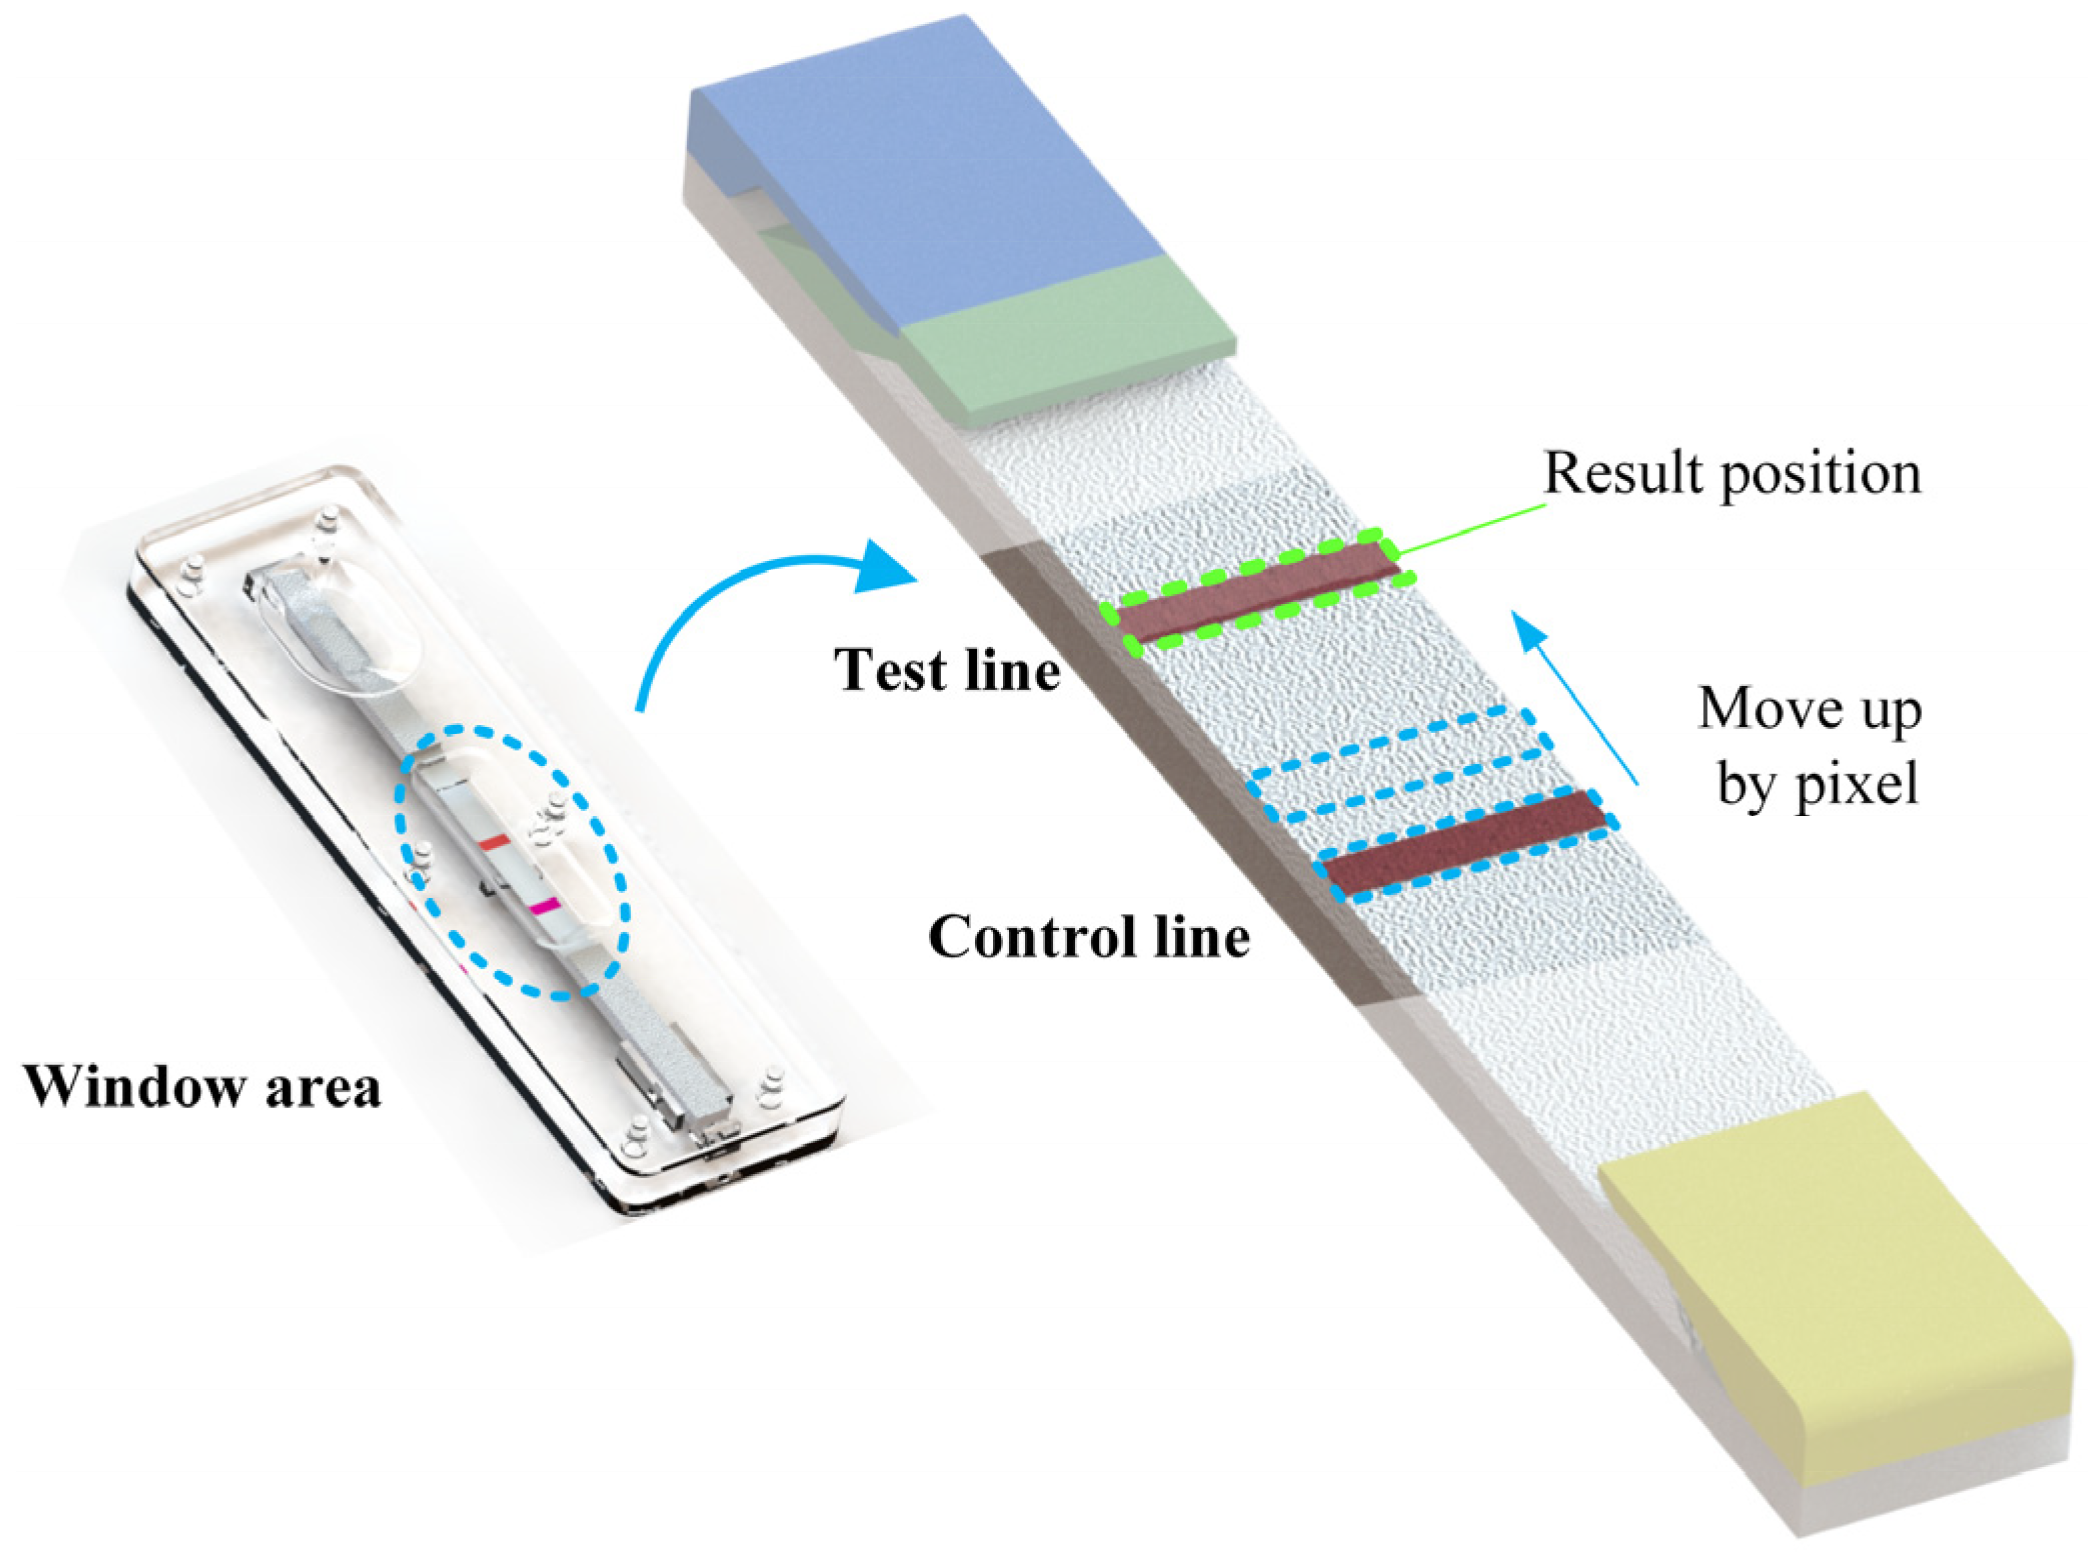
As the resolution of each image is uncertain, the boundary line obtained by binary edge processing often fails to clearly segment the transition area. In order to increase the accuracy of the image processing algorithm, the edge of the standard black and white card was removed; only the central area of the image was retained. In addition, unlike C-line, the effective area of T-line is relatively blurred in the actual captured image, as shown in Figure 4. In order to solve this problem, after separating the window area, first, determine the width of the C-line area, keep the width, and move the area to the top pixel by pixel. Calculate the sum of the gray values of the area each time, and finally, determine the area with the smallest gray value as the T-line area.

Figure 4.
Quantification of T-line width; in the algorithm, the effective width of T-line is determined by the width of C-line of the current image.
3. Materials
3.1. Background Detection Paper
Figure 5 shows the background detection paper. It is used to assist the smartphone in calibrating the image and is specifically used to achieve four functions: (1) it is used to place GICS. (2) It provides the image capture area to make sure that the position of the smartphone is relatively stable with the background detection paper. (3) Standard white and black card is placed to reduce the interference of external environment on detection, which will be discussed later. (4) It ensures that the gray value of the detection background is consistent to guarantee a reasonable exposure time for the smartphone when collecting images, which also avoid a very short or a very long exposure time.

Figure 5.
The background detection paper; it consists of a consistent grayscale background color, a red image capture area, standard black and white card, and an area to place GICS.
3.2. Apparatus and Reagents
Considering the demand of the experiment, the pixels of the back camera of the chosen smartphones should not be too low; almost all the smartphones manufactured after 2017 were able to meet the requirements. In addition, different manufacturers own different image processing algorithm, which will affect the image, so three of the most widely used smartphones of different brands in China were selected. The smartphones that were used in the experiments were Huawei Honor 10 (Huawei Technologies Co., Ltd., Shenzhen, China), Vivo Y71 (Vivo Co., Ltd., Dongguan, China), and Xiaomi Mi 8SE (Xiaomi Inc., Beijing, China). Standard lamotrigine solutions of different concentrations were provided by Biohit Healthcare (Hefei, China) Co., Ltd.
4. Results and Discussion
4.1. Performance of Green Channel
Section 2.1 shows that the colloidal gold solution appears purple-red. Additionally, the intensity of the color allowed us to quantify the amount of target substance. The color of the T-line is similar to the magenta in the CMYK color mode, that is, corresponding to the M channel. Considering that the C, M, and Y values in the CMYK color mode are complementary to the R, G, and B values in the RGB color mode, the G-channel of the image is correlated with the experimental results, and to confirm this, we carried out the following experiments.
First, we designed a series of different pictures in CMYK color mode. The C value of each picture was set to 10, the Y and K values were set to 0, the M intensity was set from 0, and each gradient was increased by 10 values, as shown in Table 1.

Table 1.
Designed M intensity from 0–100% and the corresponding pictures.
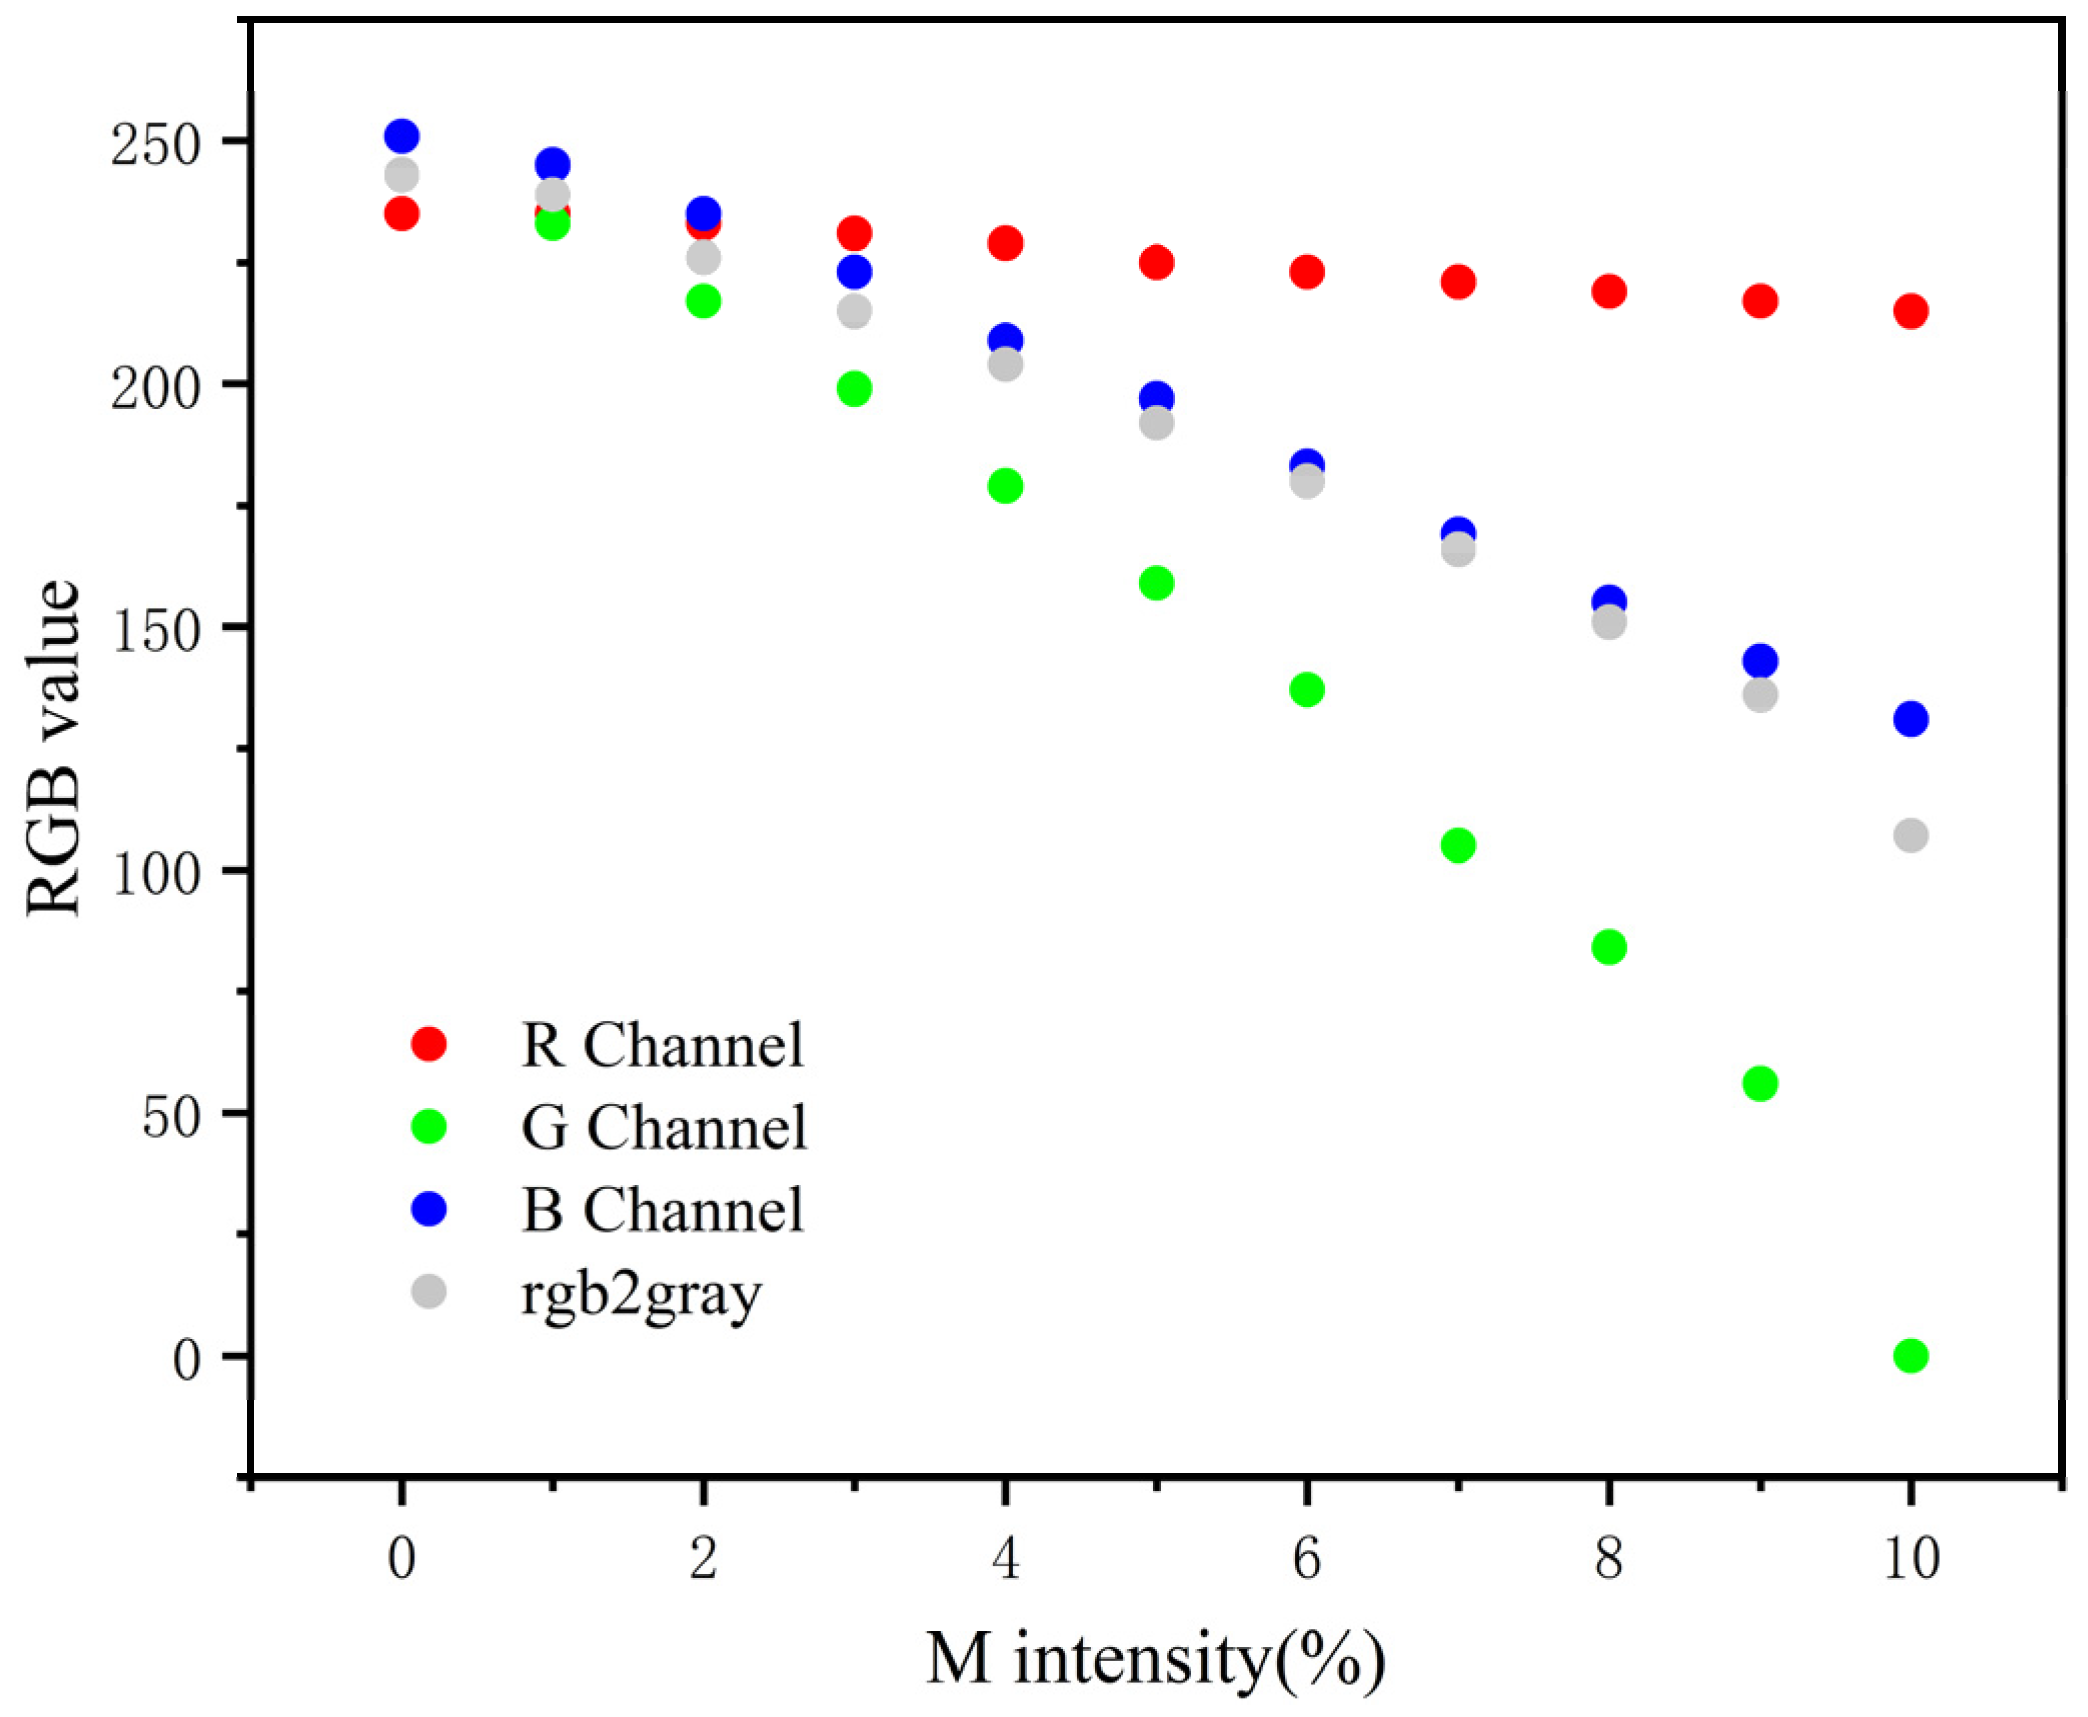
Then, we analyzed all pictures of Table 1 in RGB color mode using a computer image processing software. The R, G, B, and three-channel weighted average values in color mode are recorded in Figure 6. The data show that the G value has the most obvious change with the widest dynamic range. Thus, the G value is most suitable to reflect the color rendering degree of T-line.
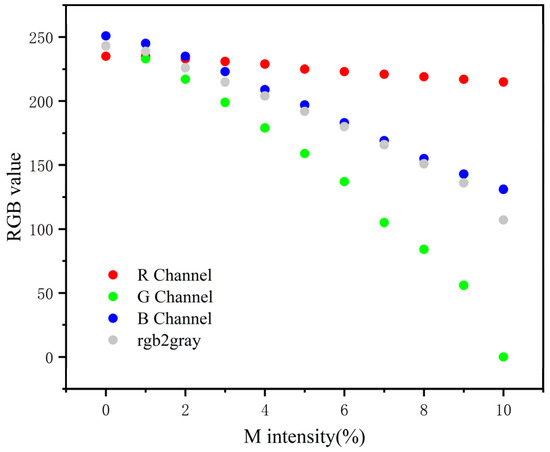
Figure 6.
The relationship of the R, G, and B values with the M intensity of each designed image. The data showed that with the increase in the M intensity, there is no significant change in the red channel, the blue channel declined steadily but not significantly, the change of the G value is the most obvious, and the dynamic range is the widest.
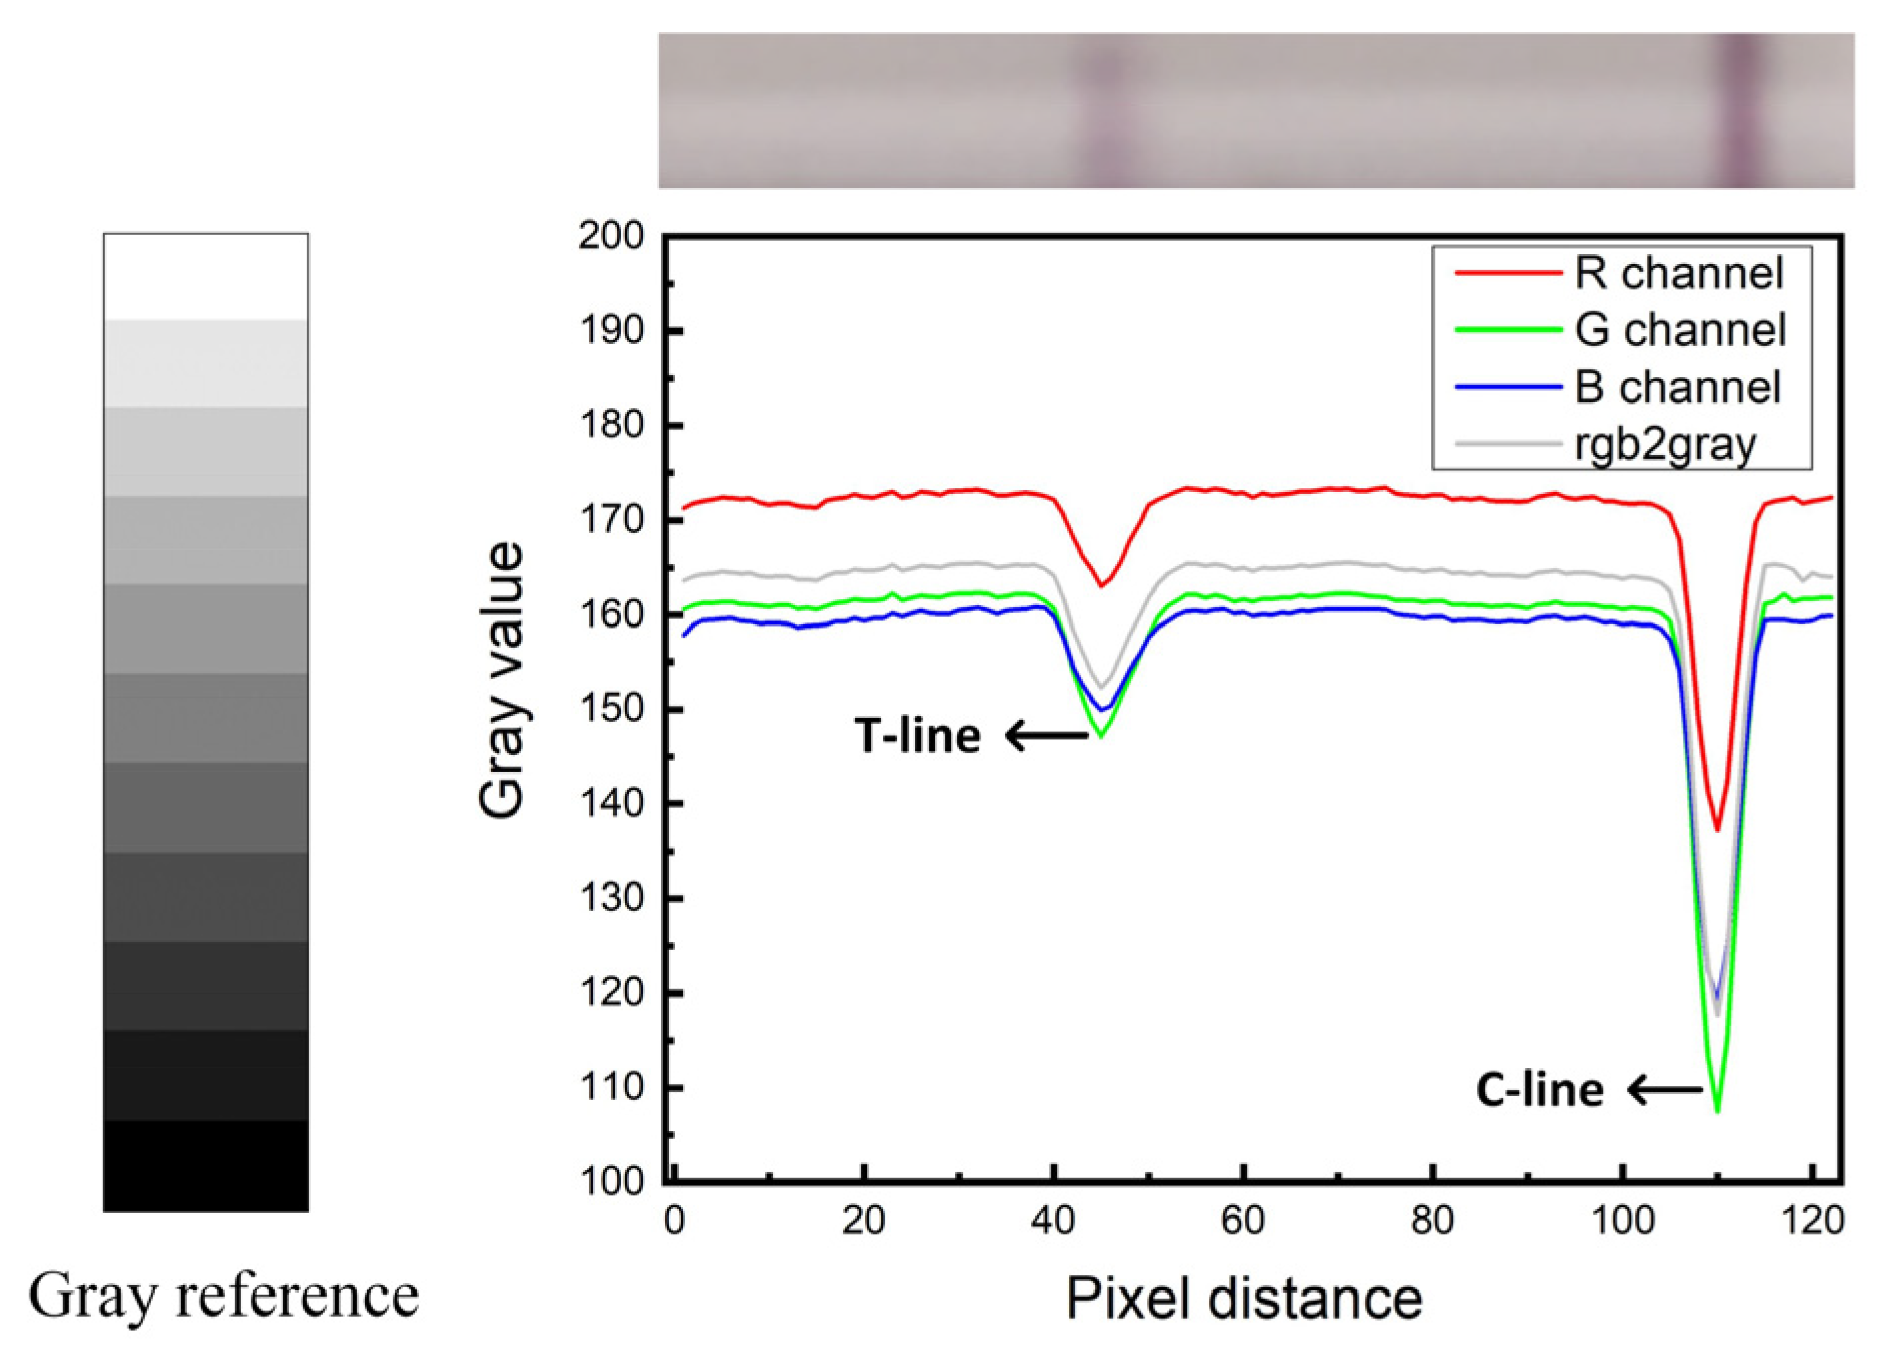
To further verify the superiority of the green channel, the color channels (R, G, and B) of T-line in GICS were compared and analyzed in this experiment. Figure 7 shows the comparison results. The results prove that green channel data can reflect the test results best. Therefore, green channel images were selected for data processing, the gray value data of green channel of the image can quantify the amount of target substance.
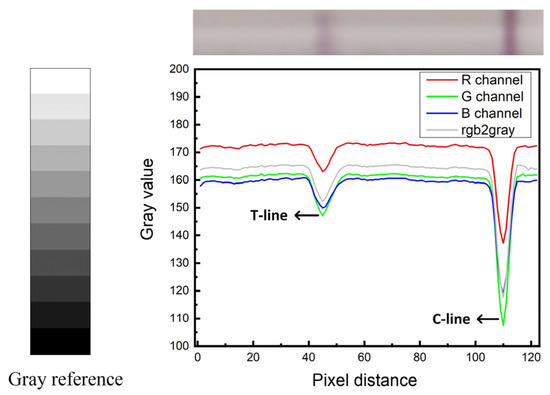
Figure 7.
Compare of R/G/B channel.
4.2. Performance of Luminance Compensation Method
To compensate for the environment, the grayscale card was placed on the background detection paper, which is composed of standard color blocks. In this paper, the standard grayscale card is divided into 11 gradients (gray value 0–255) and was analyzed in different environments. The reflectivity of each gradient of the grayscale cards was calculated, and curve fitting was performed. Figure 8 shows the experimental results, which indicate that the reflectivity of the standard grayscale cards is the same in different environments.
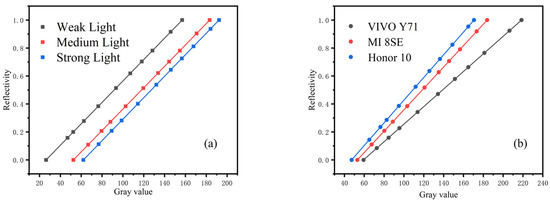
Figure 8.
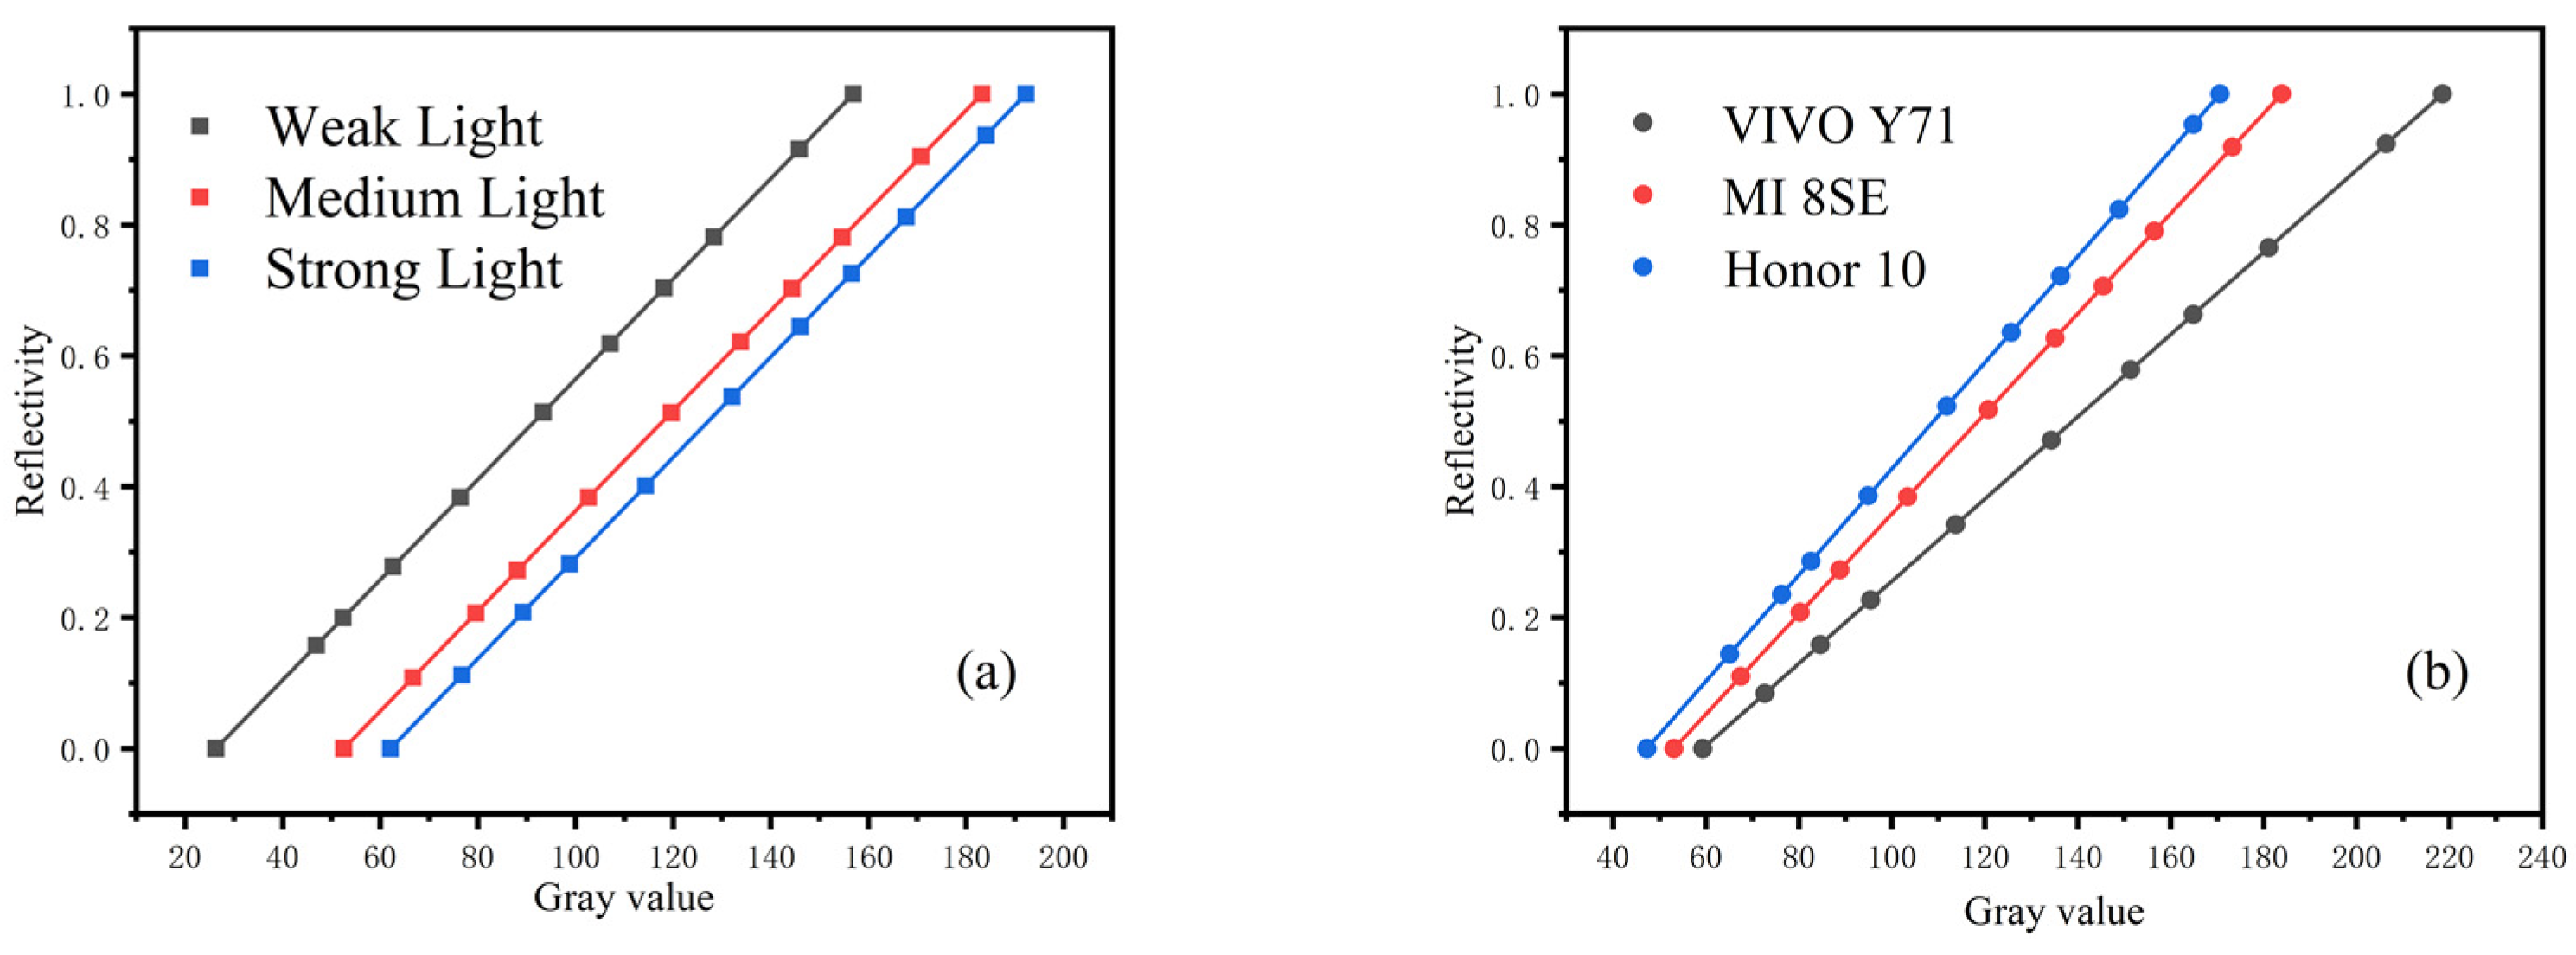
Reflectivity of standard grayscale card in different detection environments: (a) reflectivity under different illumination, (b) reflectivity under different smartphones. The value of each point represented the mean of three independent experiments.
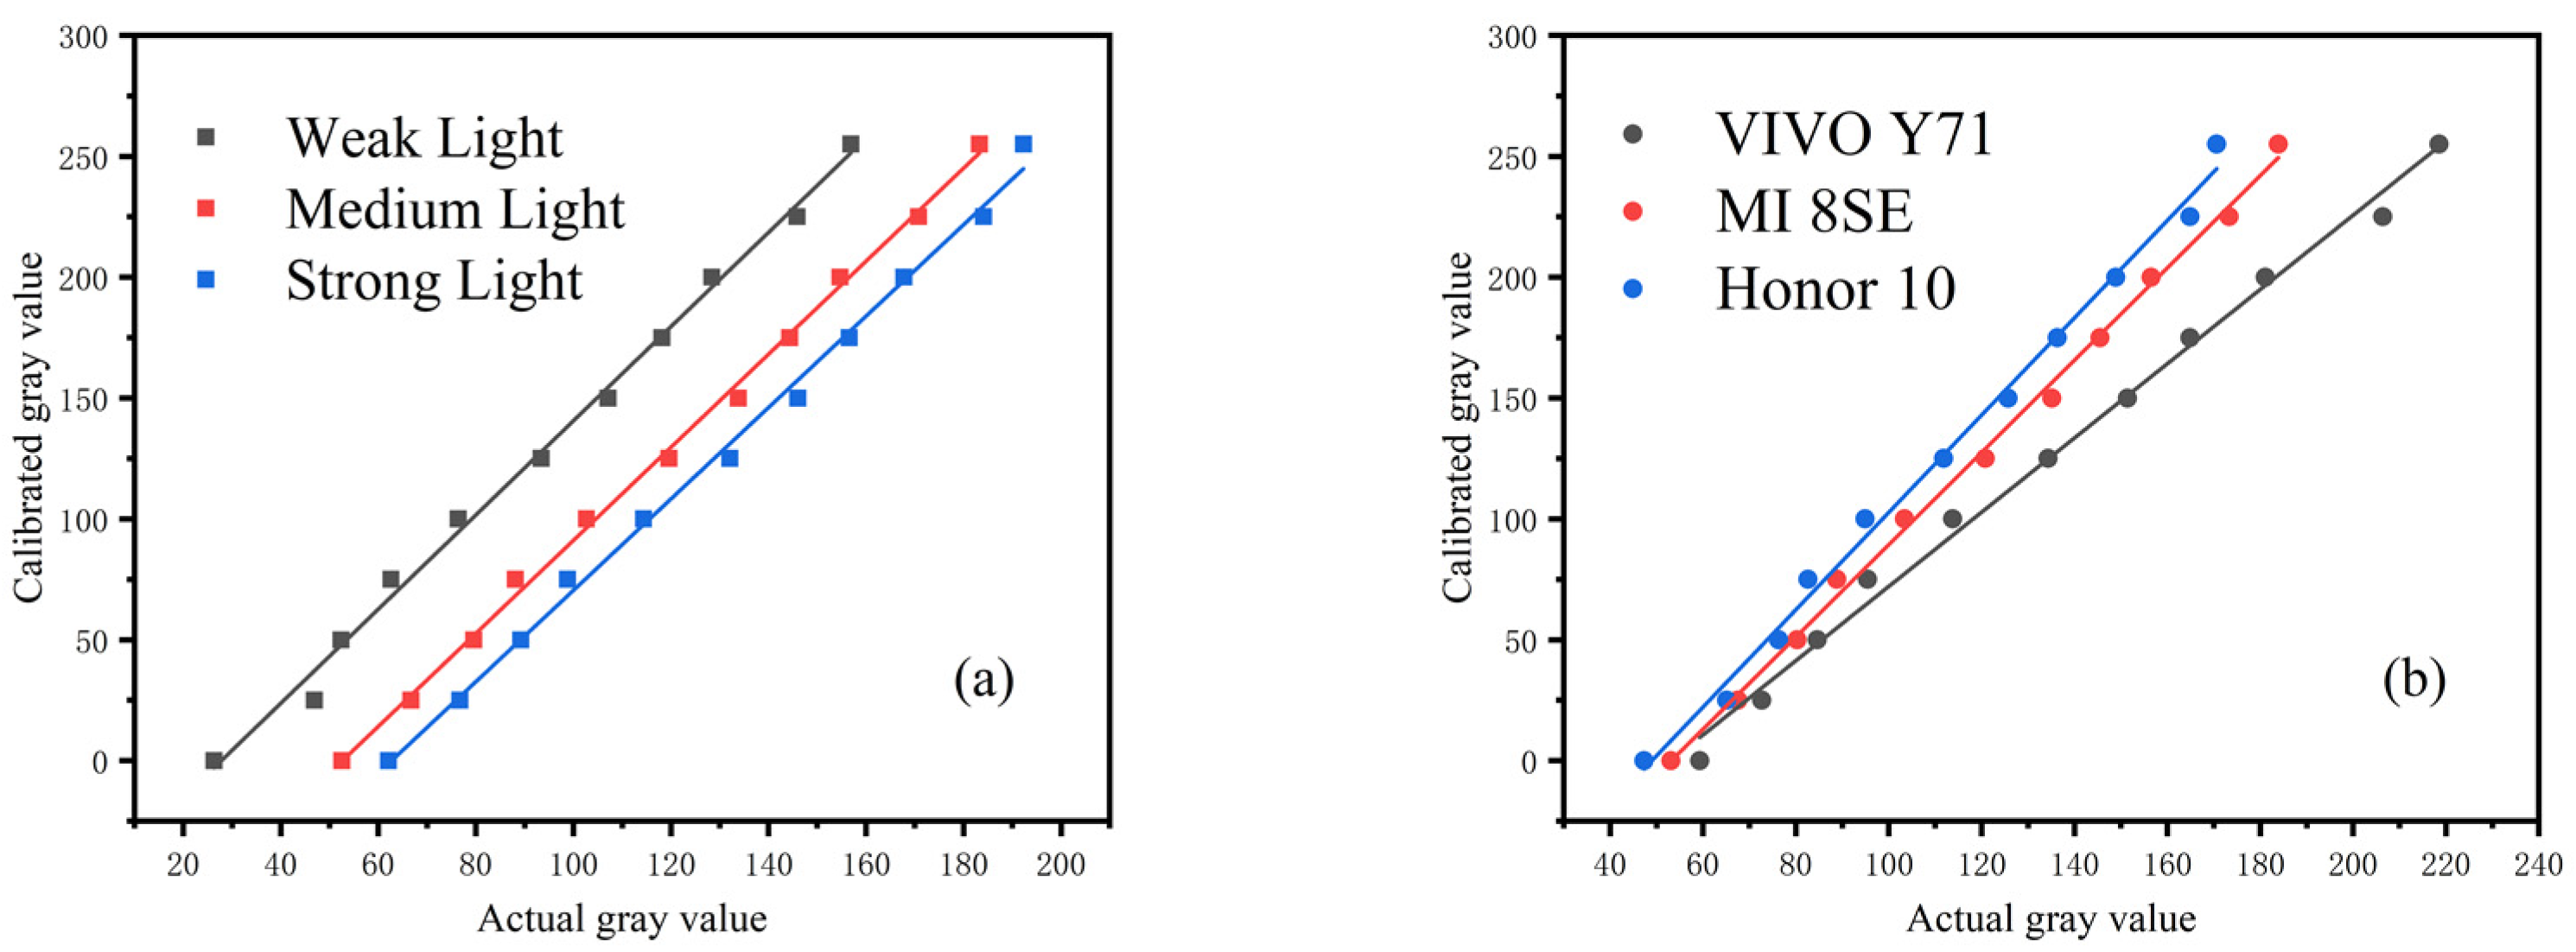
Moreover, the calibration value of the gray card was fitted with the gray value detected by the smartphone. Figure 9a shows the experimental results, and Figure 9b shows gray card images captured in different environments.
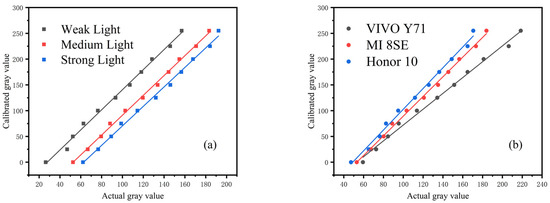
Figure 9.
Gray value fitting of standard grayscale card in different detection environments: (a) fitting curve under different illumination, (b) fitting curve under different smartphones. The value of each point represented the mean of three independent experiments. The experimental results show that the fitting degrees are within 0.9942–0.9981, as shown in Table 2.
Though under different illuminance and different smartphones, the images are visually different as shown in Figure 10; after measuring the 11 regions on the reference chart, we found that the measured intensities between different ambient conditions have a good linear relationship under different illumination and smartphones. Therefore, to make the measurement convenient and to reduce the number of calculations, two gray cards, namely, standard white and standard black, were selected to replace the standard grayscale card and establish the standard calibration curve.
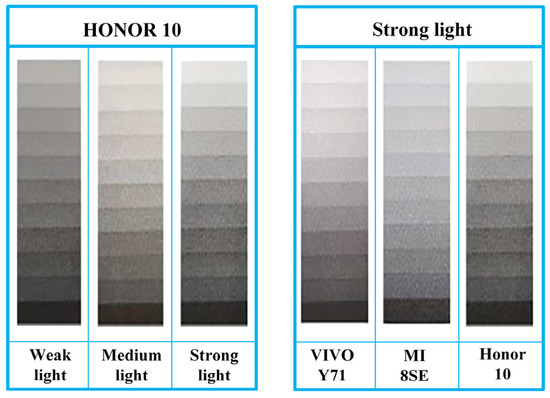
Figure 10.
Influence of different environmental factors on image; under different illuminance and different smartphones, the images are visually different.
4.3. Establishment of Calibration Curve
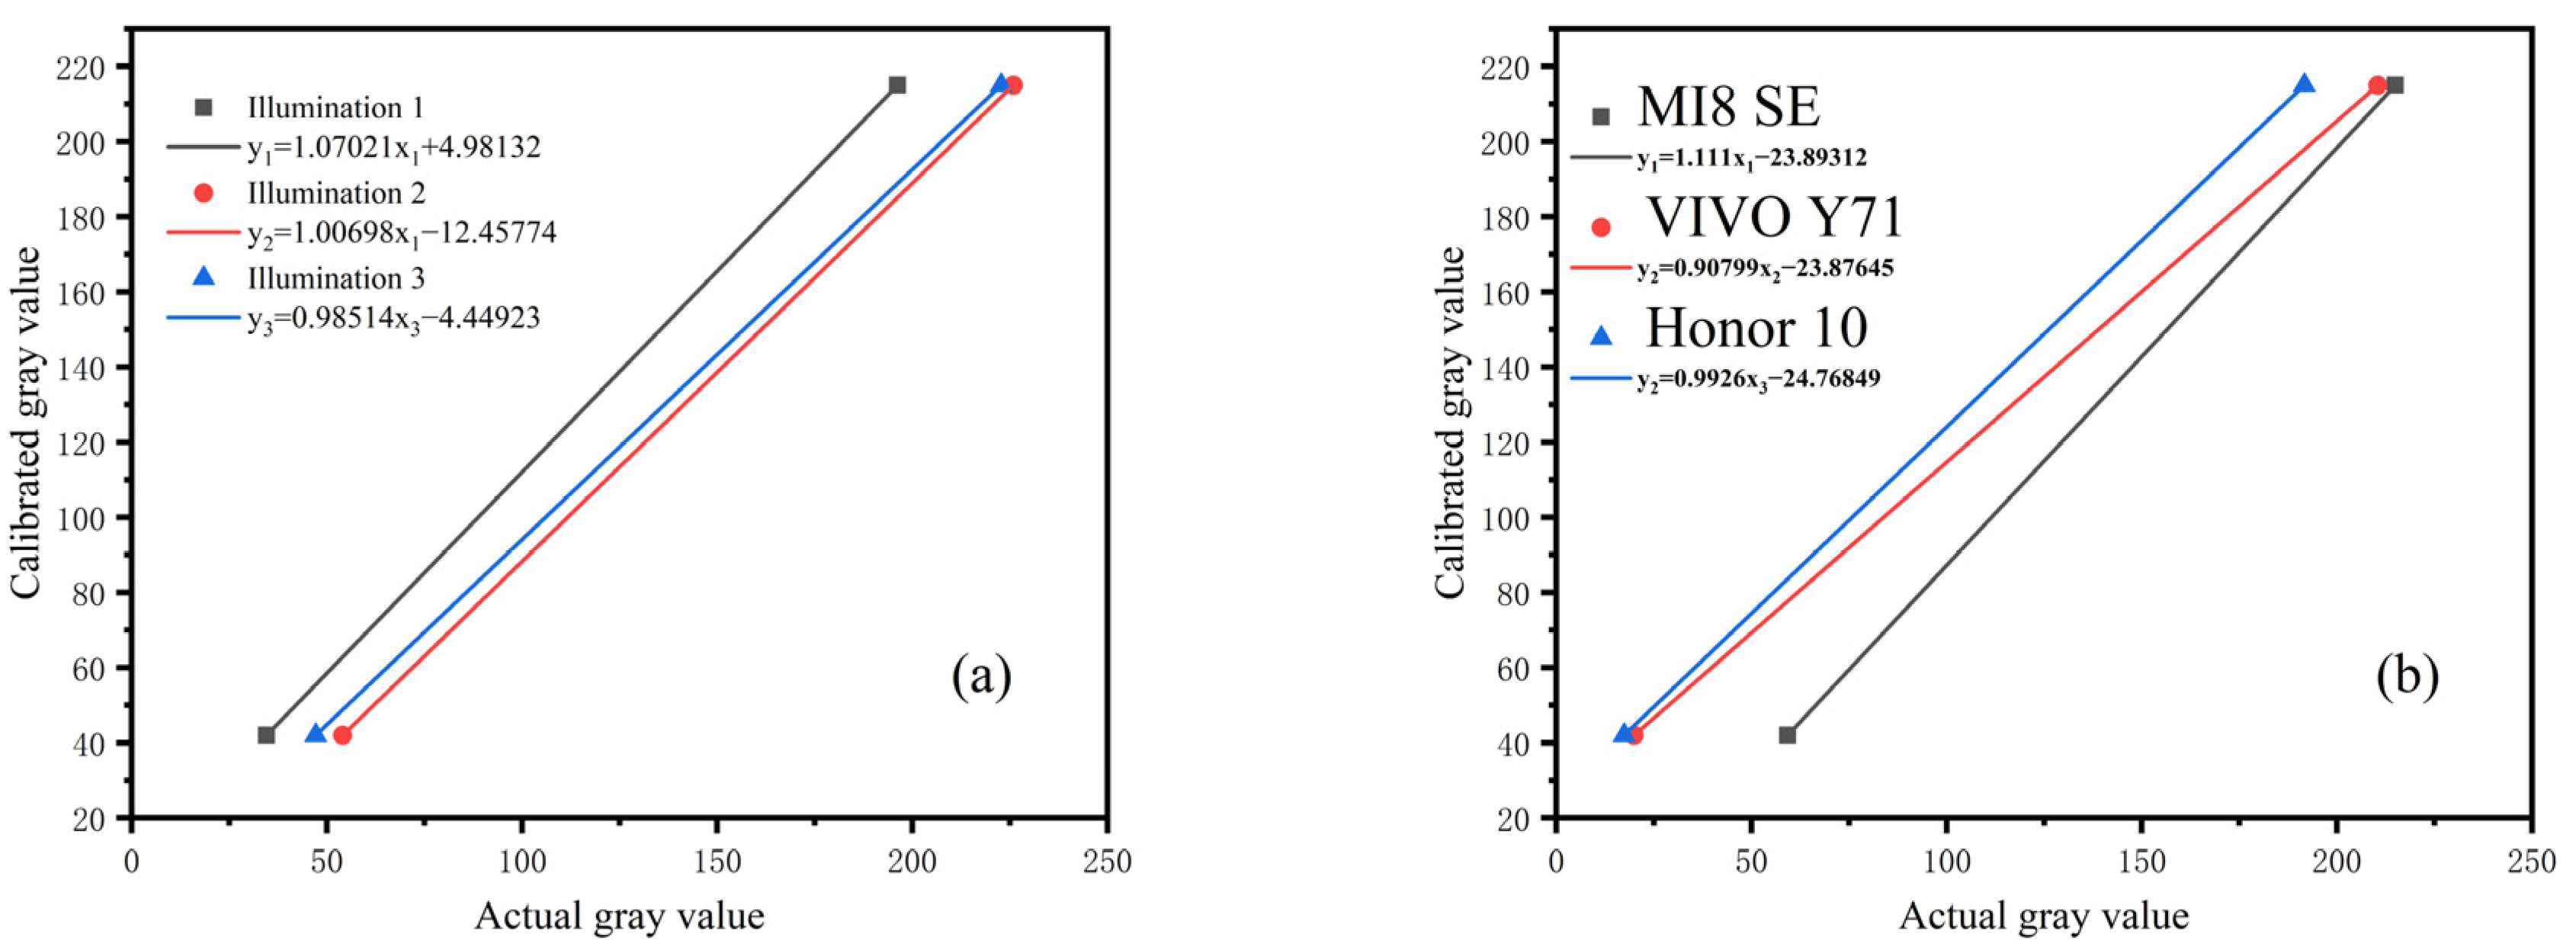
To ensure that the detection results in different environments have a unified reference value, and to ensure the stability and accuracy of the detection results are easy to analyze, the following steps were performed. The calibration curve was established and used to transform the detection value in an arbitrary environment to the calibration value in the standard environment to eliminate the environmental impact. First, the calibration value of the standard black and white card was measured under the standard testing environment. Second, the calibration curve was established using the calibration value of the standard black and white cards. Finally, the calibration value in other environments was obtained through the corresponding calibration curve. Figure 11 shows the calibration curves for different illumination and mobile phones.
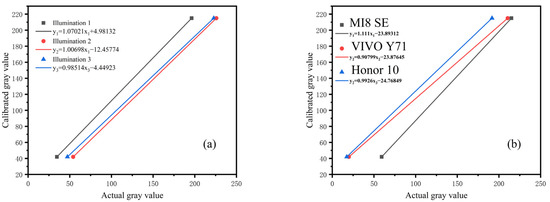
Figure 11.
Establishment of calibration curve: (a) calibration curves of different illumination, (b) calibration curves of different smartphones. The value of each point represented the mean of three independent experiments.
4.4. Evaluation of the Repeatability
In order to investigate the repeatability of the proposed method, three different concentrations of standard lamotrigine solutions were tested, and a smartphone (MI 8SE) was used to take photos (n = 5) under the standard testing environment. The images were then processed to obtain the calibration value of T-line. On the basis of the experimental results, the relative standard deviation (RSD) of the GICS images was calculated (see Table 3).
Table 3.
Repeatability of proposed method.
The RSDs for the GICSs are within 0.67–1.07%, indicating that the proposed method is acceptably repeatable. So far, the experimental principles have been verified. Next, different illuminances intensity and different mobile phones are taken as variables to verify the feasibility of this method.
4.5. Establishment of Calibration Curve
The collected images were significantly affected by the external illumination intensity. To prove the stability and practicability of the proposed method under three different illuminations (A, B, C), a smartphone was used to detect and analyze the GICS under three different illumination intensities. Each value represented the mean of three independent experiments. The variation coefficient (CV) of T-line was calculated and analyzed. Standard lamotrigine samples with concentrations of 2, 20, and 50 ng/mL were tested. Table 4 shows that the CV ranges from 0.75% to 1.53%. The results show that the detection results under different illumination are stable and suitable for detection.
Table 4.
Calibration value of different illumination.
4.6. Stability in Different Smartphones
The images captured by different types of smartphones vary. To evaluate the stability of the proposed method in different smartphones, GICS was detected by using three different smartphones, namely, Vivo Y71, MI 8SE and Huawei Honor 10. Standard lamotrigine samples with concentrations of 2, 20, and 50 ng/mL were tested. Fifteen minutes after using GICs for detection, the three smartphones were used to take pictures of GICS, and the images were processed by using the proposed method. Finally, the CV of T was calculated and analyzed. Table 5 shows the results of the three smartphones.
Table 5.
Calibration value of different smartphone.
Each value represented the mean of three independent experiments. Table 5 shows that the CV ranges from 0.15% to 0.47%, proving that the proposed method has good stability for different types of smartphones.
4.7. Standard Curve Fitting
Given the good stability of the test results with different smartphones and illumination, a smartphone was used to detect lamotrigine standard samples with different concentrations (0–75 ng/mL). A four-parameter logic model was used to establish the standard curve. Figure 12 shows the fitting results. From this, we can measure the concentrations of solutions from the image taken.
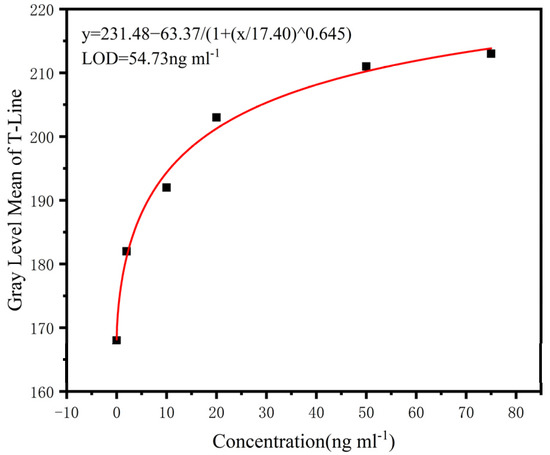
Figure 12.
Standard curve fitting line; the fitting degree is 0.993, and the detection limit is 54.73 ng/mL.
5. Conclusions
This paper presents a rapid method based on smartphones for colloidal gold immunochromatographic strip; the lamotrigine was taken as an example. First, the absorption characteristics of colloidal gold to visible light were analyzed, and the advantages of green channel were proven by experiments. A reagent strip was placed on the designed background detection paper for detection to ensure that the smartphone has a reasonable exposure time when collecting images and to avoid a very short or very long exposure time. The calibration curves were established using standard white and standard black-gray cards on background detection paper, and the calibration values in different environments were obtained through the calibration curves for environmental compensation. The experimental results proved that this method achieves good detection results under different environmental illumination and different types of smartphones; the CVs for the GICSs are within 0.15–1.53%. This method can obtain quantitative results in 15 min with high efficiency and sensitivity and can be performed without specialized personnel, thereby facilitating POC analysis with reduced cost and response time. The most important point is that this method can eliminate the influence of different environments on the test results, and it has good stability. Thus, this method is applicable for the quantitative detection method of colloidal gold immunochromatographic strip. Commercially, this system only requires the tester to provide a background paper and reagent strip, thus providing the test results to customers at a very low cost. It can be promoted as a method but will not involve commercialization. Hopefully, this method will play a positive role in the promotion of home self-testing and clinical screening of novel coronavirus and other symptoms.
Author Contributions
Conceptualization, G.X. and S.J.; methodology, L.B.; software, F.C. and J.W.; statistical analysis, Z.L. and L.M. All authors have read and agreed to the published version of the manuscript.
Funding
This research was funded by National Natural Science Foundation of China, grant number 61774141.
Institutional Review Board Statement
Not applicable.
Informed Consent Statement
Not applicable.
Data Availability Statement
Not applicable.
Acknowledgments
This paper was sponsored by Hefei Science and Technology Bureau Funds Project (NO. J2018G28). I acknowledge the support of Biohit Healthcare (Hefei, China) Co., Ltd., and the guidance of Chen Wei and Baolei Dong.
Conflicts of Interest
The funders had no role in the design of the study.
References
- Drain, P.; Hyle, E.P.; Noubary, F.; Freedberg, K.A.; Wilson, D.; Bishai, W.R.; Rodriguez, W.; Bassett, I.V. Diagnostic point-of-care tests in resource-limited settings. Lancet Infect. Dis. 2014, 14, 239–249. [Google Scholar] [CrossRef] [Green Version]
- Kaushik, A.; Vasudev, A.; Arya, S.K.; Pasha, S.K.; Bhansali, S. Recent advances in cortisol sensing technologies for point-of-care application. Biosens. Bioelectron. 2014, 53, 499–512. [Google Scholar] [CrossRef]
- Terpos, E.; Ntanasis-Stathopoulo, I.; Skvar, M. Clinical Application of a New SARS-CoV-2 Antigen Detection Kit (Colloidal Gold) in the Detection of COVID-19. Diagnostics 2021, 11, 995. [Google Scholar] [CrossRef]
- Liau, J.; Goldberg, D.; Arif-Tiwari, H. Prostate Cancer Detection and Diagnosis: Role of Ultrasound with MRI Correlates. Curr. Radiol. Rep. 2019, 7, 7. [Google Scholar] [CrossRef] [Green Version]
- Patra, C.R.; Bhattacharya, R.; Mukhopadhyay, D.; Mukherjee, P. Rmukhopadhyay, Fabrication of Gold Nanoparticles for targeted therapy in pancreatic cancer. Adv. Drug Deliv. Rev. 2010, 62, 346–361. [Google Scholar] [CrossRef] [PubMed] [Green Version]
- Nguyen, T.; Wolff, A. Rapid diagnostics for SARS-CoV-2 virus: Point-of-care testing and lessons learned during the pandemic. Bioanalysis 2021, 13, 1165–1167. [Google Scholar] [CrossRef]
- Pierce, M.C.; Weigum, S.E.; Jaslove, J.M.; Richards-Kortum, R.; Tkaczyk, T.S. Optical systems for point-of-care diagnostic instrumentation: Analysis of imaging performance and cost. Ann. Biomed. Eng. 2014, 42, 231–240. [Google Scholar] [CrossRef] [Green Version]
- Zhu, H.; Isikman, S.O.; Mudanyali, O.; Greenbaum, A.; Ozcan, A. Optical imaging techniques for point-of-care diagnostics. Lab A Chip 2013, 13, 51–67. [Google Scholar] [CrossRef] [PubMed]
- Myers, F.B.; Lee, L.P. Innovations in optical microfluidic technologies for point-of-care diagnostics. Lab Chip 2008, 8, 2015–2031. [Google Scholar] [CrossRef] [PubMed]
- Preechaburana, P.; Suska, A.; Filippini, D. Biosensing with cell phones. Trends Biotechnol. 2014, 32, 351–355. [Google Scholar] [CrossRef]
- Zhang, D.; Liu, Q. Biosensors and bioelectronics on smartphone for portable biochemical detection. Biosens. Bioelectron. 2016, 75, 273–284. [Google Scholar] [CrossRef]
- Barbosa, A.I.; Gehlot, P.; Sidapra, K.; Edwards, A.D.; Reis, N.M. Portable smartphone quantitation of prostate specific antigen (PSA) in a fluoropolymer microfluidic device. Biosens. Bioelectron. 2015, 70, 5–14. [Google Scholar] [CrossRef] [PubMed] [Green Version]
- Rajendran, V.K.; Bakthavathsalam, P.; Ali, B.M.J. Smartphone based bacterial detection using biofunctionalized fluorescent nanoparticles. Microchim. Acta 2014, 181, 1815–1821. [Google Scholar] [CrossRef]
- Xiao, W.; Huang, C.; Xu, F.; Yan, J.; Bian, H.; Fu, Q.; Xie, K.; Wang, L.; Tang, Y. A Simple and Compact Smartphone-Based Device for the Quantitative Readout of Colloidal Gold Lateral Flow Immunoassay Strips. Sens. Actuators B Chem. 2018, 266, 63–70. [Google Scholar] [CrossRef]
- Von Lode, P. Point-of-care immunotesting: Approaching the analytical performance of central laboratory methods. Clin. Biochem. 2005, 38, 591–606. [Google Scholar] [CrossRef]
- Lopez-Ruiz, N.; Curto, V.F.; Erenas, M.M.; Benito-Lopez, F.; Diamond, D.; Palma, A.J.; Capitan-Vallvey, L.F. Smartphone-based simultaneous pH and nitrite colorimetric determination for paper microfluidic devices. Anal. Chem. 2014, 86, 9554. [Google Scholar] [CrossRef] [PubMed]
- Sin, M.L.; Gao, J.; Liao, J.C.; Wong, P.K. System Integration—A Major Step toward Lab on a Chip. J. Biol. Eng. 2011, 5, 6. [Google Scholar] [CrossRef] [Green Version]
- Li, J.; Zou, M.; Chen, Y.; Xue, Q.; Zhang, F.; Li, B.; Wang, Y.; Qi, X.; Yang, Y. Gold immunochromatographic strips for enhanced detection of Avian influenza and Newcastle disease viruses. Anal. Chim. Acta 2013, 782, 54–58. [Google Scholar] [CrossRef] [PubMed]
- Liu, B.; Wang, L.; Tong, B.; Zhang, Y.; Sheng, W.; Pan, M.; Wang, S. Development and comparison of immunochromatographic strips with three nanomaterial labels: Colloidal gold, nanogold-polyaniline-nanogold microspheres (GPGs) and colloidal carbon for visual detection of salbutamol. Biosens. Bioelectron. 2016, 85, 337–342. [Google Scholar] [CrossRef]
- Link, S.; El-Sayed, M.A. Size and Temperature Dependence of the Plasmon Absorption of Colloidal Gold Nanoparticles. J. Phys. Chem. B 1999, 103, 4212–4217. [Google Scholar] [CrossRef]
- Long, N.N.; Kiem, C.D.; Doanh, S.C.; Nguyet, C.T.; Hang, P.T.; Thien, N.D.; Quynh, L.M. Synthesis and optical properties of colloidal gold nanoparticles. J. Phys. Conf. 2009, 187, 012026. [Google Scholar] [CrossRef]
- Zheng, C.; Ye, X.Y.; Xiao, X.Q. Nonlinear Absorption Properties of Spherical Gold Colloidal Nanoparticles. Adv. Mater. Res. 2012, 476–478, 923–927. [Google Scholar] [CrossRef]
- Jia, M.Y.; Wu, Q.S.; Li, H.; Zhang, Y.; Guan, Y.F.; Feng, L. The calibration of cellphone camera-based colorimetric sensor array and its application in the determination of glucose in urine. Biosens. Bioelectron. 2015, 74, 1029–1037. [Google Scholar] [CrossRef] [PubMed]


Publisher’s Note: MDPI stays neutral with regard to jurisdictional claims in published maps and institutional affiliations. |
© 2021 by the authors. Licensee MDPI, Basel, Switzerland. This article is an open access article distributed under the terms and conditions of the Creative Commons Attribution (CC BY) license (https://creativecommons.org/licenses/by/4.0/).