Abstract
Based on Mie scattering theory, fractal theory, the generalized multiparticle Mie model and the attenuated total reflectance infrared spectroscopy method, this paper aimed to explore the influence of different distribution morphologies of semiconductor nanoparticles on their radiation properties. The results revealed that (1) the symmetry and fluctuation amplitude of the scattering direction of the SiC elementary particles, with a diameter of 100 nm, and the cluster particles were related to the wavelength, particle size and agglomeration state. (2) The particle size distribution had a significant effect on the spectral extinction performance of the SiC particles, especially when λ > 10 μm, which can be greatly strengthened by increasing the proportion of large-scale particles. (3) The influence of SiC particle clusters on their spectral extinction was directly related to the cluster size and wavelength. When λ < 10 μm, small-scale cluster particles showed lower extinction performances; however, the absorption and scattering factors increased with the increase in cluster size while λ > 10 μm, and the extinction performance significantly improved. In summary, the quantitative changes in the microscale and structure, as well as the distribution states, had a significant impact on the infrared spectral characteristics of the particles, and we expect to adjust the particle size distribution to obtain desired radiation properties.
1. Introduction
As one of the third-generation semiconductor core materials, SiC has the advantages of a wide band gap, large thermal conductivity and good chemical stability, and it is very suitable for making high-temperature, high-frequency, radiation-resistance, high-power and high-density integrated electronic devices [1,2]. Additionally, SiC is also widely used to make blue, green and ultraviolet light-emitting devices and light detection devices due to the fact of its unique band gap width (2.3~3.3 eV) [3,4]. With the development of nanotechnology, it has been recognized that the reason why semiconductor materials have so many unique properties is essentially due to the fact of their physical properties and microscopic topography. In recent years, in order to adapt to different application fields, researchers are increasingly expected to realize the regulation of optical/electrical properties by optimizing the morphology and structure of nanoscale SiC particles. Xiang Z. N. et al. [5] prepared hollow SiC spherical nanoparticles by self-assembly technology, regulating their microwave absorption properties with the help of SiC dielectric loss and its special microstructure and simulated and calculated the reflection loss (RL) of samples with different coating thicknesses. Liu X. et al. [6] synthesized SiC nanoparticles by thermochemical vapor deposition and studied the optical properties of the materials using a photoluminescence spectroscopy microimaging system. Guo X. X. [7] prepared SiC nanoparticles by chemical corrosion and electrochemical corrosion and studied the luminescence mechanism of SiC nanoparticles with different sizes.
However, with the deepening of research, it has been found that the special properties presented in theory on nanoparticles have not been fully reflected in practice. The reason for this may be that the particle distribution state of realistic nanomaterials is inconsistent with the ideal; that is, the nanoparticles agglomerate to varying degrees rather than completely existing as elementary particles, thus exhibiting different distribution states. Therefore, the influence of the distribution morphology of nanoparticles on their properties has attracted increasing numbers of researchers. Scholars usually study nanoparticles with different distribution forms by means of simulations and tests. For example, Guan Z. [8] studied the micromorphology, size, particle size distribution and nanostructure of CoFe2O4 nanoparticles by transmission electron microscope (TEM) and X-ray diffraction (XRD), indicating that the bimodal distribution of CoFe2O4 nanoparticles may bring new properties to nanocomposite particles. Huang H. J. et al. [9] synthesized copper nanoparticles with bimodal distribution using a one-step chemical reduction method, which can be used in copper paste sintered joints to achieve better high-temperature thermal oxidation resistance. Sun J. et al. [10,11] found that the particle size and distribution of natural graphite have a great impact on the initial charge and discharge capacity of lithium-ion batteries, and natural graphite has a large first charge capacity with small particle sizes, while it has a high first charge efficiency with medium particle sizes.
Mie scattering theory is the theoretical basis for the optical application of research on nanoceramic materials. In recent years, with the continuous progress and improvement in simulation methods, researchers have accumulated many high-value theoretical analytical models such as the Aden–Kerker method, discrete dipole approximation (DDA), generalized multiparticle Mie theory (GMM), T-matrix method and the Monte Carlo method (MCM). Wang H. X. et al. [12] simulated and verified the influence of the shape of micron-sized particles on the extinction performance in shortwave infrared using Mie scattering theory and DDA. Li Y. N. et al. [13,14] used the Aden–Kerker method and direct simulation Monte Carlo (DSMC) method to analyze the influence of the particle size, shape parameters and number density distribution on the extinction performance of core–shell particles and particle swarm in mid- and longwave infrared. Tang J. L. [15] found that ZnO nanoparticles have a wide absorption band in mid-wave infrared with the introduction of impurities doping using the KBr tablet measurement method. Zhang Y. H. et al. [16] tested and studied the morphology, composition and optical properties of samples through scanning electron microscopy (SEM), XRD and infrared transmission spectrum and proved that the infrared absorption characteristics of Ag nanoparticles are completely different from those of bulk Ag.
In summary, the distribution state of nanoparticles may be an important factor affecting material properties in practical applications. It is still not easy to obtain nanoparticles in the ideal distribution state, and researchers have a long way to go. Now, the growing application demands make it more practical to study nanoparticles in the agglomeration state.
In this paper, we explore the specific impact of different distribution forms on particle radiation characteristics with the help of powerful analytical methods and test tools and then prove the possibility of optimizing the regulation of particle radiation characteristics by changing the particle distribution after detailed analysis and comparison. In order to achieve this goal, nanoparticles were divided into three distribution forms: elementary particles, cluster particles and particle swarms. We analyzed the radiation characteristics of elementary particles based on the Mie theory and simulated the changes in the radiation characteristics of cluster particles using the GMM theory. In follow-up work, the DSMC method was used to simulate the radiation characteristics of particle swarm. In addition, the complex relationship between particle size distribution and radiation characteristics was tested and studied with the help of XRD, SEM, attenuated total reflectance infrared spectroscopy (ATR-FTIR), etc.
The work in this paper is just the beginning and a foundation, the purpose of which is to reveal the influence of particle size distribution on particle radiation characteristics, and many other works are currently under way. We expect to realize artificial regulation of the infrared spectral characteristics of nanoparticle swarms.
2. Materials and Methods
2.1. Mie Scattering Theory
The Mie scattering theory [17] can obtain the extinction spectrum of spherical particles by solving Maxwell’s equation. The formulas of extinction factor Qeλ, scattering factor Qsλ, absorption factor Qaλ and phase function are as follows:
where Re indicates that the real part is selected; χ is the scale parameter; r is the particle radius; and are the extinction and scattering cross-sections; and are the scattering functions; an and bn are the Mie scattering coefficients, the expressions of which are as follows:
where m is the complex refractive index of the particle relative to the surrounding medium; m = n + ik; ψn(χ) and ηn(χ) are the Ricatti Bessel functions. Here, ξn = ψn + iηn.
The scattering function is calculated as follows:
where and are the scattering angle functions, which are defined as follows:
where is the associated Legendre polynomial.
2.2. GMM Theory
GMM theory [18] superimposes the Mie theory of a single particle with vector, which can be applied to study the scattering characteristics of particle groups for dependent scattering. It is assumed that the cluster is composed of N particles, and the scattering fields of the component particle j are expressed as and , centered on the center of the ball, which can be expanded into vector spherical harmonic forms as follows:
where is the angular frequency of the incident field; ε and are the dielectric constant and permeability of the surrounding medium; k is the wave number of the incident electromagnetic wave in the surrounding medium; . The superscript (3) of and indicates that the function is transformed into the first kind of Hankel function; and are the interaction coefficients between component spheres. is defined as:
In the cluster particles, the differential boundary condition for each particle is:
The electric field in the polarization state expressed by the above formula is:
The electromagnetic scattering wave of a single component sphere is also the incident wave for other component spheres. Therefore, it is necessary to use the vector superposition method to unify the scattered wave of the component sphere into a common coordinate system by a coordinate transformation matrix. Taking the j component sphere as an example, if the coordinate system of a specified component sphere is taken as the unified coordinate, in the far-field region, the scattering coefficient of j can be expressed as follows:
Then, the attenuation cross-section and scattering cross-section can be obtained:
2.3. Fractal Theory and the Diffusion-Limited Aggregation (DLA) Model
In this paper, the process of particle agglomeration to form cluster particles is described by the DLA model: First, a stationary “seed” is set at a certain position in finite space, and then a particle is randomly generated in the space, and it moves randomly in within that space. Continuously judge whether the particle collides with the “seed” during movement. If it collides, it will condense. Then, repeat the above steps until the number of elementary particles in the cluster meets the requirements.
Due to the complex fractal structure in generating cluster particles, the process can therefore be described with fractal theory, and the main formulas are as follows:
where is the number of elementary particles; is the radius of the elementary particle; is the radius of gyration of cluster particles; is the number of particles with radius r; is the distance from unit i in the aggregate to the centroid; and are the fractal dimension and fractal factor, respectively. Here, the value’s range is 1~3, which can characterize whether the cluster particle morphology is fluffy or dense. When = 1, the cluster particles are linear, and the cluster particles are spheres with = 3.
The cluster particles generated in this paper are shown in Figure 1. Here, = 1.19, = 2.2 and the particle size of the elementary sphere was 100 nm.
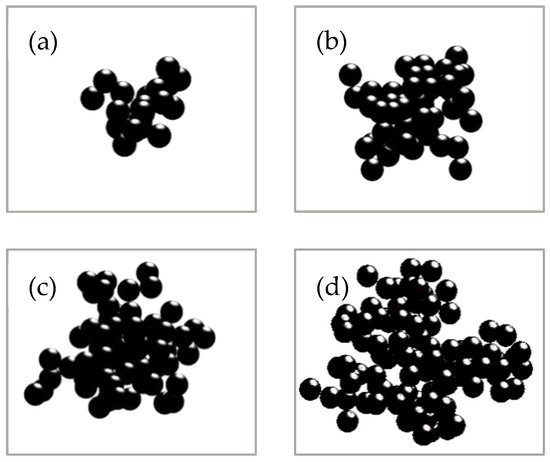
Figure 1.
Particle morphologies of SiC clusters with different numbers of elementary particles: (a) N = 20; (b) N = 50; (c) N = 70; (d) N = 100.
3. Results
3.1. Simulation Result
3.1.1. Radiation Characteristics of SiC Elementary Particles
The scattering characteristics of SiC spherical particles were analyzed when λ = 1~15 μm and the particle sizes were 0.1, 1.5 and 38 μm, respectively. The relationship between the simulated particle scale parameters () and the wavelengths is shown in Table 1.

Table 1.
Relationship between d, λ and χ.
As shown in Figure 2, the phase function curve was smooth, and it decreases first and then increased with d = 0.1 μm. Except for λ = 1 μm, the phase function was smooth with d = 1.5 μm. The phase function fluctuated at all wavelengths with d = 38 μm. The results show the influence of scale parameters on scattering directivity. The scattering energy distribution of the particles was closely related to the particle scale parameters. When the particle scale parameter was small, the distribution of the scattering energy was basically independent of the optical constant, and the forward and backward scattering energies were symmetrical. When the optical constant remained unchanged, with the gradual increase in the particle scale parameters, the forward and backward scattering energies appeared to be asymmetrical, and the forward scattering energy was larger than the backward one, but the phase function diagram was still smooth. When χ > 1, the phase function began to produce some peaks and valleys, the phase function began to oscillate with χ = 5 and the phase function would obviously oscillate and become quite complex with χ > 10 [19]. As shown in Figure 2c, when d = 38 μm (8 < χ < 119), the scattering phase function oscillated obviously.
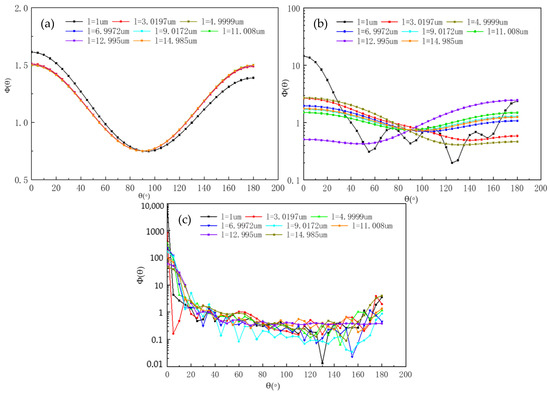
Figure 2.
Scattering phase functions of SiC particle changes with different wavelengths: (a) d = 0.1; (b) d = 1.5; (c) d = 38 μm.
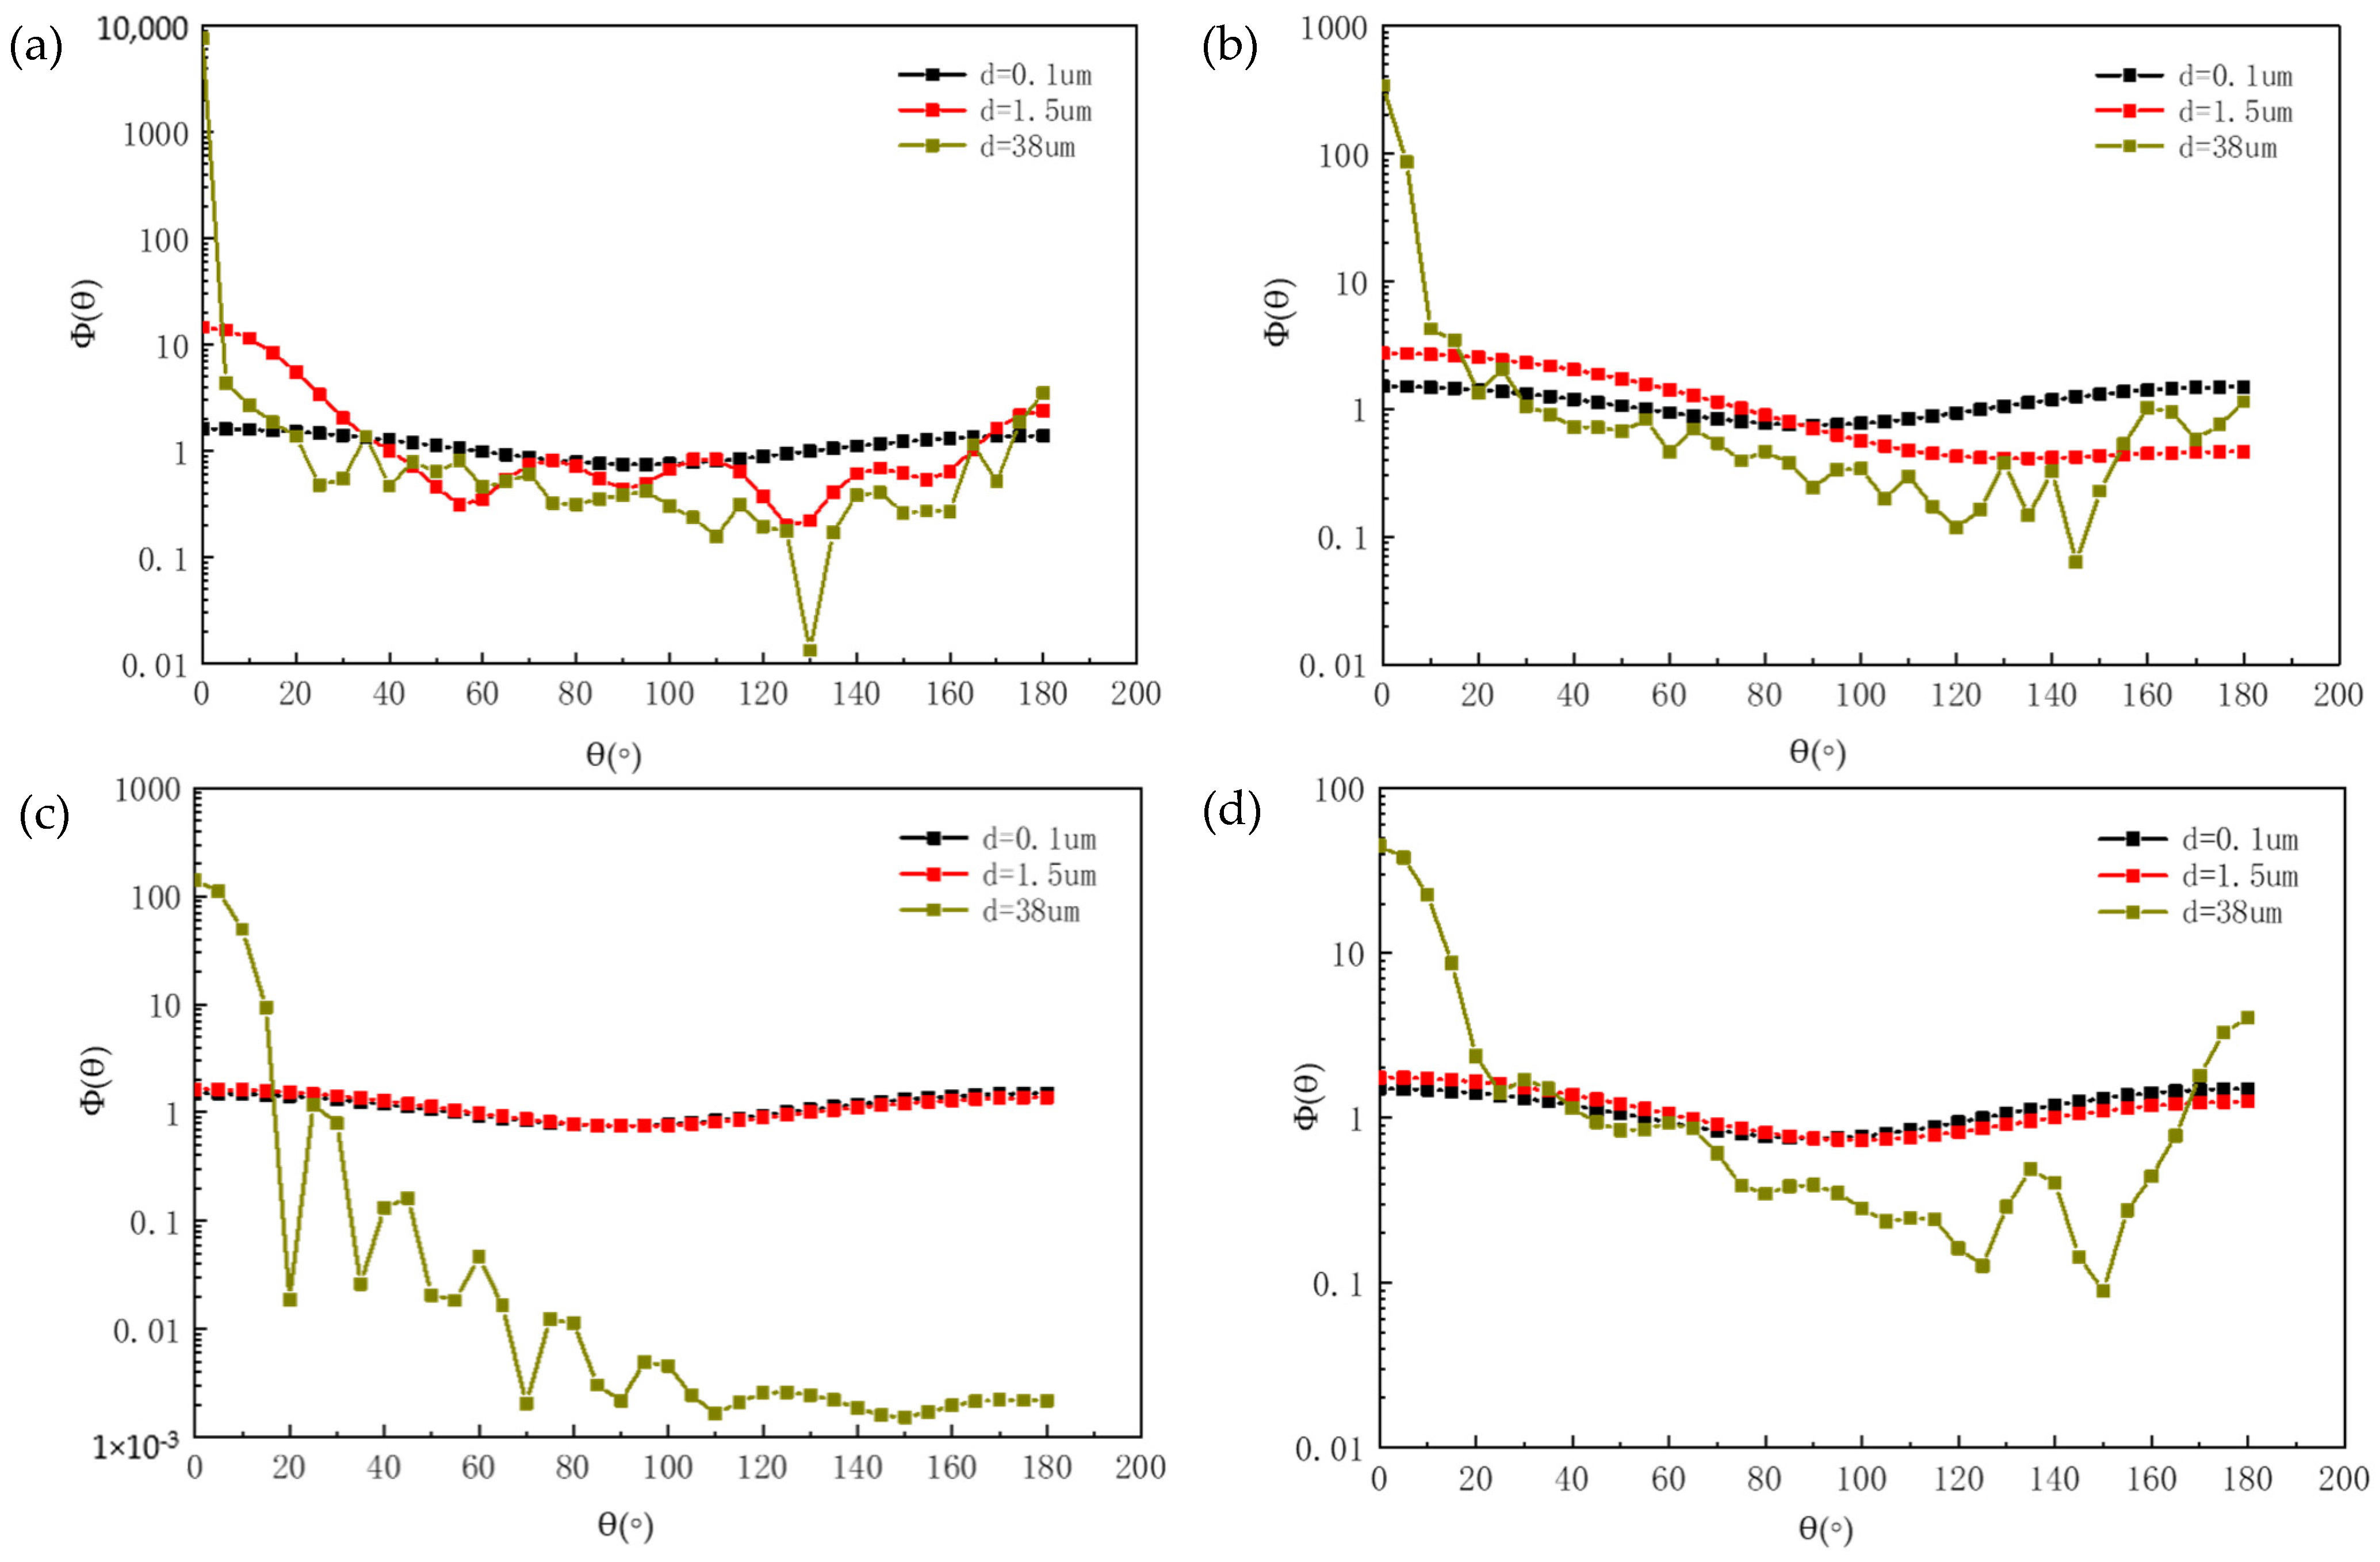
As shown in Figure 3, when d = 0.1 μm (0.02 < χ < 0.31), the forward and backward scattering distributions of the particles showed symmetry. When d = 1.5 μm (0.31 < χ < 4.7), with the increase in the wavelength, the one changed from oscillation to smoothness and then presented symmetry. When d = 38 μm (8 < χ < 119), the forward and backward scattering distributions of the particles oscillated obviously. For a wavelength of 1 μm, as shown in Figure 3a, the phase functions of the particles with d = 0.1 μm and d = 1.5 μm were quite different. However, with the increase in the wavelength, the particles with d = 0.1 μm and d = 1.5 μm (χ < 1) almost coincided as shown in Figure 3c,d.
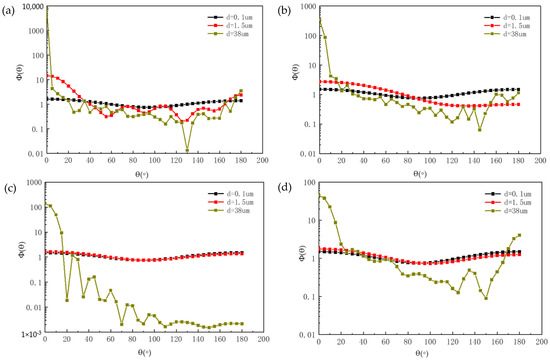
Figure 3.
The scattering phase functions of SiC particles changing with different particle sizes: (a) λ = 1; (b) λ = 4.9999; (c) λ = 10.009; (d) λ = 14.985 μm.
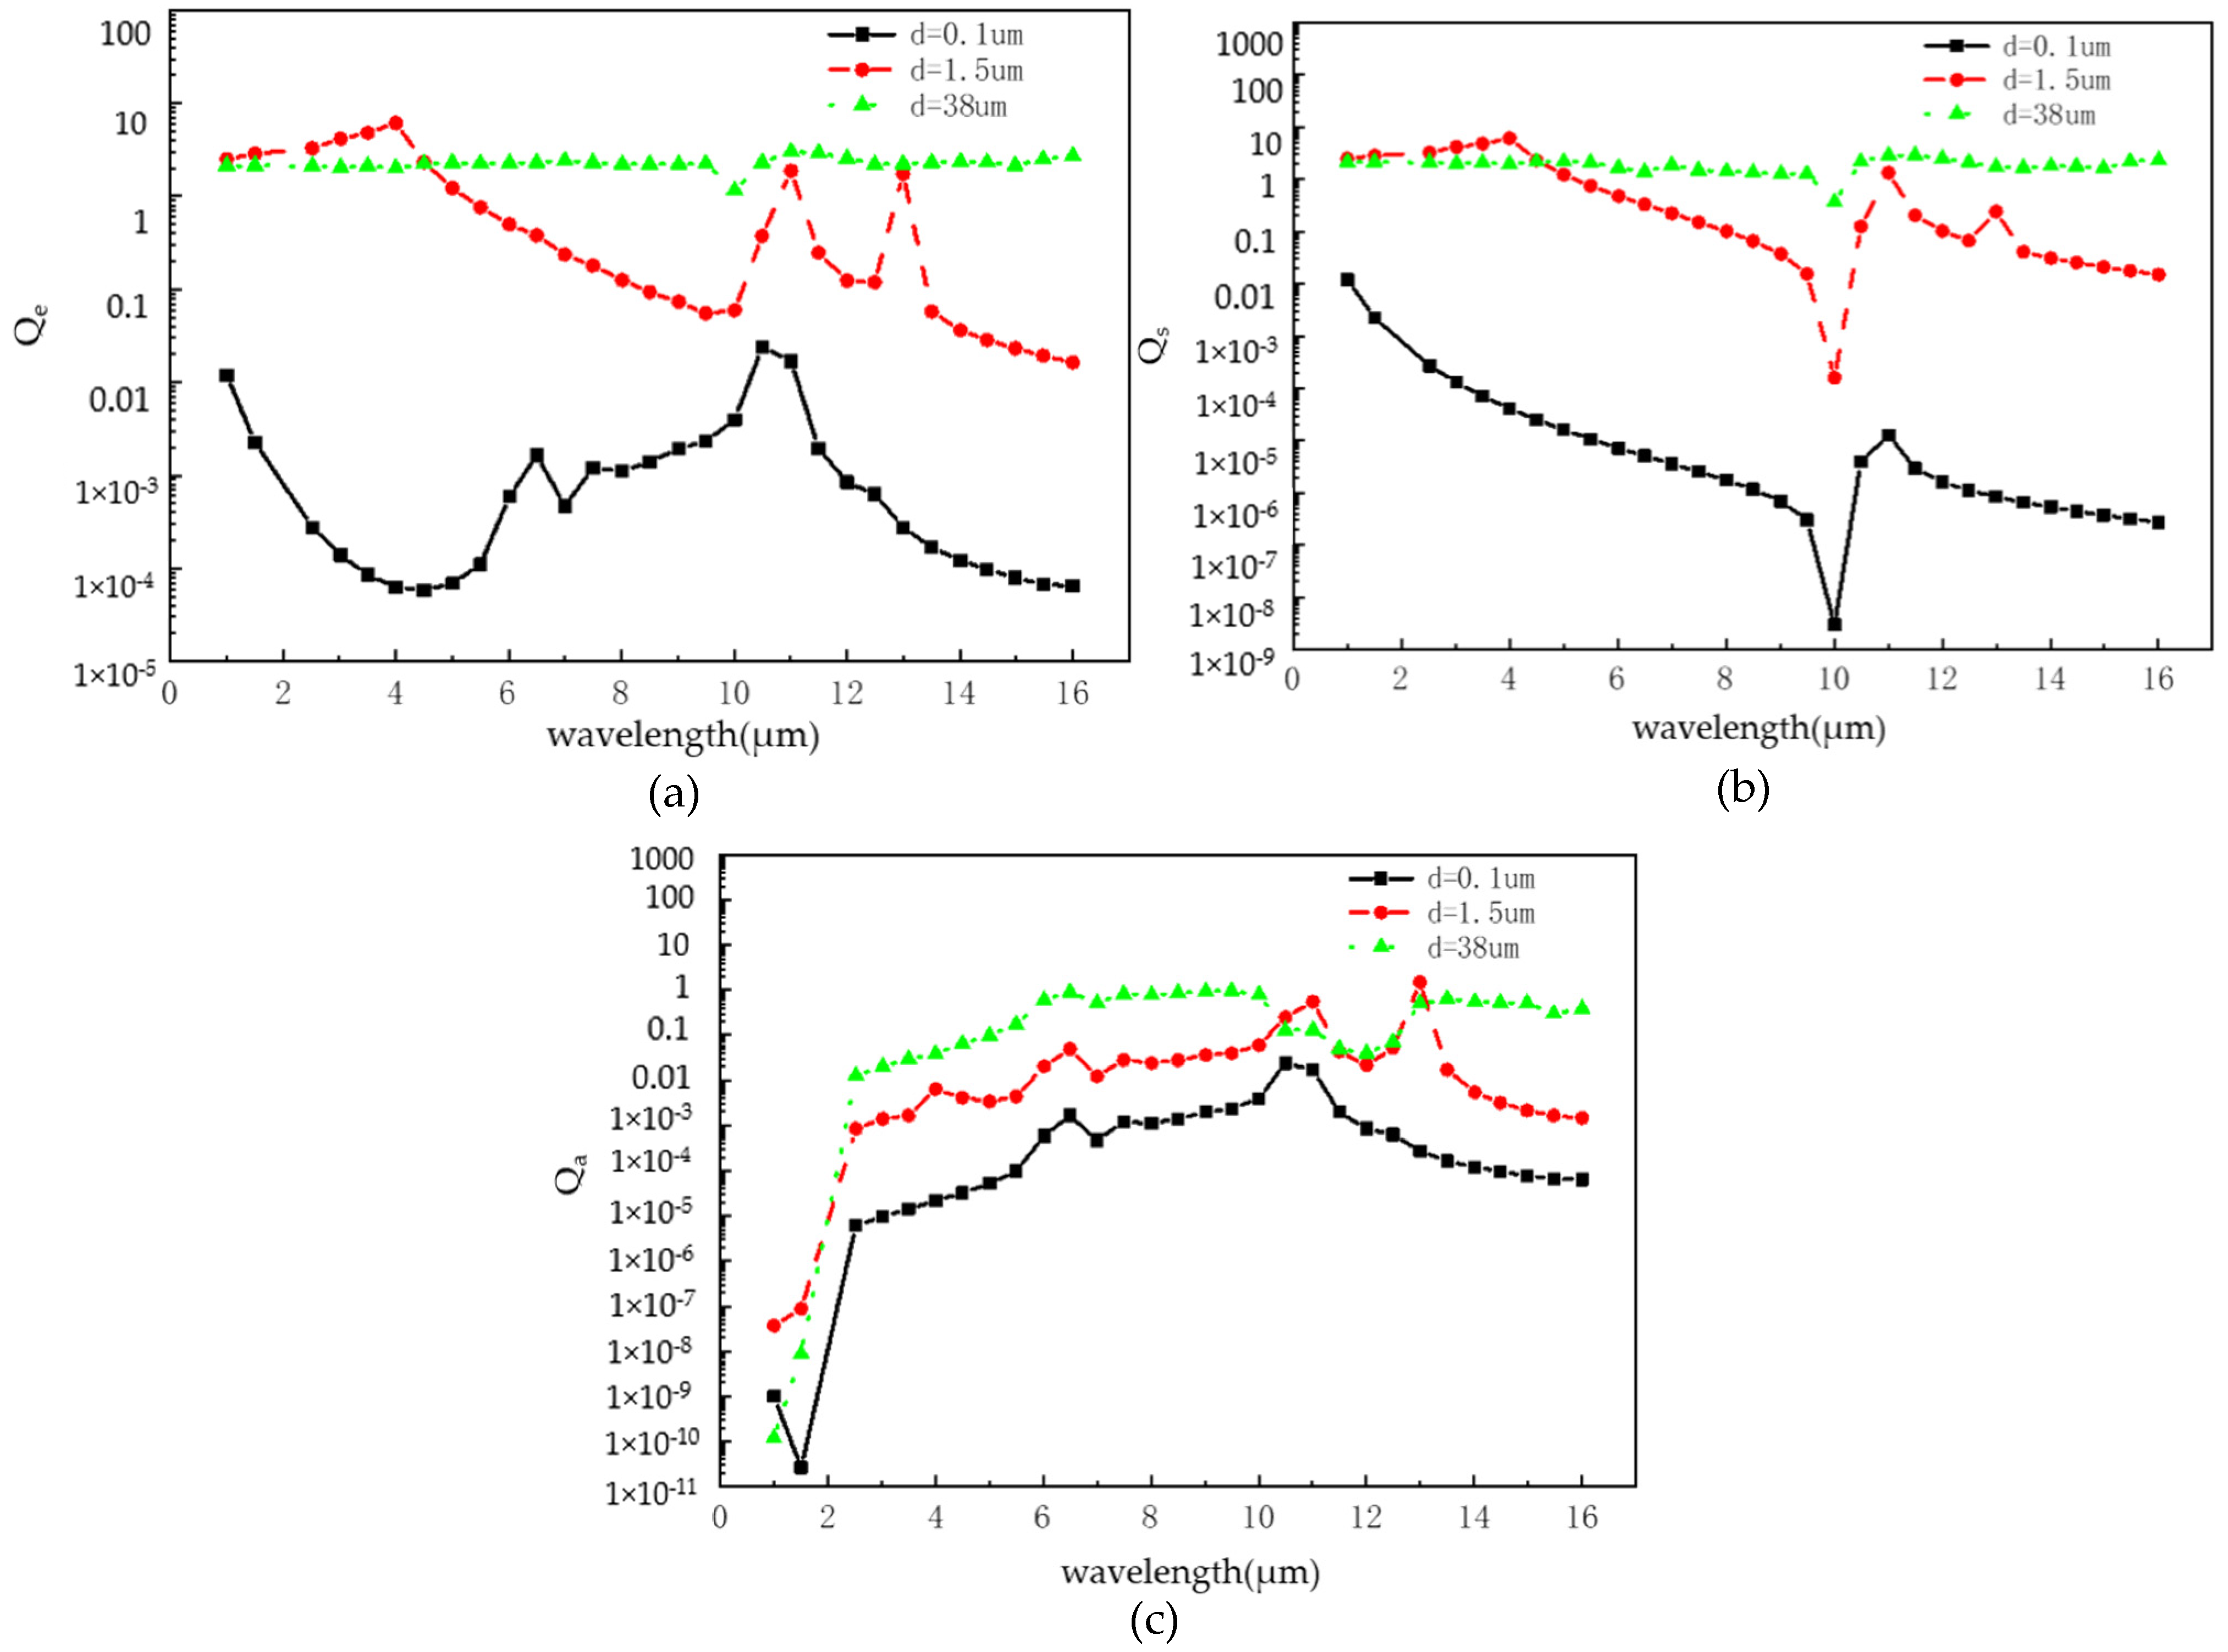
It can be seen from Figure 4 that the larger the particle size, the greater the extinction factor and the smaller the fluctuation. When λ > 10 μm, the extinction factor of particles with d = 0.1 μm decreased with the increase in the wavelength, but it increased with the increase in the wavelength with d = 38 μm. The larger the particle size, the larger the scattering and the absorption factors.
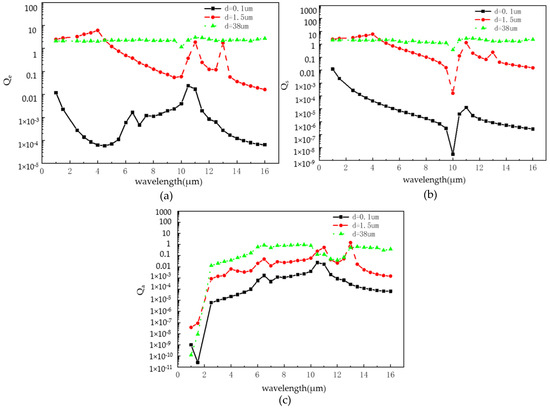
Figure 4.
The extinction factor, scattering factor and absorption factor of SiC particles with different scale changes at different wavelengths: (a) extinction factor (Qe); (b) scattering factor (Qs); (c) absorption factor (Qa).
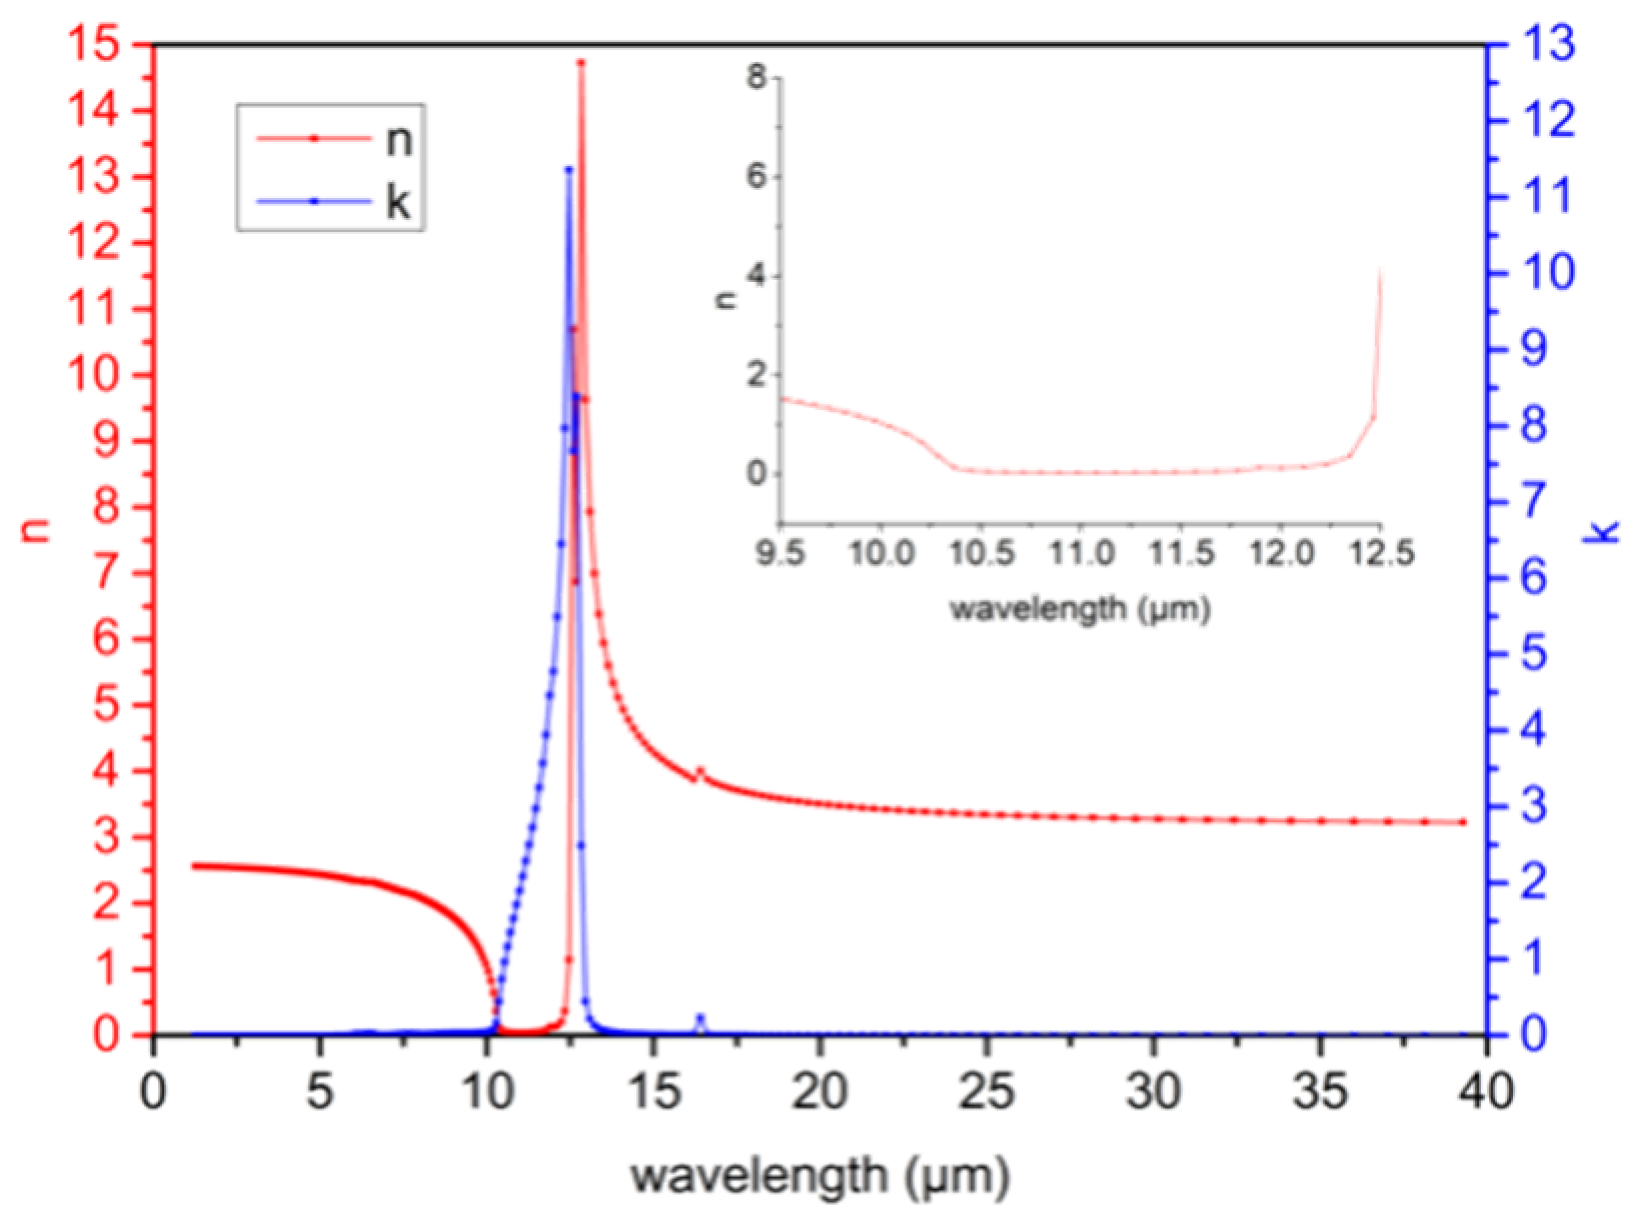
The scattering factor is related to the complex refractive index of a particle, which changes with the wavelength. Thus, the scattering effect on the incident light mainly depends on the refractive index and incident wavelength for the same kind of particle. The complex refractive index test results of the SiC particles in this paper are shown in Figure 5. It can be seen that the absorption index (k) of the particles gradually increased with λ = 10 μm, where the refractive index (n) was the smallest. Accordingly, as shown in Figure 4b, the scattering factor of the SiC particles with different scales had a minimum at a wavelength of approximately 10 μm.
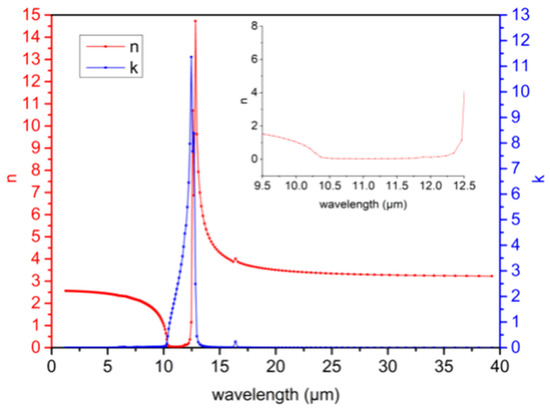
Figure 5.
Complex refractive index of SiC particle changes with different wavelengths.
3.1.2. Radiation Characteristics of SiC Cluster Particles
SiC particles with a diameter of 100 nm were selected as elementary particles, and cluster particles were generated by fractal theory and the DLA model. The equivalent particle sizes after clustering were 0.72, 1.1, 1.28 and 1.5 μm, and the number of elementary particles, N, required were 20, 50, 70 and 100, respectively. The radiation characteristics of four specifications of cluster particles at different wavelengths were calculated using the GMM theory.
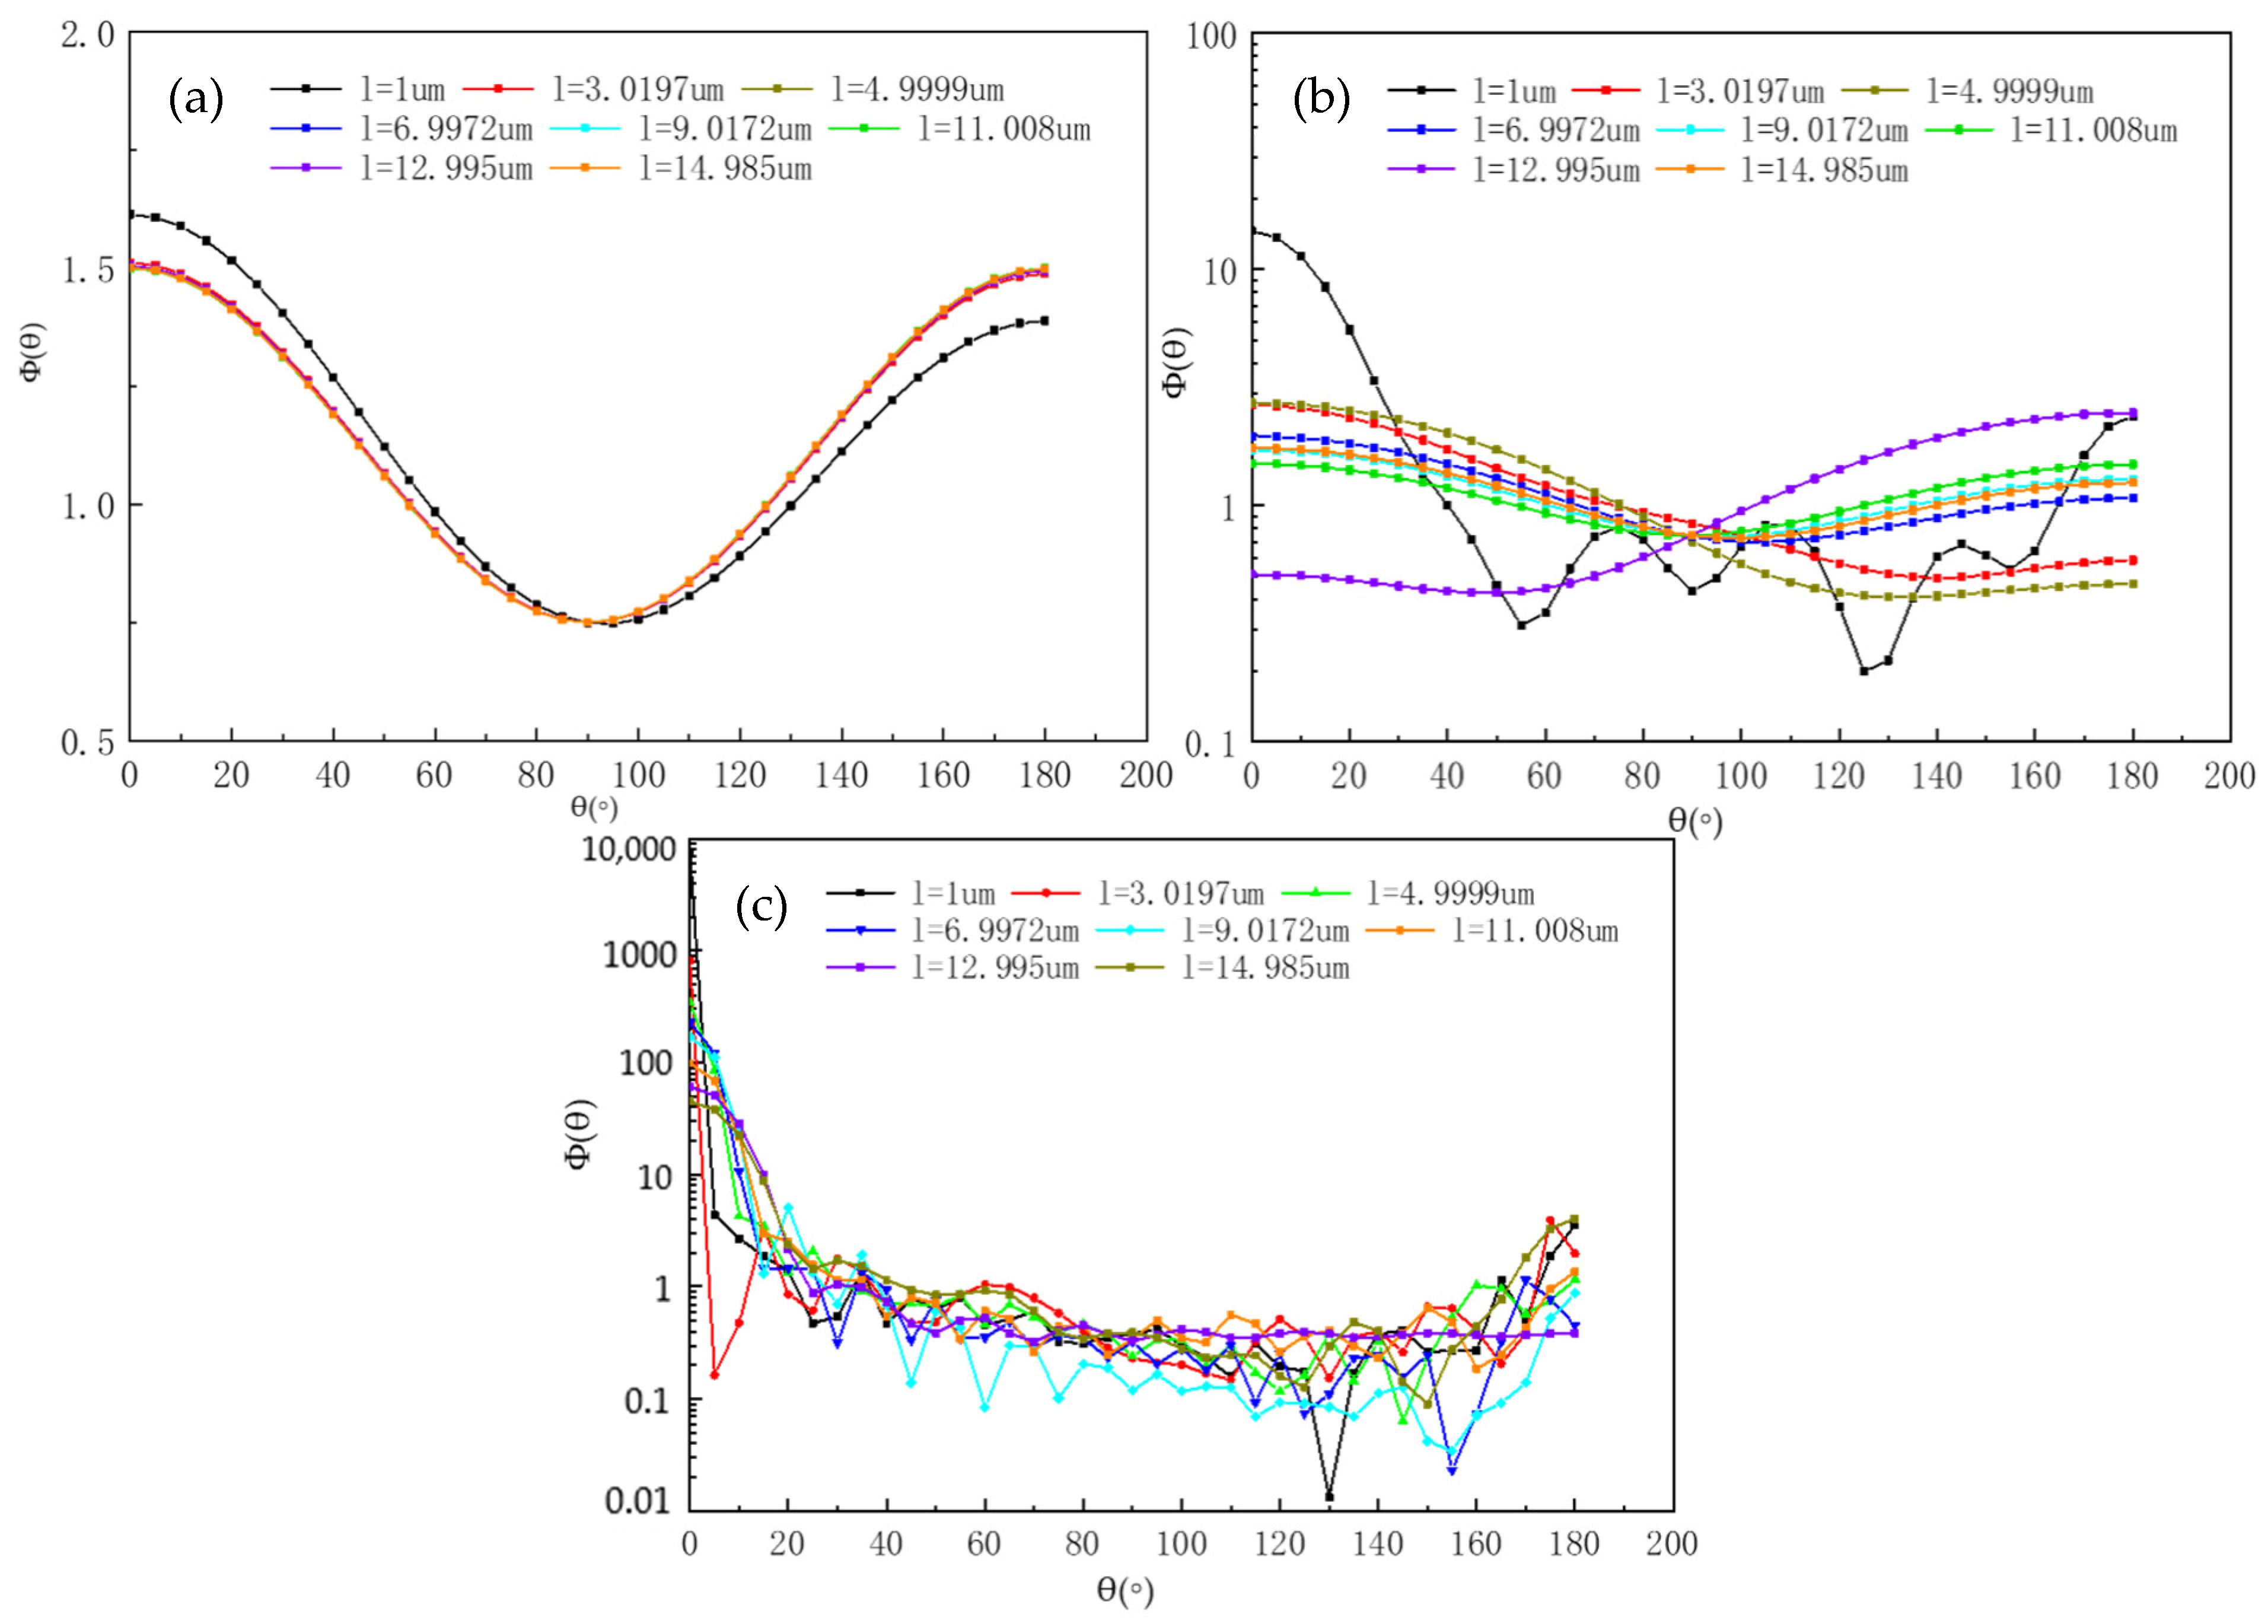
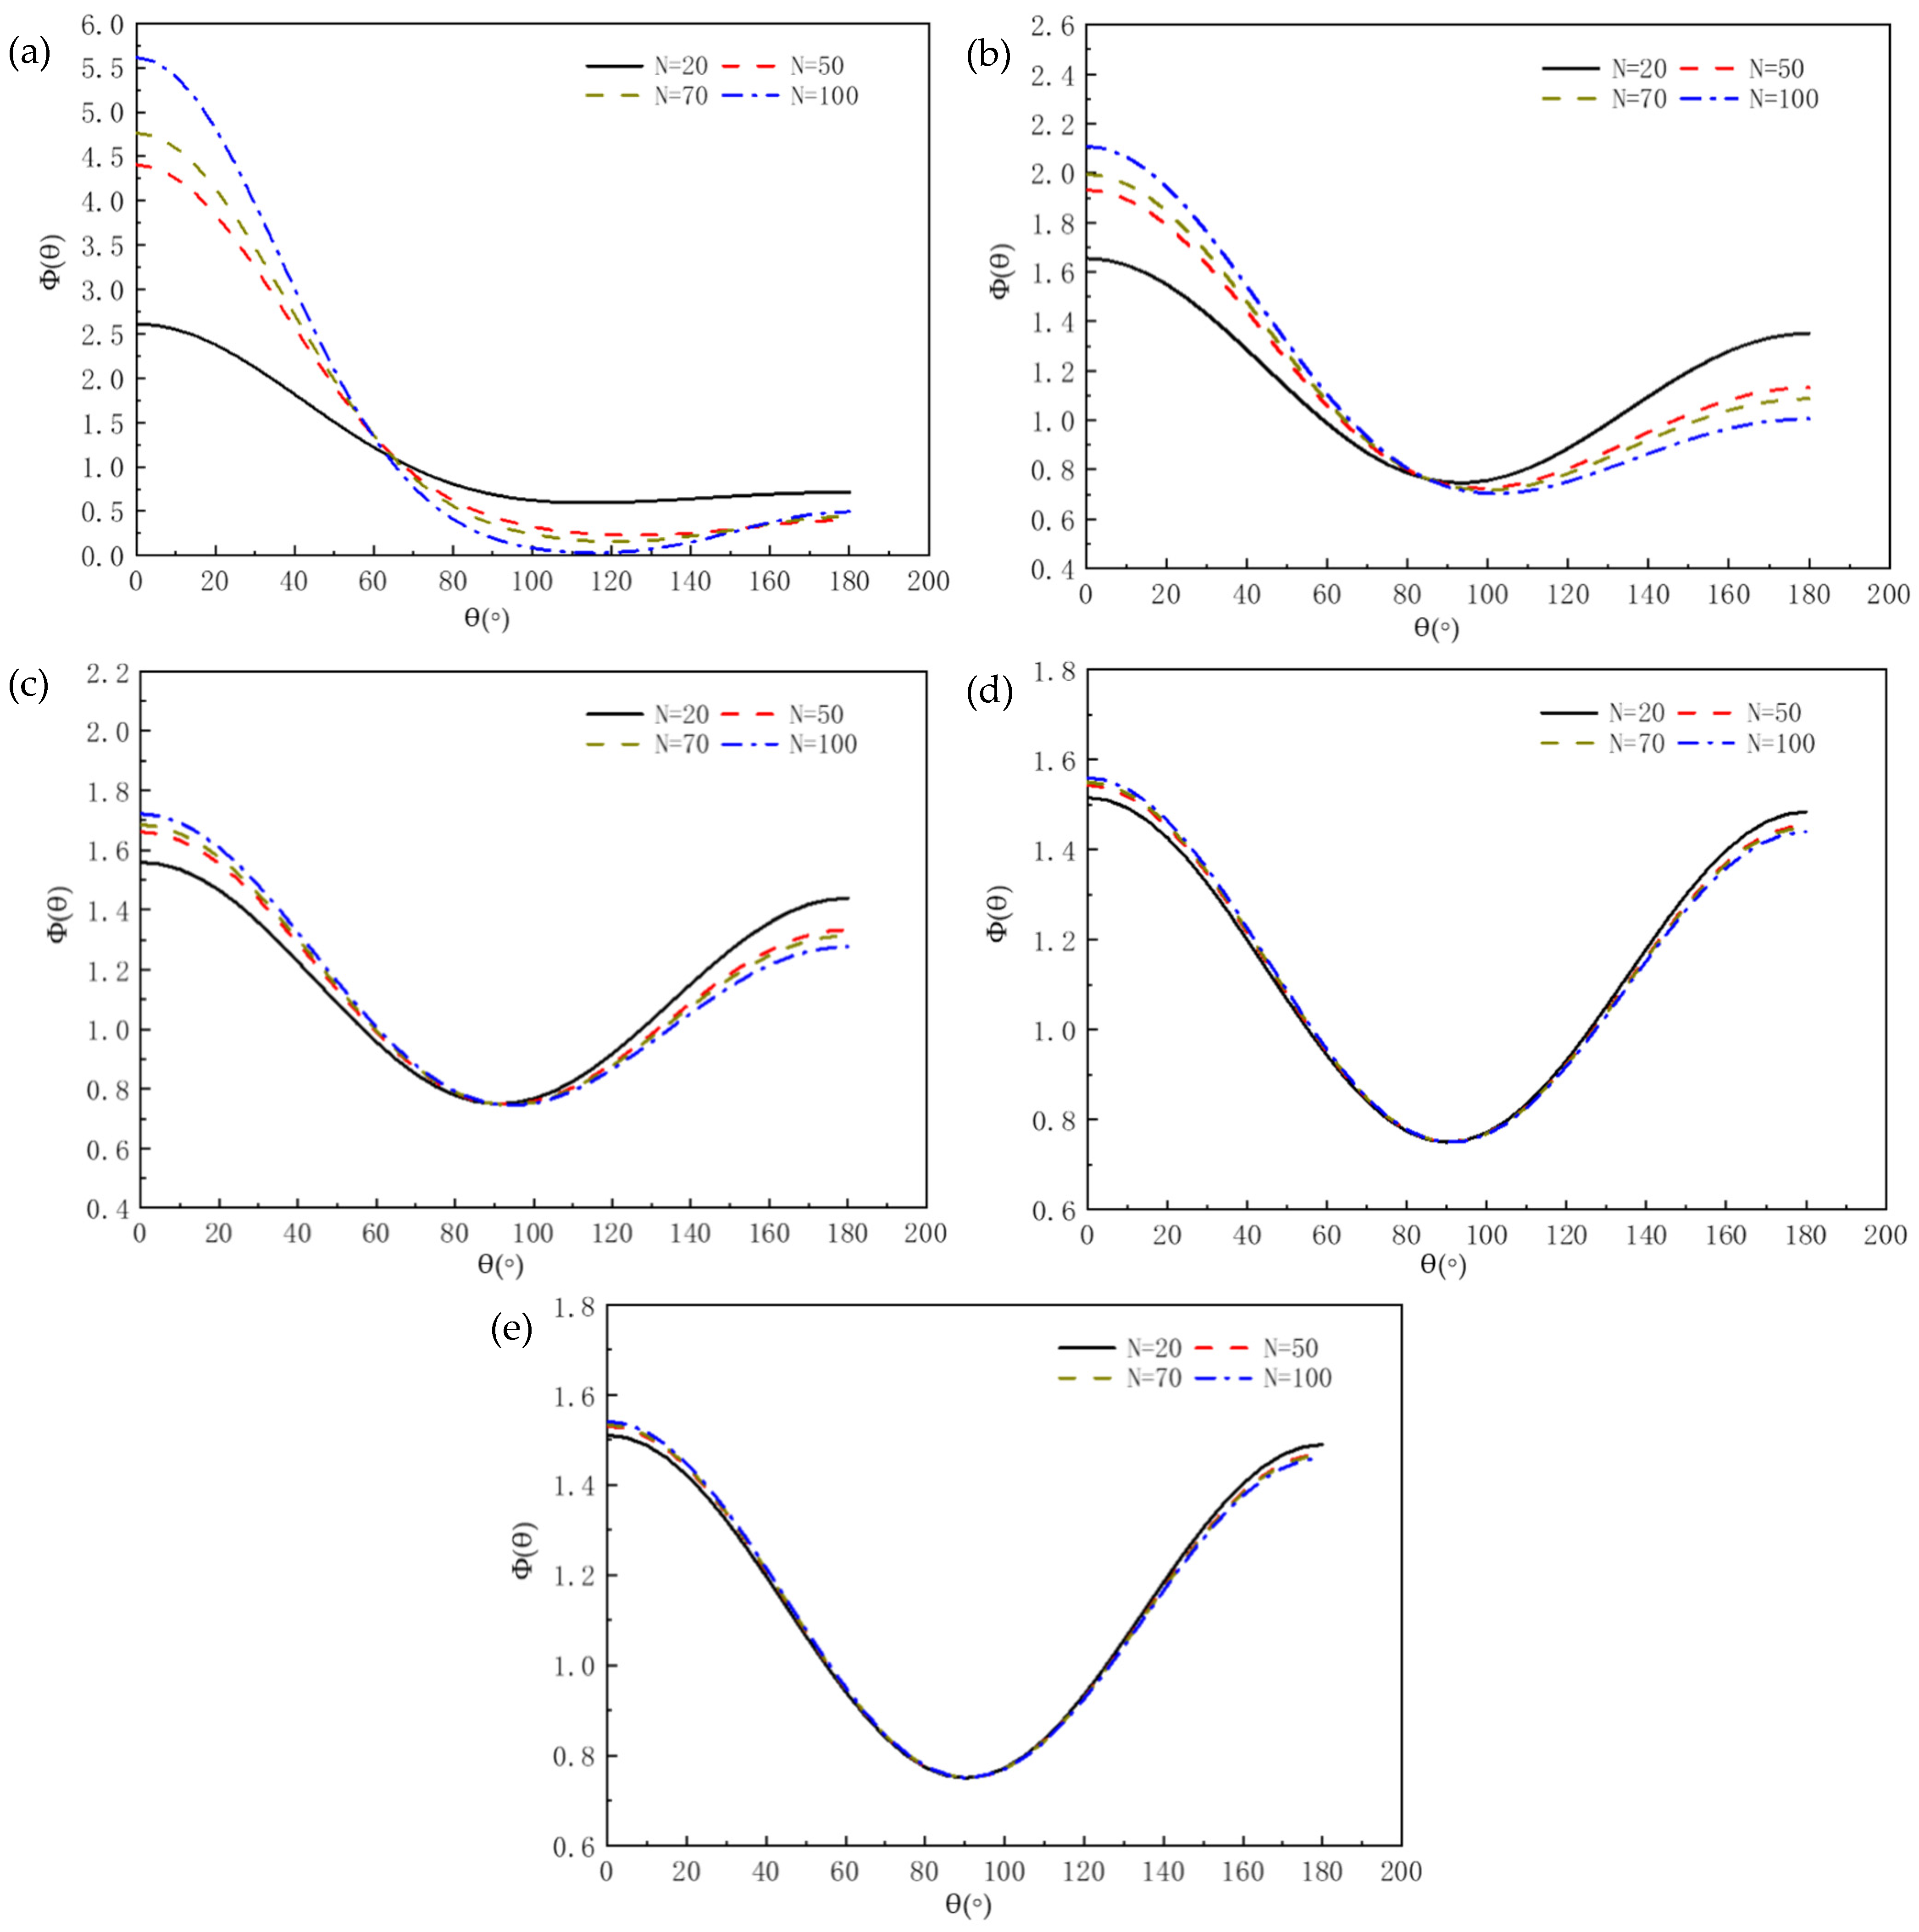
As can be seen from Figure 6, the longer the wavelength, the weaker the forward scattering and the stronger the back scattering of the SiC cluster particles. Meanwhile, the phase function first decreased and then increased with the scattering angle. When λ < 2 μm, the scattering of the cluster particles showed obvious directional imbalance: the forward scattering was significantly greater than the back, and the symmetry of scattering was broken with the angle. When λ > 10 μm, the scattering directionality of the cluster particles still existed, but the forward and backward scattering showed a symmetrical trend.
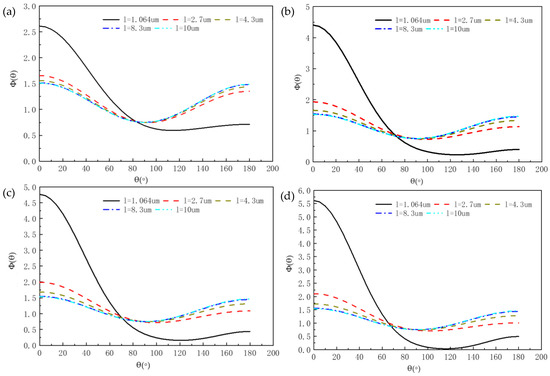
Figure 6.
Scattering phase function of SiC particle changes with different cluster sizes at different wavelengths: (a) N = 20; (b) N = 50; (c) N = 70; (d) N = 100.
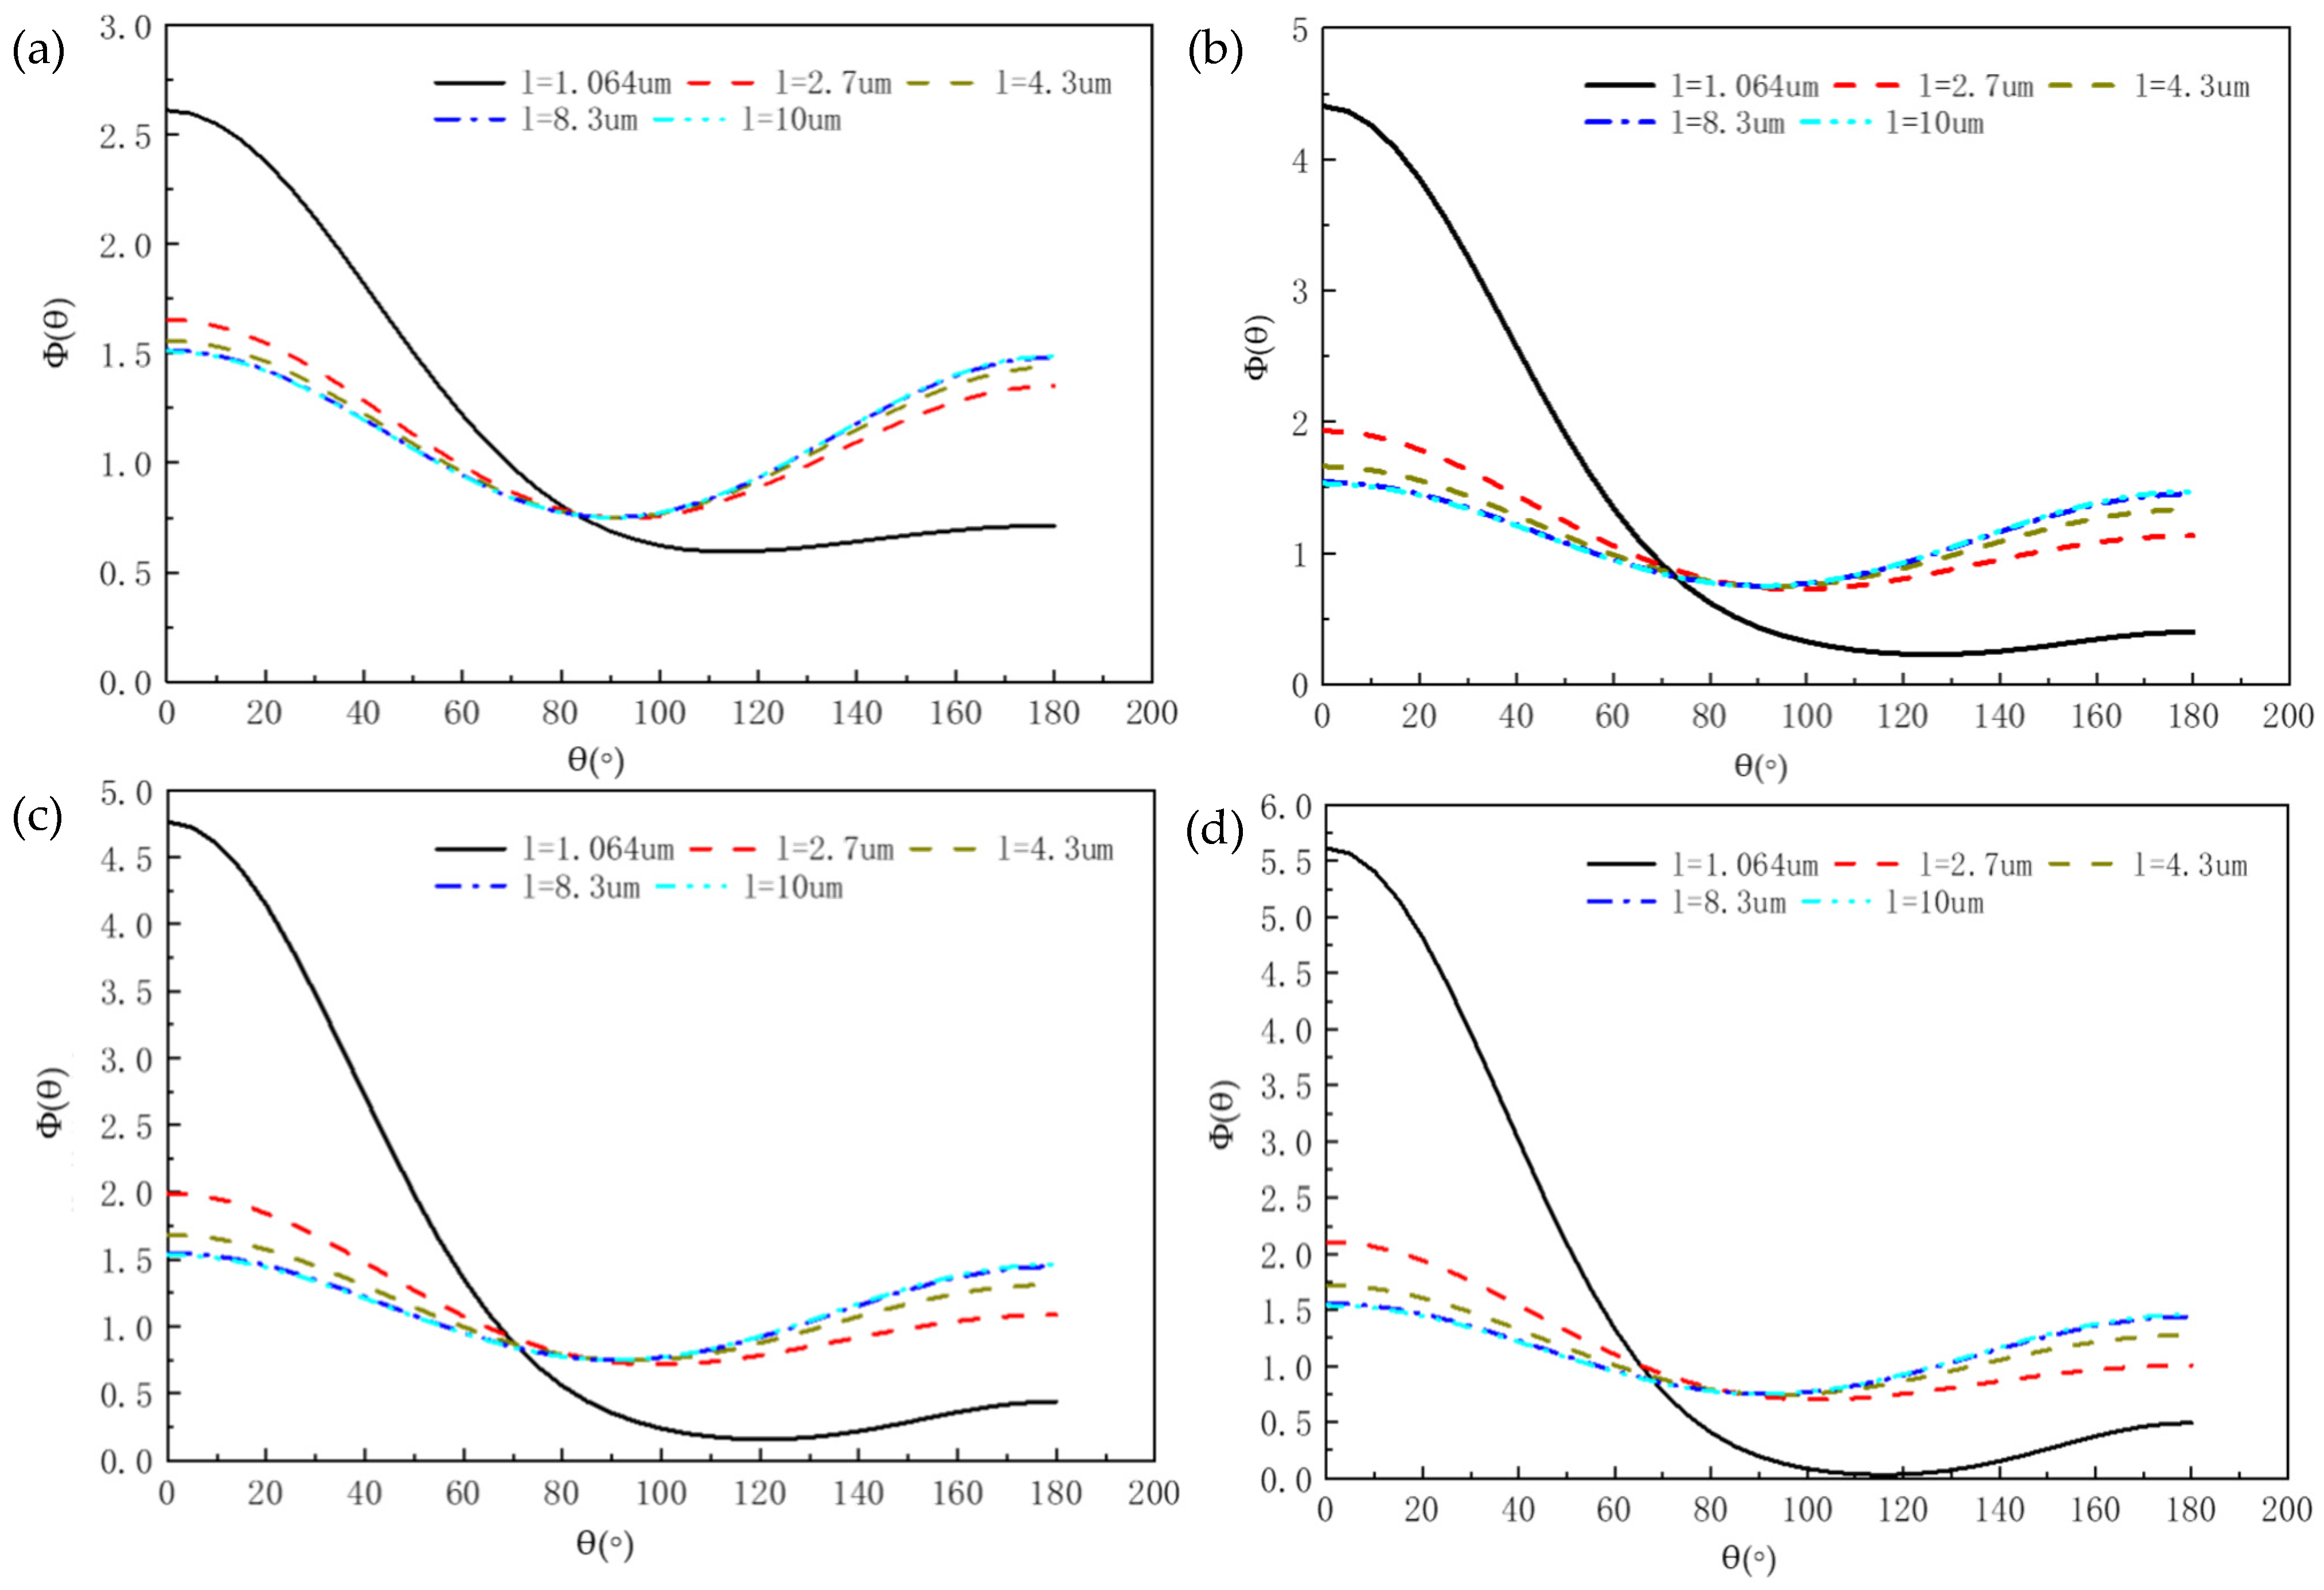
Figure 7a–c show that the larger the SiC cluster particles, the greater the forward scattering and the smaller the backscattering. However, with the increase in the wavelength, the influence of the particle size on the phase function became smaller. When λ = 10 μm, the forward and backward scattering distributions of particles of all sizes tended to be symmetrical as shown in Figure 7d,e.
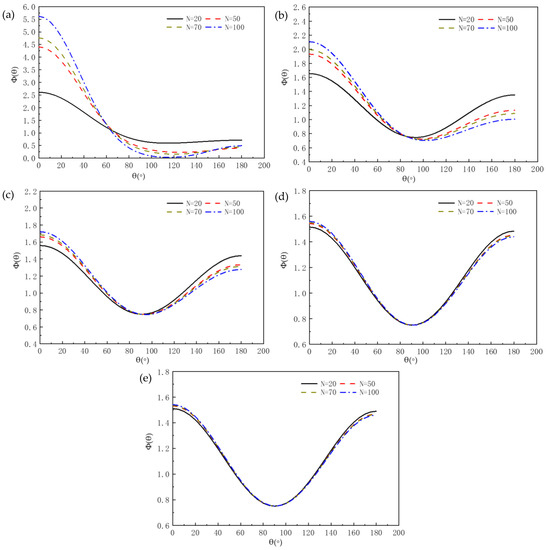
Figure 7.
Scattering phase functions of SiC cluster particle changes at different wavelengths: (a) λ = 1.064; (b) λ = 2.7; (c) λ = 4.3; (d) λ = 8.3; (e) λ = 10 μm.
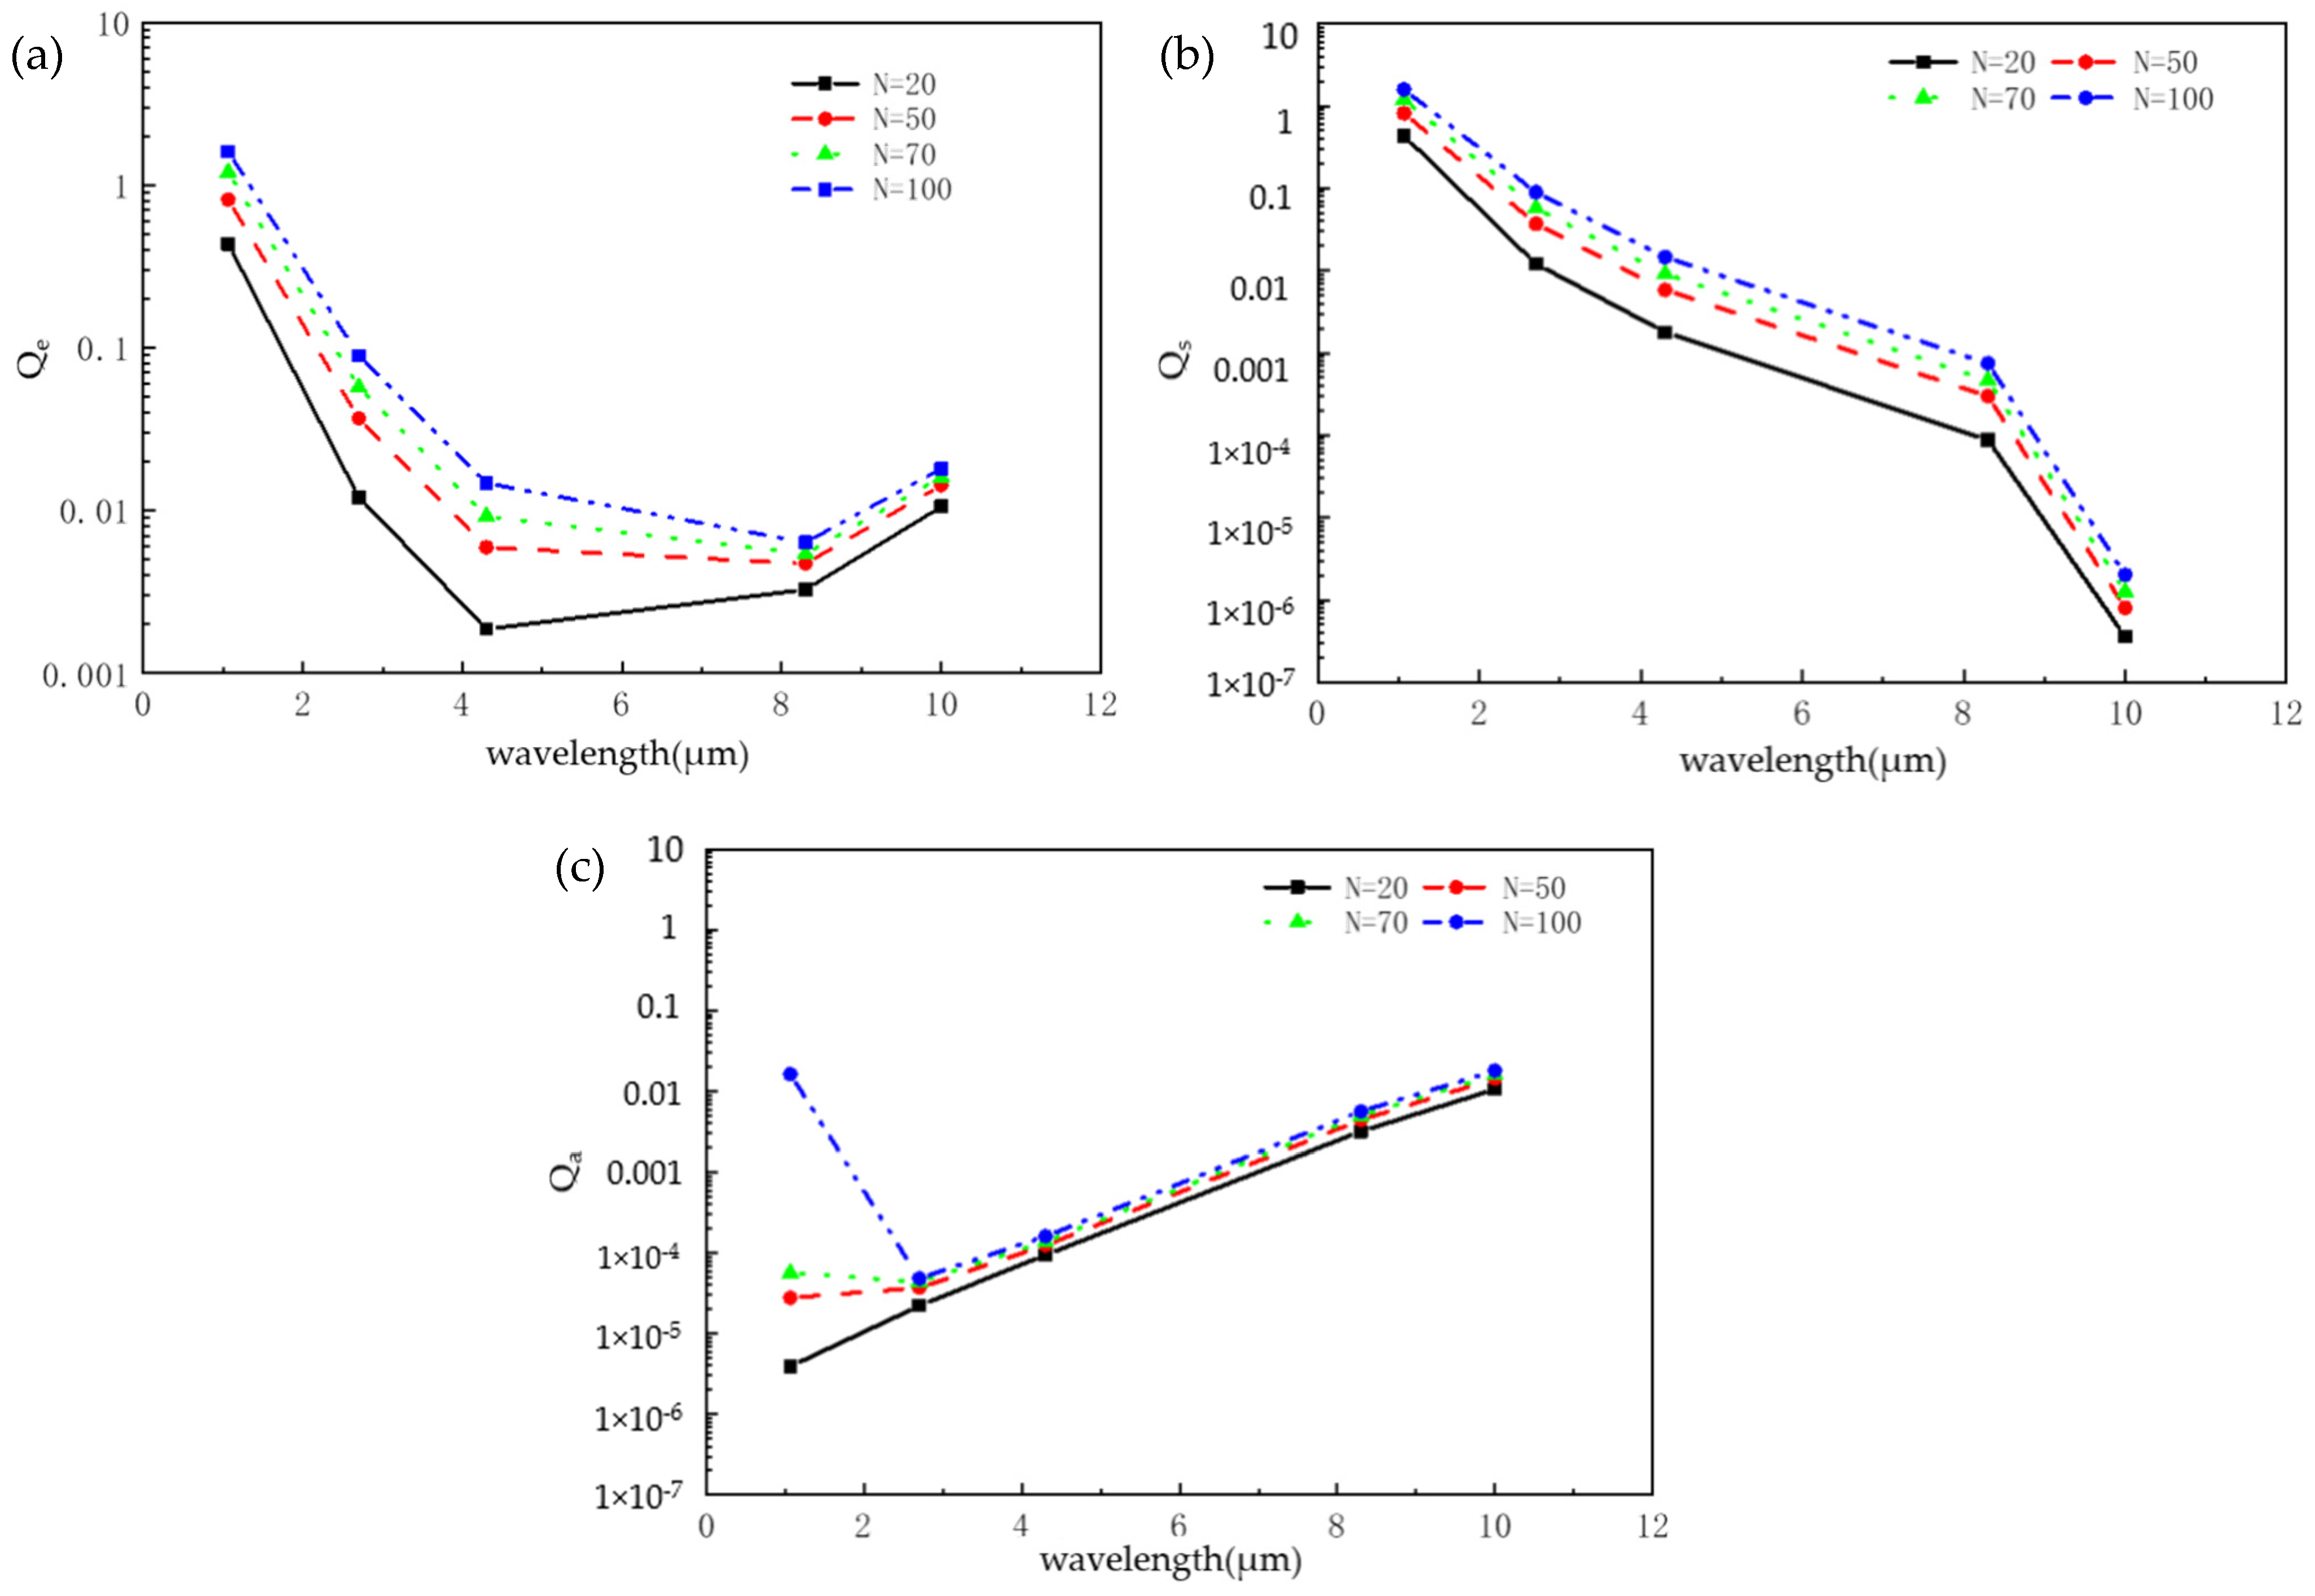
As shown in Figure 8, when λ < 4 μm, the Qe of SiC cluster particles with four sizes decreased with the increase in the wavelength, and when 4 μm < λ < 6 μm and N = 20, the one increased with the increase in the wavelength, but it still decreased with other sizes. When 8 μm < λ < 10 μm, the Qe of all sizes increased with the increase in the wavelength. The Qs decreased with the increase in the wavelength. When λ < 2.7 μm and N = 100 and 70, the Qa decreased with the increase in the wavelength, but increased with N = 20 and 50, and when λ > 2.7 μm, it increased with the increase in the wavelength for all sizes.
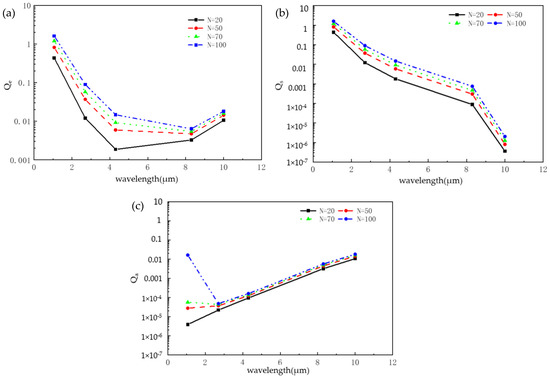
Figure 8.
The radiation properties of SiC clusters with different sizes at different wavelengths: (a) extinction factor (Qe); (b) scattering factor (Qs); (c) absorption factor (Qa).
3.2. Experimental Results
In this paper, two batches of SiC nanoparticles from the Forsman company Forsman Technology Co., Ltd (Beijing, China) (batch no. 200810 and 200330) were selected as the test samples, and the nominal particle size was 100 nm. After subsequent testing, the samples had problems of uneven scale and agglomeration, and the actual particle sizes were not uniformly 100 nm.
3.2.1. Morphology and Structure Analysis
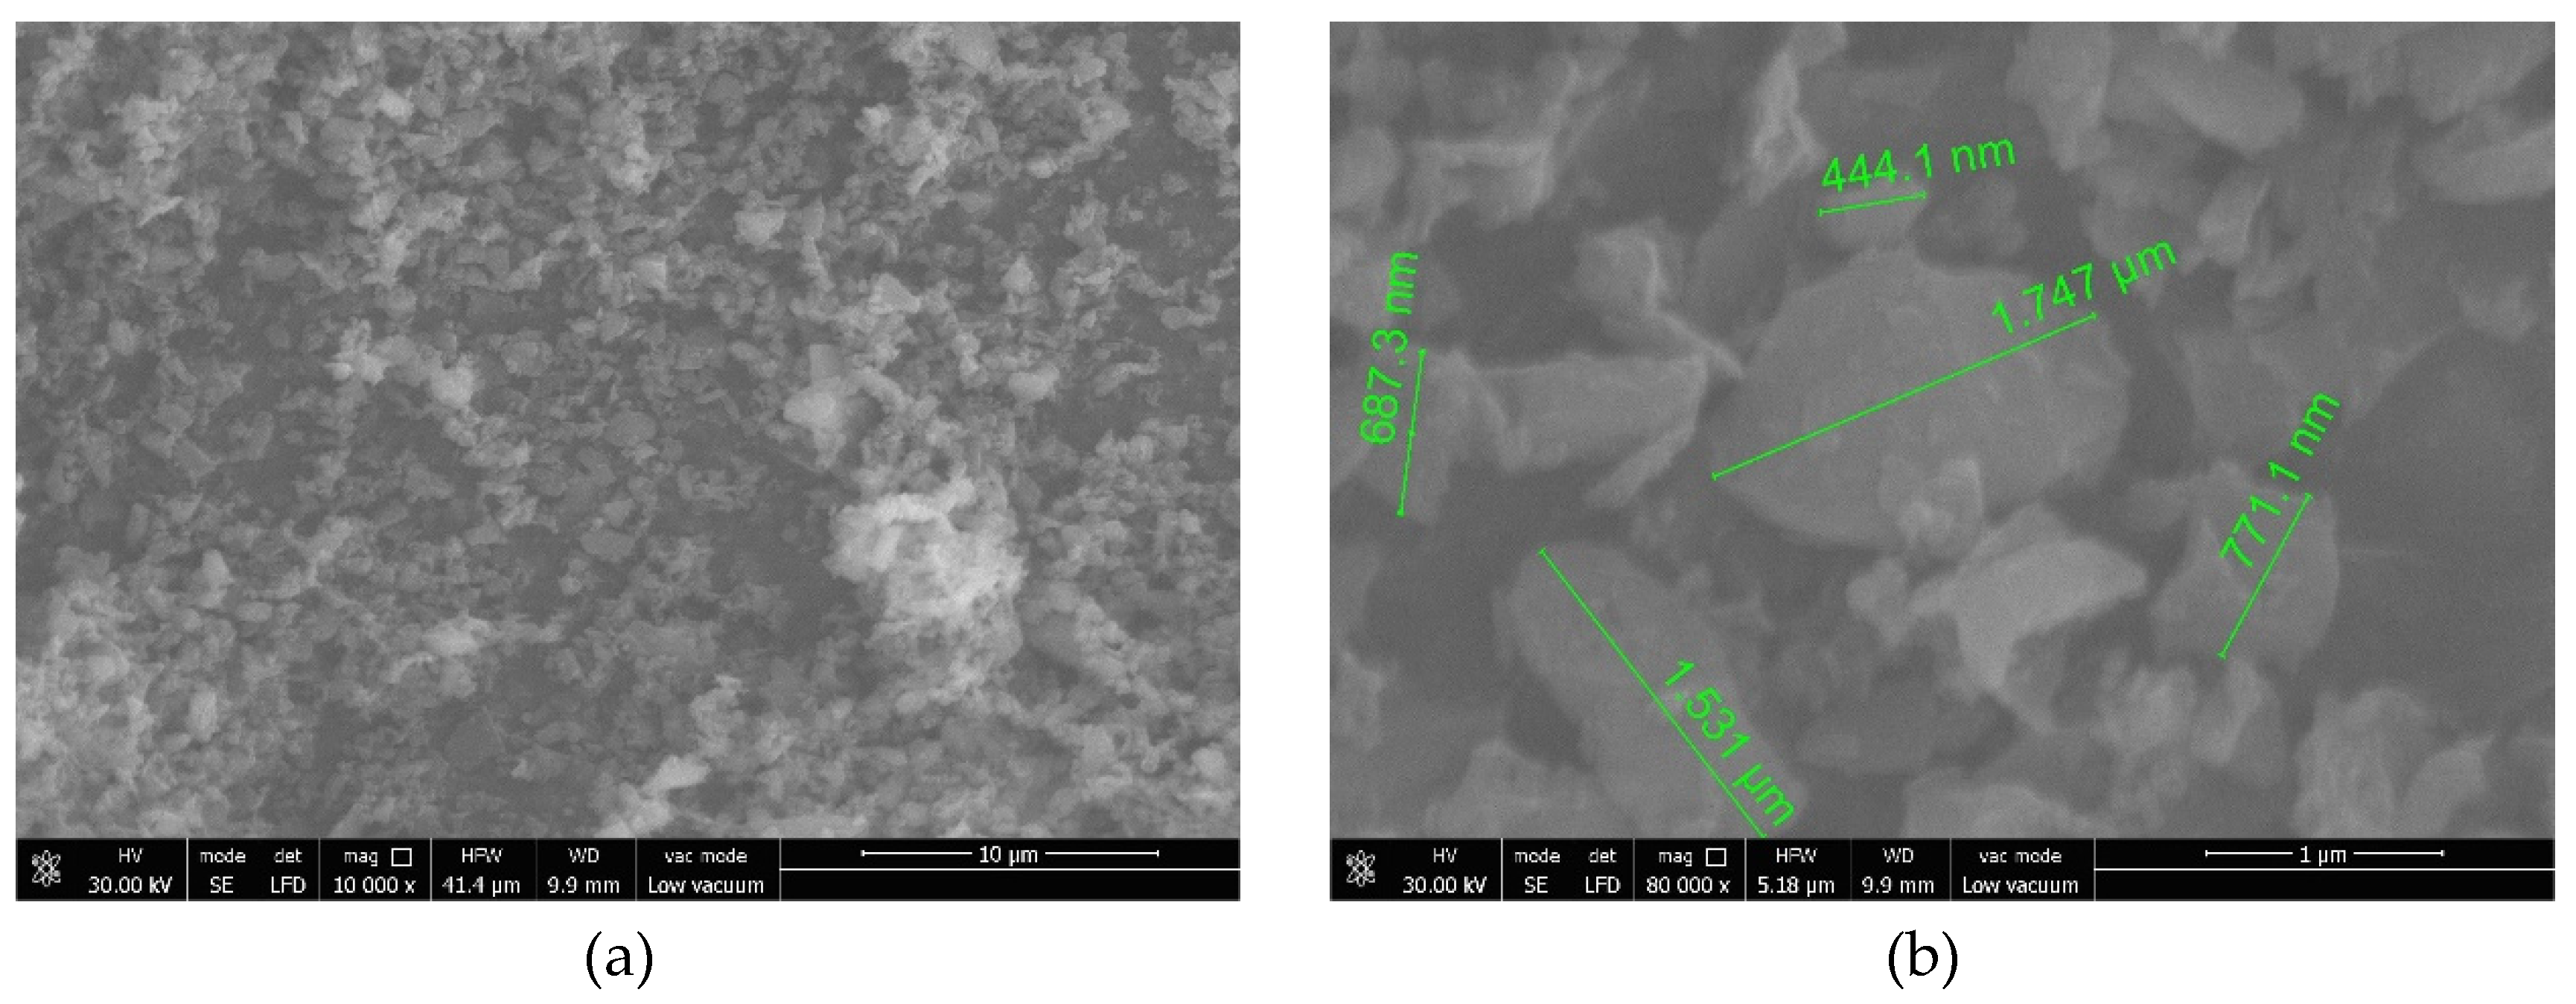
As shown in Figure 9, sample #1 (i.e., No. 200810) did not show obvious agglomeration, but after further amplification, it can be seen that the SiC nanoparticles were irregular in shape and had poor particle size uniformity but almost no agglomeration. Figure 10 shows that sample #2 (i.e., No. 200330) seriously agglomerated, larger particles were obviously visible and the agglomerated particles were similar to spherical particles.

Figure 9.
SEM images of SiC sample #1: (a) 10,000 times; (b) 80,000 times.
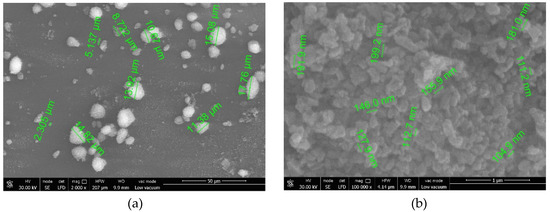
Figure 10.
SEM images of SiC sample #2: (a) 2000 times; (b) 100,000 times.
3.2.2. Particle Size Analysis
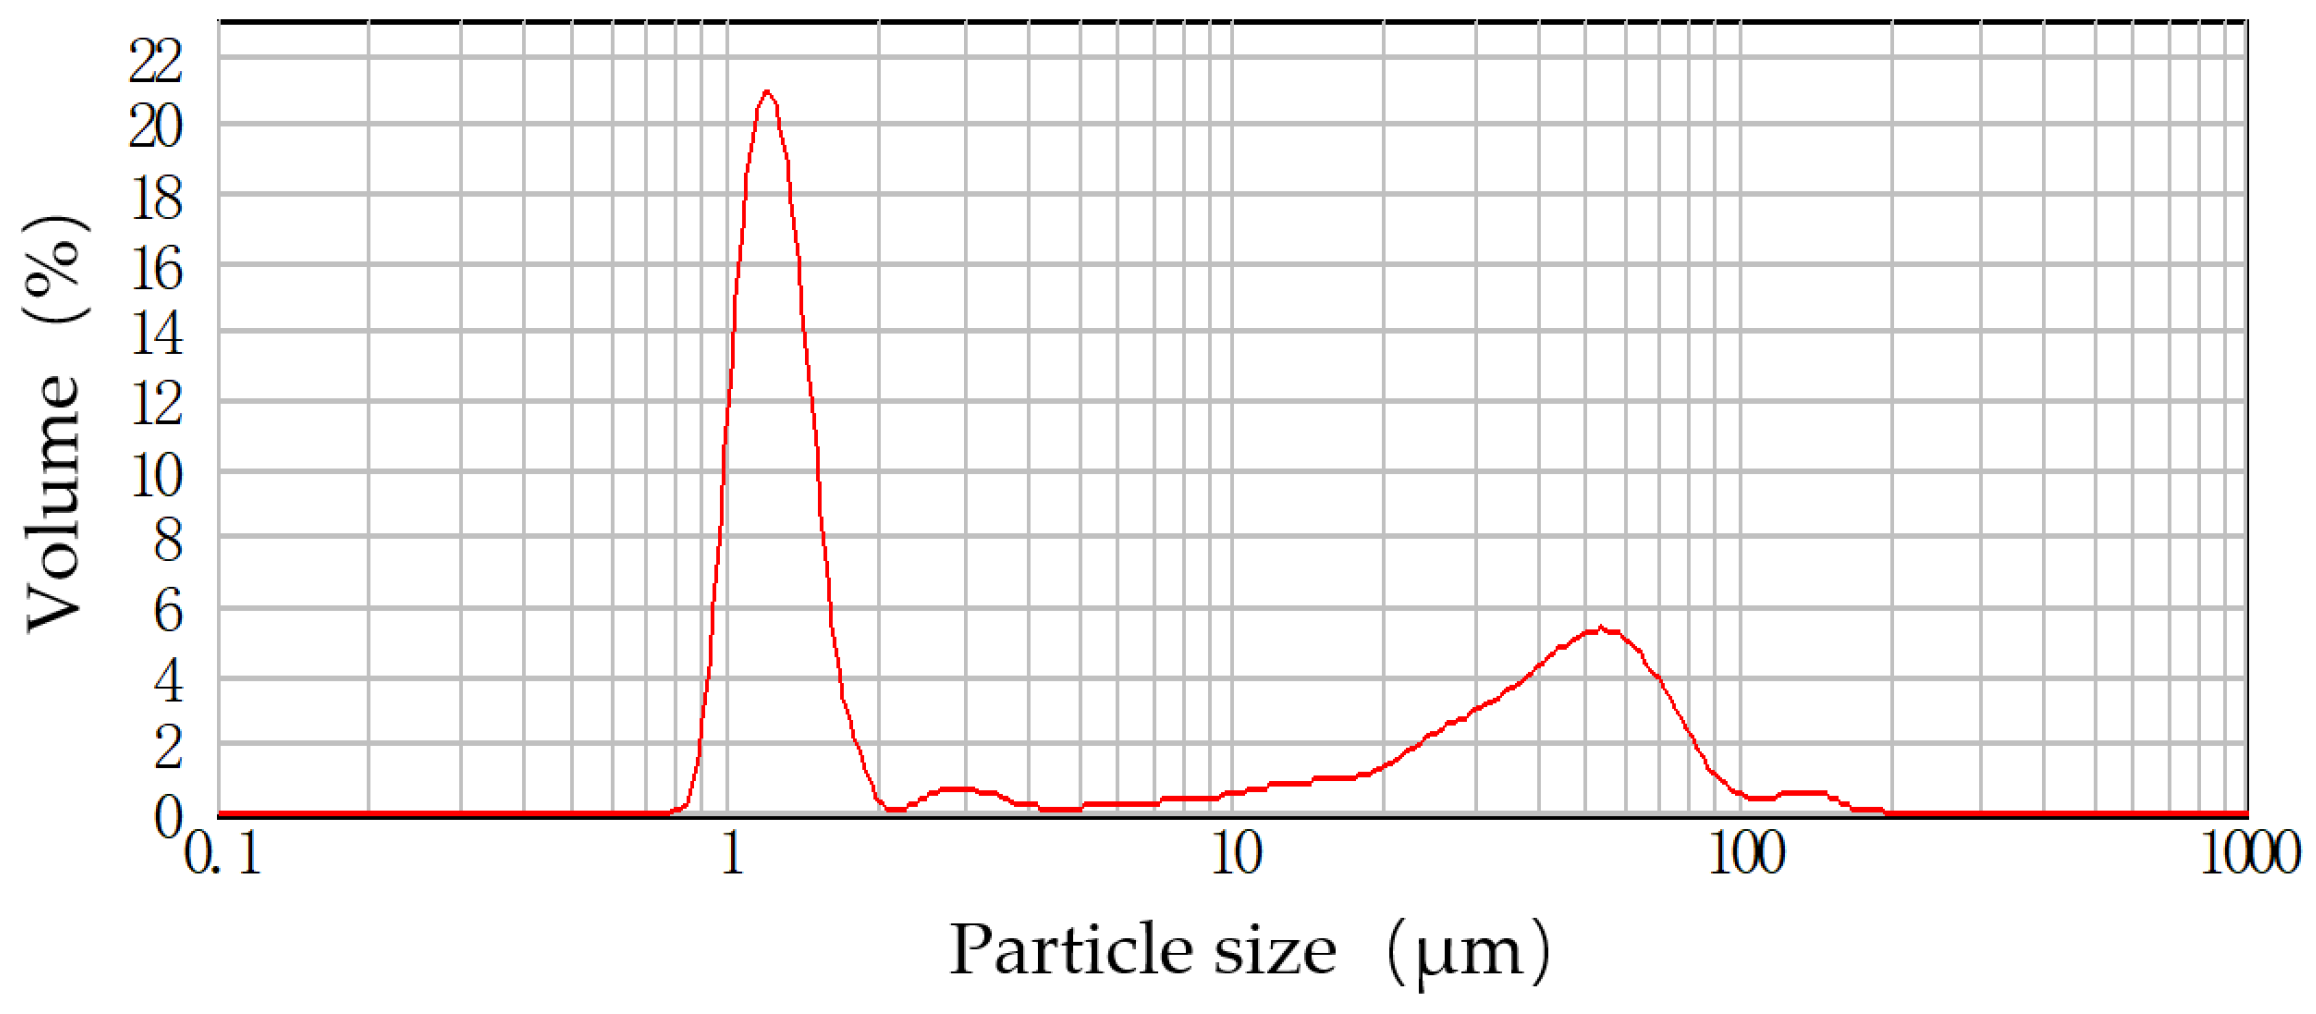
Figure 11 shows the particle size distribution fitting curve of SiC sample #1 with D10 = 1.075, D50 = 1.493 and D90 = 60.784 μm. It can be seen that there were double peaks in the particle size distribution, and there were many large-sized particles mixed in the material. Combined with the SEM test results, this reveals that the size uniformity of the purchased material was not very good.
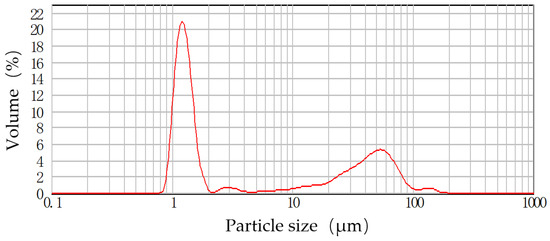
Figure 11.
Particle size distribution of SiC sample #1.
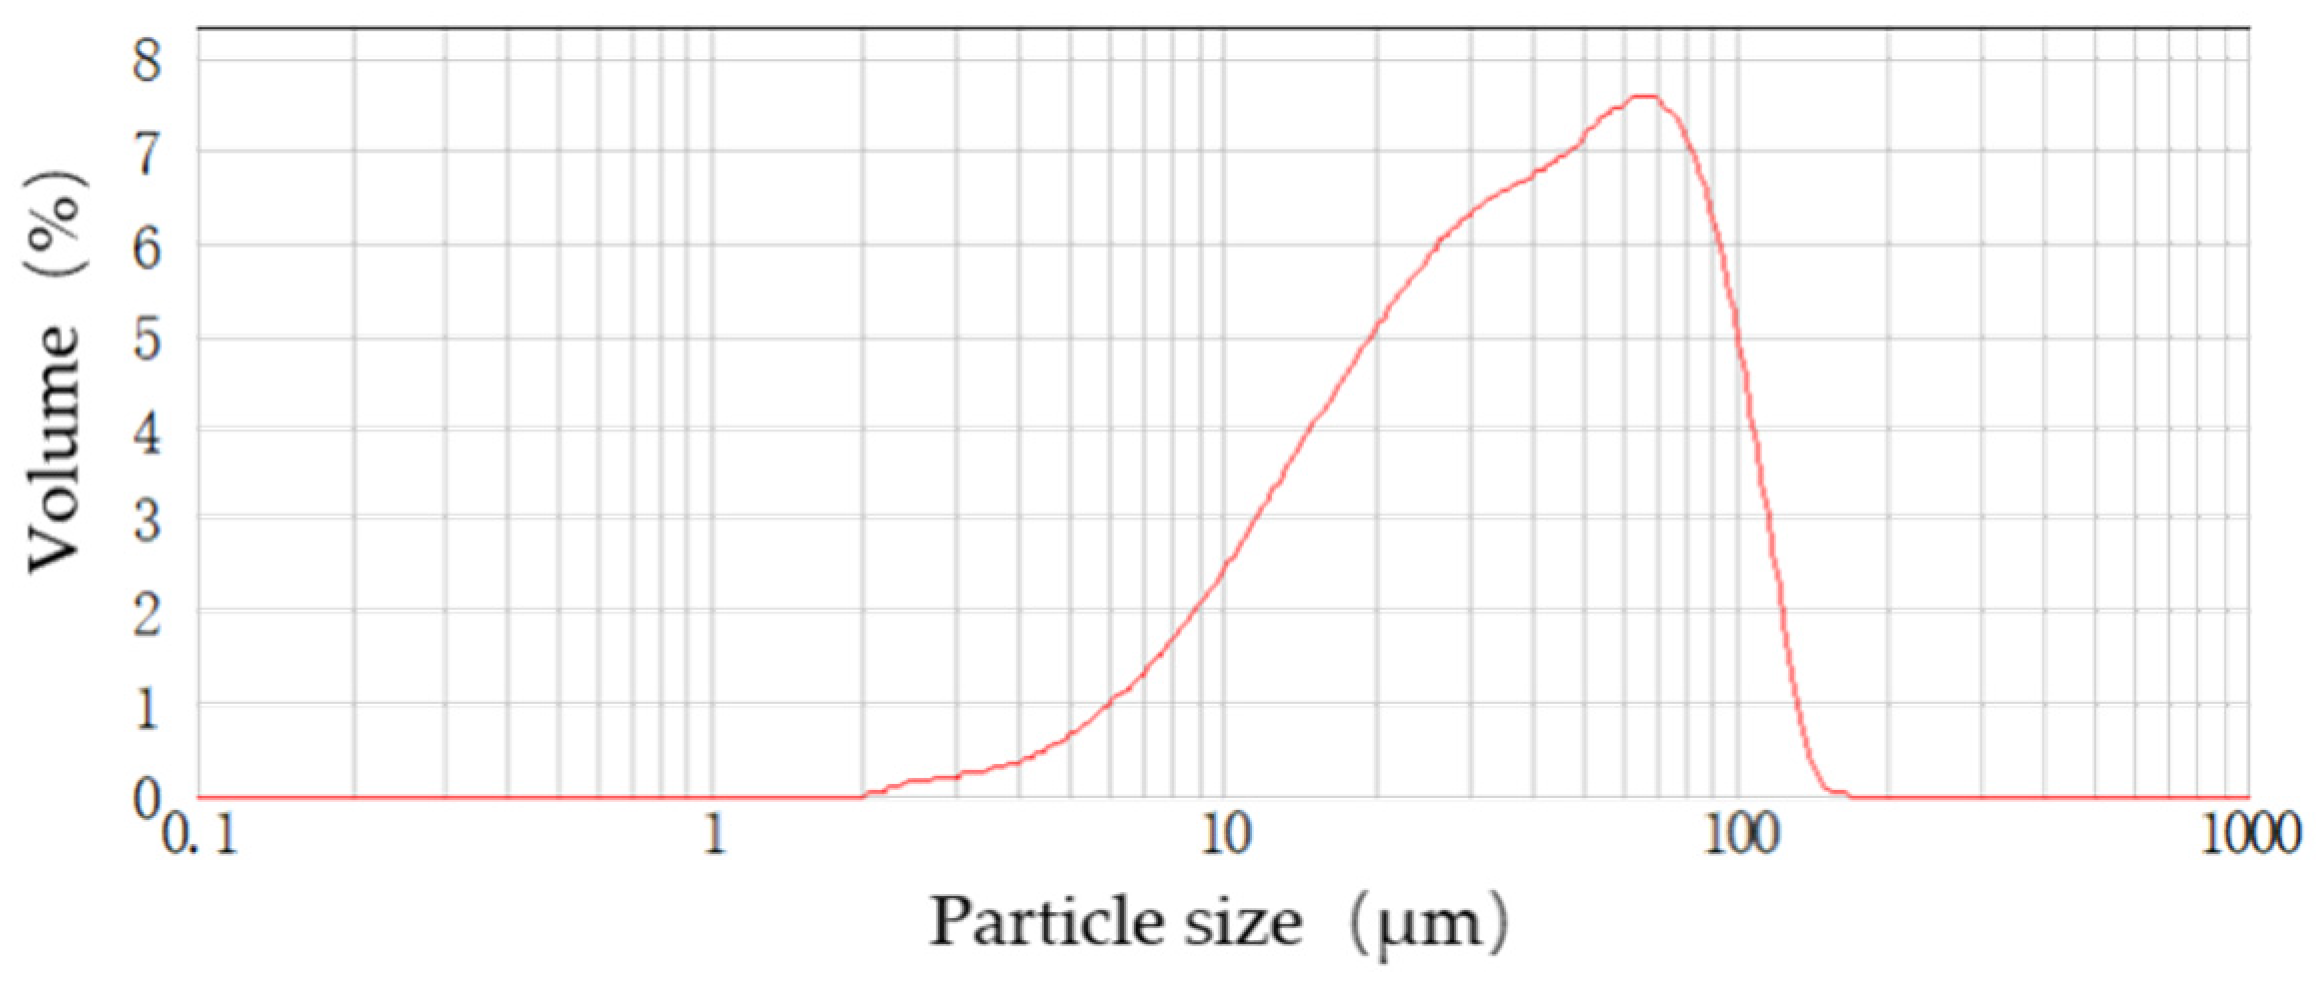
Figure 12 shows the particle size distribution fitting curve of SiC sample #2 with D10 = 11.382, D50 = 38.146 and D90 = 89.825 μm. The dispersion (D) of SiC sample #2’s particle distribution was approximately 2.056, which is obviously greater than 1, indicating that the particle size distribution of sample #2 was very wide and the size uniformity was poor. Combined with the SEM results, it can be seen that the particles were seriously agglomerated, and the large-scale particles were mainly formed by particle clusters.

Figure 12.
Particle size distribution of SiC sample #2.
3.2.3. ATR-FTIR Infrared Spectrum Analysis
The infrared spectra of the samples were obtained by ATR-FTIR. As shown in Figure 13a, when 2 μm < λ < 10 μm, the infrared extinction of sample #1 decreased gradually with the increase in the wavelength. When λ > 10 μm, with the increase in the wavelength, it increased significantly and reached its peak at a wavelength of 13.5 μm, and then it decreased with the increase in the wavelength. However, the overall extinction remained above 90%, which was mainly due to the wide particle size distribution and serious multiscale agglomeration of the test samples.
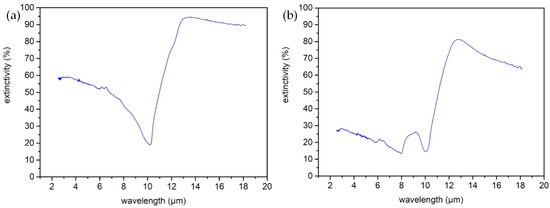
Figure 13.
FTIR curves of SiC particle samples: (a) sample #1; (b) sample #2.
As shown in Figure 13b, the extinction of sample #2 decreased gradually with the increase in the wavelength when 2 μm < λ < 8 μm, but it increased significantly with λ > 10 μm, and it reached its peak value at λ = 12.8 μm, and then it decreased slightly. By comparing Figure 13a,b, we can predict that for the same particle material, the peak width and value of the particle size distribution and the existence of cluster particles will have an impact on the macro-radiation characteristics of the particles, and the quantitative impact relationship needs to be further studied.
4. Discussion
4.1. Different Particle Distribution States Led to Different Scattering Directionalities of the SiC Particles
For elementary particles, when λ < 10 μm, the change in the particle size had little effect on the scattering directionality of particles, and the scattering of particles in all directions was relatively balanced and symmetrical. When λ > 10 μm, the scattering properties of the large-scale particles showed obvious directionality.
For cluster particles, when λ < 10 μm, the scattering of the cluster particles showed an obvious directional imbalance: the forward scattering was significantly greater than the back, and the symmetry of the scattering was broken with the angle. The scattering directionality of the cluster particles still existed when λ > 10 μm, but the forward and backward scattering showed a symmetrical trend. Compared with the elementary particles of the same scale, the change range of the scattering directivity of the cluster particles was much smaller. Particle clusters make the scattering directivity of the particles relatively weak and the scattering more balanced.
4.2. SiC Particle Size Distribution Had a Significant Effect on Its Radiation Performance
Figure 14 shows that when λ < 10 μm, the particle size distribution had little effect on the extinction performance, and the extinction decreased with the increase in the wavelength.
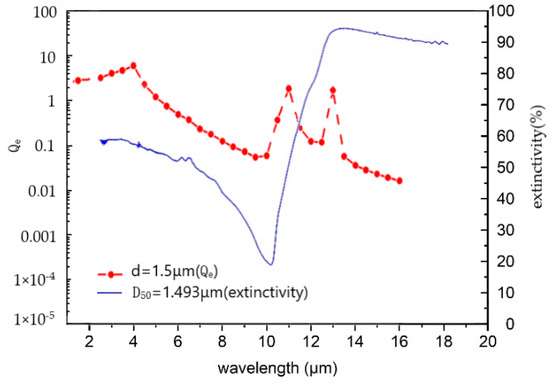
Figure 14.
Comparison between the simulation results of the spectral extinction factor of the SiC elementary particles and the test results of the spectral extinction performance of sample #1.
The extinction reached the lowest when λ = 10 μm, which may be caused by the minimum particle scattering factor.
When λ > 10 μm, the extinction performance of the sample was significantly enhanced and greater, which was different from that of the ideal elementary particles. The preliminary analysis is that the long wave extinction performance of the particles was enhanced, especially the scattering factor, due to the large dispersion of the particle size distribution and the very large proportion of large-scale particles. This reveals that increasing the dispersion of the particle size distribution and the proportion of large-scale particles can significantly improve the long-wave extinction performance of the sample.
4.3. The Influence of SiC Particle Clusters on Their Radiation Performance Was Related to the Cluster Size
As shown in Figure 15, when 1 μm < λ < 10 μm, the extinction factor of the SiC cluster particles was smaller than that of the SiC elementary particles with the same “particle” size.
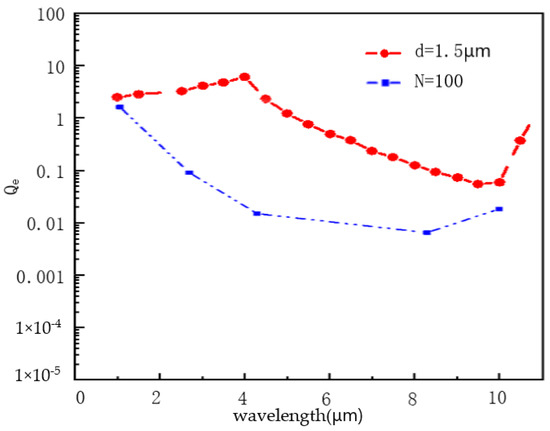
Figure 15.
Comparison of the extinction factors in the simulation between the SiC elementary particles and cluster particles with the same “particle” size.
In Figure 16, when λ > 10 μm, the extinction performance of the SiC cluster particles was significantly enhanced, and the influence of the scale was more significant. It can be seen that a large number of cluster particles greatly increased the proportion of large-scale particles in the sample and significantly improved the extinction performance of the particle samples in long wavelengths as mentioned above.
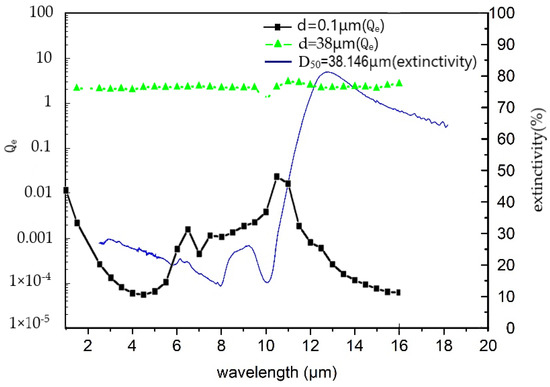
Figure 16.
Comparison between the simulation results of the extinction performance of the SiC elementary particles with two particle sizes and the test results of SiC sample #2.
5. Conclusions
This work explored the influence of the distribution morphology of nanoparticles on their radiation performance. The results showed that SiC elementary particles and cluster particles exhibited different scattering directions for different wavelengths, and the symmetry and fluctuation amplitude of the scattering directions were directly related to the wavelength, particle size and agglomeration state. The particle size distribution had a significant impact on the radiation performance of the elementary SiC particles. An increase in the proportion of large-scale particles in the particle size distribution can significantly enhance the extinction performance of SiC particles at long wavelengths. The influence of SiC cluster particles on their extinction performance was related to the cluster size and wavelength. The large number of cluster particles greatly increased the proportion of large-scale particles in the samples and, thus, could also significantly improve the extinction performance of the sample in long wavelengths. This indicates that it is promising to obtain the desired optical properties by regulating the distribution morphology of the particles.
Author Contributions
Conceptualization, Y.L. and Q.W.; calculation, Y.L. and S.D.; data analysis, Y.L.; data measurement, X.W. and Y.L.; writing and editing, Y.L. All authors have read and agreed to the published version of the manuscript.
Funding
This research received no external funding.
Acknowledgments
I would like to express my heartfelt thanks to the Forsman Company for the material samples.
Conflicts of Interest
The authors declare no conflict of interest.
References
- Shor, J.; Zhang, X.; Osgood, R. Laser-Assisted Photoelectrochemical Etching of n-type Beta-SiC. J. Electrochem. Soc. 1992, 139, 1213–1216. [Google Scholar] [CrossRef]
- Casady, J.; Johnson, R.W. Status of silicon carbide (SiC) as a wide-band gap semiconductor for high-temperature applications. Solid-State Electron. 1996, 39, 1409–1422. [Google Scholar] [CrossRef]
- Greffet, J.-J.; Carminati, R.; Joulain, K.; Mulet, J.-P.; Mainguy, S.; Cheng, Y. Coherent emission of light by thermal sources. Nature 2002, 416, 61–64. [Google Scholar] [CrossRef] [PubMed]
- Hillenbrand, R.; Taubner, T.; Keilmann, F. Phonon-enhanced light-matter interaction at the nanometre scale. Nature 2002, 418, 159. [Google Scholar] [CrossRef] [PubMed]
- Xiang, Z.N.; He, Q.C.; Wang, Y.Q.; Ren, L.G. Synthesis and wave absorption properties of hollow SiC spherical nanoparticles. Nonferrous Met. Sci. Eng. 2022, 13, 83–92. [Google Scholar]
- Liu, X.; Cao, L.Z.; Jiang, H.; Song, H. Preparation and photoluminescence of SiC nanoparticles. J. Funct. Mater. 2019, 50, 9093–9096+9101. [Google Scholar]
- Guo, X.X. Preparation, photoluminescence properties and phase transformation of SiC nanoparticles. Ph.D. Thesis, Southeast University, Nanjing, China, 2017. [Google Scholar]
- Guan, Z.; Fang, N.; Li, C.Y.; Ma, S.G.; Liu, H.L.; Mao, L.Q. Gaussian equation is used to analyze the particle size distribution of CoFe2O4 nanocomposite particles. Chem. Res. 2016, 27, 760–762+778. [Google Scholar]
- Huang, H.J.; Zhou, M.B.; Wu, X.; Zang, X.P. Low temperature pressure-less sintering of nano copper paste with bimodal particle size distribution for chip interconnection, nano connection mechanism and joint reliability. J. Mech. Eng. 2022, 58, 58–65. [Google Scholar]
- Tian, Y.P. Strategic thinking on the overall development of urban and rural mass sports in the construction of a harmonious society. China Sports Sci. Technol. 2009, 6, 90–96. [Google Scholar]
- Sun, J. Urban and rural overall planning is an innovation of comprehensive factor overall planning. China Dev. 2008, 12, 59–61. [Google Scholar]
- Wang, H.X.; Sun, H.H.; Song, Z.B.; Liu, D.Z.; Tian, T. Calculation and analysis of particle transmittance based on Monte Carlo method. Infrared Laser Eng. 2012, 41, 1200–1205. [Google Scholar]
- Li, Y.N.; Li, Y.Q.; Wang, Q.; Dong, S.K.; Mu, L.; Liu, J.Q. The optical properties and stability of submicron hollow particles. In Proceedings of the AOPC 2017: Optoelectronics and Micro/Nano-Optics, Beijing, China, 24 October 2017; SPIE: Bellingham, WA, USA, 2017; Volume 10460, p. 1046019. [Google Scholar]
- Li, Y.N.; Mu, L.; Cai, W.L.; Wang, Q.; Liu, X. Research on the extinction performance of particle clouds in space. In Proceedings of the Second Target Recognition and Artificial Intelligence Summit Forum, Beijing, China, 31 January 2020; SPIE: Bellingham, WA, USA, 2020; Volume 11427, p. 1142717. [Google Scholar]
- Tang, J.L. Study and analysis of morphology controlled ZnO nano materials by infrared spectroscopy. Master’s Thesis, Changchun University of Technology, Changchun, China, 2006. [Google Scholar]
- Zhang, Y.H.; Li, Y.L.; Tu, H.Q.; Meng, X.Q. Preparation and infrared absorption properties of Ag/Zn/Ag Nanocomposite particle films. In Proceedings of the National Annual Conference on Functional Materials, Dunhuang, China, 1 July 2006. [Google Scholar]
- Brewster, M.Q. Thermal Radiative Transfer and Properties; John Wiley & Sons: New York, NY, USA, 1992; pp. 315–316. [Google Scholar]
- Xu, Y.L. Electromagnetic Scattering by an Aggregate of Spheres. Appl. Opt. 1995, 34, 4573–4588. [Google Scholar] [CrossRef] [PubMed]
- Yu, Q.Z. Radiation Heat Transfer Principle, 1st ed.; Harbin Institute of Technology Press: Harbin, China, 2000; pp. 170–171. [Google Scholar]


Publisher’s Note: MDPI stays neutral with regard to jurisdictional claims in published maps and institutional affiliations. |
© 2022 by the authors. Licensee MDPI, Basel, Switzerland. This article is an open access article distributed under the terms and conditions of the Creative Commons Attribution (CC BY) license (https://creativecommons.org/licenses/by/4.0/).