Article

Investigating the Shape Memory Effect and Corrosion Resistance of the Fe-(17-2x) Mn-6Si-xNi-yCr-0.3C Alloys (x = 0, 1, 2, 3, 4; y = 0, 1, 3, 5)

1
Department of Materials Science and Engineering, National Taiwan University, Taipei 10617, Taiwan
2
Department of Mechanical Engineering, NFC-Institute of Engineering & Fertilizer Research, Faisalabad 38000, Pakistan
3
Department of Materials Science and Engineering, Feng Chia University, Taichung 40724, Taiwan
*
Author to whom correspondence should be addressed.
Inorganics 2024, 12(10), 262; https://doi.org/10.3390/inorganics12100262
Submission received: 15 July 2024 / Revised: 23 September 2024 / Accepted: 24 September 2024 / Published: 30 September 2024

Abstract

:
In this study, low Mn content Fe-Mn-Si-based shape memory alloys [Fe-(17-2x) Mn-6Si-xNi-yCr-0.3C (x = 0, 1, 2, 3, 4; y = 0, 1, 3, 5)] were prepared via vacuum arc remelting. The alloys were hot-rolled and solid-solution-treated at 1150 °C for 1 h followed by aging at elevated temperatures. The effects of Cr and Ni addition on the shape memory performance and corrosion resistance of the alloys in 3.5 wt% NaCl solutions were investigated using bending test and potentiodynamic polarization, respectively. It was revealed that the recoverable strain of the alloys remains larger than 2% when 1Ni is replaced with 2Mn and Cr is added. However, it becomes less than 2% in 11Mn and 9Mn alloys because of the easy formation of the α’ martensite. The shape memory effect of alloys is highly improved due to the precipitation of fine carbides in the grains by the addition of Cr and after aging treatment at elevated temperatures (≧700 °C). The highest shape recovery ratios of 88.3% for 17Mn0Ni3Cr, 94.0% for 15Mn1Ni3Cr, 94.4% for 13Mn2Ni5Cr, 88.1% for 11Mn3Ni5Cr, and 86.8% for 9Mn4Ni7Cr, respectively, were achieved after 800 °C aging treatment. The strip-like second phase (carbides) forms at the grain boundaries in the Cr-free alloys after 600 °C aging treatment. There are lots of fine carbides (M23C6 and M7C3) precipitated in the interior of the grains at the aging treatments ≧ 700 °C. However, M7C3 is eliminated at 900 °C aging treatment. The corrosion resistance results showed that the corrosion resistance of the alloys is improved by adding Cr. The maximum corrosion potentials (−0.474 V) have been observed for 13Mn2Ni5Cr, and similar mechanisms have been analyzed in all series of alloys.

1. Introduction

Shape memory alloys (SMAs) have been widely used in engineering applications including medicines, dental implants, orthopedic implants, and artificial joints due to their unique characteristics [1]. Efficient SMAs have good shape memory effect (SME), high elasticity, and high mechanical and fatigue strength [2]. The most commonly used SMAs are NiTi, Cu based, and Fe based. Each kind of shape memory alloy is used according to specific properties required for specific applications. The NiTi SMAs are used in biomedical applications due to their biocompatibility, and Cu-based SMAs are more useful in the electronics industry [3,4].
The Fe-based shape memory alloys are promising materials in engineering applications because of their excellent mechanical properties, cost effectiveness, and improved corrosion resistance [5,6]. The SME in SMAs is due to reversible stress-induced γ (FCC) ↔ ε (HCP) martensite phase transformation. Extensive research has been conducted to optimize the polycrystalline SMAs for industrial applications [7]. It has been agreed that the parameters affecting the SME are the alloys’ stacking fault energy, microstructure, and the texture of the austenite phase.
The Fe-Mn-Si alloys have been improved from FeMn alloys, and their shape memory characteristics are mainly due to the mutual conversion of the parent phase γ austenite and ε martensite. However, due to the magnetic properties and structure, α’ martensite is generated. When both ε martensite and α’ martensite exist in the alloy, α’ martensite will hinder the reverse transformation of ε martensite → γ austenite, resulting in reduced shape memory effect [8,9,10,11]. Kikuchi et al. [12] tried to add a Si element and found that it cannot only resolve the magnetic problem but also inhibit the formation of α’ martensite, which greatly enhances the shape memory effect. Fe-Mn-Si alloys are cheap and easy to process. Although the Ms temperature is relatively high, this problem can be solved by adding alloying elements or heat treatment [13,14,15]. Therefore, the current academic and industrial circles are committed to developing Fe-Mn-Si-based shape memory alloys.
The Fe-Mn-Si-based SMAs contain 15%~30% Mn in order to stabilize (FCC)↔ε(HCP) transformation [16,17]. The stability of ε-martensite will decrease with the decrease in Mn contents, and α’-martensite (BCC) will increase. The decreased Ms temperature, due to lower Mn contents, is compensated with 4%~5% Ni. The addition of 6 wt%Si is compulsory to control stacking fault energy and antiferromagnetic ordering temperature [5,18]. Min et al. [19,20] introduced 0.3 wt% C into the Fe-17Mn-6Si alloy and found that it can still maintain good shape memory performance with recoverable strain greater than the 2%. The carbides form interstitial solid solution and cause a large number of lattice distortions, generate very large internal stress, and reduce its corrosion resistance [21].
The shape memory effect and corrosion resistance of the SMAs can be improved by various ways such as adding alloying elements, grain refinement, thermal cycling, and thermomechanical training. The shape memory effect and corrosion resistance of Fe-Mn-Si-based shape memory alloy have a great relationship with its composition. For in-stance, 90% of shape recovery can be achieved in cold-rolled and solution-heat-treated Fe-Mn-Si SMA when Mn content is 29 wt%~33 wt% and Si content is 5 wt%~6.5 wt% [22]. The addition of Cr (5~9)% and (4~5)% Ni effectively improves the SME and corrosion resistance by forming the dense and stable passive oxide layers [23,24]. Otsuka et al. [25] introduced Fe-28Mn-6Si-5Cr, Fe-20Mn-5Si-8Cr-5Ni, and Fe-16Mn-5Si-12Cr-5Ni alloys, which have excellent corrosion resistance and a good SME. Nevertheless, they exhibited the 2.5% recovery strain.
It has been found that grain refinement will lead to an increase in the shape memory effect. Tan et al. and Li et al. [26,27,28] deformed the Fe-Mn-Si shape memory alloys at different temperatures and found that grain refinement improves the SME. It was also observed that addition of Ce, Ti, and Ni lowers the Ms to room temperature and enhances the SME.
It has been reported that the solid solution strengthening effects of C on Fe-Mn-Si shape memory alloys have reduced the Mn contents from 28 wt%~33 wt% to 17 wt% [29,30]. The shape memory effect of the prepared Fe-17Mn-6Si-0.3C alloy is higher than that of Fe-33Mn-6Si. It was also proposed by Min et al. [19] that the addition of other alloying elements, such as Ni, Cu, Cr, Al, etc., stabilize the parent phase to reduce the Mn contents. The research results showed that adding Ni can reduce the Mn content more effectively than other elements and enhance the shape memory effect.
In this research, Fe-(17-2x) Mn-6Si-xNi-yCr-0.3C shape memory alloys were fabricated using vacuum arc remelting method followed by severe plastic deformation and heat treatment. The influence of different concentrations of Mn, Ni, and Cr on shape memory effects, microstructural characteristics, and corrosion resistance was investigated.

2. Results and Discussion

The inductively coupled plasma spectrometer (ICP-OES) results of Fe-(17-2x) Mn-6Si-xNi-yCr-0.3C alloys are presented in Table 1. The results are similar to the experimental nominal alloy composition. The extra Mn weight was decreased in different proportions as Mn contents are decreased. The carbon (C) contents were only measured when no chromium (Cr) was present in the alloy system, and results were in line with expectation.
The Fe-(17-2x)Mn-6Si-xNi-yCr-0.3C (x = 0, 1, 2, 3, 4, y = 0, 1, 3, 5) alloy system was formulated under the same operating conditions. The alloy nomenclature with different compositions of x and y is presented in Table 1.

2.1. Microstructural Observation

Figure 1 describes the XRD diffraction analysis of shape memory alloys with different concentrations of Ni, Cr, and Mn after solution treatment. The XRD analysis of all remaining samples is provided in Supplementary Figures S28–S30. It can be observed from Figure 1 that 17Mn0Ni0Cr and 15Mn1Ni0Cr have coexisting structures of γ austenite (FCC) and ε martensite (HCP). A weak α’ martensite (BCC) signal begins to appear when the Mn content is reduced to 13Mn. The further reduction in Mn to 9 Mn causes the α’ martensite to replace ε martensite.
The ε martensite phase and α’ martensite phase should not appear at room temperature. It has been established that ε martensite phases are produced due to surface strain generated by sandpaper while grinding to prepare the specimen, which promotes the surface stress [31,32]. The α’ martensite phase is produced when the Mn content is less than 13 wt% and after 6% strain [9]. The X-ray diffraction pattern of 15Mn series alloy shows that the alloy is a two-phase structure of γ austenite and ε martensite at room temperature. Therefore, adding different proportions of Cr does not affect the phase composition of the alloy. However, it can be found from Figure 1 that the peak value of γ in 15Mn1Ni0Cr is lower than the ε martensite peak value. The γ austenite peak value gradually increases with the increase in the Cr content.
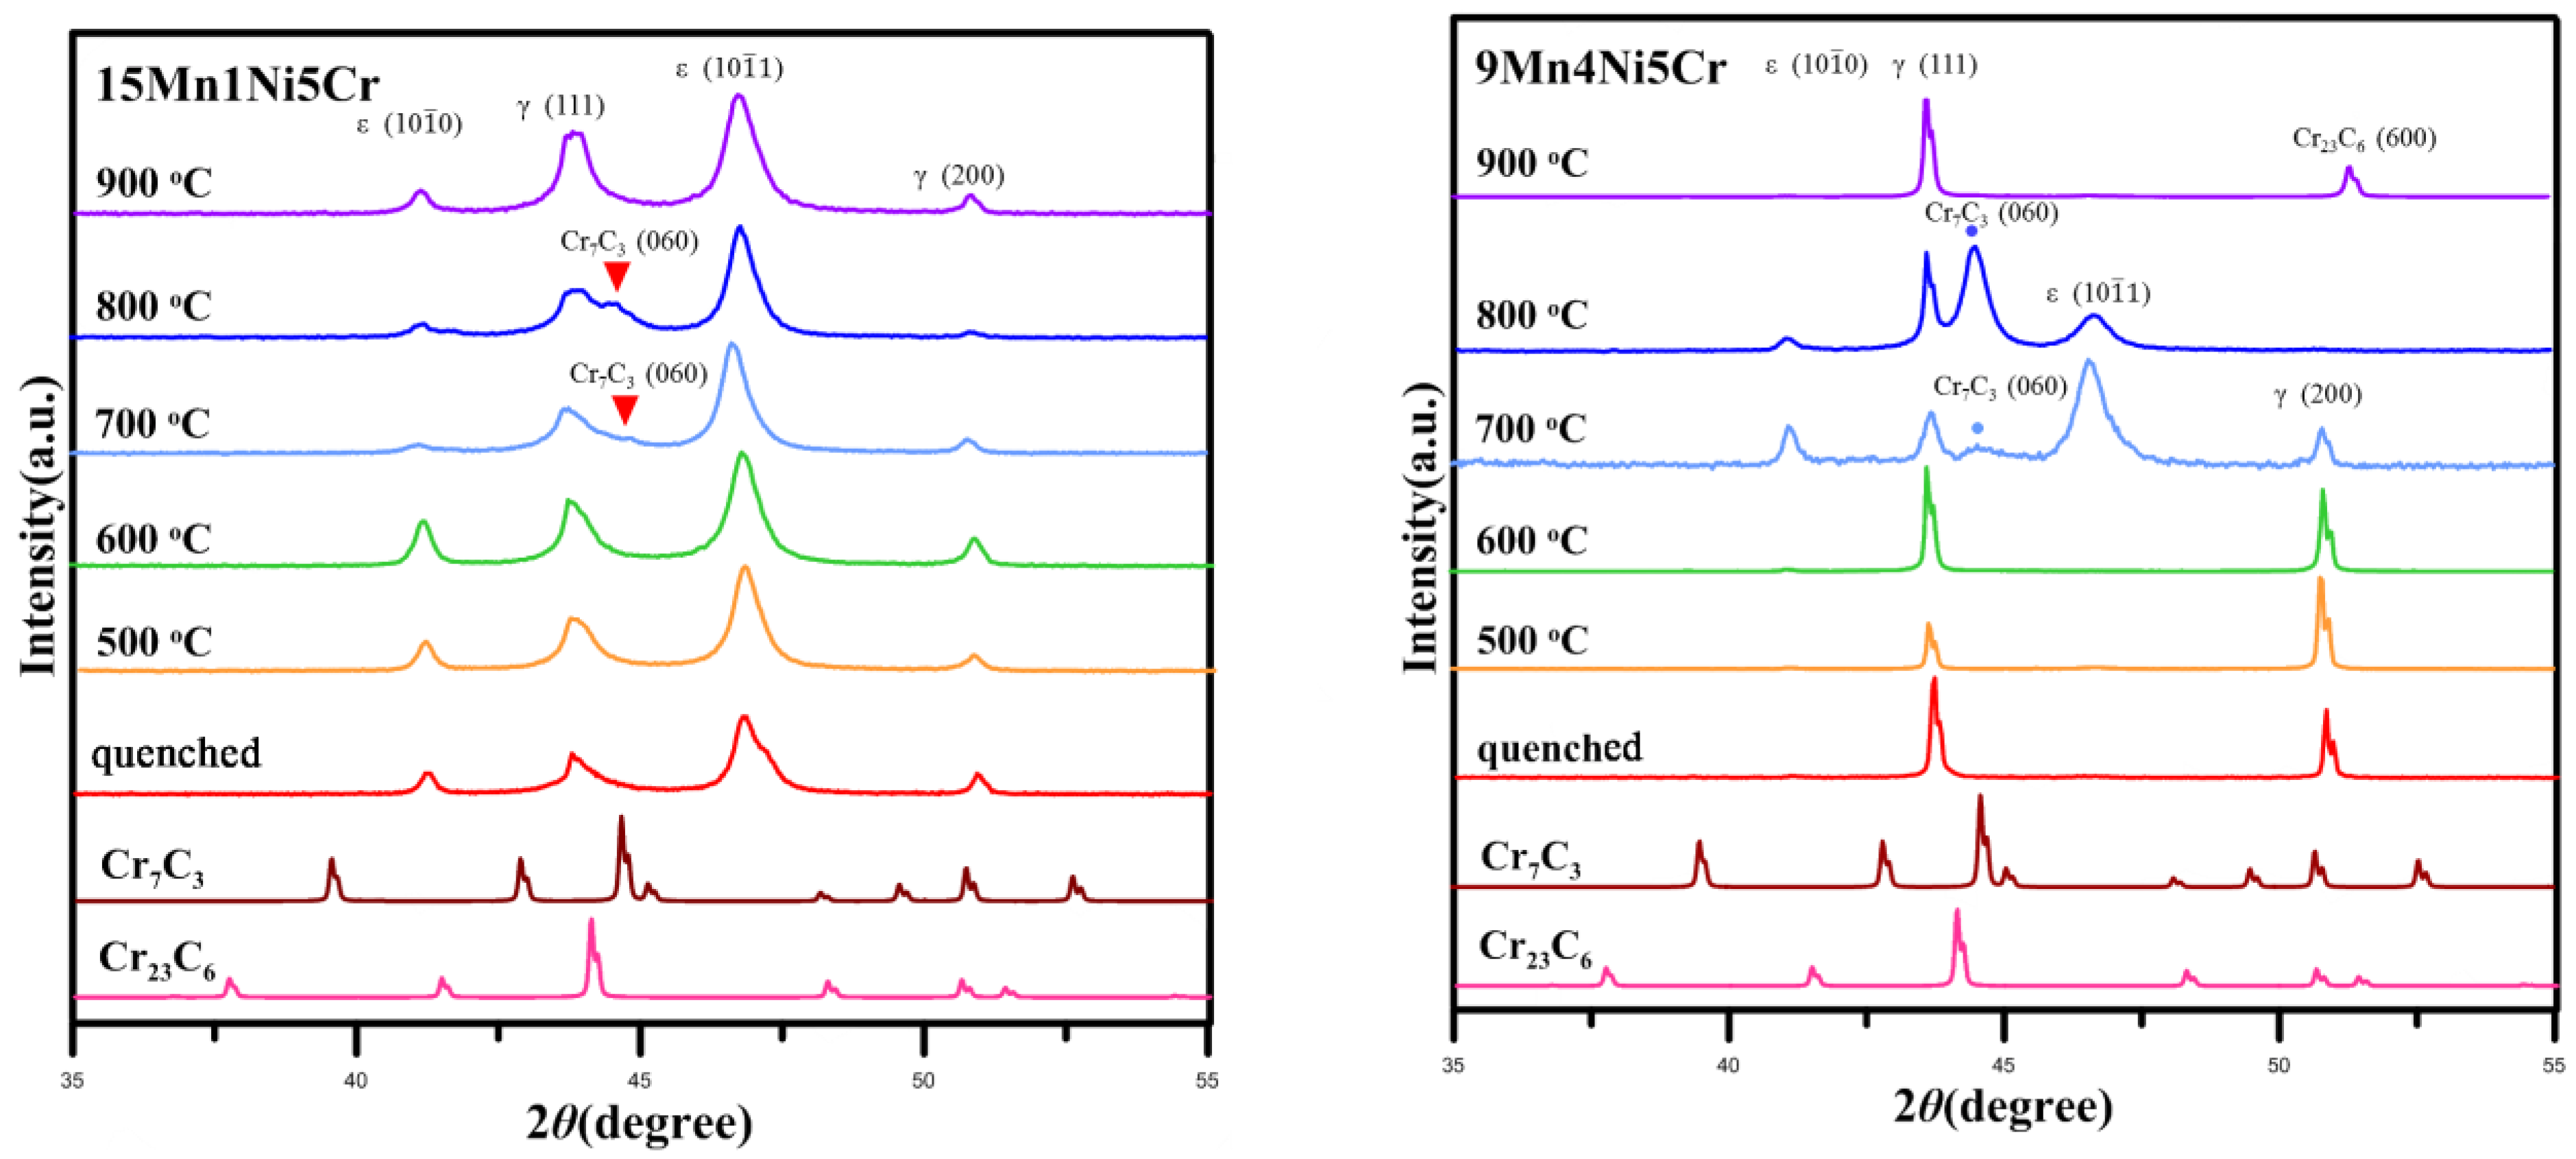
The XRD pattern of the 15Mn1Ni5Cr alloy (Figure 2) indicates that there are no signal peaks of other phases except for γ austenite and the ε martensite phases after aging at 500 °C and 600 °C. A signal peak appears near 44° after aging at 700 °C, and it becomes more obvious after aging at 800 °C. The peak disappears after aging at 900 °C. The signal peak was observed as Cr7C3 (060) when compared with standard M7C3 peaks, although the XRD analysis of the 15Mn1Ni5Cr alloy did not show the signal peak of Cr23C6 after aging at 700 °C, 800 °C, and 900 °C.
The XRD analysis on the 9Mn4Ni5Cr alloy (Figure 2) was performed in order to prove that the replacement of 2Mn with 1Ni does not affect the second phase of carbides. It can be observed that the XRD results are same as 15Mn1Ni5Cr after aging heat treatment at 500 °C~800 °C. There is a signal peak of Cr7C3 appears in 9Mn4Ni5Cr alloy after aging at 700 °C and 800 °C. Another signal peak appears near 51.5° after aging at 900 °C, which is Cr23C6 (600) when compared with standard M23C6 signal peaks. It can be found that the second phase still exists inside the grains when more than 5 wt% Cr is added and aged at 900 °C (Figure 1 and Figure 2). The addition of 5 wt% of Cr improves the thermal stability of the second phase at high temperatures.
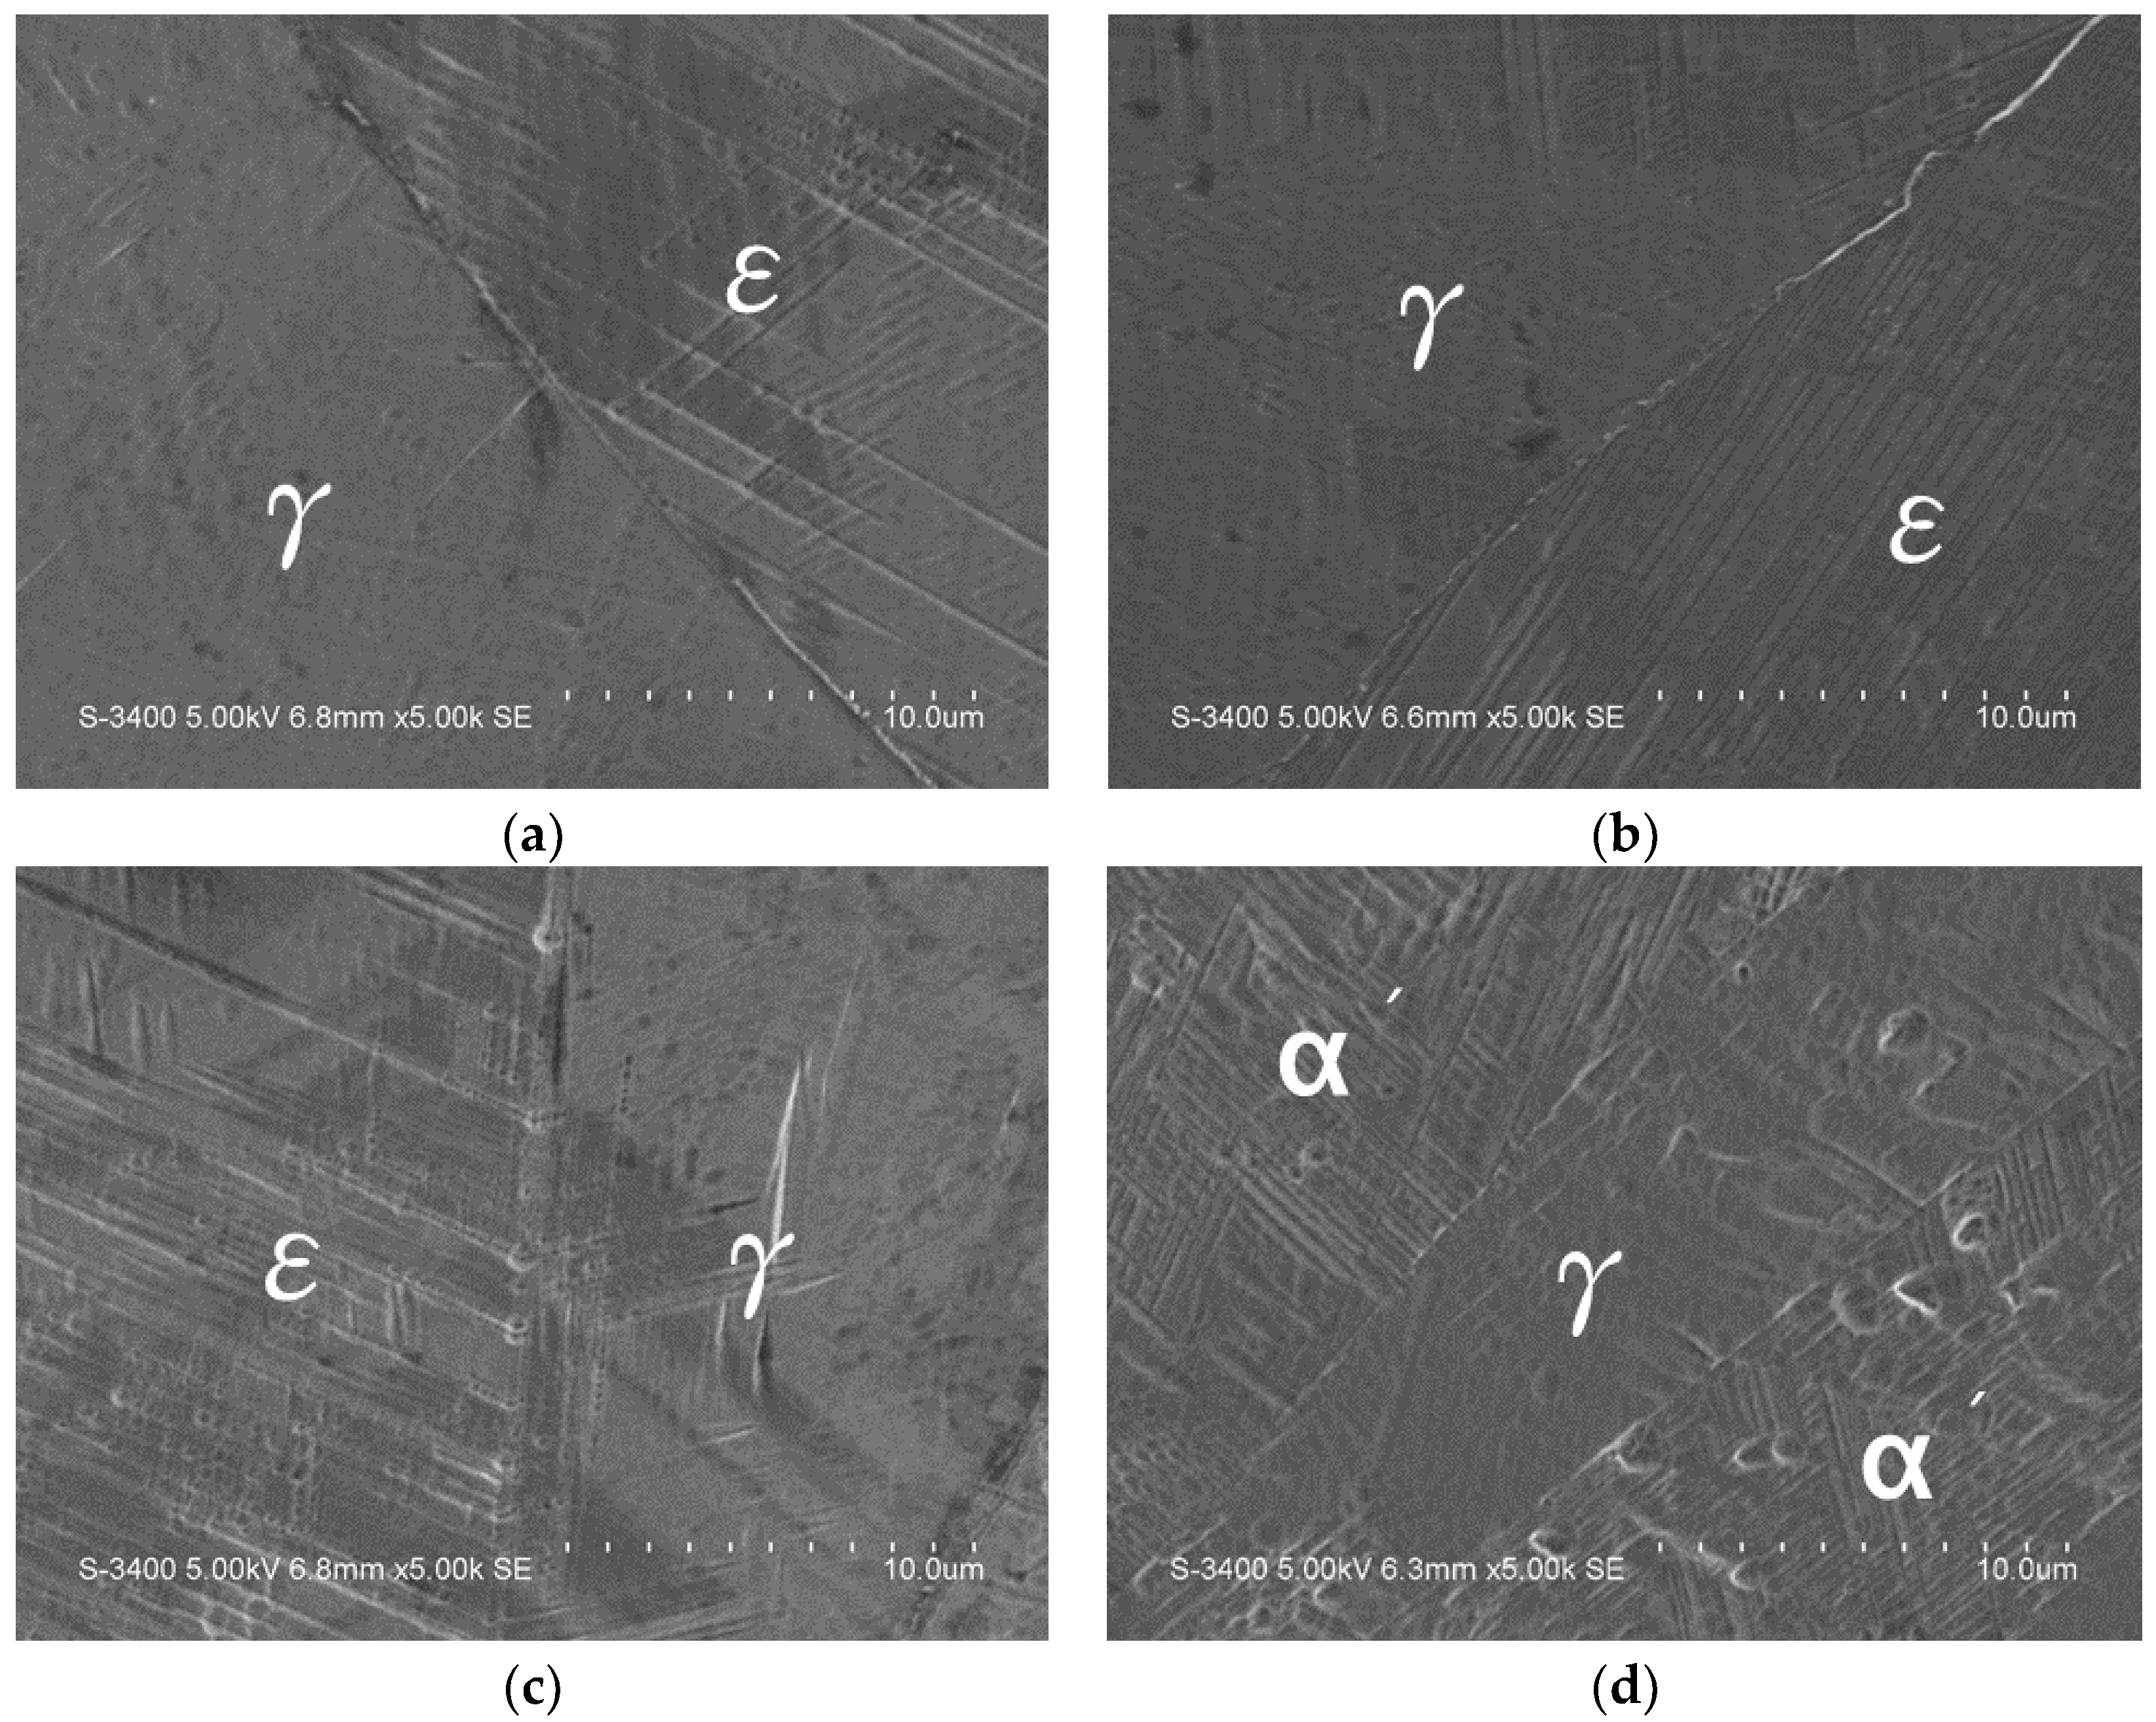
The SEM images of all samples are provided in Supplementary Figures S1–S27 and t can be observed that γ austenite and martensite are two main phases present in microstructure. Figure 3 and Figure 4 present the SEM images of the shape memory alloys after solution treatment. Two phases of γ austenite and martensite can be observed. No second phases have been observed at grain boundary and in grains. The SEM results are in line with XRD analysis. The addition of Cr and aging at higher temperatures produces granular second phase inside the crystal grains, and the alloy contains 0.3 wt% C. It is speculated that these precipitates are carbides formed by Cr and C. The evenly distributed second phase in the base can effectively confine ε martensite in different azimuths and avoid ε martensite interlacing to form α’ martensite (Figure 3). It is found that adding 2Ni and 1Cr cannot form the second phase inside the crystal grain. Therefore, it can be inferred that the Cr content must be greater than or equal to Ni content in order to form the second phase inside the grains of the alloy system (Figure 4). The uniformly distributed second phase must be formed inside the crystal grain to improve the SME in 9Mn series alloys. The Cr contents are higher than Ni in 9Mn4Ni5Cr and 9Mn4Ni7Cr.
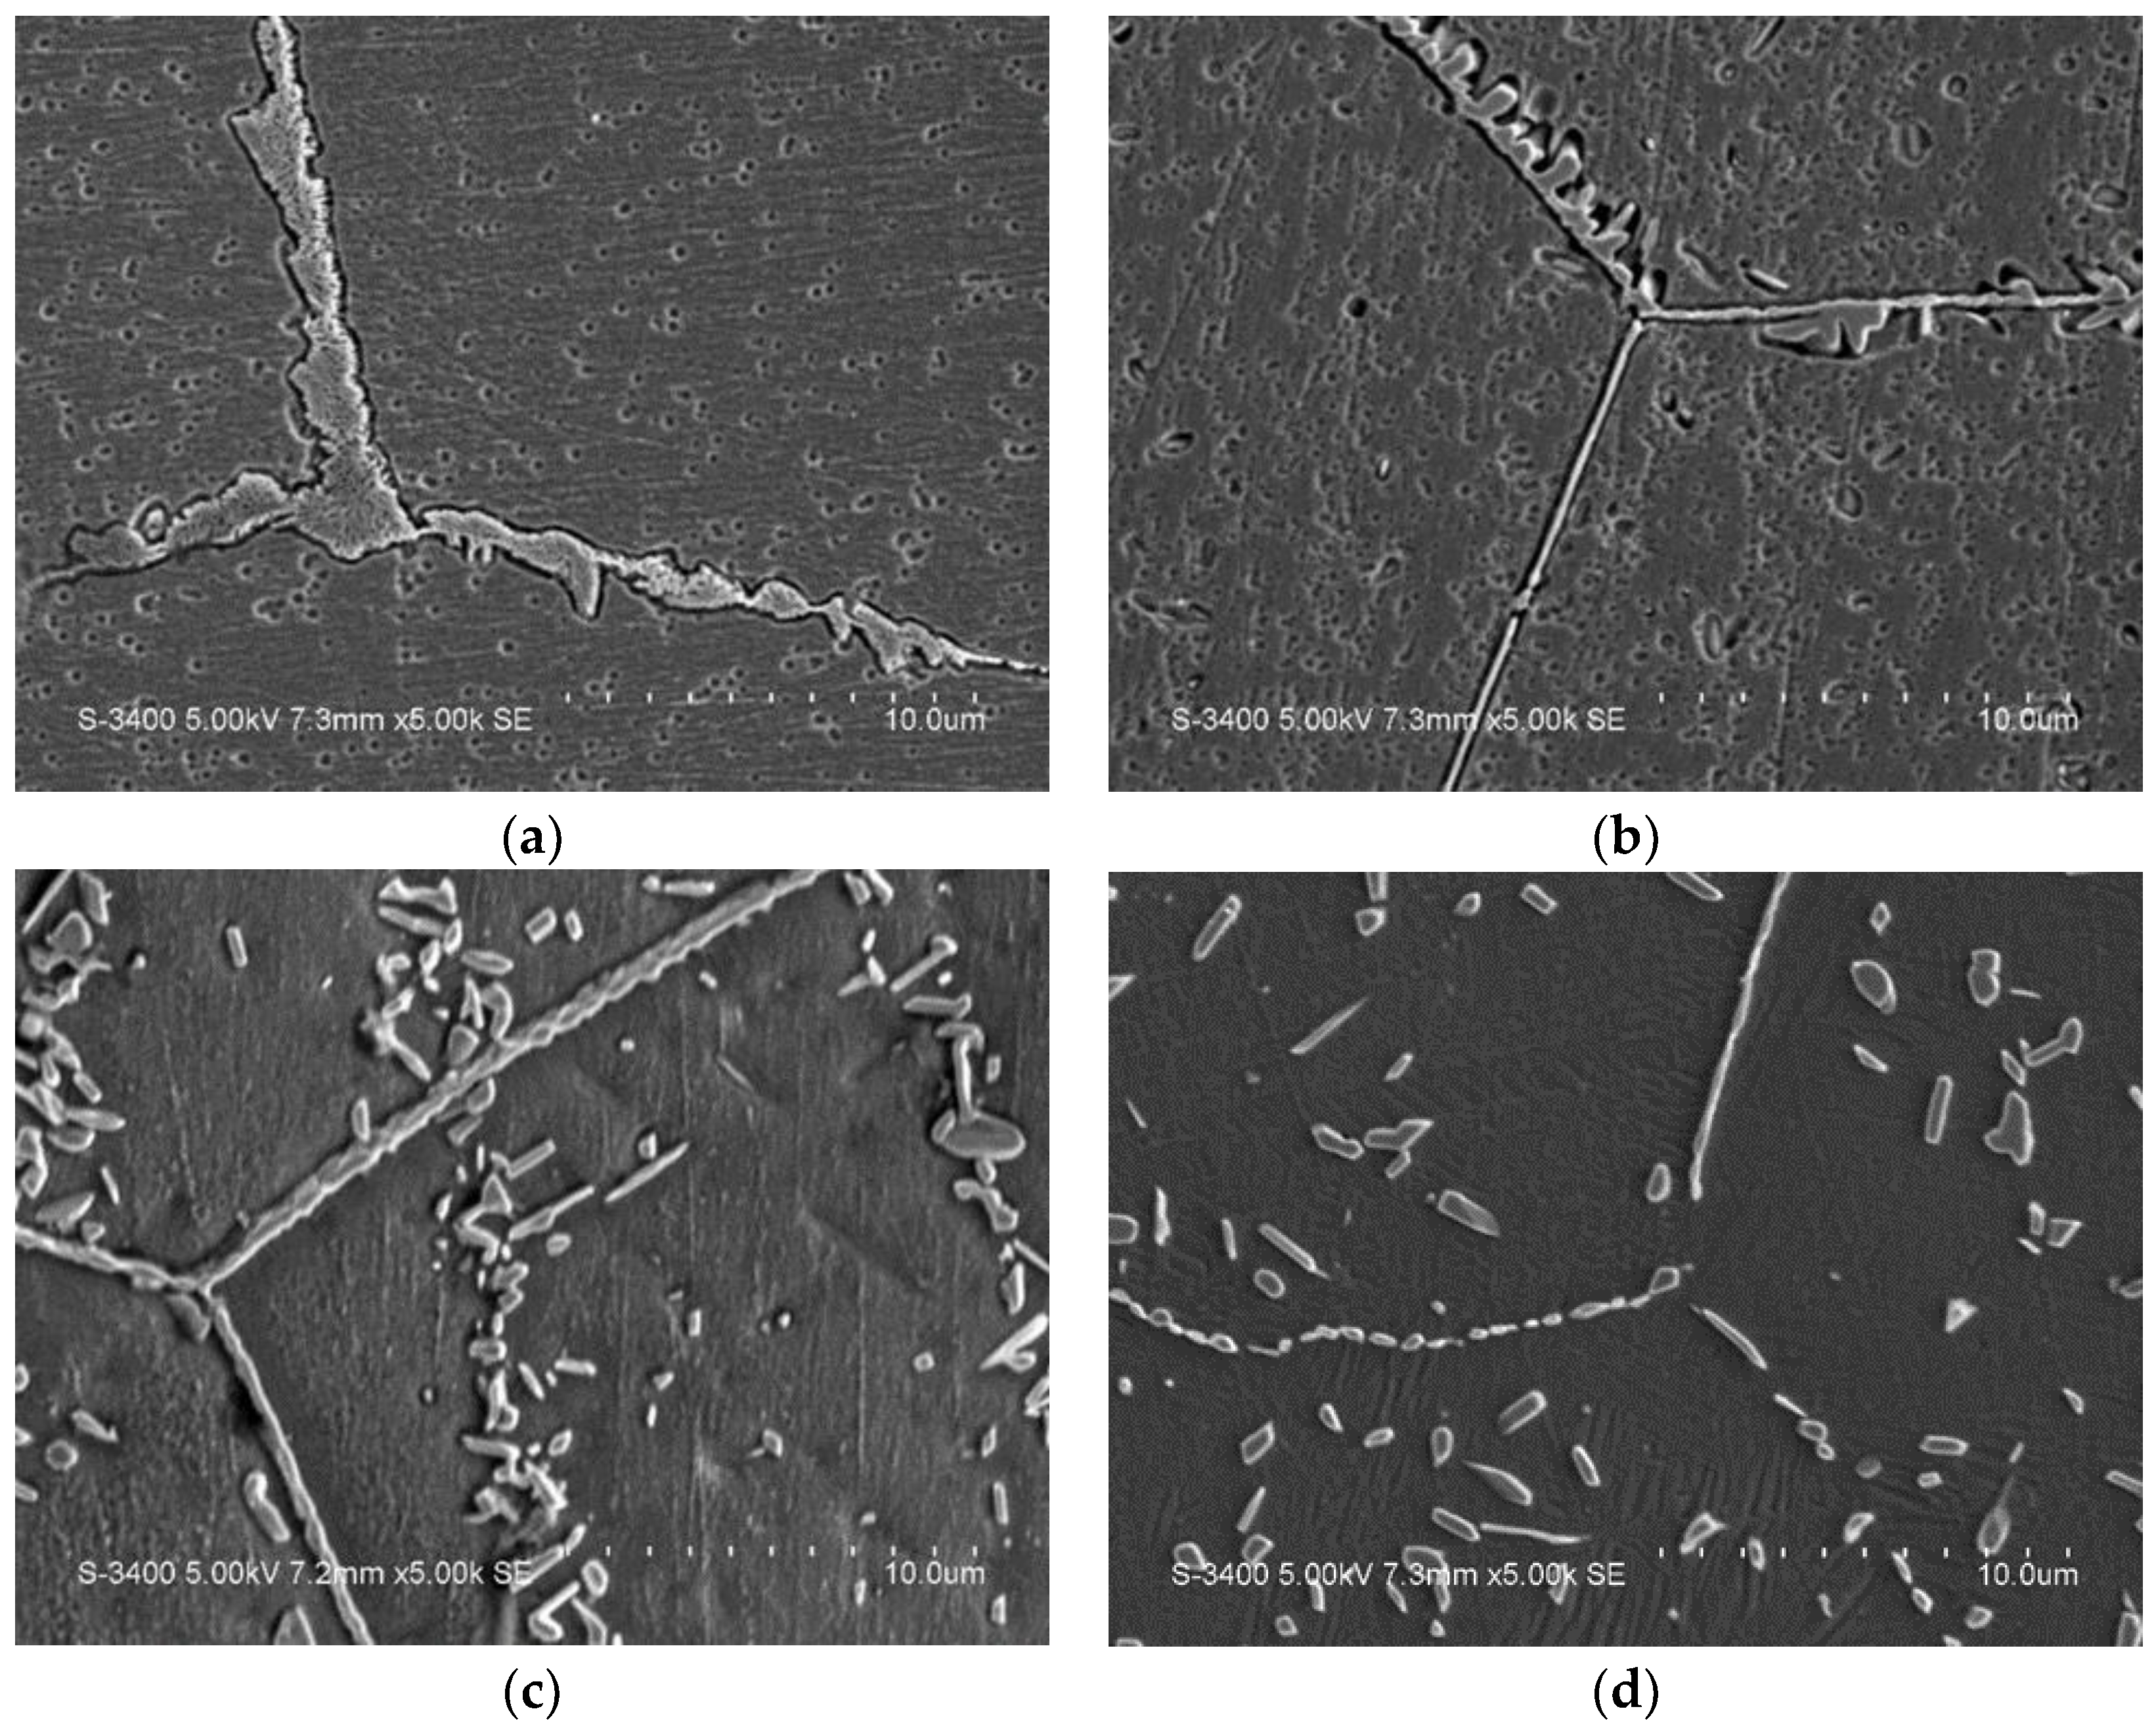
The SEM images of 15Mn1Ni5Cr and 9Mn4Ni5Cr aged at different temperatures are presented in Figure 5 and Figure 6, respectively. The precipitation behavior of the second phase of the 15Mn series is the same as that of the 17Mn series. The second phases are different in 15Mn1Ni1Cr than 17Mn0Ni1Cr when aged at 800 °C. The γ phase is nucleate in a large amount inside the grains after aging treatments, which results in precipitation strengthening. The addition of Cr and aging at higher temperatures produces a granular second phase inside the crystal grains. The results are in line with XRD analysis.

2.2. Shape Memory Effects

The shape memory effect of Fe-based shape memory alloys is not as good as NiTi-based alloys. The maximum shape recovery strain in NiTi alloys reaches 8%, while, in Fe-based SMAs, it reaches to only 4% [1,2,33]. The manufactured shape memory alloys in this study are polycrystalline; therefore, the 3% strain is selected in the bending test to explore the influence of different Mn and Cr contents on shape memory effect at different aging treatments. The second phase has been developed and precipitated inside the alloy as a result of aging heat treatment, and the energy barrier, which needs to be overcome, is relatively high.
Table 2 shows the shape recovery rate of the Fe-(17-2x)Mn-6Si-xNi-yCr-0.3C (x = 0, 1, 2, 3, 4, y = 0, 1, 3, 5) alloy after solution treatment and aging at 500 °C~900 °C for 1 h. The results are elaborated in Figure 7, Figure 8, Figure 9, Figure 10 and Figure 11 and Table 2. Min et al. [19,20] found that the shape recovery rate (RSME) of 17Mn0Ni0Cr alloy was 66% at the 3% strain, and 74.5% has been achieved in this study.
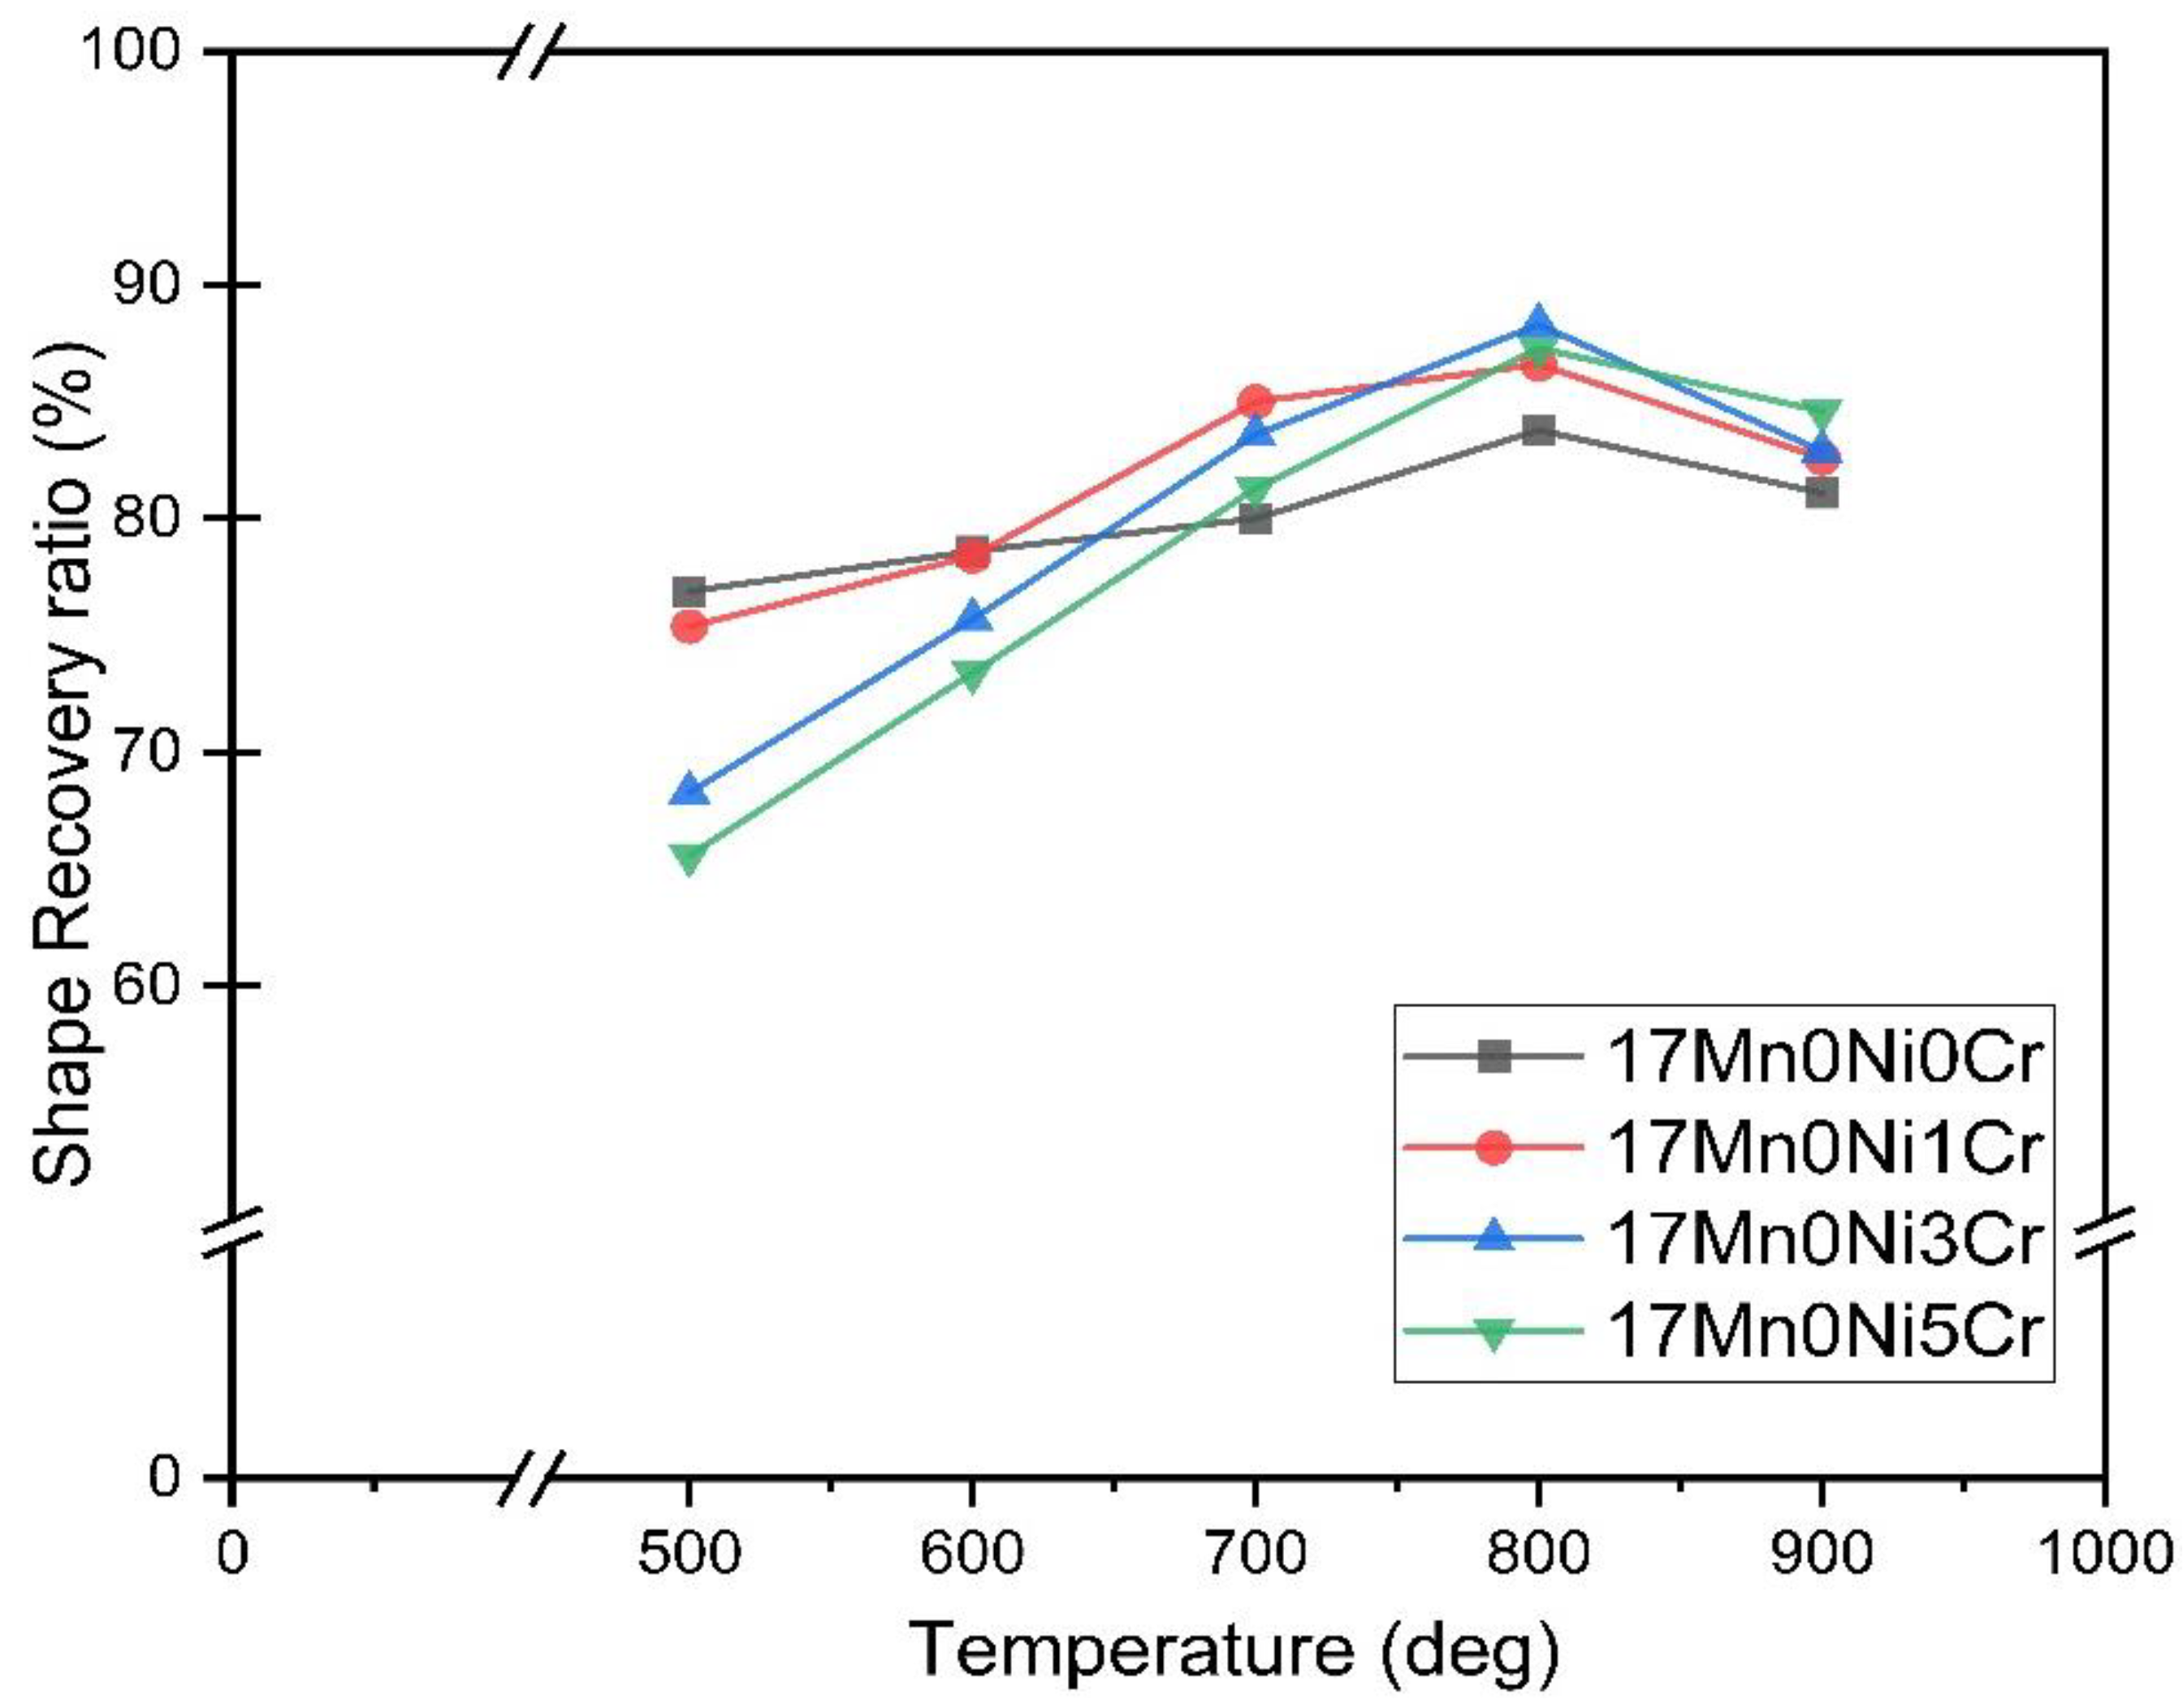
It can be seen from Figure 7 and Table 2 that the shape recovery rate of 17Mn series alloy decreases with the increase in Cr content after solution treatment. The addition of Cr will decrease the Ms temperatures of SMA, and Ms has considerable influence on SME. The shape recovery ratio of 17Mn0Ni0Cr did not change much after aging, and the maximum recovery rate was observed at the aging temperature of 800 °C, which is only 10% increased. However, when the aging temperature of 17Mn0Ni1Cr, 17Mn0Ni3Cr, and 17Mn0Ni5Cr is above 700 °C, the shape recovery rate is significantly improved, and the maximum shape recovery rate was observed at 800 °C. The 17Mn0Ni3Cr alloy exhibited the highest shape recovery rate (88.3%) at 800 °C. The RSME of 17Mn0Ni5Cr decreases to 84.6% after aging at 900 °C, which is only about 3% lower than that after aging at 800 °C, while RSME in 17Mn0Ni3Cr is 6% reduced after aging at 900 °C than that aged at 800 °C.
Figure 8 and Table 2 present the shape memory recovery rate of 15Mn series alloys. The shape recovery rate behavior of the 15Mn series has been observed the same as that of the 17Mn series alloy. The two alloys of 15Mn1Ni3Cr and 15Mn1Ni5Cr have produced more than 90% RSME at 800 °C aging temperature. The RSME of 15Mn1Ni3Cr alloy has reached 94% after 800 °C aging treatment. The same RSME can be achieved in Fe-based shape memory alloys with 28wt%~33wt% Mn content, and 6%~10% pre-deformation is necessary [11,15,26]. However, this alloy can increase RSME to more than 90% without pre-deformation. The RSME is decreased at 900 °C aging temperature in all 15Mn series alloys, except 15Mn1Ni5Cr, in which it remains almost the same.
The shape recovery rate of 13Mn series alloy after solution treatment and aging at 500 °C~900 °C for 1 h is presented in Figure 9 and Table 2. All 13Mn series alloys exhibit almost the same RSME after solution heat treatment except 13Mn2Ni5Cr. The 13Mn2Ni5Cr has the highest RSME (94.4%) among the 13Mn series after aging at 800 °C. The aging at 900 °C will lead to a decrease in RSME in all 13Mn series alloys. The 13Mn2Ni3Cr and 13Mn2Ni5Cr alloys will produce the second phase inside the grain after aging at 700 °C and 800 °C so that RSME can also be increased to more than 90%.
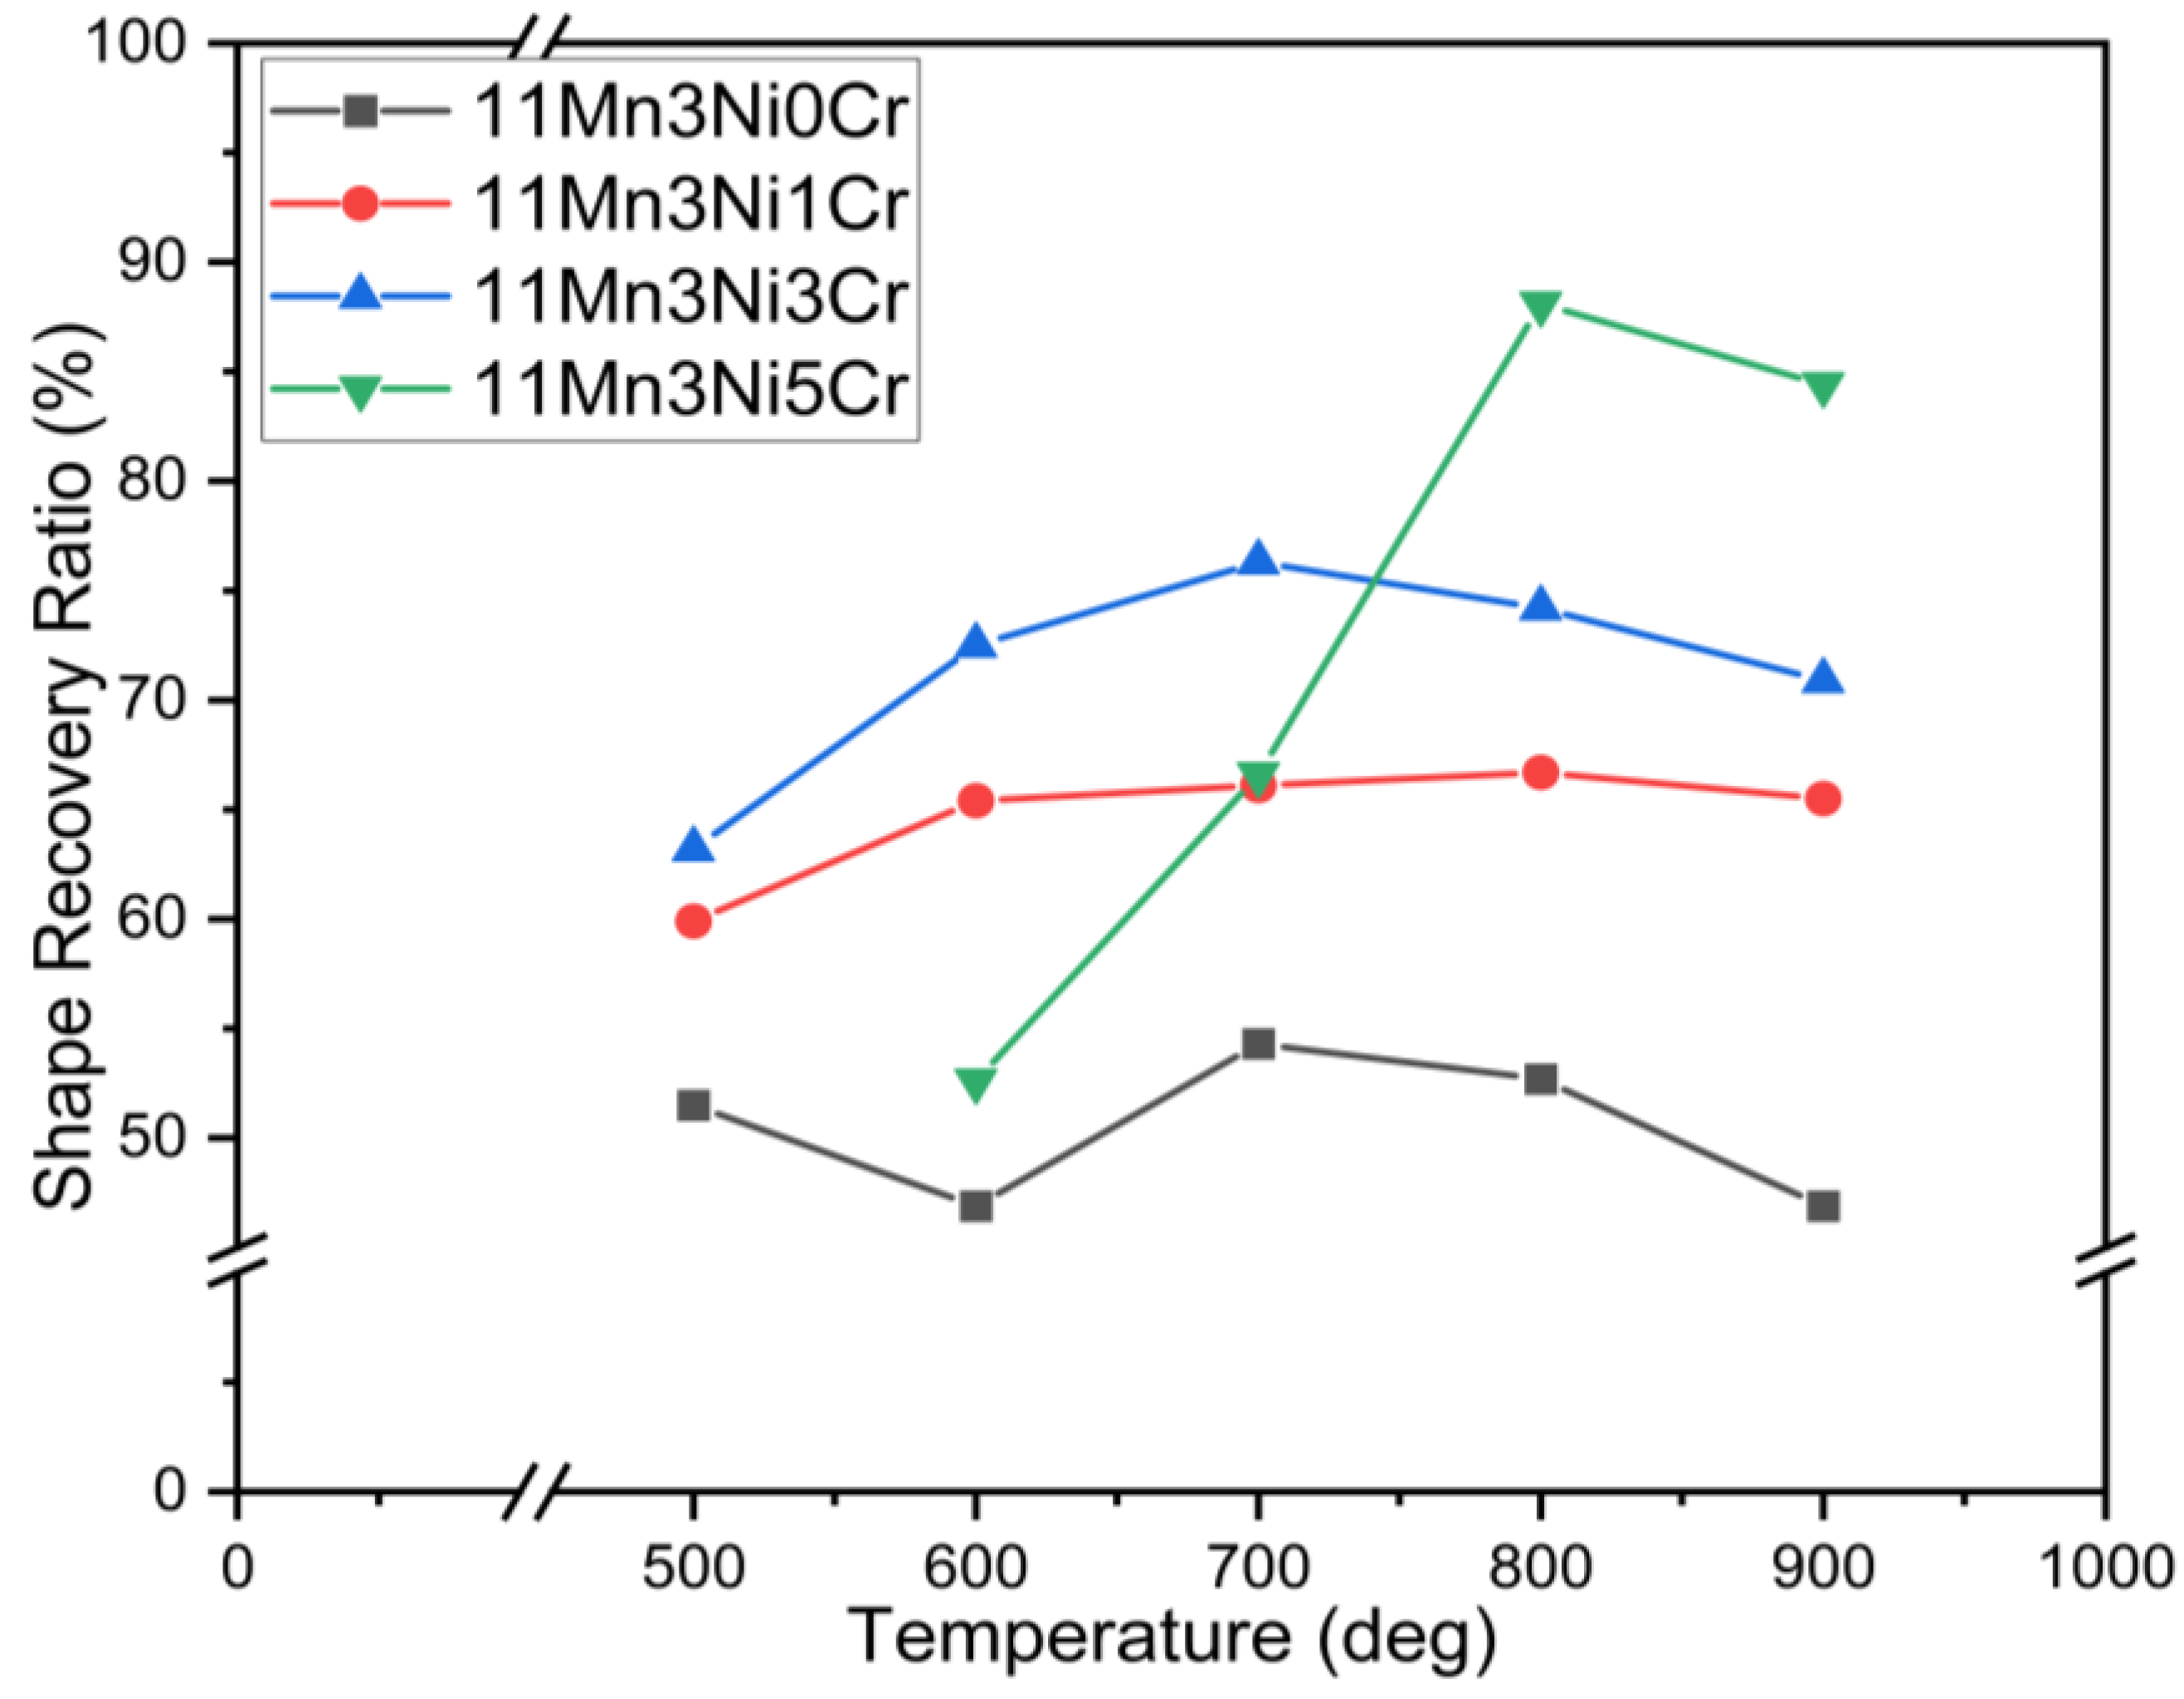
The shape recovery rates of 11Mn series and 9Mn series alloys are presented in Table 2 and Figure 10 and Figure 11. The Cr addition in the 11Mn series significantly improved the SME, and 5Cr addition has a maximum RSME (88.1%) at 800 °C. The shape recovery rate of 11Mn3Ni1Cr at each aging temperature shows that the improvement effect is only about 10%. It is indicated from Figure 10 that 5Cr and 7Cr have improved SME than 0Cr. The addition of 5Cr increased the RSME to 81.5%, and, with 7Cr addition, it reached 86.8%. The aging treatment at 500 °C has decreased the RSME in 9Mn series alloys with 7Cr. The RSME at 28%, 28%, and 40% improved at each higher aging temperature of 600 °C, 700 °C, and 800 °C, respectively, in 9Mn4Ni7Cr (Figure 11). The highest RSME parameters of each series of alloys are 88.3% of 17Mn0Ni3Cr, 94.0% of 15Mn1Ni3Cr, 94.4% of 13Mn2Ni5Cr, 88.2% of 11Mn3Ni5Cr, and 86.8% of 9Mn4Ni7Cr. It can be inferred from Table 3 that, when the content of Cr is greater than the content of Ni, the SME begins to decrease.
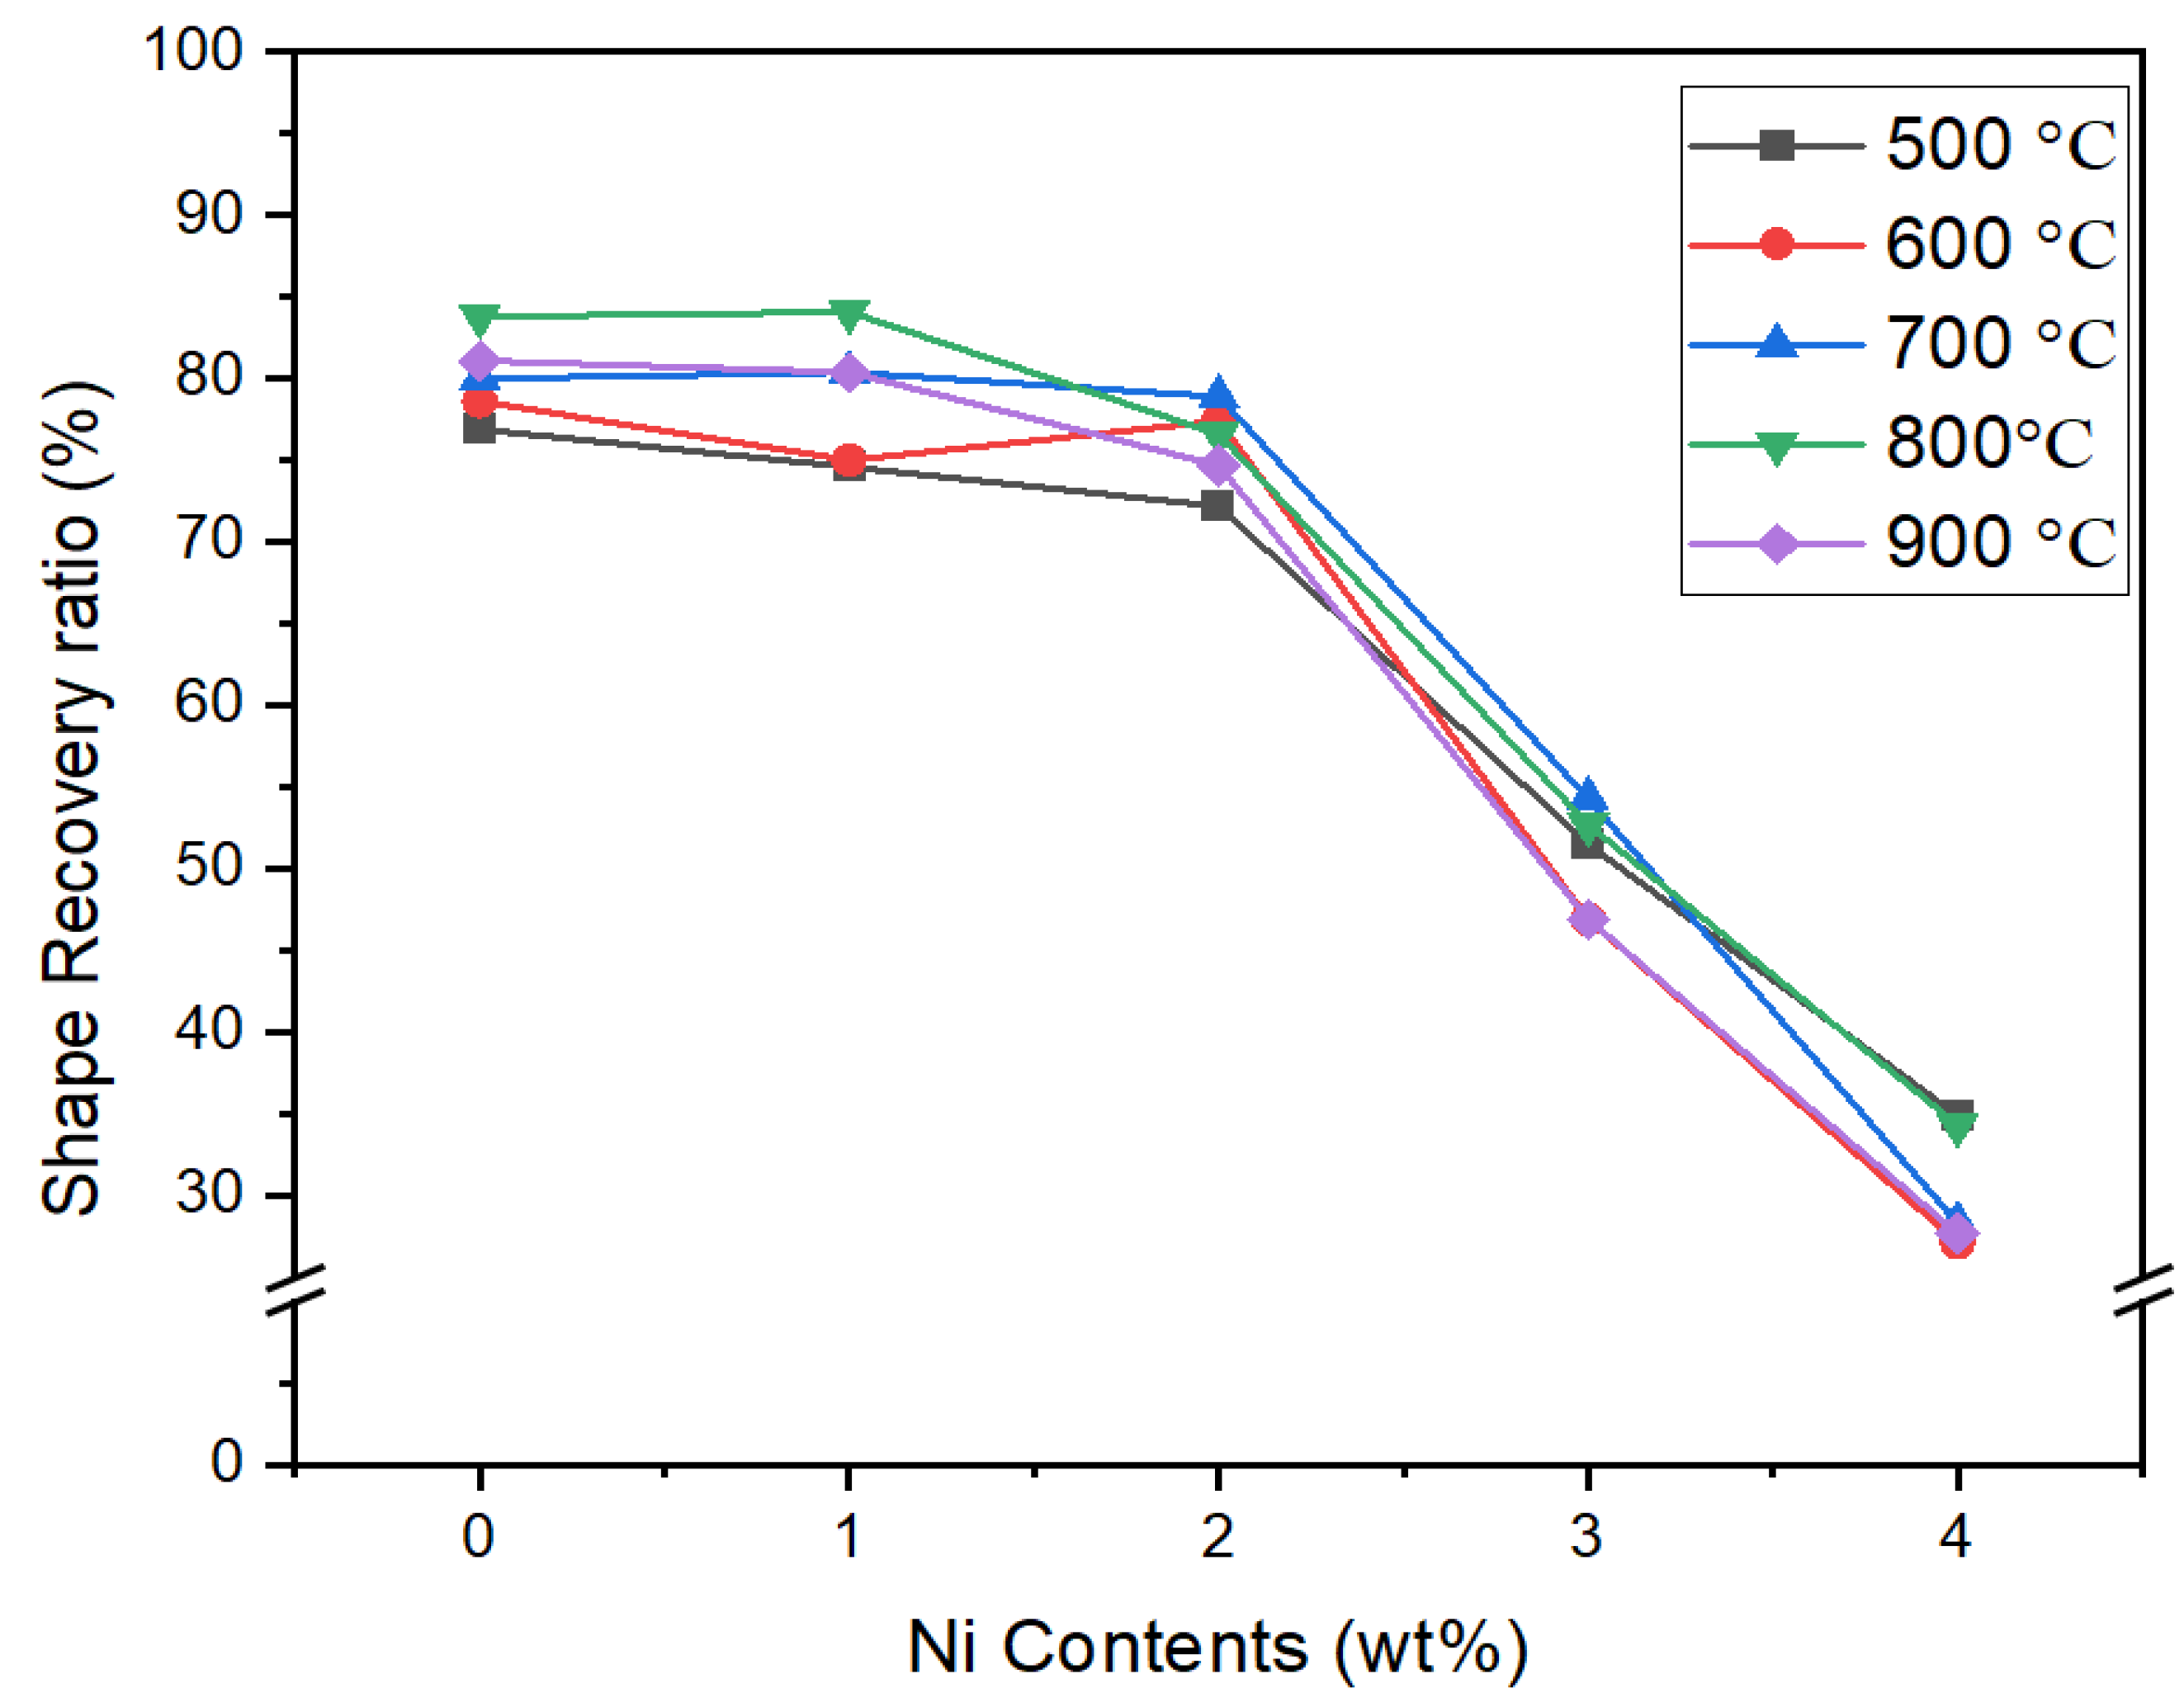
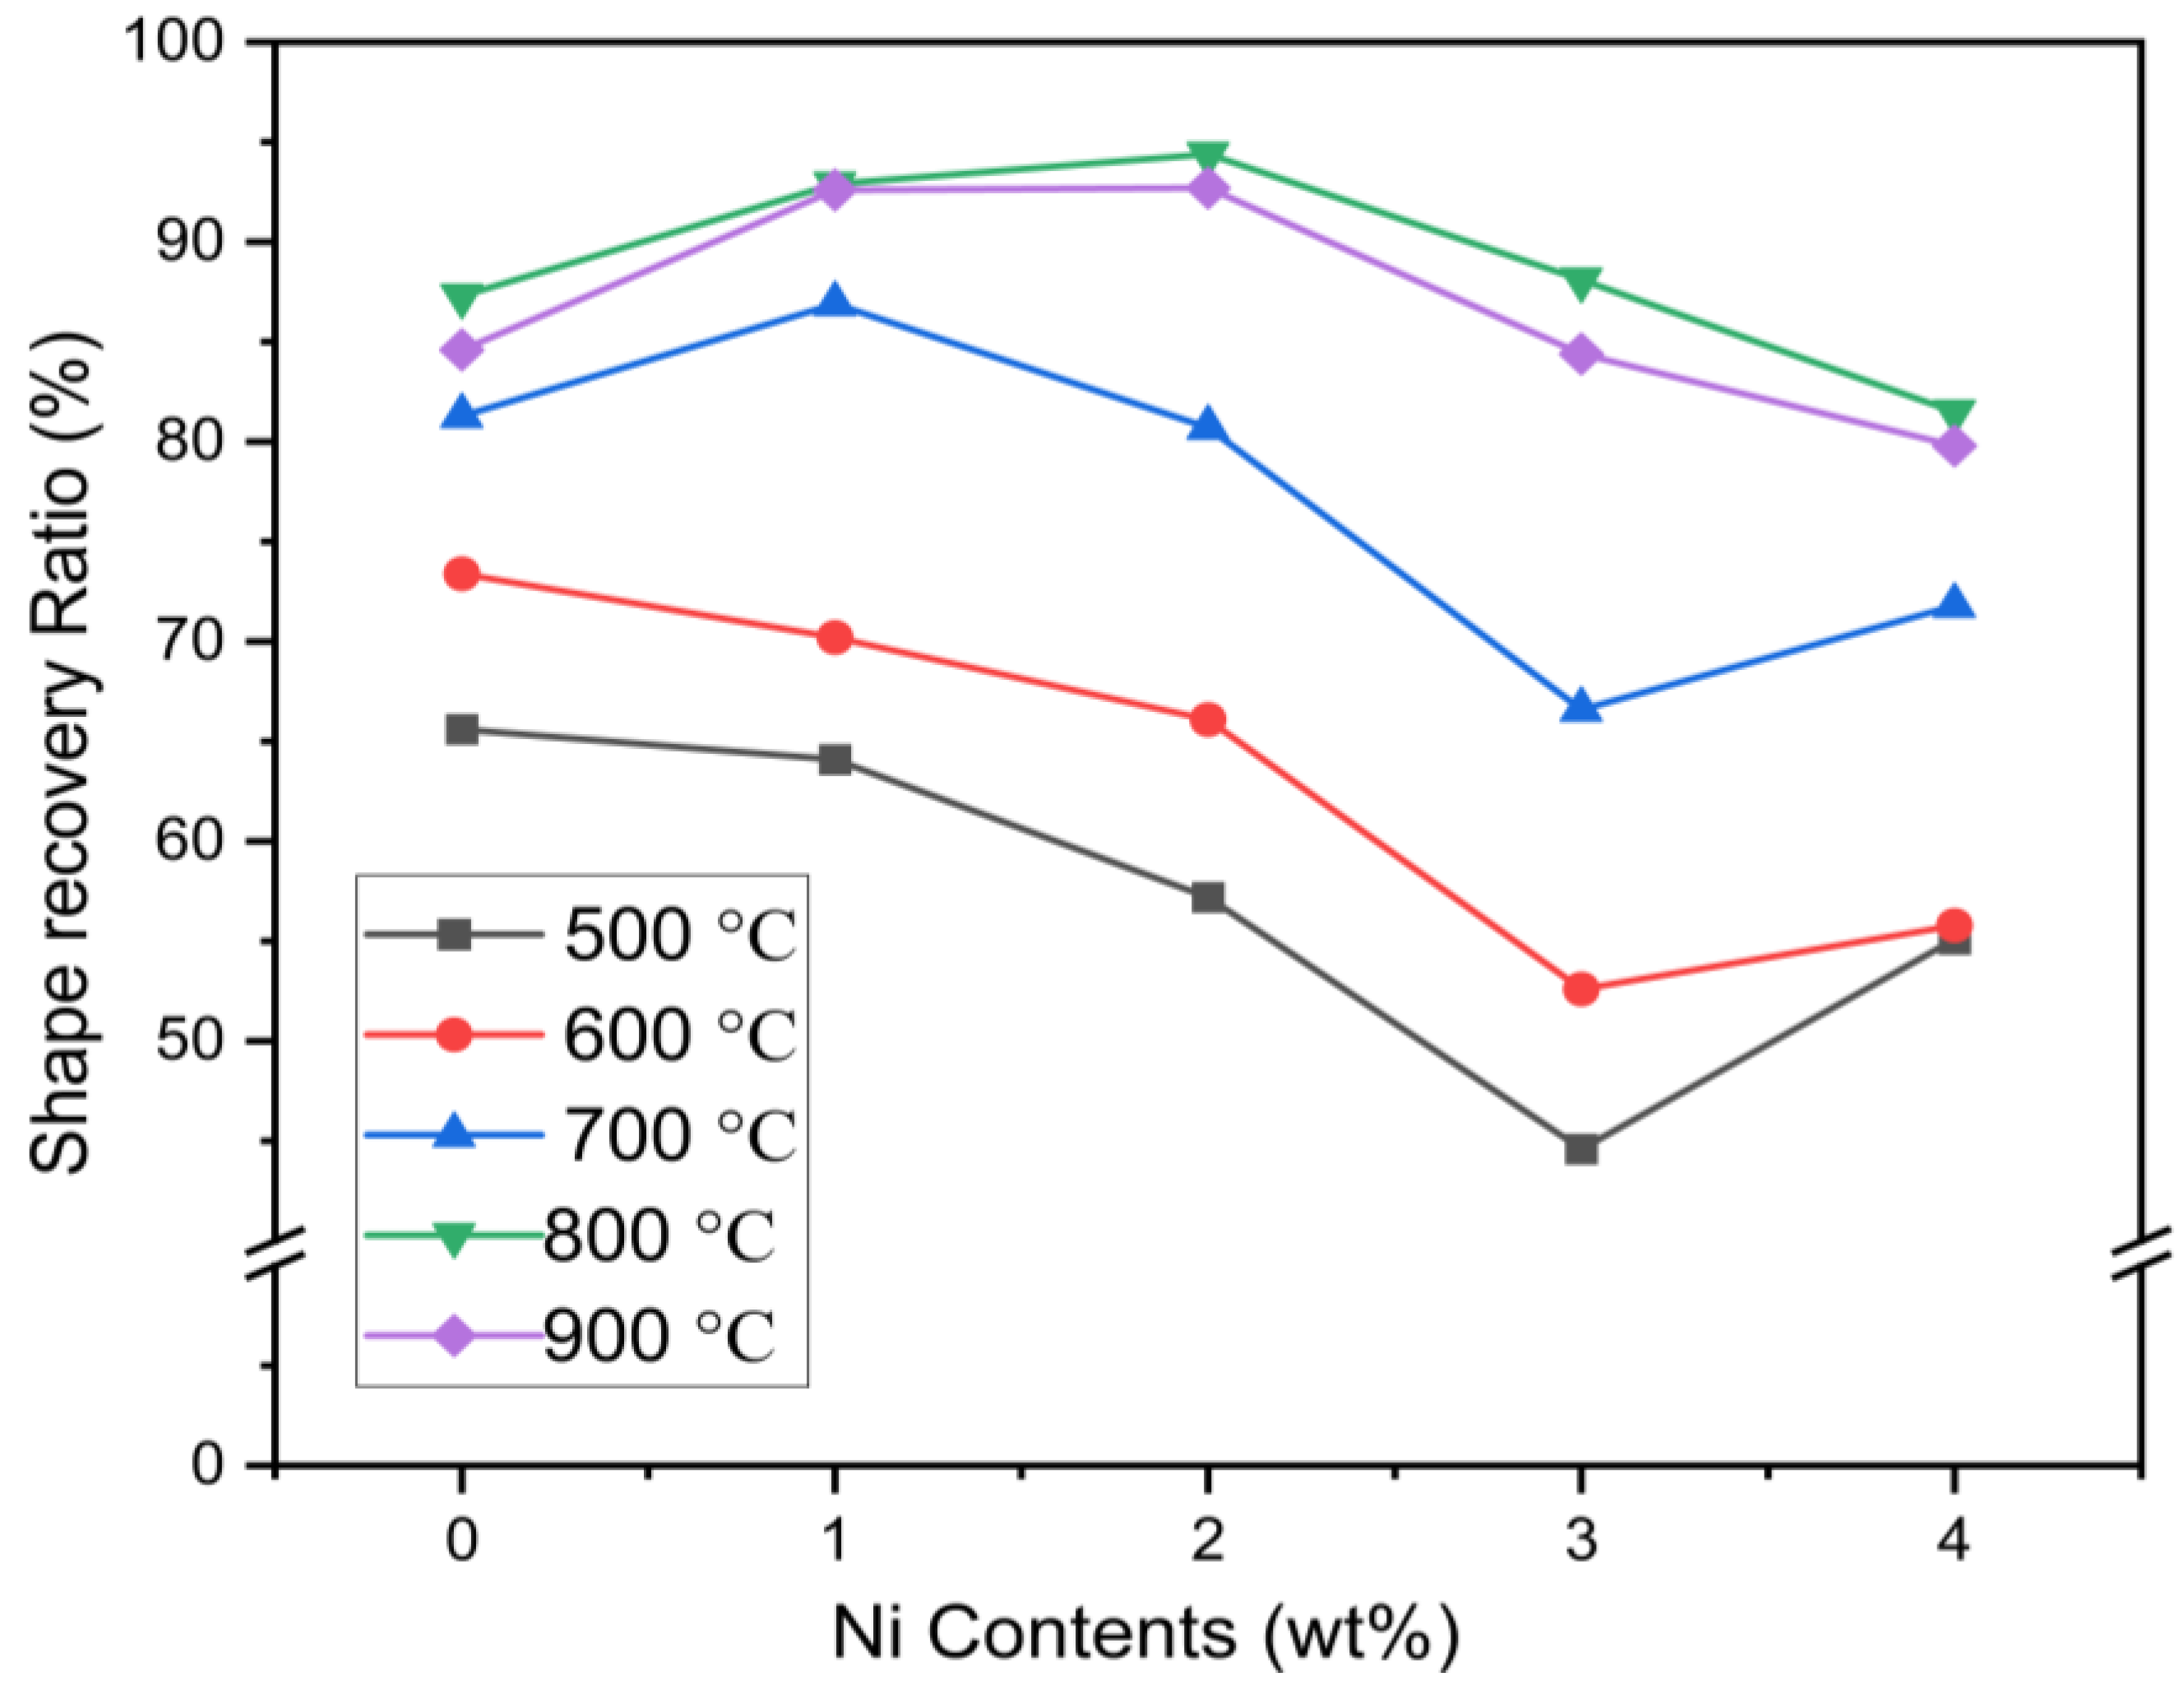
The effects of Ni addition to replace the Mn are summarized in Figure 12 and Figure 13. It can be observed that aging temperature has no effects on shape recovery ratio with 0Cr, but a higher concentration of Ni has reduced the RSME significantly to 27.7% (Figure 13). It can be visualized from Figure 13 that alloys with 5Cr are significantly influenced with the higher aging temperatures. The increase in the concentration of Ni with 5Cr leads to a decrease in shape memory effect, and aging temperature has positive effects in enhancing the RSME.
The shape memory effect of the Fe-(17-2x)Mn-6Si-xNi-0Cr-0.3C alloy system increased at a higher aging temperature of 500 °C~800 °C and then decreased at 900 °C (Table 2), which is due to formation of second phases. The addition of Cr and aging at 600 °C led to an improvement in the SME due to the beginning of the γ phase. Two second phases (Cr23C6 and Cr7C3) began to form inside the crystal grains after aging at 700 °C (Figure 1 and Figure 2), which greatly improved the shape memory effect. Analysis of Figure 2 and Table 2 reveals that the γ phase completely disappears, the second phase inside the crystal grains is only Cr23C6 after aging at 900 °C, and the amount is relatively small, which makes the shape memory effect slightly reduced. The addition of Ni in the 17Mn series enhances the parent phase γ contents, and the SME will be improved. The small amount of α’ martensite was generated in 11Mn series alloys, which slightly lower the SME. A large amount of α’ martensite will be generated inside the alloy after the strain, and α’ martensite is formed by interlacing ε martensite in different directions. The α’ martensite will hinder the contravariant state of ε martensite → γ austenite, resulting in a decrease in SME [5,11,20,27].

2.3. Electrochemical Corrosion

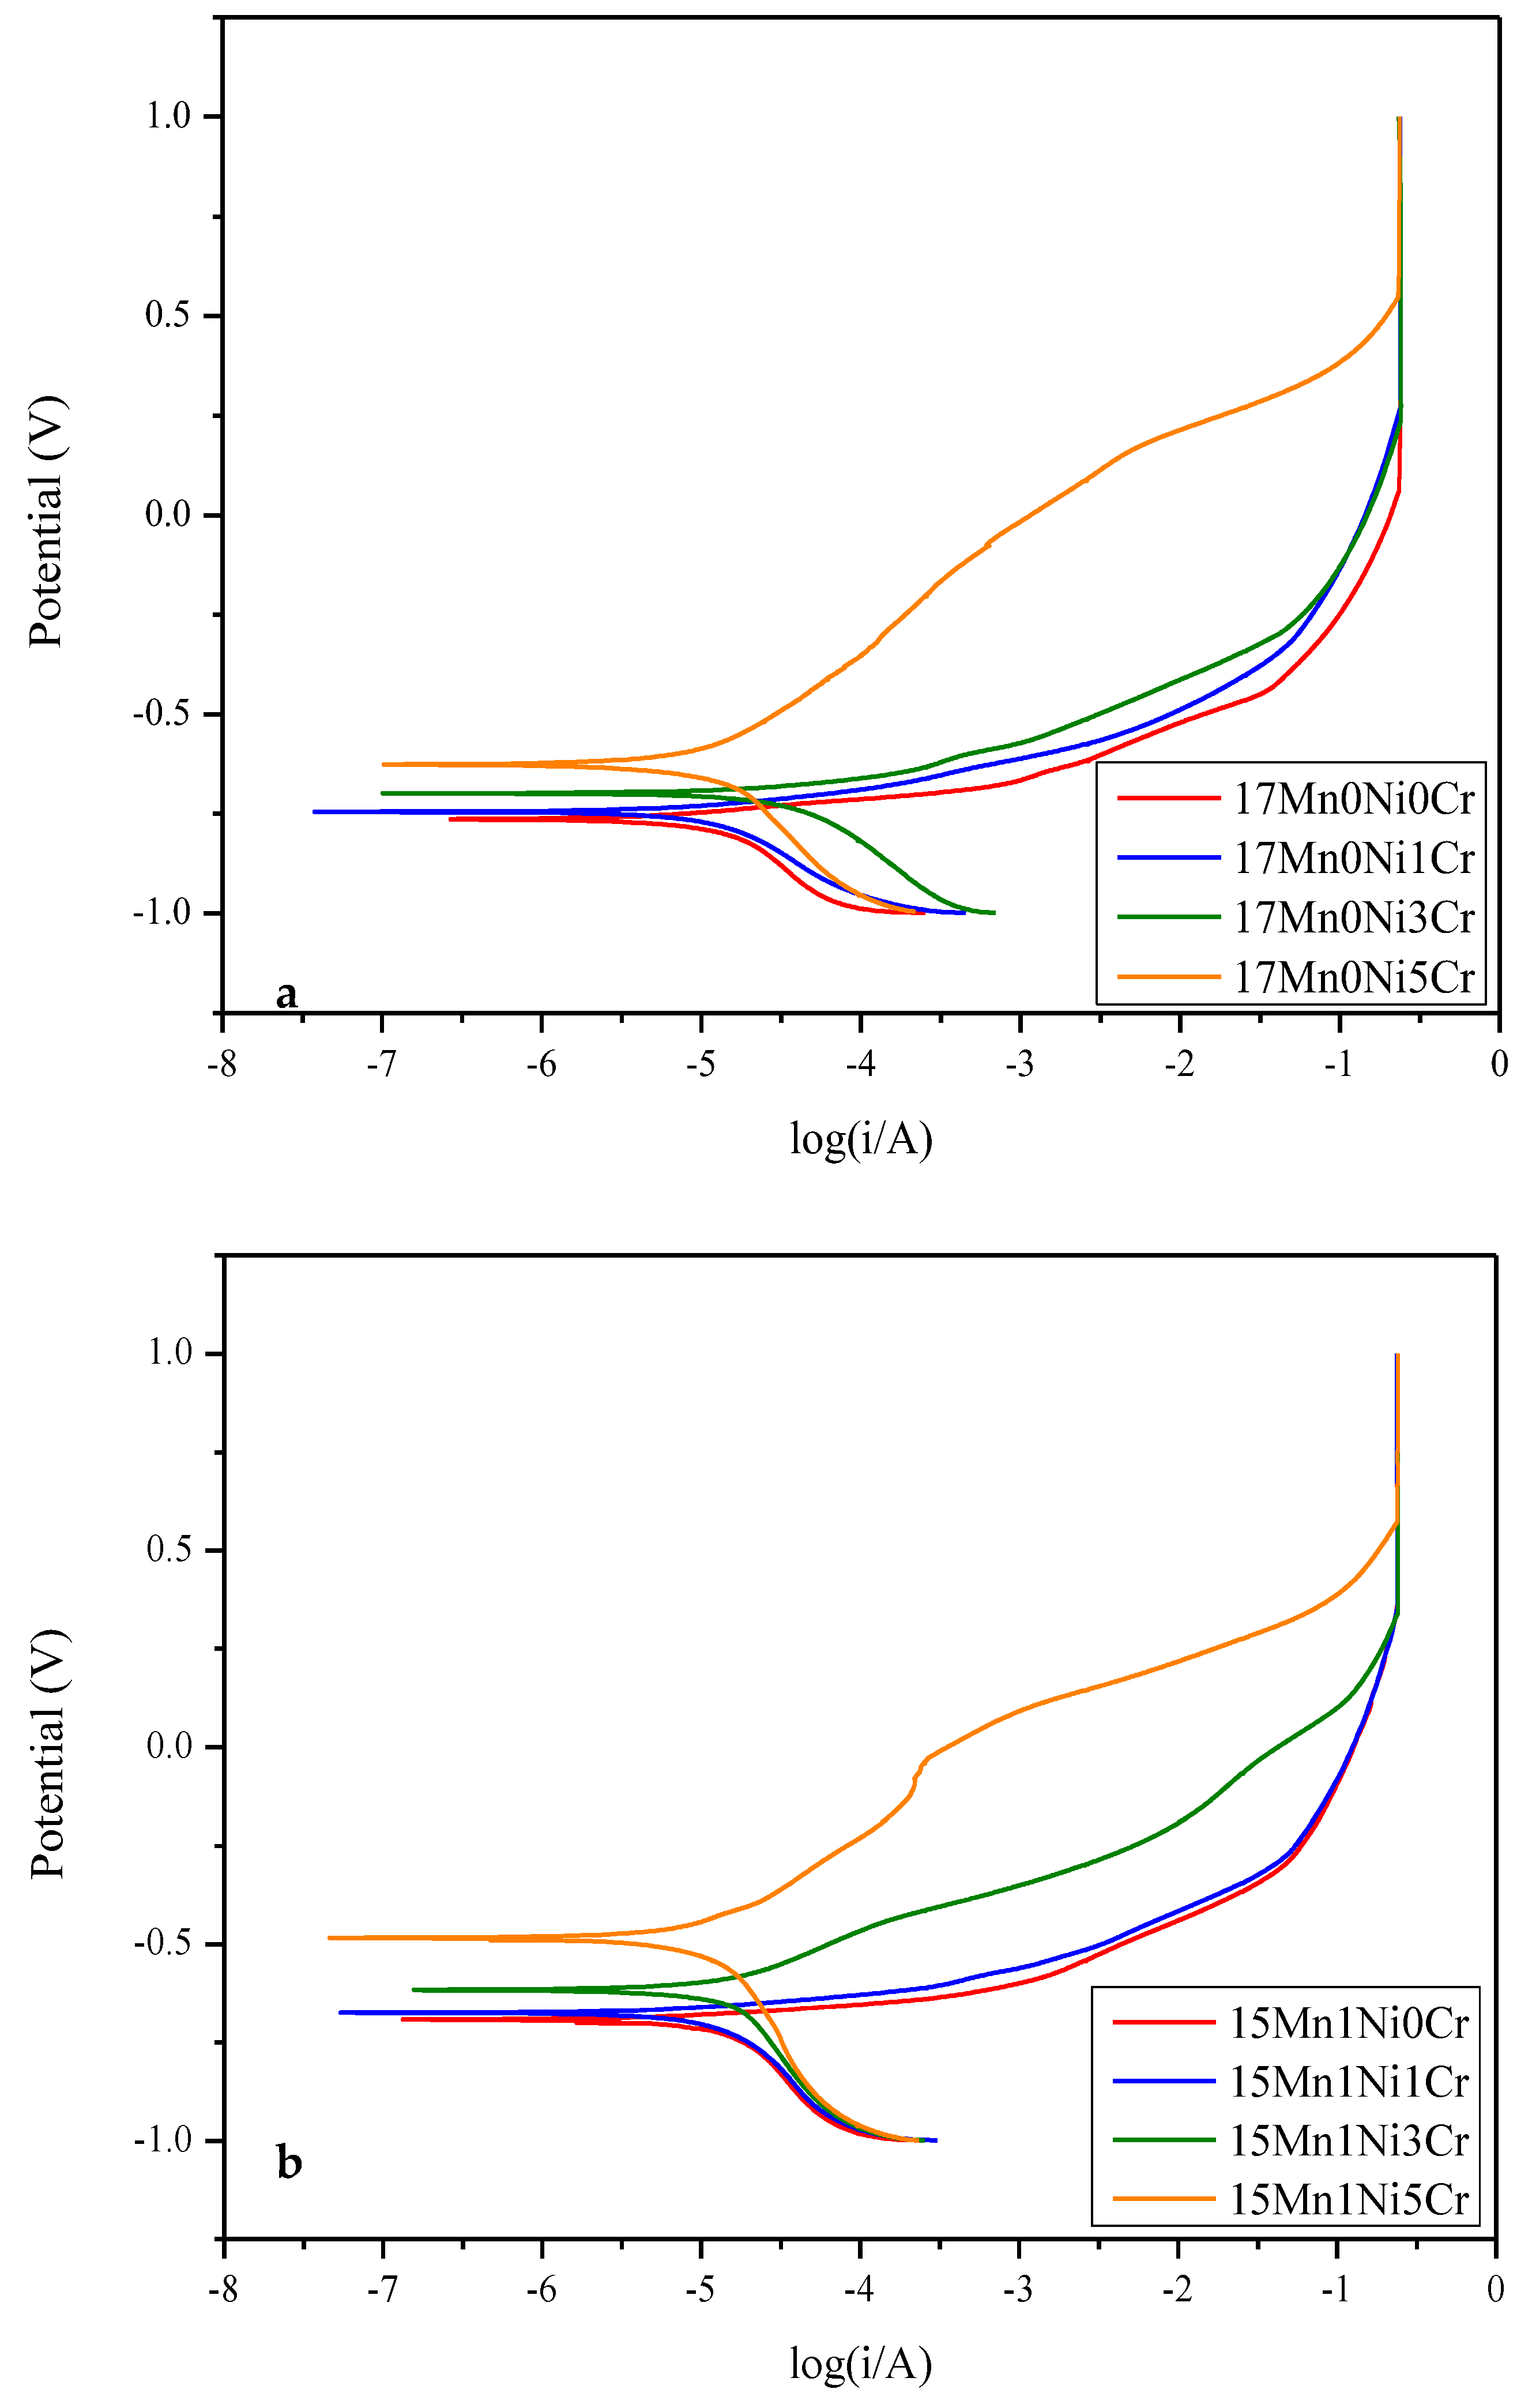
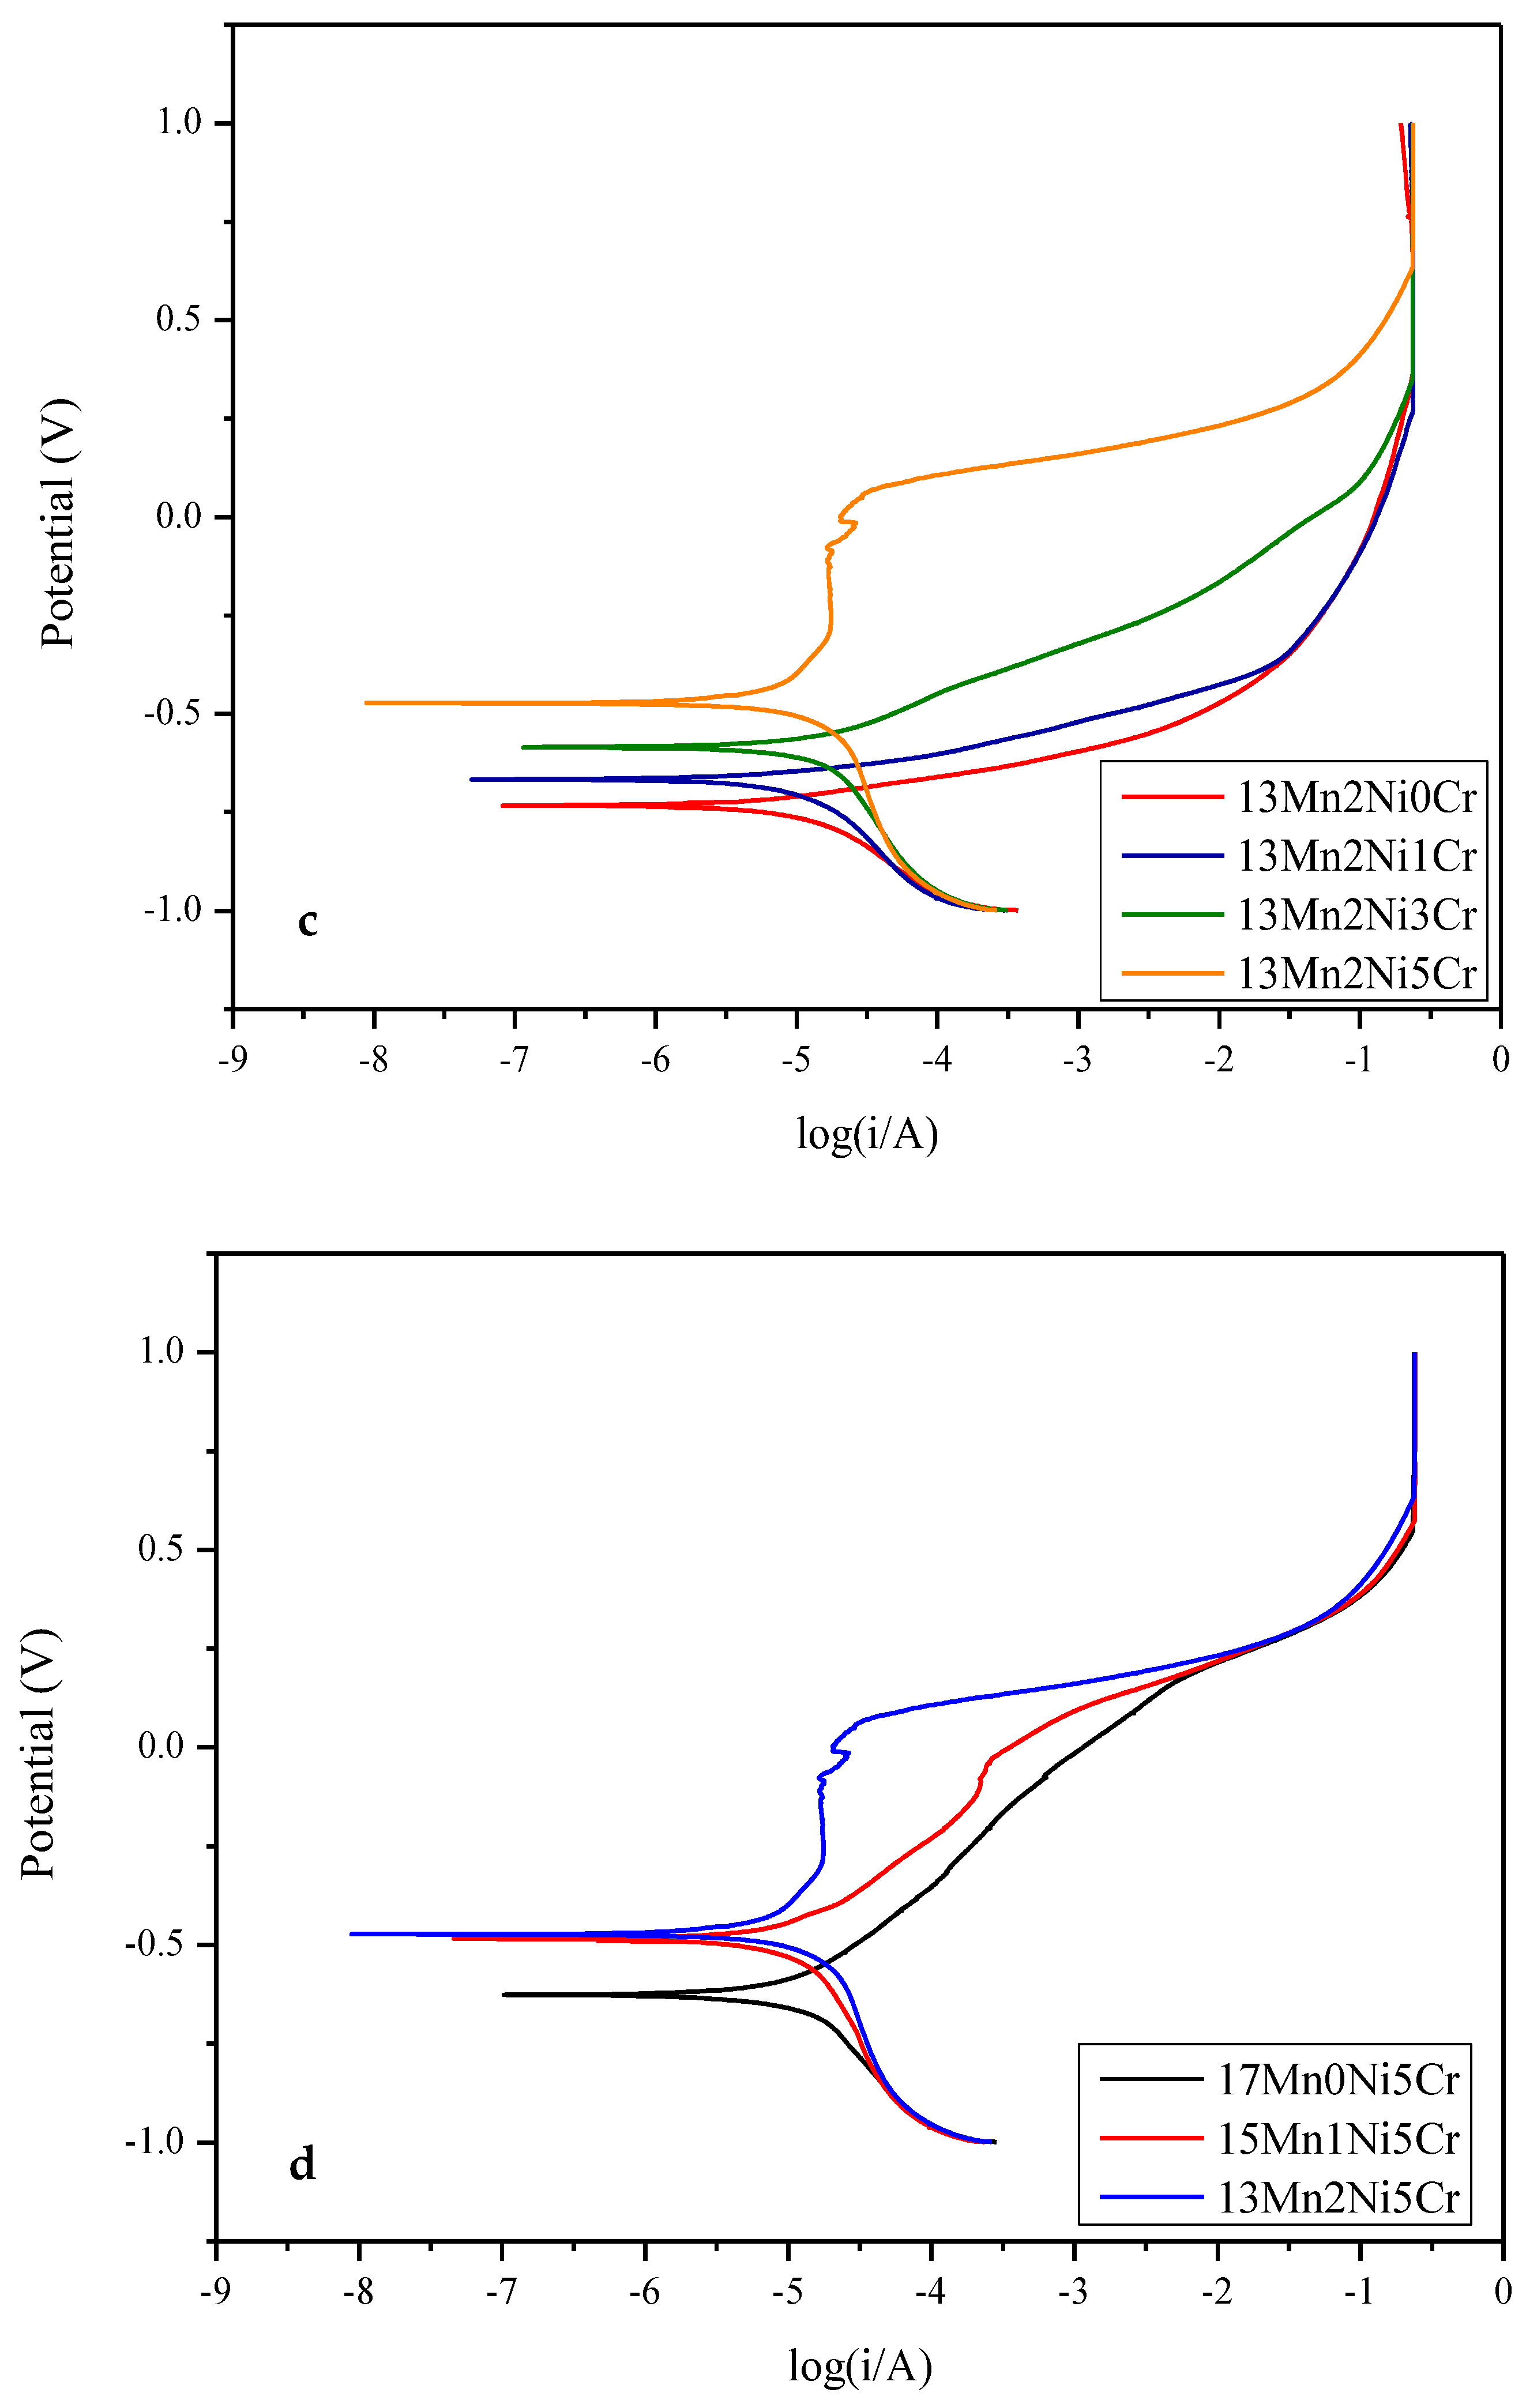
The potentiodynamic polarization of the 17Mn, 15Mn, and 13Mn series alloys in 3.5 wt% NaCl solution are presented in Figure 14, and corresponding corrosion potential and corrosion current densities are tabulated in Table 4.
A higher corrosion potential leads to a better corrosion resistance of the alloy. It can be observed from Figure 14 that alloys with higher Cr contents present higher corrosion resistance. The corrosion potential is increased as the Cr contents are increased. When Cr contents are increased from 0Cr to 5Cr in 17Mn0Ni0Cr, the Ecorr has been increased from −0.765 V to −0.627 V. Alicja et al. [34] investigated the effects of Cr on steel alloys and observed that corrosion potentials reached up to −0.31 V when Cr contents reached 5 wt%. They concluded that Cr2O3 and Cr(OH)3 layers are formed on the surface, which hinder the oxidation process. Zhibin Zheng et al. [35] also investigated the effects of Cr on Fe-Cr alloys and found that chromium is an excellent additive to improve the corrosion resistance. The corrosion potential is increased to −0.281 V when Cr concentration is increased to 10 wt% by form of the passive layer of Cr2O3. The introduction of Ni also improves the corrosion resistance. The Ecorr value in 13Mn2Ni0Cr is −0.734 V, which is increased to −0.474 V in 13Mn2Ni5Cr. When the Cr content remains unchanged, adding 1Ni to replace 2Mn has a positive effect on the corrosion resistance of the alloy. The addition Ni is also responsible for improvement in corrosion resistance by forming substantial passivation layer on the metal surface. The highest corrosion resistance is observed 13Mn2Ni5Cr as it has highest corrosion potential. It has been established by many researchers that when corrosion is added as an alloying element even in very small amount, it forms an efficient protective layer of Cr2O3 and improves the corrosion resistance [34,36]. Nabeel et al. [37] analyzed the effects of Ni contents on Fe-Ni alloys and found Ni to be an excellent corrosion resistant element. The corrosion resistance has been improved by enhancing the corrosion potential to −0.248 V. The corrosion potential is increased with the increase in Ni contents.
A very small noise at the anodic polarization curve has been observed in 13Mn2Ni5Cr, which has the characteristics of nucleation and the subsequent re-passivation of metastable pits. Both anodic and cathodic curve behavior for all alloys remains the same. The lower the corrosion current density, the higher will be the corrosion resistance. The minimum corrosion current density (Icorr) (1.231  ×  10−5 A) and highest corrosion potential Ecorr (−0.474 V) have been observed in 13Mn2Ni5Cr, indicating the most corrosion-resistant alloy. The addition of Ni and Cr enhances the corrosion resistance by changing the MnS morphology and improving the surface morphology. Since Cr has high oxygen affinity, it forms a more stable anodic film by obstructing the more surface sites.

3. Experimental Method and Process

3.1. Alloy Melting and Preparation

The vacuum arc remelting (VAR) furnace with tungsten rods as electrodes was used to manufacture the alloys. The employed VAR is a self-assembled apparatus, including the electrode, remelting chamber, vacuum pump, and power supply. The commercially available medium carbon steel S45C was used as master alloy to melt with electrolytic iron (99.99%), electrolytic manganese (99.99%), silicon (99.99%), electrolytic chromium (99.99%), and nickel (99.99%) with composition of Fe-(17-2x) Mn-6Si-xNi-yCr-0.3C. The medium carbon steel S45C was supplied by the China Steel Corporation, Kaohsiung, Taiwan, while the remaining elements were procured from the Gredmann Taiwan Ltd., Taipei, Taiwan. The commercially available medium carbon steel S45C was used as master alloy to melt with electrolytic iron (99.99%), electrolytic manganese (99.99%), silicon (99.99%), electrolytic chromium (99.99%), and nickel (99.99%) with composition of Fe-(17-2x) Mn-6Si-xNi-yCr-0.3C. Since Mn is volatile during the smelting process, it should be larger in amount than the original amount when weighing. The additional 1 wt% was added when Mn was at its maximum (17 wt%) amount, and 0.25 wt% was reduced after each 2 wt% reduction in Mn contents. So, when Mn concentration was reduced to 9 wt%, no additional amount was required. The iron was spread on the bottom of the mold, and Mn, Ni, and Cr were stacked over it. The Si was spread in grooves of the mold, and S45C was placed on the top to reduce the Mn volatilization. The Mn was pickled with 10% nitric acid in an ultrasonic oscillator for 30s prior to the smelting process. After that, it was washed twice with alcohol, subsequently wrapped in the long fiber, blow-dried with high pressure air, and immediately put into the furnace. The whole process was carried out under the protective environment of Ar. The copper mold and O-ring along with groves were cleaned with sandpapers and wiped with alcohol to remove dirt and oxides on the surface. A thin layer of vacuum paste was applied to the ring, and the copper mold was locked and sealed.
The vacuum cleaner was used to clean the inside of the gun body, and alloy materials were placed in the copper mold. The vacuum was produced inside the chamber via a mechanical oil pump, and inert gas was supplied to reach 33.33 KPa. The process was repeated six times to ensure that oxygen had been completely removed. Finally, the chamber was filled with Ar gas at 66.66 KPa. The elements were melted and then uniformly mixed to achieve a homogeneous alloy. The Fe, Mn, and Si oxides in the form of floating slag during the smelting process were removed after cooling. The process was repeated six times to get uniform alloy ingot with 30 mm × 50 mm weighing 150 g.
The alloy ingot was hot-rolled in the two-way process to eliminate the dendritic structure and obtain the homogenized microstructure. The ingot was heated to 1100 °C prior to hot rolling, and 0.5 mm thickness was reduced in every back-and-forth cycle. The ingot was placed in high temperature (1100 °C) furnace for 5 min after each rolling cycle, and the rolling process was repeated to obtain the final desired thickness of 5 mm. The final rolled ingot was solution heat-treated at 1150 °C for 1 h and aged at different temperatures 500 °C~900 °C for 1 h.
A commercially available inductively coupled plasma optical emission spectrometer (Agilent-725 ICP-OES) at the National Tsinghua University, Taiwan, was used to investigate the composition of hot-rolled samples. The ICP was operated at a power between 1.0 KW and 1.5 KW within radial and axial plasma view to detect the element. The detection range was set between 167 nm and 78 5 nm. The ICP-OES is characterized by high precision, with an estimated error percentage of less than 0.01%.

3.2. Microstructural Analysis

The samples were prepared according to ASTM-E3 standards. The specimens were ground using 120, 400, 800, 1200, and 2500 grit-sized silicon carbide sandpapers. The samples were polished with 0.3 μm alumina solution to obtain mirror-like surfaces. The polished specimens were etched in 20% Nital. The field emission scanning electron microscope (FESEM) (Hitachi S4800, Hitachi, Tokyo, Japan) with an operating voltage of 30 kV was used for microstructure observation. An X-ray diffractometer (Bruker D2, Bruker, Billerica, MA, USA) with a characteristic wavelength of λ = 1.542 Å, operating voltage of 30 kV, 10 mA current, and 2°/min scan rate were used to investigate the phase. The D2 phase has a lynxeye one-dimensional linear detector and vertical θ-θ configuration.

3.3. Corrosion Analysis

The corrosion performance of the alloys was analyzed using electrochemical corrosion tests. At least three specimens were tested to achieve better reproducibility. However, only one suitable specimen result was considered for investigation. The electrochemical behavior of the alloys was investigated using a potentiodynamic polarization (CH Instruments 608 1A). The standard three-electrode cells were composed of the sample as a working electrode, platinum plate as a counter electrode, and saturated calomel (Ag/AgCl) as a reference electrode. The 3.5 wt% NaCl solution was used as an electrolyte, and the 1 cm2 area of the sample was exposed to the electrolyte. The open-circuit potential (OCP) was recorded after immersion of the electrode in the solution for 1 h (vs. Ag/AgCl). The potentiodynamic current potential curves (Tafel curves) were recorded from −8 V to 1 V at the scan rate of 0.5 mV/min. The corrosion current density and corrosion potential were measured on the potentiodynamic curve using the tangent line method.

3.4. Shape Recovery Rate Measurement

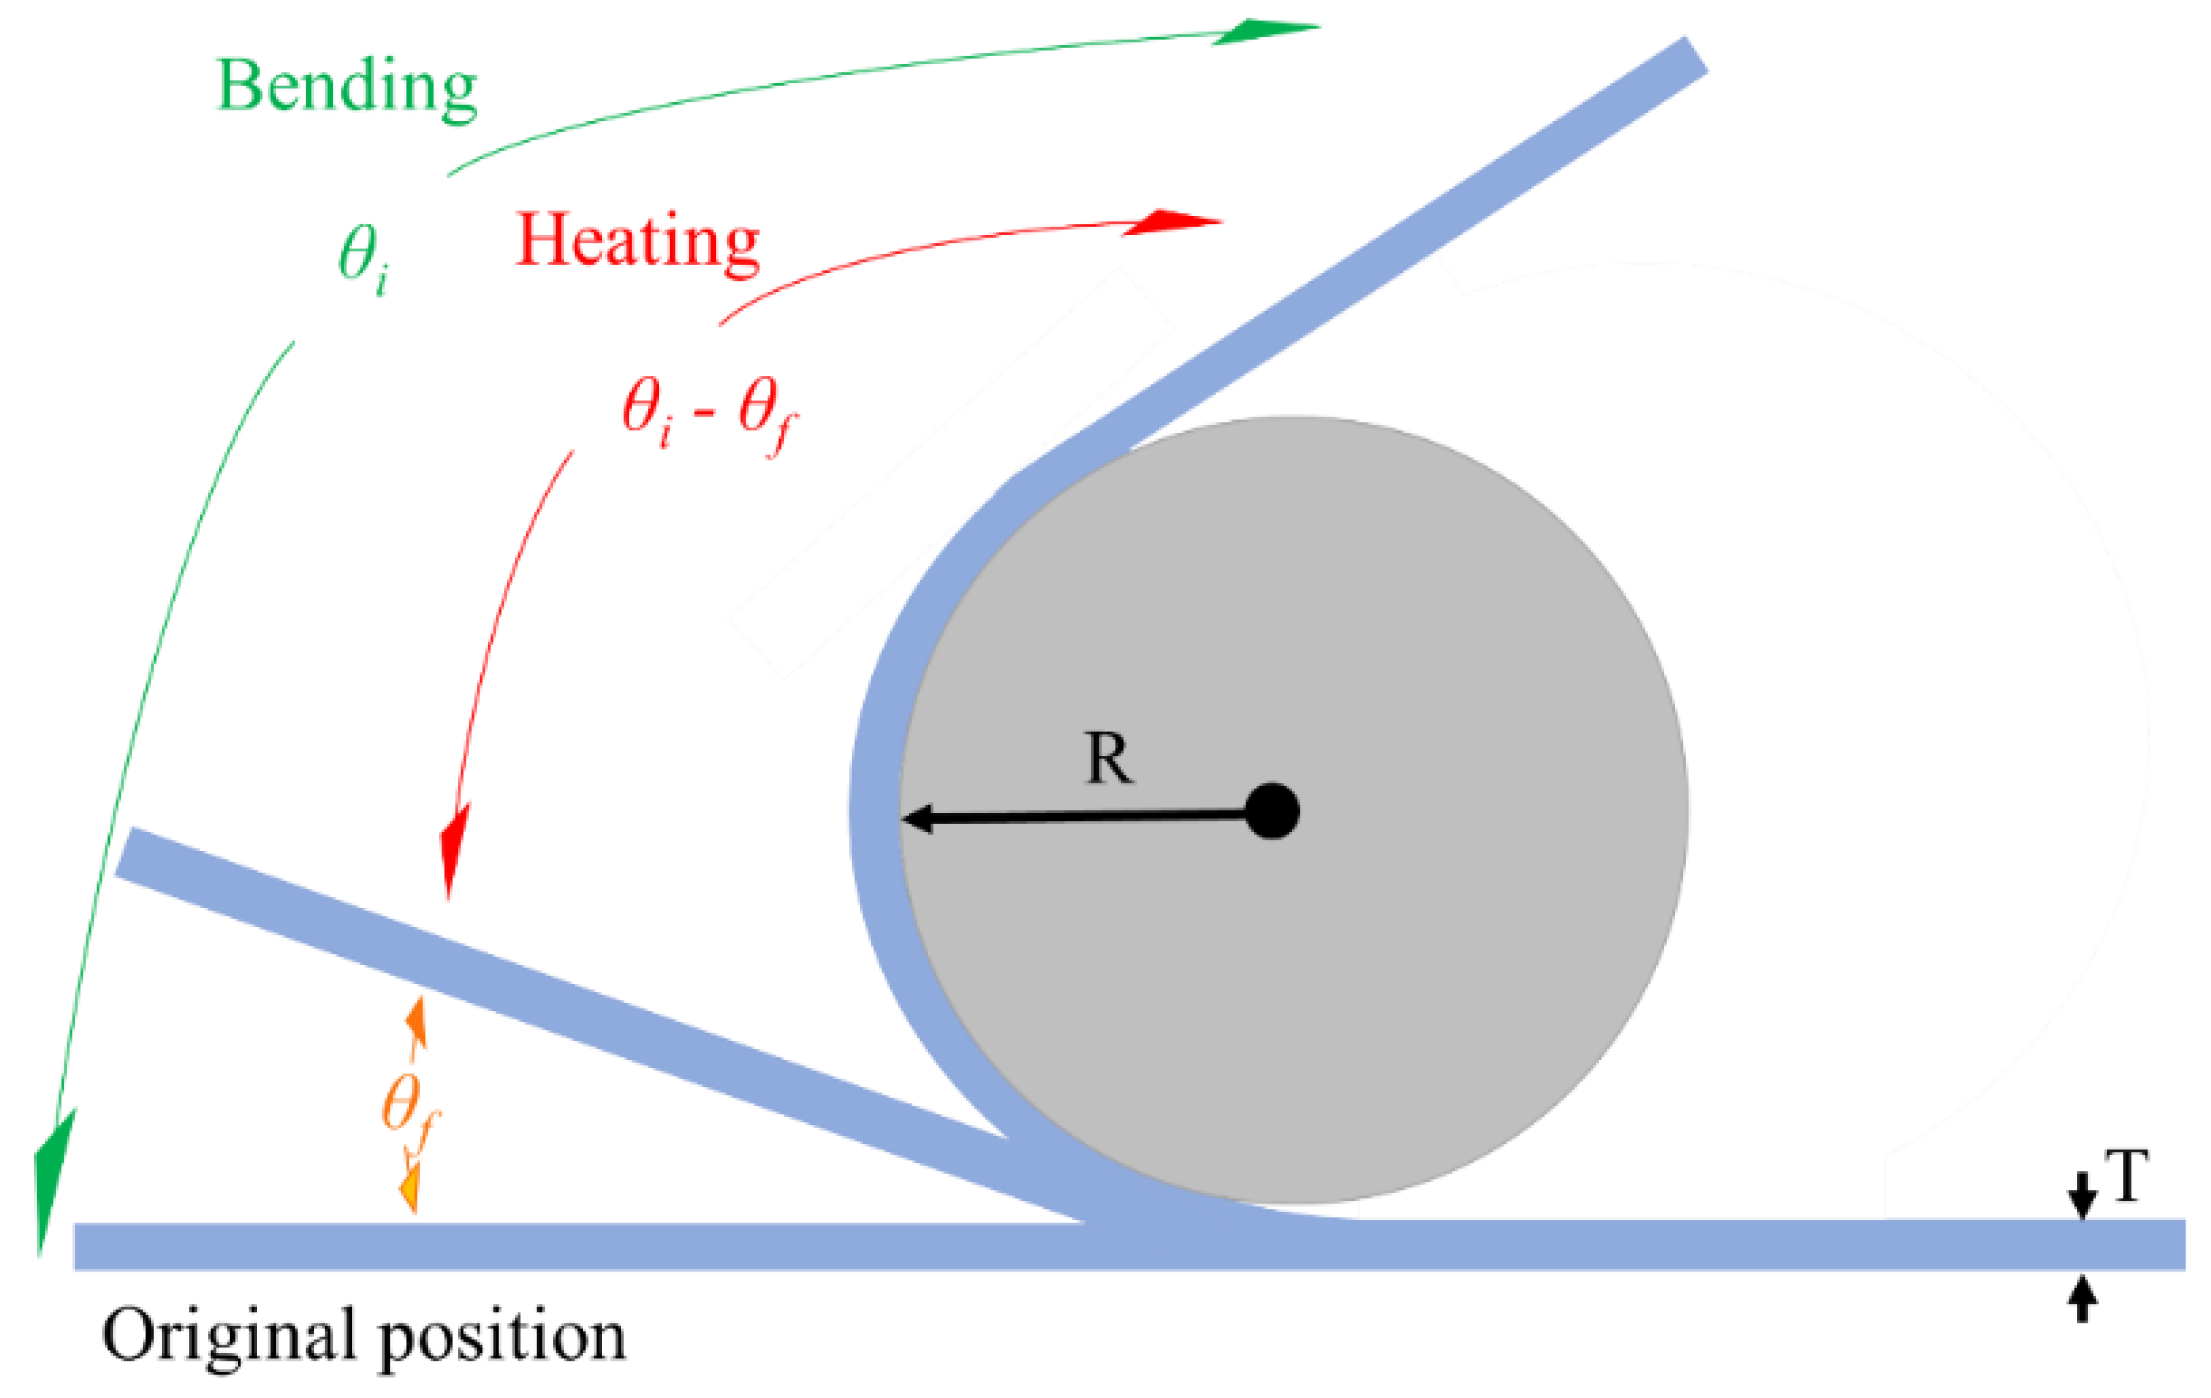
The shape recovery ratio (RSME) of the shape memory alloys was measured by the bending test. The schematic diagram of the bending test is illustrated in Figure 15. The specimens with dimensions of 0.8 mm × 0.8 mm × 60 mm were used to determine the pre-strain of the specimen according to Equation (1).
ε % = T T + 2 R × 100
where T is the thickness of specimen, R is the radius of the mold, and ε describes the pre-strain of the specimen, which is kept at 3% in this case.
The specimens were bent to the appropriate angle of θi using a special mold and then heated in a high-temperature furnace to Af (600 °C) for 10 min. The specimen will return to another angle θf. The shape recovery ratio of the shape memory alloys was determined using Equation (2) [36]. The mean shape recovery ratio for each specimen condition was calculated based on three measurements, with an estimated error percentage of less than 0.1%.
R S M E % = θ i θ f θ i × 100

4. Conclusions

1.
The addition of Ni and Cr has successfully reduced the Mn contents to 13 wt%, and shape memory performance is still better than the 2% recoverable strain required for engineering applications.
2.
The addition of Cr to each series of alloys can effectively improve the stability of the parent γ phase, and the shape memory effect of the alloy in the solid solution state is reduced.
3.
Each series of alloys has the greatest shape memory effect at 800 °C. The shape recovery ratio is 88.3% for 17Mn0Ni3Cr, 94.0% for 15Mn1Ni3Cr, 94.4% for 13Mn2Ni5Cr, 88.1% for 11Mn3Ni5Cr, and 86.8% for 9Mn4Ni7Cr.
4.
The addition of Cr and aging heat treatments at 600 °C~800 °C generates carbides similar to M23C6 and M7C3, which consequently improves the shape memory effects in the alloys.
5.
The results of the electrochemical corrosion test of this alloy system in 3.5 wt% NaCl show that the corrosion resistance of the alloy increases with the increase in Cr content; however, when the content is higher than 5Cr, pitting corrosion will occur in each alloy.

Supplementary Materials

The following supporting information can be downloaded at: https://www.mdpi.com/article/10.3390/inorganics12100262/s1, Figures S1–S27: SEM microstructure analysis of shape memory alloys with different concentrations of Ni and Cr at different heat treatment conditions; Figures S28–S30: XRD analysis of the shape memory alloys with different concentrations of Ni and Cr.

Author Contributions

Formal analysis, K.-C.C.; Investigation, A.A.; Data curation, K.-C.C.; Supervision, H.-C.L.; Project administration, K.-M.L. and H.-C.L.; Funding acquisition, K.-M.L. All authors have read and agreed to the published version of the manuscript.

Funding

The authors are pleased to acknowledge the financial support of this research by the Ministry of Science and Technology (National Science Council), Republic of China, under Grant No. MOST 109-3116-F-002-004-CC1.

Data Availability Statement

The original contributions presented in the study are included in the article/Supplementary Material, further inquiries can be directed to the corresponding author.

Conflicts of Interest

The authors declare no conflict of interest.

References

  1. Es-Souni, M.; Es-Souni, M.; Fischer-Brandies, H. Assessing the Biocompatibility of NiTi Shape Memory Alloys Used for Medical Applications. Anal. Bioanal. Chem. 2005, 381, 557–567. [Google Scholar] [CrossRef] [PubMed]
  2. Prabu, S.S.M.; Madhu, H.C.; Perugu, C.S.; Akash, K.; Mithun, R.; Kumar, P.A.; Kailas, S.V.; Anbarasu, M.; Palani, I.A. Shape Memory Effect, Temperature Distribution and Mechanical Properties of Friction Stir Welded Nitinol. J. Alloys Compd. 2019, 776, 334–345. [Google Scholar] [CrossRef]
  3. Shiva, S.; Palani, I.A.; Mishra, S.K.; Paul, C.P.; Kukreja, L.M. Investigations on the Influence of Composition in the Development of Ni–Ti Shape Memory Alloy Using Laser Based Additive Manufacturing. Opt. Laser Technol. 2015, 69, 44–51. [Google Scholar] [CrossRef]
  4. Farber, E.; Zhu, J.-N.; Popovich, A.; Popovich, V. A Review of NiTi Shape Memory Alloy as a Smart Material Produced by Additive Manufacturing. Mater. Today Proc. 2020, 30, 761–767. [Google Scholar] [CrossRef]
  5. Pan, M.-M.; Zhang, X.-M.; Zhou, D.; Misra, R.D.K.; Chen, P. Fe–Mn–Si–Cr–Ni Based Shape Memory Alloy: Thermal and Stress-Induced Martensite. Mater. Sci. Eng. A 2020, 797, 140107. [Google Scholar] [CrossRef]
  6. Michiardi, A.; Aparicio, C.; Planell, J.A.; Gil, F.J. New Oxidation Treatment of NiTi Shape Memory Alloys to Obtain Ni-Free Surfaces and to Improve Biocompatibility. J. Biomed. Mater. Res. B Appl. Biomater. 2006, 77B, 249–256. [Google Scholar] [CrossRef] [PubMed]
  7. Paula, A.S.; Canejo, J.P.H.G.; Martins, R.M.S.; Braz Fernandes, F.M. Effect of Thermal Cycling on the Transformation Temperature Ranges of a Ni–Ti Shape Memory Alloy. Mater. Sci. Eng. A 2004, 378, 92–96. [Google Scholar] [CrossRef]
  8. Ruiz-Pinilla, J.G.; Montoya-Coronado, L.A.; Ribas, C.; Cladera, A. Finite Element Modeling of RC Beams Externally Strengthened with Iron-Based Shape Memory Alloy (Fe-SMA) Strips, Including Analytical Stress-Strain Curves for Fe-SMA. Eng. Struct. 2020, 223, 111152. [Google Scholar] [CrossRef]
  9. Vollmer, M.; Bauer, A.; Kriegel, M.J.; Motylenko, M.; Niendorf, T. Functionally Graded Structures Realized Based on Fe–Mn–Al–Ni Shape Memory Alloys. Scr. Mater. 2021, 194, 113619. [Google Scholar] [CrossRef]
  10. Alaneme, K.K.; Okotete, E.A.; Anaele, J.U. Structural Vibration Mitigation—a Concise Review of the Capabilities and Applications of Cu and Fe Based Shape Memory Alloys in Civil Structures. J. Build. Eng. 2019, 22, 22–32. [Google Scholar] [CrossRef]
  11. Izadi, M.; Motavalli, M.; Ghafoori, E. Iron-Based Shape Memory Alloy (Fe-SMA) for Fatigue Strengthening of Cracked Steel Bridge Connections. Constr. Build. Mater. 2019, 227, 116800. [Google Scholar] [CrossRef]
  12. Kikuchi, T.; Kajiwara, S. Shape Memory Effect in an Unausaged Fe-Ni-Co-Ti Alloy. In Ecomaterials; Elsevier: Amsterdam, The Netherlands, 1994; pp. 989–992. [Google Scholar]
  13. Fritsch, E.; Izadi, M.; Ghafoori, E. Development of Nail-Anchor Strengthening System with Iron-Based Shape Memory Alloy (Fe-SMA) Strips. Constr. Build. Mater. 2019, 229, 117042. [Google Scholar] [CrossRef]
  14. Adarsh, S.H.; Sampath, V. Prediction of High Temperature Deformation Characteristics of an Fe-Based Shape Memory Alloy Using Constitutive and Artificial Neural Network Modelling. Mater. Today Commun. 2020, 22, 100841. [Google Scholar] [CrossRef]
  15. Zambrano, O.A.; Logé, R.E. Dynamic Recrystallization Study of a Fe-Mn-Si Based Shape Memory Alloy in Constant and Variable Thermomechanical Conditions. Mater. Charact. 2019, 152, 151–161. [Google Scholar] [CrossRef]
  16. Hallab, N.J.; Vermes, C.; Messina, C.; Roebuck, K.A.; Glant, T.T.; Jacobs, J.J. Concentration- and Composition-Dependent Effects of Metal Ions on Human MG-63 Osteoblasts. J. Biomed. Mater. Res. 2002, 60, 420–433. [Google Scholar] [CrossRef] [PubMed]
  17. Zhang, Y.; Guo, J.; Zhong, M.; Xiang, W.; Wu, Z. Martensitic Transformation Behaviour and Mechanical Property of Dual-Phase Ni-Co-Mn-Sn-Fe Ferromagnetic Shape Memory Alloys. J. Magn. Magn. Mater. 2021, 521, 167540. [Google Scholar] [CrossRef]
  18. Walnsch, A.; Kriegel, M.J.; Motylenko, M.; Korpala, G.; Prahl, U.; Leineweber, A. Thermodynamics of Martensite Formation in Fe–Mn–Al–Ni Shape Memory Alloys. Scr. Mater. 2021, 192, 26–31. [Google Scholar] [CrossRef]
  19. Min, X.H.; Sawaguchi, T.; Ogawa, K.; Maruyama, T.; Yin, F.X.; Tsuzaki, K. Shape Memory Effect in Fe–Mn–Ni–Si–C Alloys with Low Mn Contents. Mater. Sci. Eng. A 2011, 528, 5251–5258. [Google Scholar] [CrossRef]
  20. Min, X.H.; Sawaguchi, T.; Ogawa, K.; Maruyama, T.; Yin, F.X.; Tsuzaki, K. An Attempt to Lower Mn Content of Fe–17Mn–6Si–0.3C Shape Memory Alloy. J. Alloys Compd. 2013, 577, S478–S482. [Google Scholar] [CrossRef]
  21. Chen, J.; Peng, H.B.; Yang, Q.; Wang, S.L.; Song, F.; Wen, Y.H. Effect of Carbon Content on Shape Memory Effect of Fe-Mn-Si-Cr-Ni-Based Alloys at Different Deformation Temperatures. Mater. Sci. Eng. A 2016, 677, 133–139. [Google Scholar] [CrossRef]
  22. Malamud, F.; Guerrero, L.M.; La Roca, P.; Sade, M.; Baruj, A. Role of Mn and Cr on Structural Parameters and Strain Energy during FCC-HCP Martensitic Transformation in Fe-Mn-Cr Shape Memory Alloys. Mater. Des. 2018, 139, 314–323. [Google Scholar] [CrossRef]
  23. Guerrero, L.M.; La Roca, P.; Malamud, F.; Baruj, A.; Sade, M. A Short Review on the Effect of Cr on the Fcc–Hcp Phase Transition in Fe–Mn-Based Alloys. Shape Mem. Superelasticity 2020, 6, 202–212. [Google Scholar] [CrossRef]
  24. Dias, D.; Nakamatsu, S.; Della Rovere, C.A.; Otubo, J.; Mariano, N.A. Characterization and Corrosion Resistance Behavior of Shape Memory Stainless Steel Developed by Alternate Routes. Metals 2019, 10, 13. [Google Scholar] [CrossRef]
  25. Otsuka, H.; Yamada, H.; Maruyama, T.; Tanahashi, H.; Matsuda, S.; Murakami, M. Effects of Alloying Additions on Fe-Mn-Si Shape Memory Alloys. ISIJ Int. 1990, 30, 674–679. [Google Scholar] [CrossRef]
  26. Hsu, T.Y. Fe-Mn-Si Based Shape Memory Alloys. Mater. Sci. Forum 2000, 327–328, 199–206. [Google Scholar] [CrossRef]
  27. Saito, T.; Kapusta, C.; Takasaki, A. Synthesis and Characterization of Fe–Mn–Si Shape Memory Alloy by Mechanical Alloying and Subsequent Sintering. Mater. Sci. Eng. A 2014, 592, 88–94. [Google Scholar] [CrossRef]
  28. Li, C.L.; Cheng, D.J.; Jin, Z.H. Influence of Deformation Temperature on Shape Memory Effect of Fe–Mn–Si–Ni–Cr Alloy. Mater. Sci. Eng. A 2002, 325, 375–379. [Google Scholar] [CrossRef]
  29. Aksu Canbay, C.; Karagoz, Z. The Effect of Quaternary Element on the Thermodynamic Parameters and Structure of CuAlMn Shape Memory Alloys. Appl. Phys. A 2013, 113, 19–25. [Google Scholar] [CrossRef]
  30. Liu, A.; Meng, X.; Cai, W.; Zhao, L.C. Effect of Ce Addition on Martensitic Transformation Behavior of TiNi Shape Memory Alloys. Mater. Sci. Forum 2005, 475–479, 1973–1976. [Google Scholar] [CrossRef]
  31. Shen, Y.; Sun, W.; Wei, Z.; Li, J.; Guo, J.; Wang, K.; Zhang, Y.; Liu, J. Influence of Microstructure on Elastocaloric and Shape Memory Effects in Mn50Ni32Sn7Co11 Alloys. J. Alloys Compd. 2020, 832, 154830. [Google Scholar] [CrossRef]
  32. Koster, M.; Lee, W.J.; Schwarzenberger, M.; Leinenbach, C. Cyclic Deformation and Structural Fatigue Behavior of an FE–Mn–Si Shape Memory Alloy. Mater. Sci. Eng. A 2015, 637, 29–39. [Google Scholar] [CrossRef]
  33. Alcantar-Mondragón, N.; Reyes-Calderón, F.; García-García, V.; Vázquez-Gómez, O.; Salgado-López, J.M. Effect of PWHT on the Dissolution of δ-Ferrite in the Welded Joint of 12Cr–1Mo Steels for Steam Turbines. J. Mater. Res. Technol. 2021, 10, 1262–1279. [Google Scholar] [CrossRef]
  34. Łukaszczyk, A.; Banaś, J.; Pisarek, M.; Seyeux, A.; Marcus, P.; Światowska, J. Effect of Cr Content on Corrosion Resistance of Low-Cr Alloy Steels Studied by Surface and Electrochemical Techniques. Electrochem 2021, 2, 546–562. [Google Scholar] [CrossRef]
  35. Zheng, Z.; Chen, S.; Long, J.; Zheng, K.; Wang, H.; Li, H. Effect of Chromium Content on the Erosion-Corrosion Behavior of Fe-Cr Alloy Produced by Ball Milling Liner in Weakly Alkaline Slurry. Mater. Res. Express 2020, 7, 036510. [Google Scholar] [CrossRef]
  36. Abbas, A.; Hsu, J.-W.; Naqvi, S.M.A.; Lin, H.-C.; Lin, K.-M. Effects of Ti and Nb Additions on Microstructure and Shape Memory Effect of Fe-10Mn-6Si-4Ni-7Cr-0.3C Shape Memory Alloy. JOM 2024. [Google Scholar] [CrossRef]
  37. Alharthi, N.; Sherif, E.-S.M.; Abdo, H.S.; Zein El Abedin, S. Effect of Nickel Content on the Corrosion Resistance of Iron-Nickel Alloys in Concentrated Hydrochloric Acid Pickling Solutions. Adv. Mater. Sci. Eng. 2017, 2017, 1–8. [Google Scholar] [CrossRef]
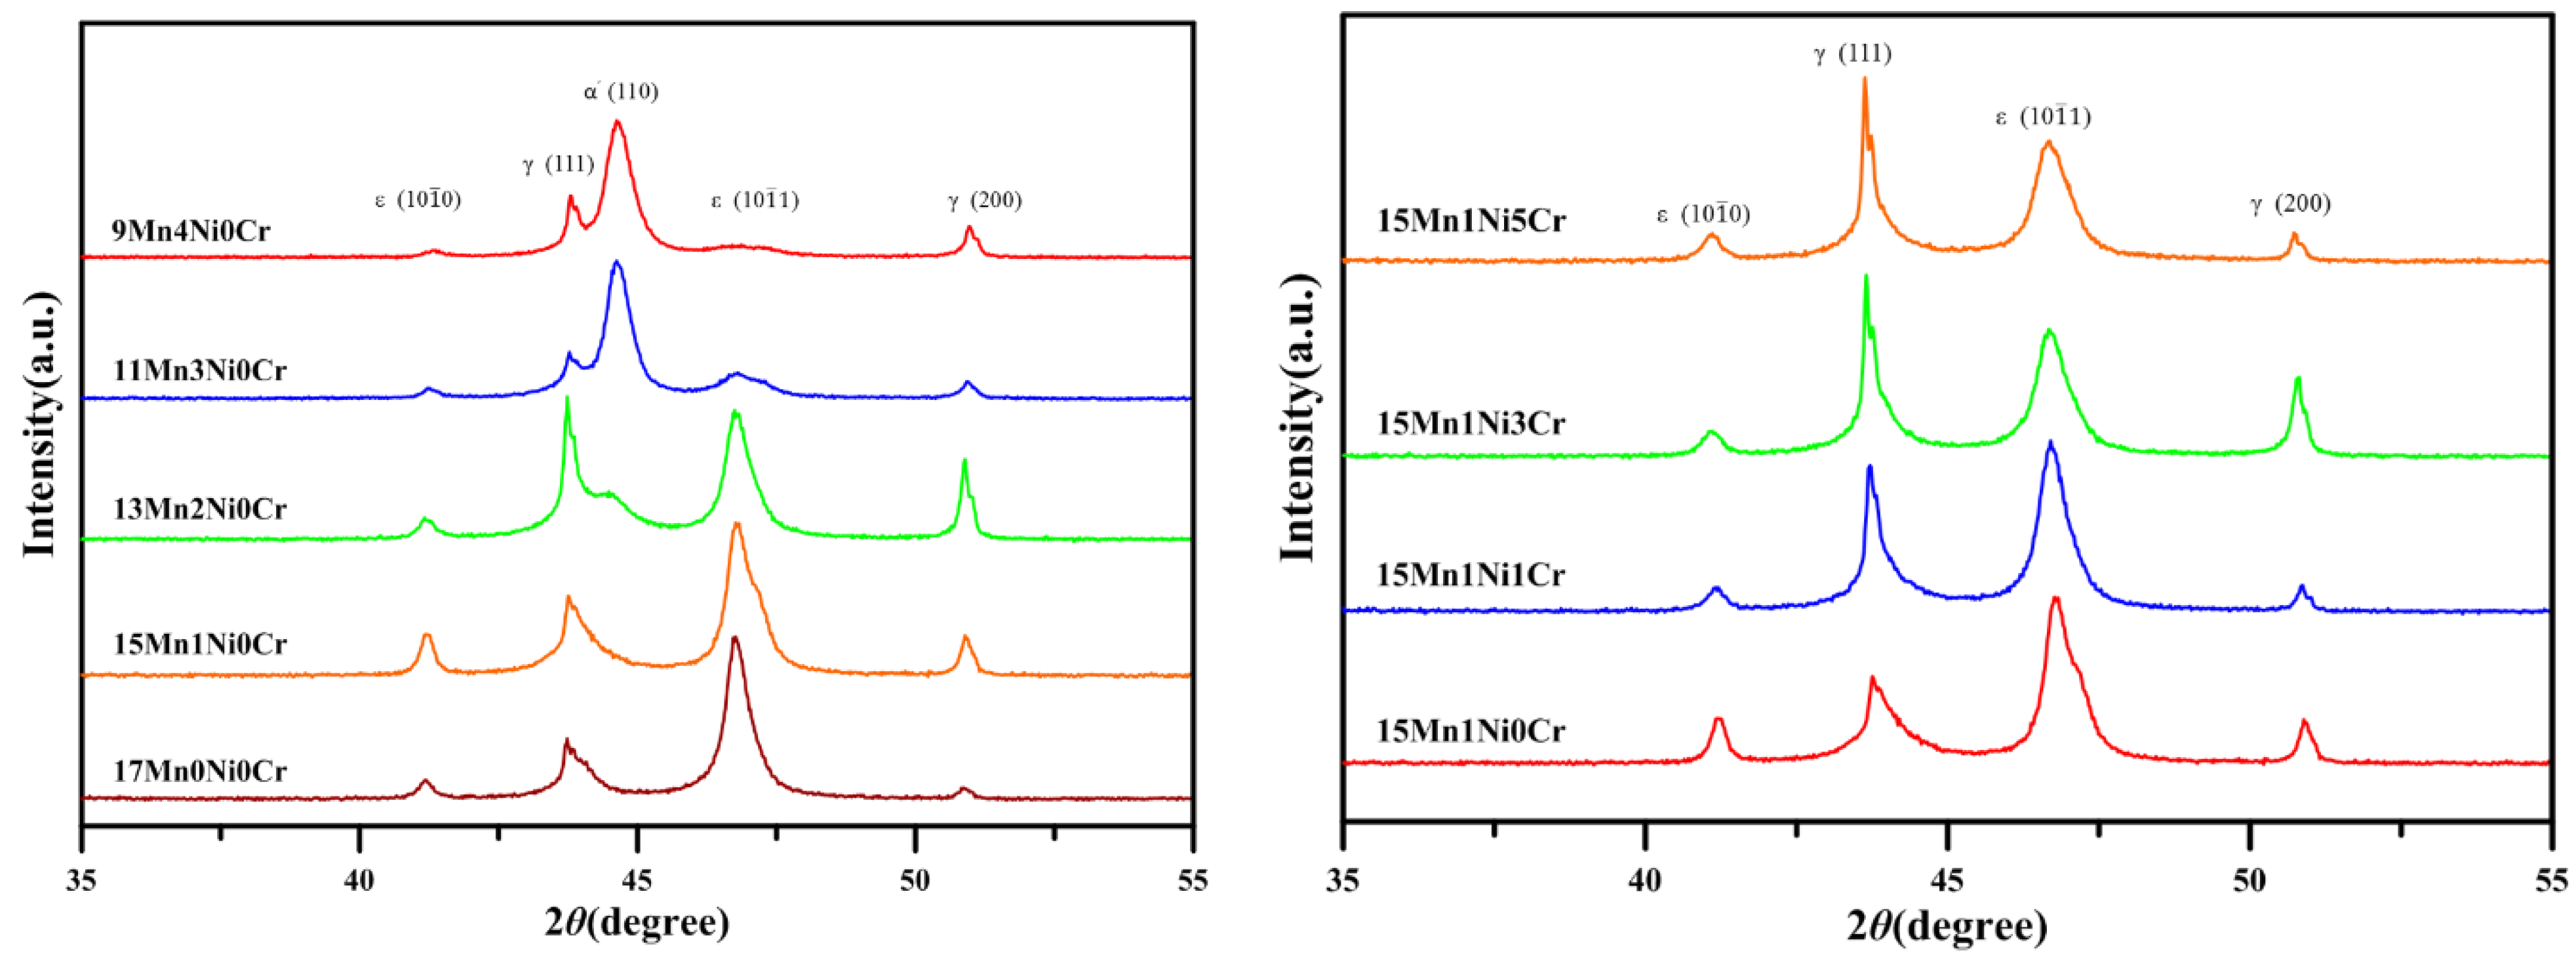
Figure 1. XRD patterns of Fe-(17-2x)Mn-6Si-xNi-yCr-0.3C alloys after solid solution treatment.
Inorganics 12 00262 g001
Figure 2. XRD pattern of 15Mn1Ni5Cr and 9Mn4Ni5Cr alloys after water quenching and high-temperature aging.
Inorganics 12 00262 g002
Figure 3. SEM image of γ and martensite dual-phase structure of 17Mn0Ni0Cr~9Mn4Ni0Cr: (a) 17Mn0Ni0Cr, (b) 15Mn1Ni0Cr, (c) 13Mn2Ni0Cr, and (d) 11Mn3Ni0Cr.
Inorganics 12 00262 g003
Figure 4. SEM image of γ and ε dual-phase structure of (a) 15Mn1Ni1Cr, (b) 15Mn1Ni3Cr, (c) 15Mn1Ni5Cr, (d) 9Mn4Ni0Cr, (e) 9Mn4Ni5Cr, and (f) 9Mn4Ni7Cr.
Inorganics 12 00262 g004
Figure 5. SEM images of 15Mn1Ni5Cr after aging treatment at (a) 600 °C, (b) 700 °C, (c) 800 °C, and (d) 900 °C.
Inorganics 12 00262 g005
Figure 6. SEM images of 9Mn4Ni5Cr after aging treatment at (a) 600° C, (b) 700 °C, (c) 800 °C, and (d) 900 °C.
Inorganics 12 00262 g006
Figure 7. Shape recovery ratio (%) of 17Mn series alloys after solution treatment and aging at different temperatures for 1 h.
Inorganics 12 00262 g007
Figure 8. Shape recovery ratio (%) of 15Mn series alloys after solution treatment and aging at different temperatures for 1 h.
Inorganics 12 00262 g008
Figure 9. Shape recovery ratio (%) of 13Mn series alloys after solution treatment and aging at different temperatures for 1 h.
Inorganics 12 00262 g009
Figure 10. Shape recovery ratio (%) of 11Mn series alloys after solution treatment and aging at different temperatures for 1 h.
Inorganics 12 00262 g010
Figure 11. Shape recovery ratio (%) of 9Mn series alloys after solution treatment and aging at different.
Inorganics 12 00262 g011
Figure 12. Shape recovery ratio (%) of alloys at constant concentration of 0Cr.
Inorganics 12 00262 g012
Figure 13. Shape recovery ratio (%) of alloys at constant concentration of 5Cr.
Inorganics 12 00262 g013
Figure 14. Potentiodynamic curves for (a) 17Mn series alloys, (b) 15Mn series alloys, (c) 13Mn series alloys, and (d) alloys with 5Cr.
Inorganics 12 00262 g014aInorganics 12 00262 g014b
Figure 15. Schematic diagram of bending test.
Inorganics 12 00262 g015
Table 1. Alloy composition (wt%) [ICP-OES measurement] and nomenclature.
AlloyFeMnSiCrNiC
17Mn0Ni0Crbal.17.35.58--0.3
17Mn0Ni1Crbal.17.35.511.03-*
17Mn0Ni3Crbal.16.85.473.03-*
17Mn0Ni5Crbal.17.25.625.08-*
15Mn0Ni0Crbal.15.25.56-1.200.3
15Mn1Ni1Crbal.14.85.631.031.03*
15Mn1Ni3Crbal.14.75.633.031.01*
15Mn1Ni5Crbal.14.75.625.041.01*
13Mn2Ni0Crbal.13.15.79-2.060.3
13Mn2Ni1Crbal.13.05.601.042.04*
13Mn2Ni3Crbal.13.15.423.062.04*
13Mn2Ni5Crbal.12.85.635.052.01*
11Mn3Ni0Crbal.10.65.55-3.040.3
11Mn3Ni1Crbal.10.65.551.033.05*
11Mn3Ni3Crbal.10.75.703.063.02*
11Mn3Ni5Crbal.10.25.544.822.98*
9Mn4Ni0Crbal.8.975.60-3.880.3
9Mn4Ni5Crbal.8.735.565.033.98*
9Mn4Ni7Crbal.8.725.486.964.02*
Note: * values have not been measured.
Table 2. Shape recovery rate (%) of SMA alloys after solution treatment and aging at different temperatures for 1 h.
AlloySolid Solution Treatment500 °C600 °C700 °C800 °C900 °C
17Mn0Ni0Cr74.576.978.680.083.881.1
17Mn0Ni1Cr72.275.478.485.086.682.6
17Mn0Ni3Cr65.968.375.783.688.382.9
17Mn0Ni5Cr59.865.673.481.387.384.6
15Mn1Ni0Cr72.974.675.080.484.180.4
15Mn1Ni1Cr74.175.981.691.090.382.2
15Mn1Ni3Cr61.875.878.191.694.083.3
15Mn1Ni5Cr57.664.170.286.992.992.6
13Mn2Ni0Cr71.072.277.478.976.674.7
13Mn2Ni1Cr71.371.473.682.085.979.4
13Mn2Ni3Cr70.473.176.490.491.481.3
13Mn2Ni5Cr53.957.266.180.794.492.7
11Mn3Ni0Cr53.551.546.954.352.746.9
11Mn3Ni1Cr61.259.965.466.166.765.5
11Mn3Ni3Cr64.163.272.576.374.270.9
11Mn3Ni5Cr47.344.652.666.688.184.4
9Mn4Ni0Cr34.834.927.128.334.327.7
9Mn4Ni5Cr56.355.155.871.881.579.8
9Mn4Ni7Cr48.137.548.161.686.883.6
Table 3. Phase transformation temperatures of SMAs.
AlloyMsAs
17Mn0Ni0Cr−49.5 °C198.2 °C
15Mn1Ni0Cr−12.4 °C188.4 °C
15Mn1Ni1Cr−15.7 °C111.3 °C
15Mn1Ni3Cr−17.9 °C110.4 °C
15Mn1Ni5Cr−18.7 °C109.7 °C
13Mn2Ni0Cr−10.5 °C183.5 °C
11Mn3Ni0Cr−8.5 °C177.5 °C
9Mn4Ni0Cr−3.6 °C110.9 °C
Table 4. Corrosion potential and corrosion current density of SMAs in 3.5 wt% NaCl solution.
AlloyEcorr (V)Icorr (A)
17Mn0Ni0Cr−0.7652.617 × 10−5
17Mn0Ni1Cr−0.7461.557 × 10−5
17Mn0Ni3Cr−0.7001.384 × 10−5
17Mn0Ni5Cr−0.6271.266 × 10−5
15Mn1Ni0Cr−0.6932.351 × 10−5
15Mn1Ni1Cr−0.6751.289 × 10−5
15Mn1Ni3Cr−0.6171.265 × 10−5
15Mn1Ni5Cr−0.4851.236 × 10−5
13Mn2Ni0Cr−0.7341.454 × 10−5
13Mn2Ni1Cr−0.6671.275 × 10−5
13Mn2Ni3Cr−0.5861.247 × 10−5
13Mn2Ni5Cr−0.4741.231 × 10−5
Disclaimer/Publisher’s Note: The statements, opinions and data contained in all publications are solely those of the individual author(s) and contributor(s) and not of MDPI and/or the editor(s). MDPI and/or the editor(s) disclaim responsibility for any injury to people or property resulting from any ideas, methods, instructions or products referred to in the content.