Article

On the Interaction between PEDOT:PSS Dispersions and Aluminium Electrodes for Solid State Electrolytic Capacitors

Department of Materials and Chemistry, Research Group Electrochemical and Surface Engineering (SURF), Vrije Universiteit Brussel, Pleinlaan 2, 1050 Brussels, Belgium
*
Author to whom correspondence should be addressed.
Inorganics 2024, 12(4), 104; https://doi.org/10.3390/inorganics12040104
Submission received: 18 March 2024 / Revised: 1 April 2024 / Accepted: 2 April 2024 / Published: 5 April 2024
(This article belongs to the Special Issue Recent Advances in Energy Storage and Conversion)

Abstract

:
The use of conductive polymers in aluminium electrolytic capacitors prevents leakage and enlarges the temperature use range when compared with their liquid counterparts. PEDOT:PSS is an outstanding candidate due to its tunable properties, i.e., electronic conductivity (10−5 to 103 S/cm), and its high thermal stability. As a result of their synthesis, PEDOT:PSS dispersions are characterized by a low pH value, which can influence pH sensitive materials such as aluminium. However, no work to date has studied the interaction between PEDOT:PSS dispersions and aluminium oxide substrates. In this work, the interface and interaction between PEDOT:PSS and an aluminium electrode were studied for the first time via odd random phase electrochemical impedance spectroscopy and analysed post mortem by SEM and AFM characterization. PEDOT:PSS dispersions at different pH values (1.9, 4.9, 5.8) were applied in a layered manner onto a non-etched aluminium substrate with a grown oxide layer on top, which provided a model system for the analysis of the interface. The analysis showed that the acidic PEDOT:PSS dispersions attacked the aluminium substrate, forming pores on the surface, but had a positive impact on the capacitance of the aluminium oxide/PEDOT:PSS systems. On the other hand, neutral dispersions did not affect the aluminium electrode, but showed poor layer formation properties, and the electrochemical analysis displayed a dispersion of results ranging from capacitive to resistive behaviour.

1. Introduction

Electrical capacitors are energy storage devices that hold high power values but rather low energy density values. These devices have been known about since the XVIII century and they are, up through today, a key component in different applications: energy storage, power conditioning, power factor correction, etc. [1]. Despite their good properties, they are often bound to the use of liquid electrolytes. Consequently, capacitors suffer from some issues derived from their use. The performance of capacitors can be affected by the mere effect of leaking of the electrolyte due to rupture of the device’s casing [2,3,4]. Additionally, as a result of their construction, electrolytic capacitors are bipolar. Therefore, connecting capacitors and inverting their polarity can lead to gas evolution and pressure build up, ultimately leading to the explosion of the device. Last but not least, the functioning of electrolytic capacitors is limited to the temperature range within which the electrolyte stays liquid. Thus, there are some conditions for which classical electrolytic capacitors are not applicable (e.g., temperatures outside the freezing and boiling points of the solvent).
Polymer solid electrolytic capacitors are a viable option for those scenarios in which liquid electrolytic capacitors cannot be used [5]. Most polymers are insulators; however, there is a specific type of polymers that can conduct electricity [6]. These, called conductive polymers, can substitute the liquid electrolytes in capacitors by providing either enough ionic mobility, as it is the case for gel-like polymers, or conducting electrons, or both simultaneously [7,8]. Different conductive polymers have been used for this purpose, but poly(3,4-ethylenedioxythiophene), or PEDOT [9,10,11,12], has stood out since its discovery in 1988. As an example, its high and tunable electronic conductivity (10−5 to 103 S/cm [13]) and high thermal stability (up to 200 °C [10]) are the most interesting characteristics. However, the conductive properties of PEDOT are achieved when it is in its oxidized state, requiring a counterion to balance the positive charge and maintain electroneutrality [13]. Among the different types of counterions, polystyrene sulfonate, or PSS, is one of the most used. The blend PEDOT:PSS is an advantageous material because it can form a stable dispersion in water, which makes its application and processability easier and greener than the in situ electropolymerization route [14] and accepts dopants or modifiers that allow one to fine tune the properties of the final film [15]. PEDOT:PSS has, nevertheless, a very acidic character (pH 2) as a result of the sulfonate groups that come along with the PSS. Some studies can be found [16,17] that explored how the dispersion’s pH changes the properties of free standing PEDOT:PSS films. For most applications, the pH value of PEDOT:PSS is not a problem, but when PEDOT:PSS is deposited on top of materials sensitive to pH, they can be affected by it and change their properties [18,19]. An example of unstable material in low pH environments is the aluminium substrate in polymer aluminium electrolytic capacitors [20,21]. Wakabayashi et al. [16] formed polymer aluminium electrolytic capacitors by depositing PEDOT:PSS dispersions of different pH onto porous aluminium electrodes and studied the differences in performance of the formed capacitors. They found that the colloidal size of PEDOT:PSS in aqueous dispersions increases proportionally with pH. They also studied the connection of pH to the conductivity of PEDOT:PSS and capacitance of PEDOT:PSS and porous aluminium systems. They found the conductivity to be directly linked to the level of doping of PEDOT:PSS, which decreased with increasing pH. In addition, they found the capacitance to be connected to the degree of coverage of the porous electrode, which happened at the smallest colloidal size of PEDOT:PSS and, therefore, at a low pH. Thus, they concluded that a PEDOT:PSS dispersion at pH 3 was optimal for achieving the highest values of conductivity and capacitance.
Despite the study of the pH of PEDOT:PSS, they considered neither the changes on the aluminium electrode nor the interaction between this and PEDOT:PSS. In order to have a better understanding of the PEDOT:PSS/aluminium systems, it is key to study the interaction between these two elements in a capacitor. Therefore, in this work, a thorough analysis of the interface between the PEDOT:PSS and the aluminium oxide is conducted to reach a better understanding of how, and if so how much, the polymer layer affects the aluminium electrode and how this can help to build safe and long lasting polymer solid state electrolytic capacitors. A combination of planar aluminium substrate, aluminium oxide, and PEDOT:PSS creates a simplified system, resulting in a suitable framework for the study of the interaction between these components. The flat aluminium electrode will provide a controlled homogeneous surface as a framework to track any changes upon the deposition of polymer. On the aluminium electrode, oxide layers with two thicknesses are grown to study their barrier properties when exposed to PEDOT:PSS. Finally, different numbers of layers of PEDOT:PSS of every dispersion are deposited to analyse the difference in performance of polymer solid electrolytic capacitors arising from the difference in pH and the increase in amount of PEDOT:PSS.

2. Results and Discussion

2.1. Analysis of the Interaction of an Aluminium Electrode with a Pristine PEDOT:PSS Dispersion (pH 1.9)

As a first analysis, it is important to ascertain what kind of interaction is found between a pristine dispersion of PEDOT:PSS and a planar aluminium electrode with an oxide layer on top. Hence, first samples consisting of an aluminium substrate, a dielectric aluminium oxide layer of different thicknesses grown on top, and a number of PEDOT:PSS layers were produced. 
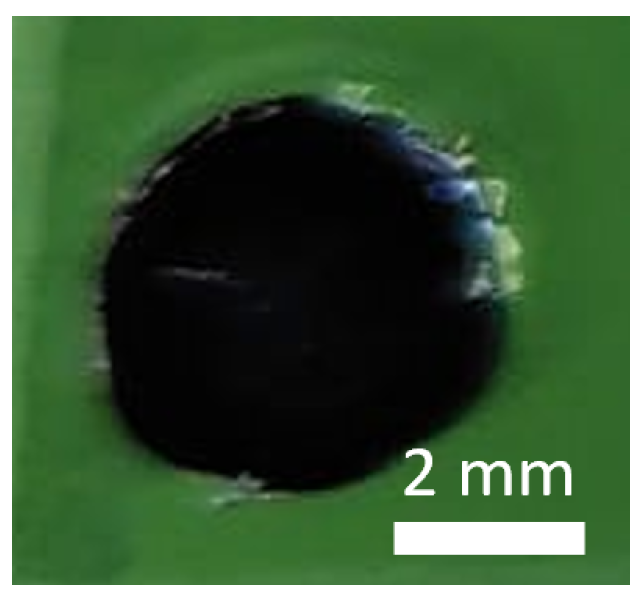
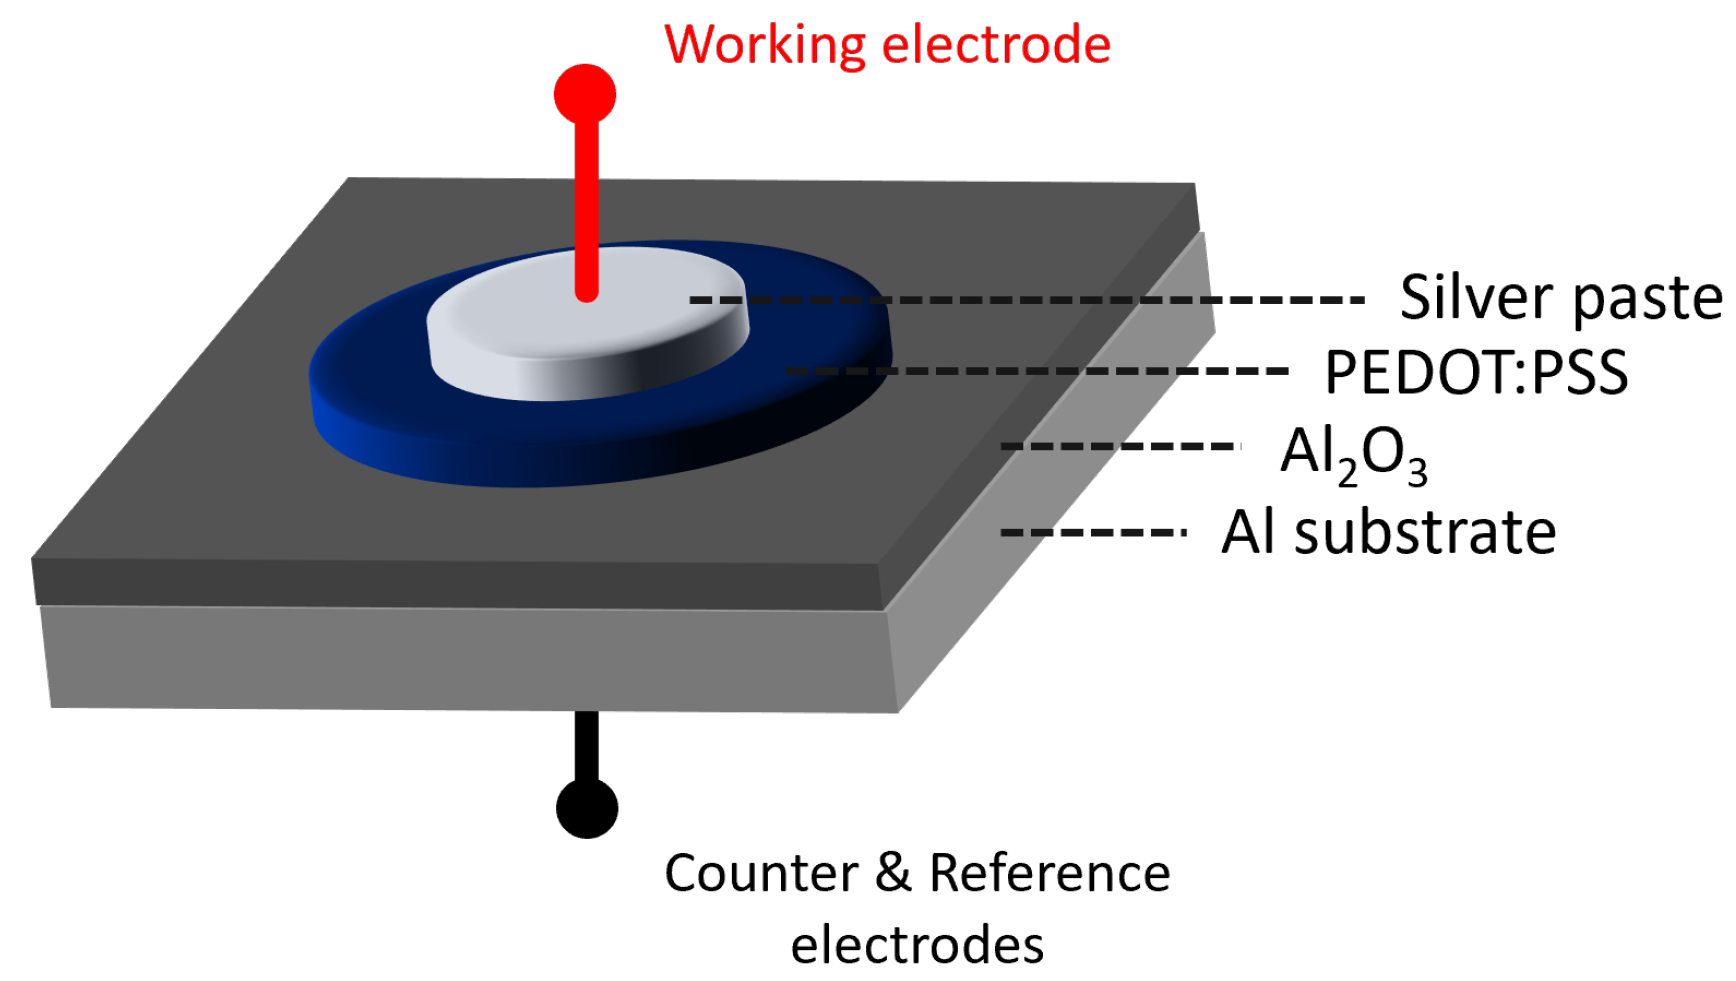
Figure 1 depicts the sample with three PEDOT:PSS layers in its pristine state as deposited. It can be visually observed how the layer was formed uniformly in a dark blue colour, as it is characteristic for PEDOT:PSS.
After drying the layers of PEDOT:PSS, a layer of silver paste as current collector was added and the impedance analysis was performed. Additionally, two reference samples consisting of a layer of silver paste on top of the aluminium oxide layer were produced and measured via ORP-EIS. Each of the ORP-EIS spectra (
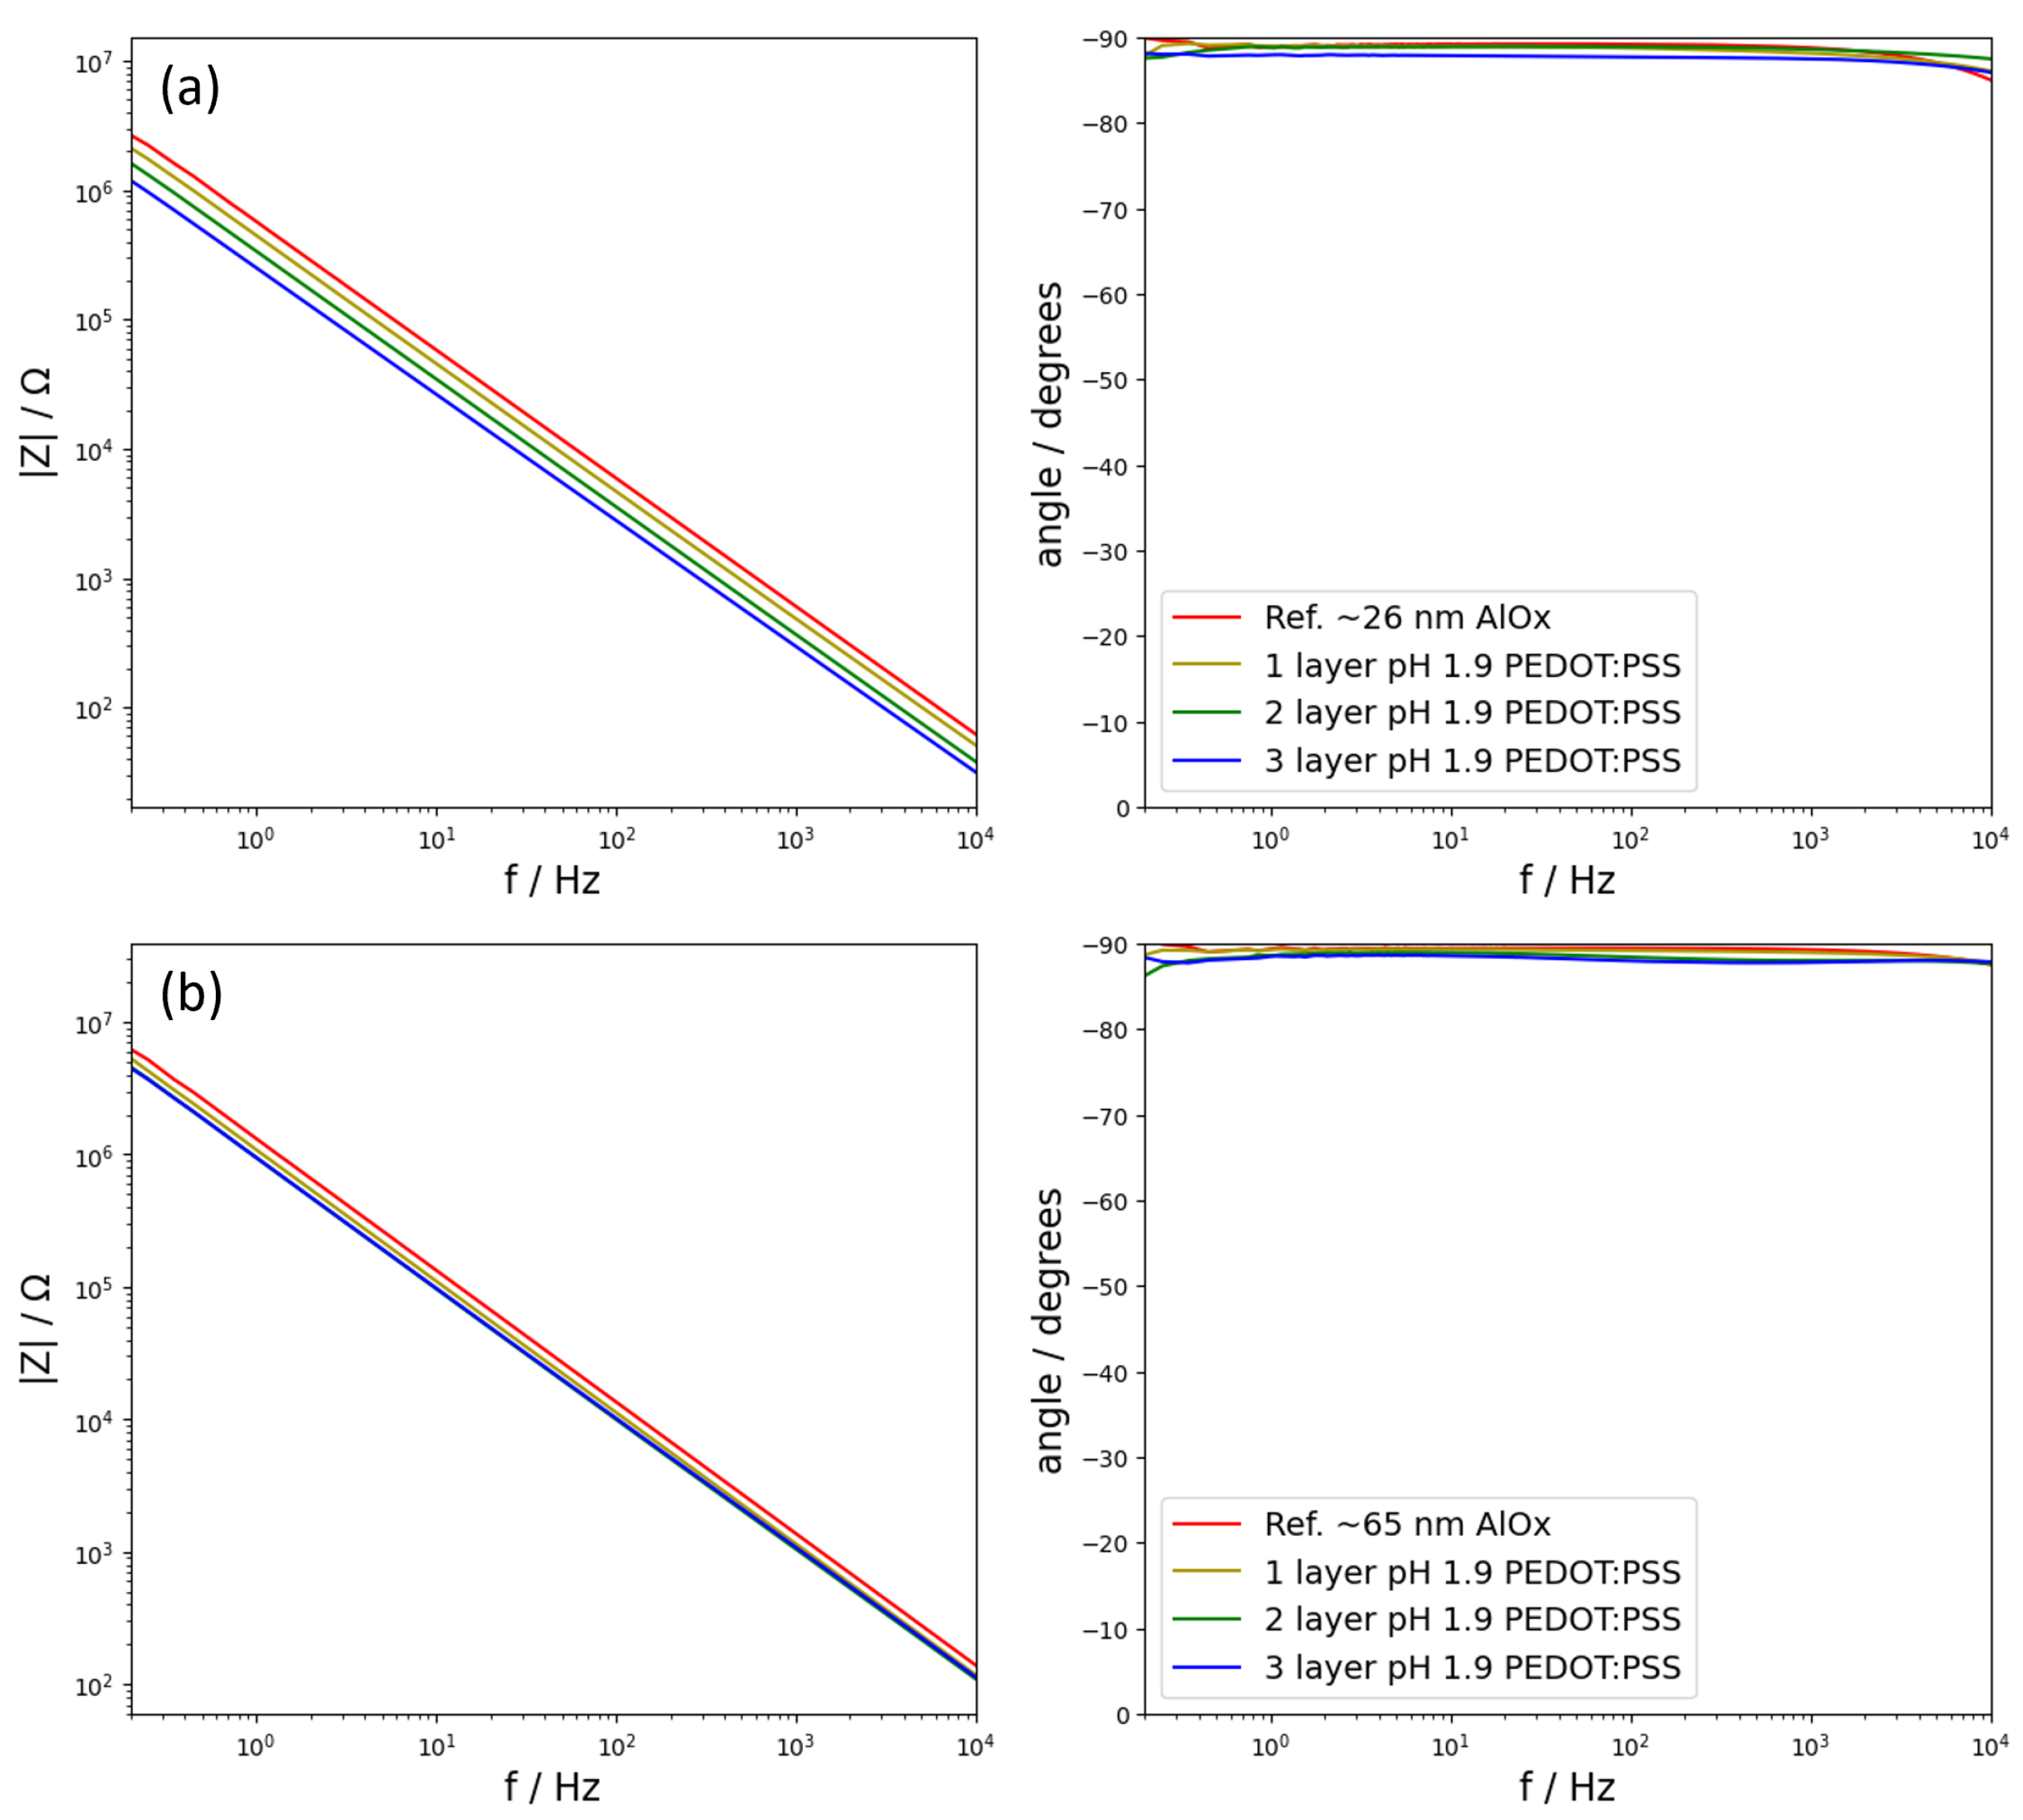
Figure 2) depicted the electrochemical behaviour of four different samples. For each oxide thickness, namely the one formed at 20 V and a second one formed at 50 V, there were four samples: a reference sample and three samples consisting of a reference sample plus one, two, or three layers of PEDOT:PSS on top deposited from a dispersion with a pH of 1.9. The noise signals are omitted in pursuit of clarity in the spectra, but these are two orders of magnitude lower than the impedance signal and, therefore, they do not affect it. In addition, because all the noise signals were close to each other, these systems were considered linear for the applied perturbation and stationary. Later in the analysis, the noise signals are used. The group of samples with an underlying oxide formed at 20 V are shown in Figure 2a, whereas the group of samples with an oxide formed at 50 V are shown in Figure 2b. All samples, regardless of the composition, exhibited a capacitive behaviour for the whole frequency range. This behaviour is characterized for showing phase angles of −90°. In addition, a capacitive behaviour can also be observed by how the impedance varies inversely proportional to the frequency, following
Z = 1 j ω C
where Z represents the impedance value, C the value of the capacitance, and ω the angular velocity. The main difference between the two oxides formed at different voltages (20 V and 50 V), namely, oxides with different thicknesses, was that the one formed at a higher voltage (thicker oxide) showed a higher impedance. This response was expected, as the capacitance is inversely proportional to the thickness of the dielectric layer as can be seen in Equation (2), where C represents the capacitance, ϵ 0 and ϵ r represent the vacuum electric permittivity and the relative permittivity, respectively, A the area, and δ the thickness of the dielectric layer. This trend was observed regardless of the amount of PEDOT:PSS deposited on top.
C = ϵ 0 ϵ r A δ
Focusing on the group of samples with the thinnest oxide layer (Figure 2a), the signal corresponding to the reference samples showed the largest values of impedance. At a slightly lower value of impedance, it was the sample with one layer of PEDOT:PSS. This trend continued as successive layers were added, rendering the sample with the highest number of PEDOT:PSS layers as the one showing the lowest impedance.
The evaluation of capacitors makes use of the value of capacitance, defined as the amount of charge that a system can store per volt applied between the electrodes. However, any impedance spectroscopy technique needs a fitting process to extract numerical information from the spectra. Thus, the capacitance can be calculated by fitting the data of the impedance spectra to an equivalent circuit model. In an equivalent circuit model, every component represents a process that occurs in the real system. As an example, charge separation can be represented by a capacitor and charge transfer or electrolyte resistance by a resistor. However, one impedance response can be modelled through different circuit models, and it is key that every component is physically relevant for the represented system. Every system in Figure 2 showed the same behaviour. Therefore, the reference systems, being the simplest of all, were initially used to find a model to apply to the rest of the samples. Different models, starting from a simple one and evolving in complexity as required, were applied to the 20 V aluminium oxide reference sample response. Subsequently, the result of the fitting was analysed and validated in an iterative process until a model was obtained that described the behaviour of the samples. To ensure the quality of the impedance interpretation, ORP-EIS offers important advantages. Using the special multisine signal during the ORP-EIS technique, the obtained spectra provide not only impedance information, but also extra information coming from the non-excited frequencies, namely, even and the randomly omitted odd frequencies. Processing the signal at those frequencies, the conditions of linearity and stationarity of the measurement can be validated. The response at these frequencies are ultimately processed as signals in the spectra, and the impedance analysis of a sample is considered valid, namely linear and stationary, and therefore have no influence on the total impedance values when the stochastic noise overlaps or exceeds the signals calculated from the even and non-excited odd frequencies (detailed information available in the literature [22,23]). These signals are also relevant to validate the fitting of the spectra to an equivalent circuit model. For the present analysis, a circuit was considered to be satisfactory if the residuals from the fitting overlapped with the noise levels of the measurement.
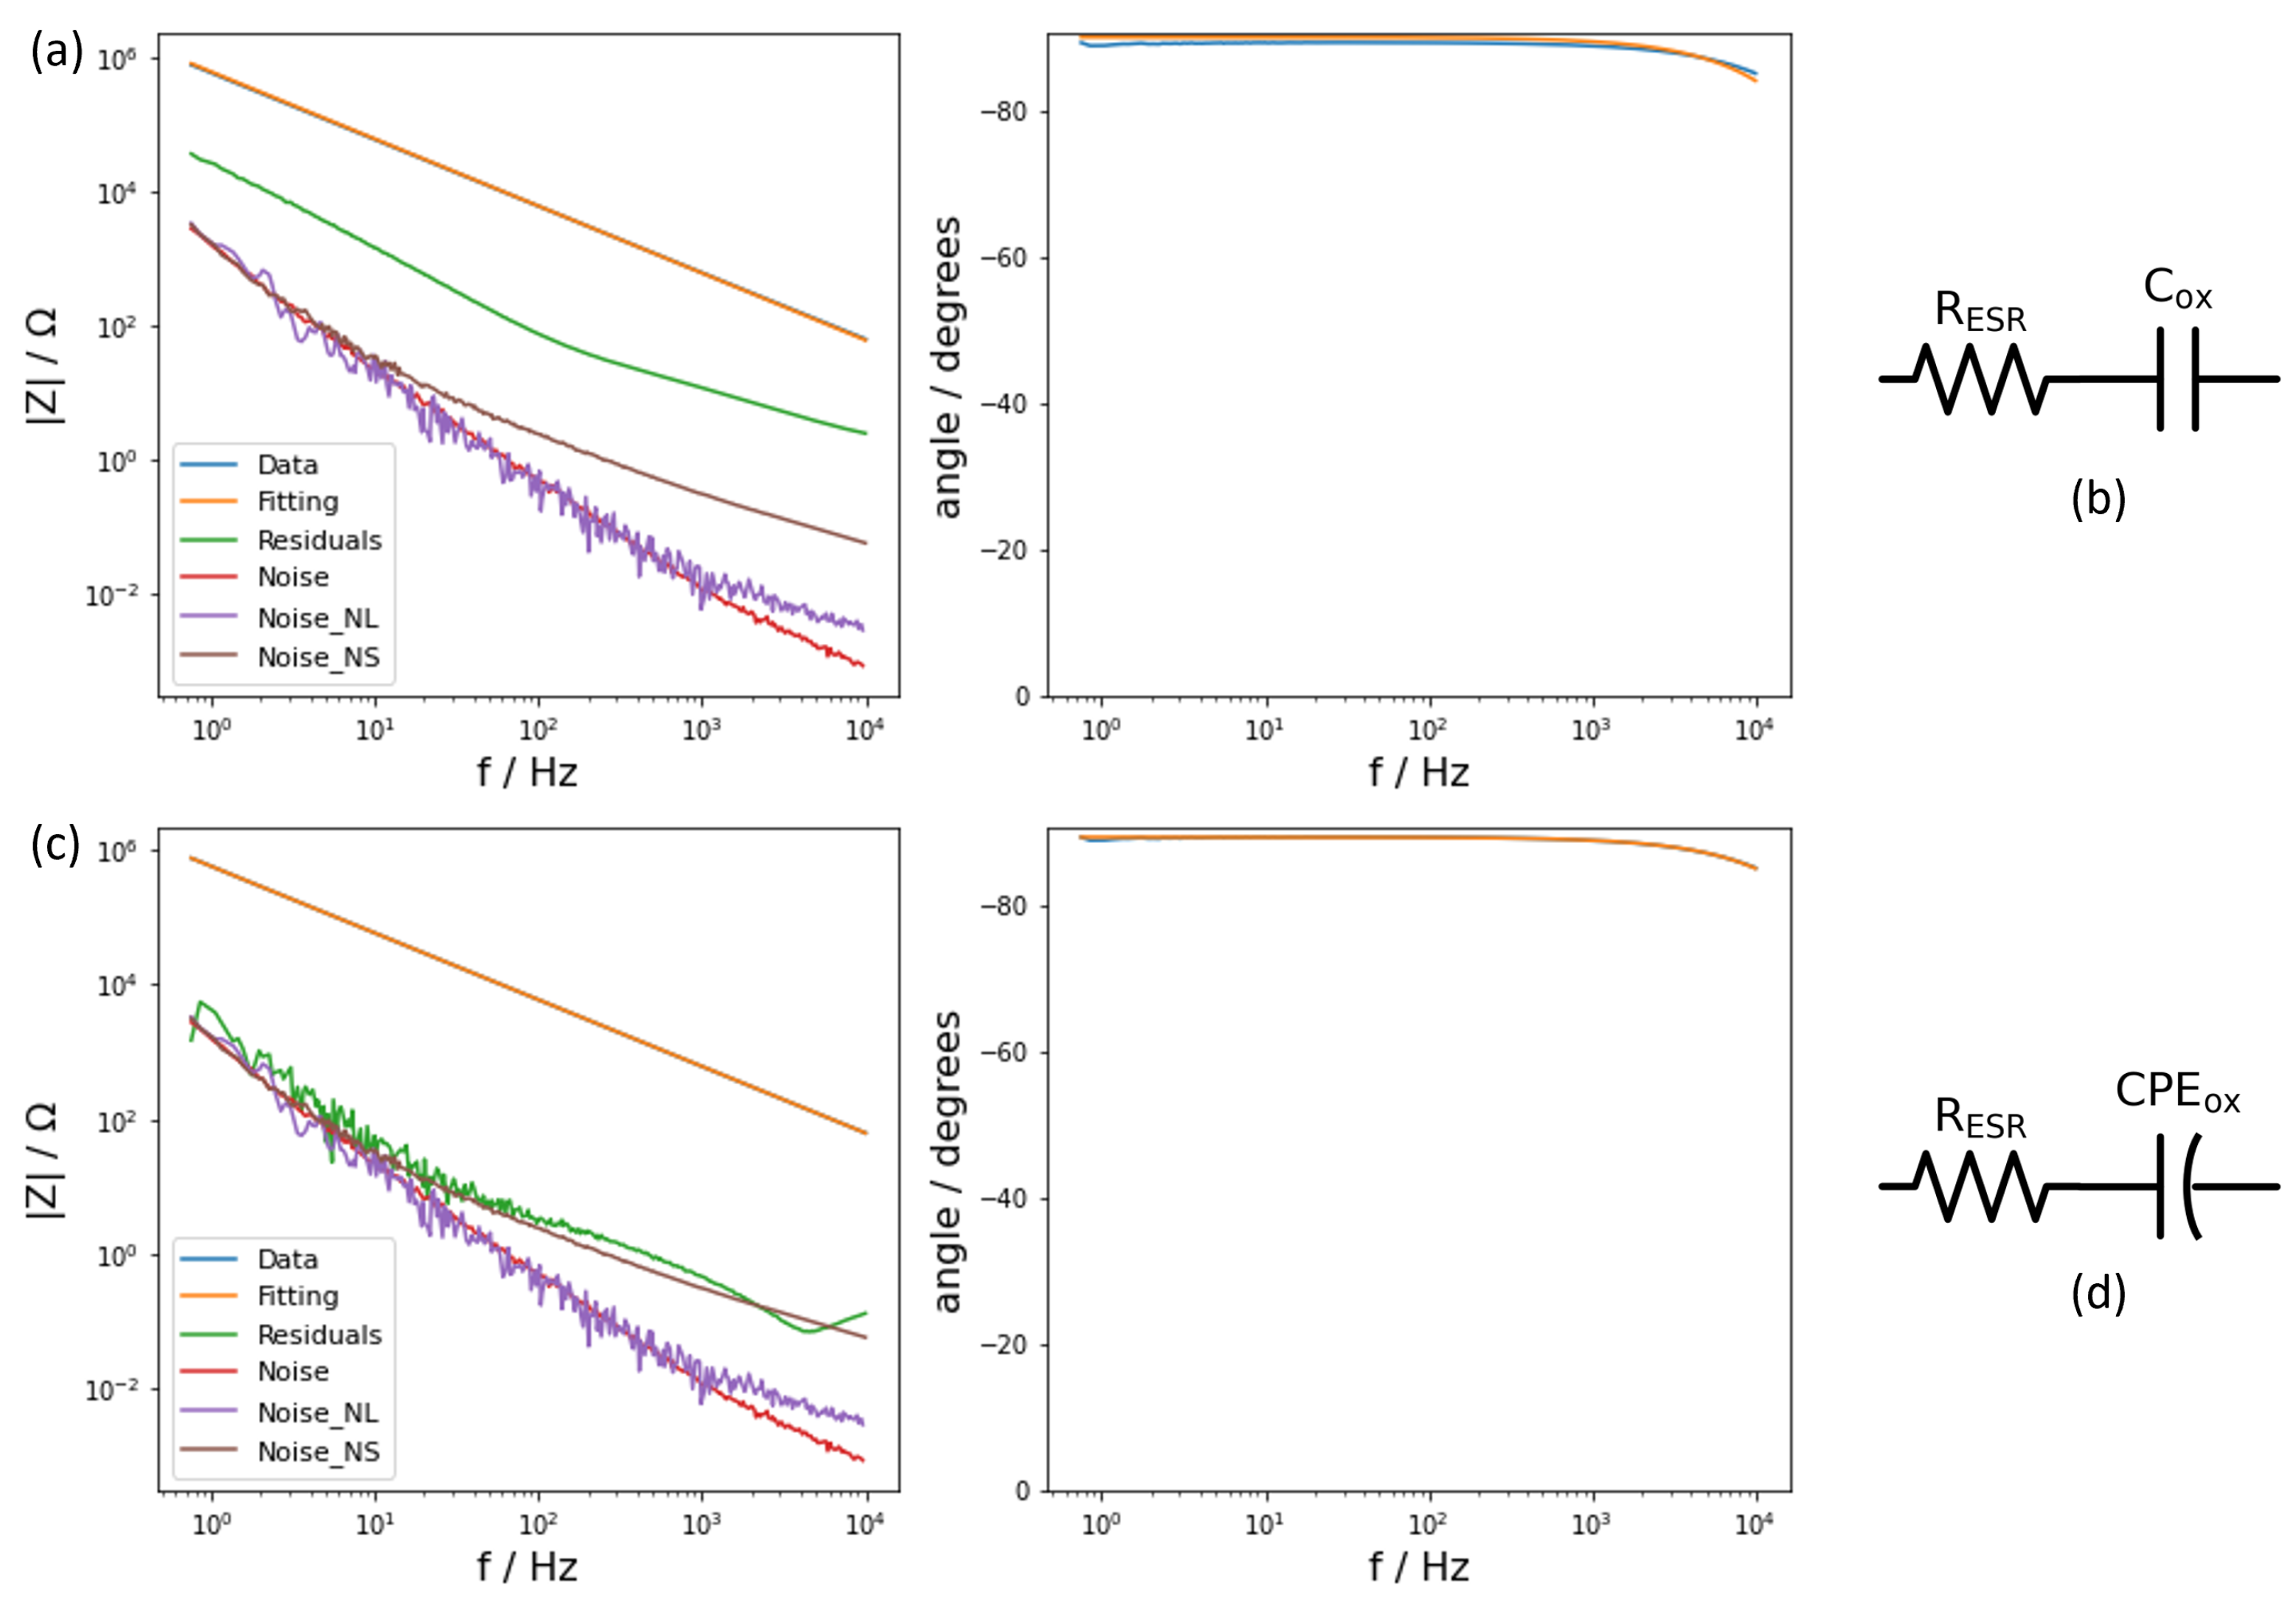
As mentioned previously, the reference samples consisted of two electrical conductive layers—the aluminium metal substrate and a layer of silver paste—with a dielectric layer of aluminium oxide in between. Such a composition coincided with the description of a parallel-plate capacitor. However, examining the phase angle, it was observed that it was not constant for the full range of frequencies. Therefore, a single capacitor was not sufficient to fit the data because a capacitor results in a constant phase angle. The observed decay in the phase angle at frequencies above 1000 Hz can be modeled with a resistance in series with the capacitor accounting for the equivalent series resistance (ESR) of the system (Figure 3a). After fitting this model, the residuals of the fitting were one order of magnitude above the noise signals (Figure 3a), meaning that the model did not adequately represent the impedance response and that a new model needed to be applied. Having a closer look at the phase angle, this was not −90°. Thus, the system could not be represented by an ideal capacitor, but by an electrical component that accounted for its deviation from ideality. A constant phase element (CPE) [24] is a capacitive element whose phase angles range between 0° and 90° and these are independent of the frequency. Consequently, the system was then fitted with the new circuit that substitutes the capacitor with one CPE (Figure 3c). Applying this new circuit provided a satisfying result for the residuals that did overlap the noise signals (Figure 3c). As a result, this last circuit model described correctly the electrical response of the reference sample with a dielectric layer of aluminium oxide formed at 20 V. Performing the same process using the reference sample formed with an oxide formed at 50 V resulted in the same circuit model.
The model that appropriately described the reference samples therefore consisted of a resistor and a CPE. The resistor accounted for the resistance of the whole system, including the connections, and the CPE represented the quasi-perfect capacitive properties of the aluminium oxide. Hence, the resistor is labeled as “ESR” and the CPE as “ox”. Applying the model to the two reference samples allowed the values of every component to be obtained (Table 1).
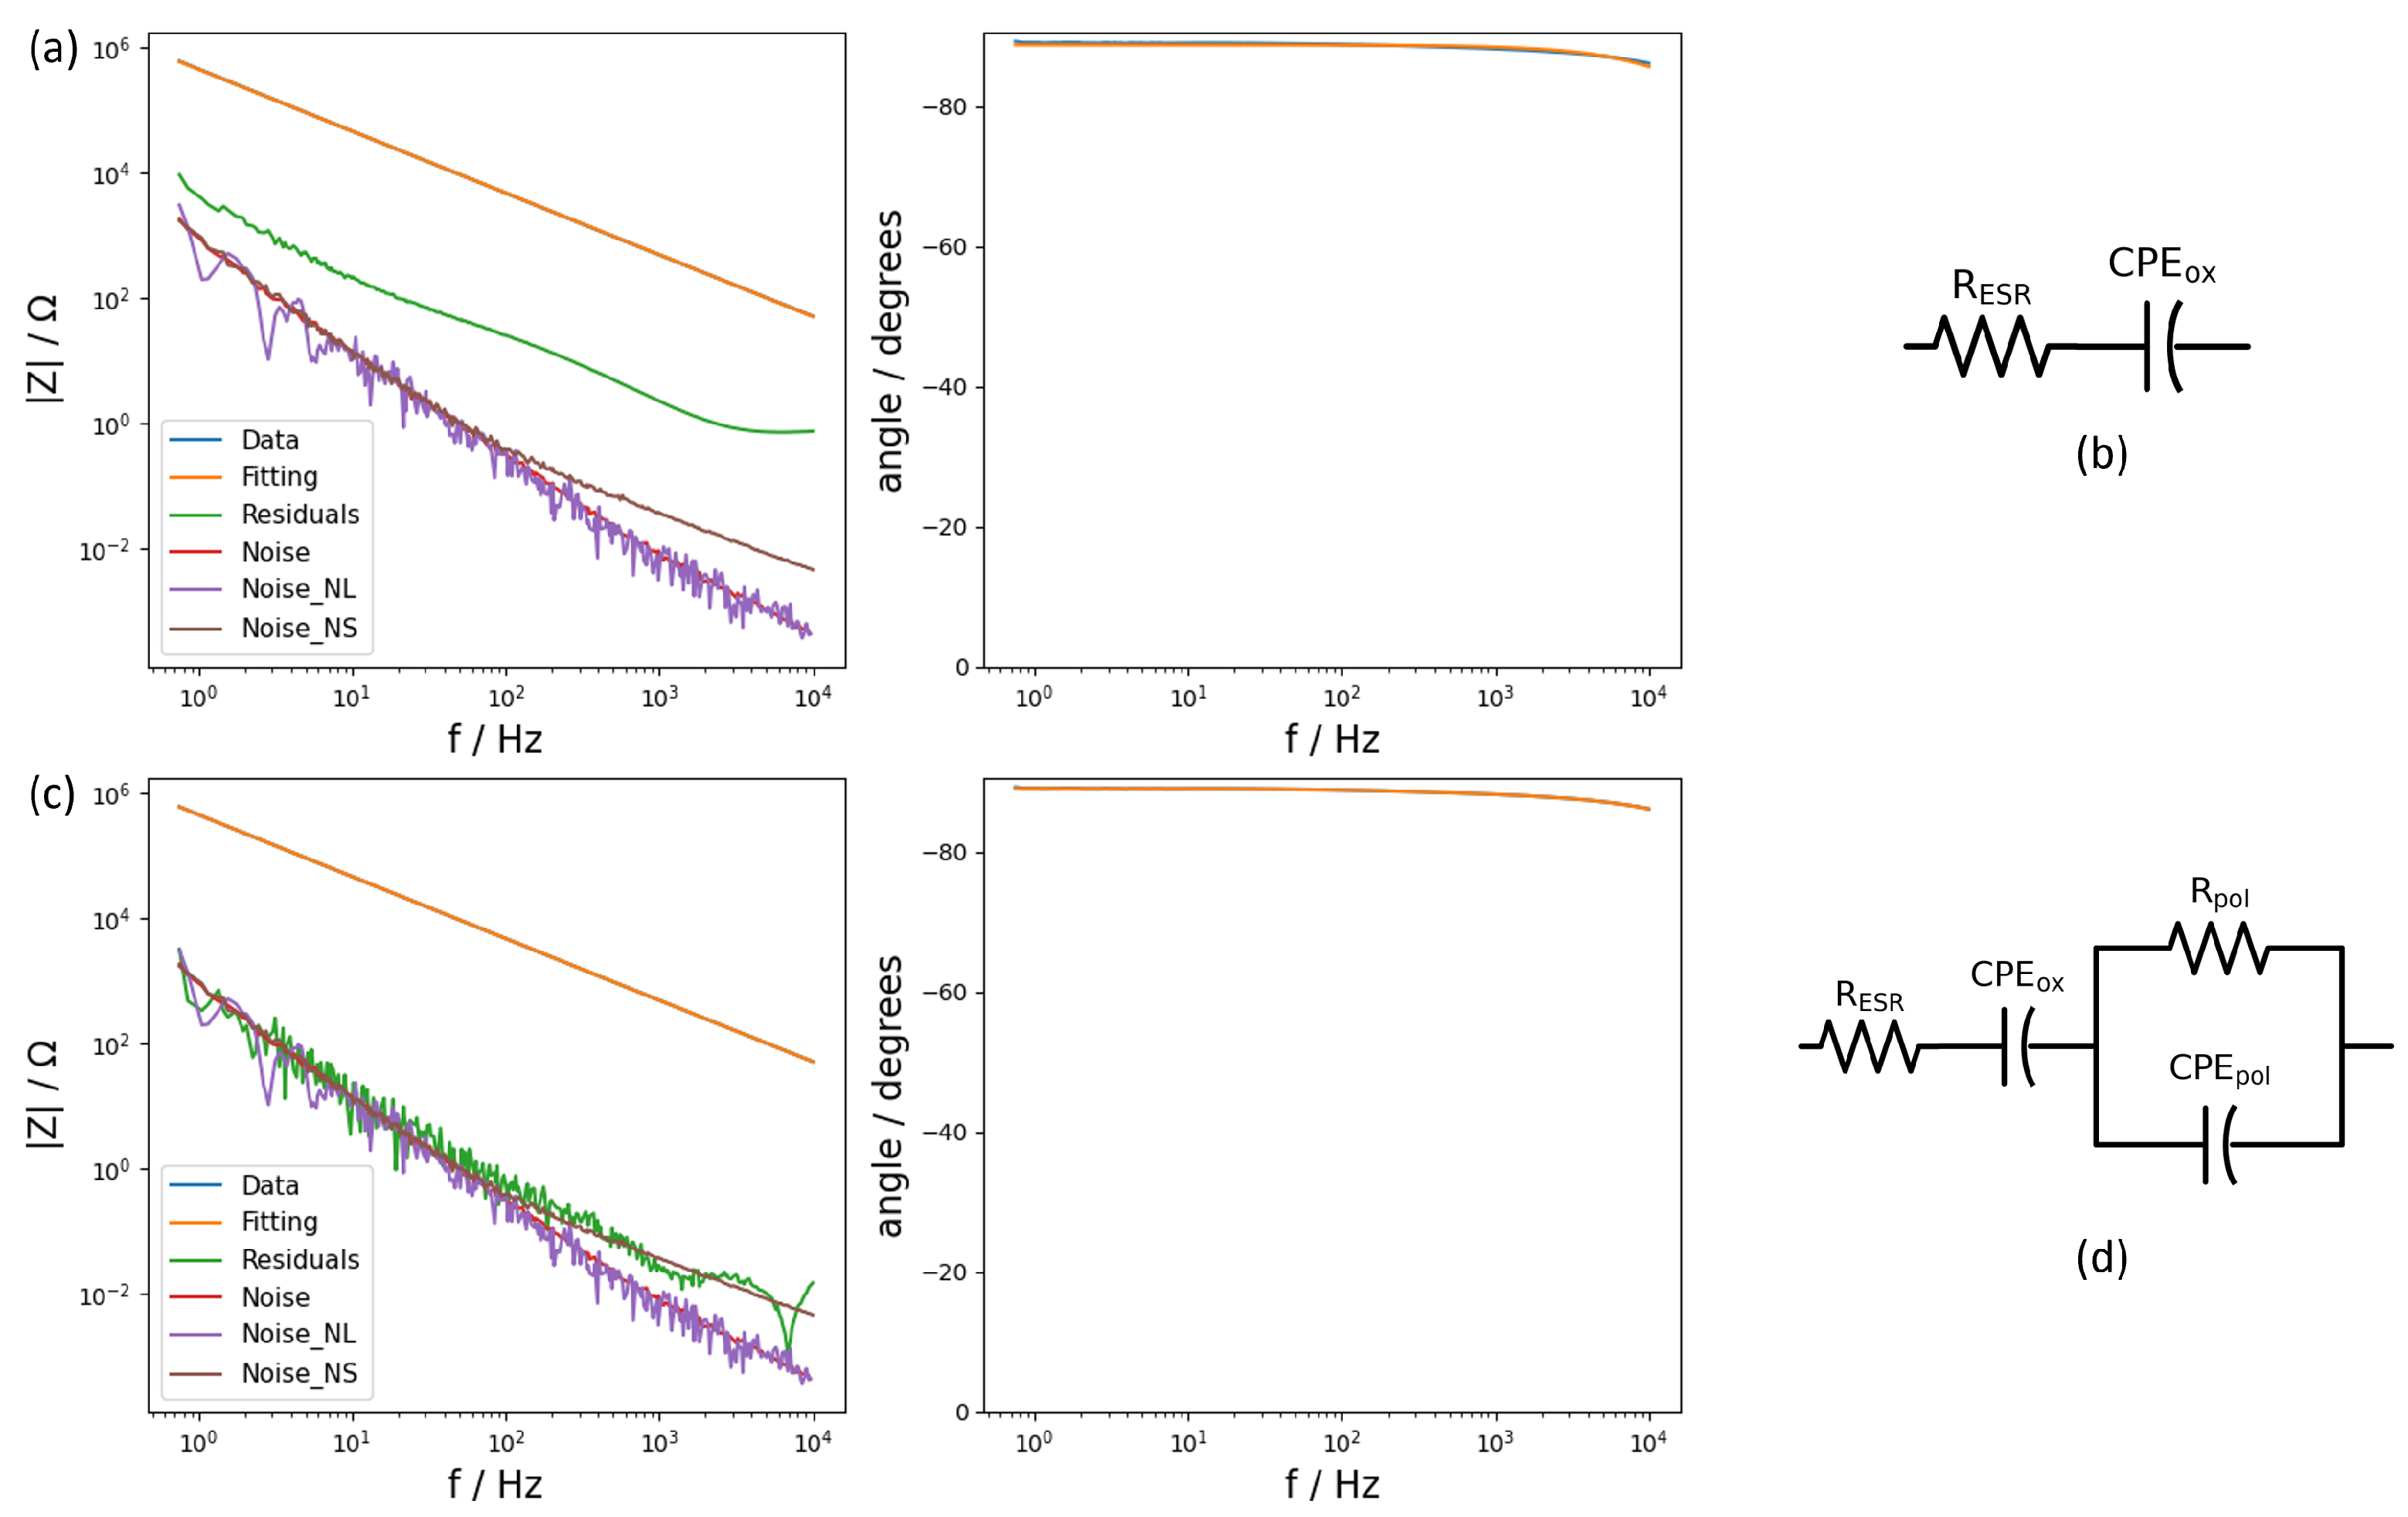
The samples of the study, having an amount of PEDOT:PSS in between the silver paste and the aluminium oxide, were therefore fitted with the same model. However, the result of the fitting was not satisfactory since the residuals were not close to the noise levels (Figure 4a), and neither of the previously tested models worked. It was necessary to add extra elements to the circuit that accounted for the presence of the new layer. Adding a new layer of material created a new interface and a new media throughout which the current must flow and, therefore, additional experimental processes. Closely examining the evolution of phase angle, the presence of an apparent second time constant could be observed as a decay in the phase angle above 100 Hz. In view of this extra time constant, an additional R-CPE combination was added to the model and then applied to check its validity (Figure 4c). After applying the same model to the systems consisting of different layers of PEDOT:PSS, the results of fitting this new circuit provided a valid framework to study each component in the studied systems and to extract the required information about the capacitance. In Table 2, the extracted values for every component of the equivalent circuit used can be found.
Calculating the capacitance of a system described by constant phase elements is not a trivial task. Obtaining the capacitance values depends on the origin of the distribution of time constants with respect to the electrode surface, i.e., along or normal to the surface. The formulas and conditions at which the capacitance values can be calculated were summarized by Orazem et al. [25,26]. In order to have a value of reference to compare with the calculated values, the theoretical capacitance values for the reference samples were extracted. Substituting in the theoretical formula for the effective capacitance, C e f f = ϵ 0 ϵ r δ , the values of ϵ 0 and ϵ r as the dielectric permittivity of vacuum and aluminium oxide, respectively, and δ the thickness of the aluminium oxide layer, reference values for the capacitance can be calculated. Hence, using the values of ϵ 0 as 8.85 · 10−12 F cm−1 and ϵ r as 9.6 and the corresponding thickness for each oxide layer assuming an anodization ratio of 13 Å per volt, the capacitance values of 0.327 μ F cm−2 for the 20 V formed aluminium oxide and 0.131 μ F cm−2 for the one formed at 50 V were obtained. Taking these values as reference, the correspondent capacitance values from the CPE components were evaluated (Table 3). From this examination, the capacitance values calculated assuming a distribution of time constants normal to the surface, or power-law model (Equation (3)), approached the expected theoretical values.
C e f f , P L = g Q ( ρ δ ϵ ϵ 0 ) 1 α
where Q and α are obtained from the CPE element, ρ δ represents the resistivity of the layer, ϵ and ϵ 0 are the dielectric constant and the permittivity of vacuum, respectively, and where
g = 1 + 2.88 ( 1 α ) 2.375
After the analysis of the capacitance on the reference samples, the same method to extract the capacitance values was applied to the CPE assigned to the oxide layer of the model used to fit the samples with different layers of PEDOT:PSS. As mentioned previously, of the two CPE components used in the model, the first one corresponded to the behaviour of the aluminium oxide buried under the PEDOT:PSS layers. In order to consider the capacitance of the full system, the values of every capacitive element had to be taken into account. However, being that the capacitance of CPEpol (24.5 mF) was much larger than that of CPEox (0.4 μ F), adding them in series (Equation (5)) resulted in the total capacitance being equal to the capacitance as a consequence of the oxide layer.
1 C t o t = 1 C o x + 1 C p o l
Hence, from CPE
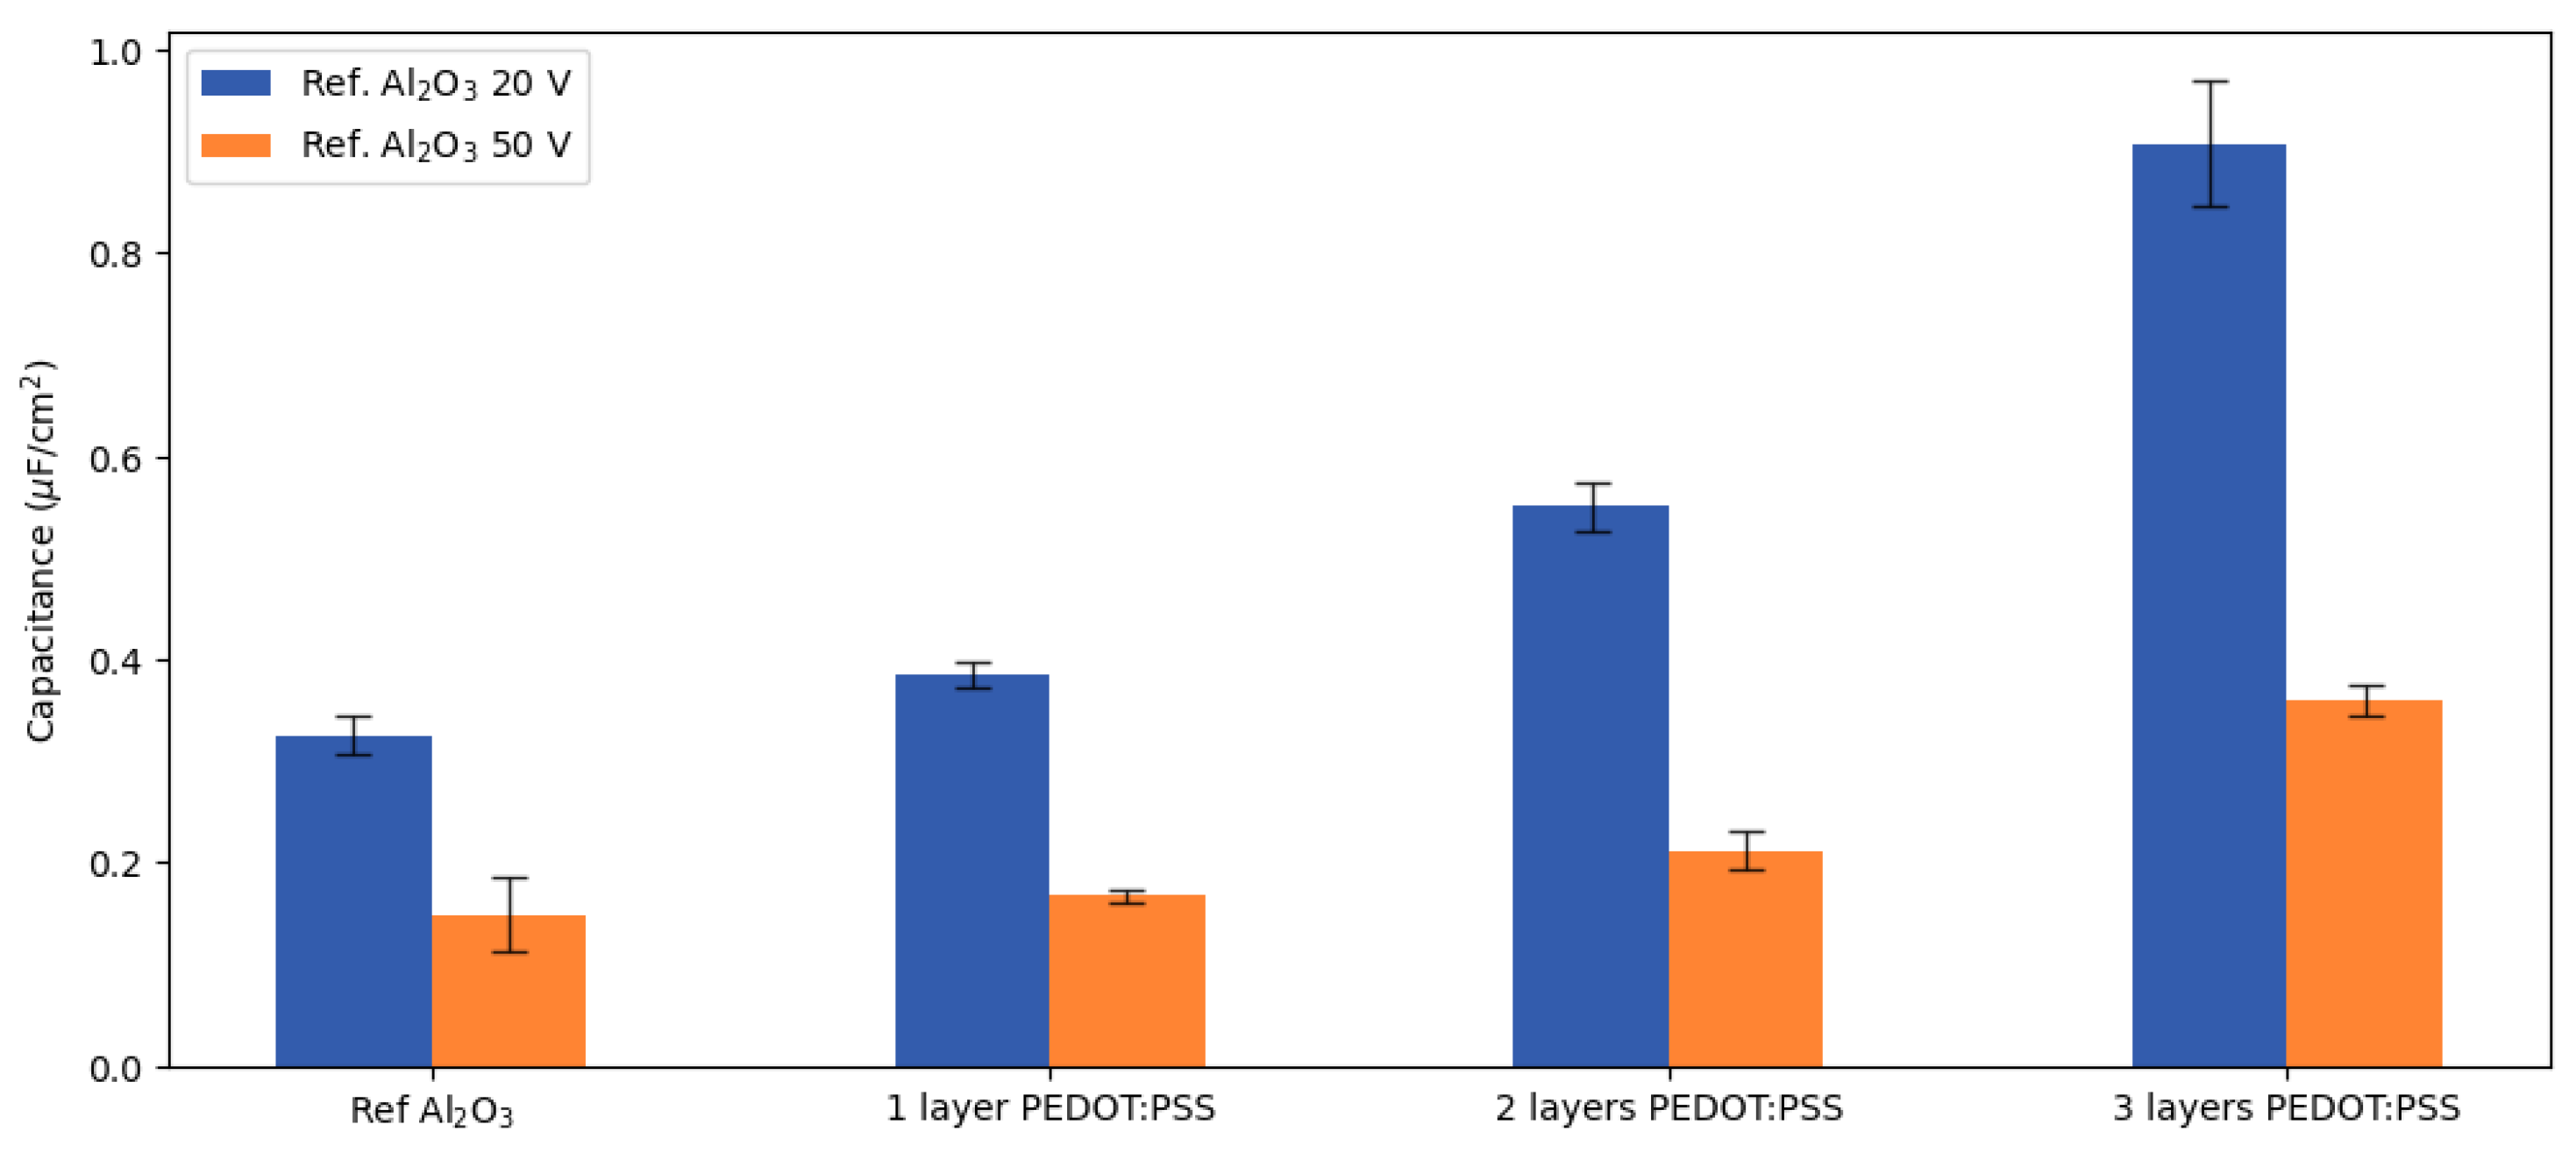
ox, the interaction between the PEDOT:PSS layers and the aluminium electrode could be studied. In a similar way to the reference, the power-law model that allowed one to calculate a capacitance from a CPE originating from a normal distribution of time constants was applied to the samples with PEDOT:PSS layers. The obtained results (Figure 5) depict that the decrease of impedance observed in the impedance spectra (Figure 2) translated into an increase in the capacitance related to the aluminium oxide layers of the samples.
EIS is a very powerful technique to study the electrochemical behaviour of a system. In order to connect the electrical response with a physical or chemical change within the system, additional techniques can be applied to confirm the interpretation of the model. In view of the results, there can be different explanations for the origin of the change in capacitance, but they are connected to changes in the aluminium oxide layer. Therefore, the interface between the aluminium oxide and the PEDOT:PSS layers was studied. The aluminium surface was studied by carefully retrieving it back from the silver layer and PEDOT:PSS layers. This was possible by removing the silver contact with the use of a blade and subsequently exposing the polymer layer to a flow of deionized water. PEDOT:PSS, being a hydrophilic polymer, swelled under the presence of water, and this caused the detachment of the layer from the aluminium oxide. Once the surfaces of aluminium oxide were retrieved back, they were examined via SEM and AFM techniques.
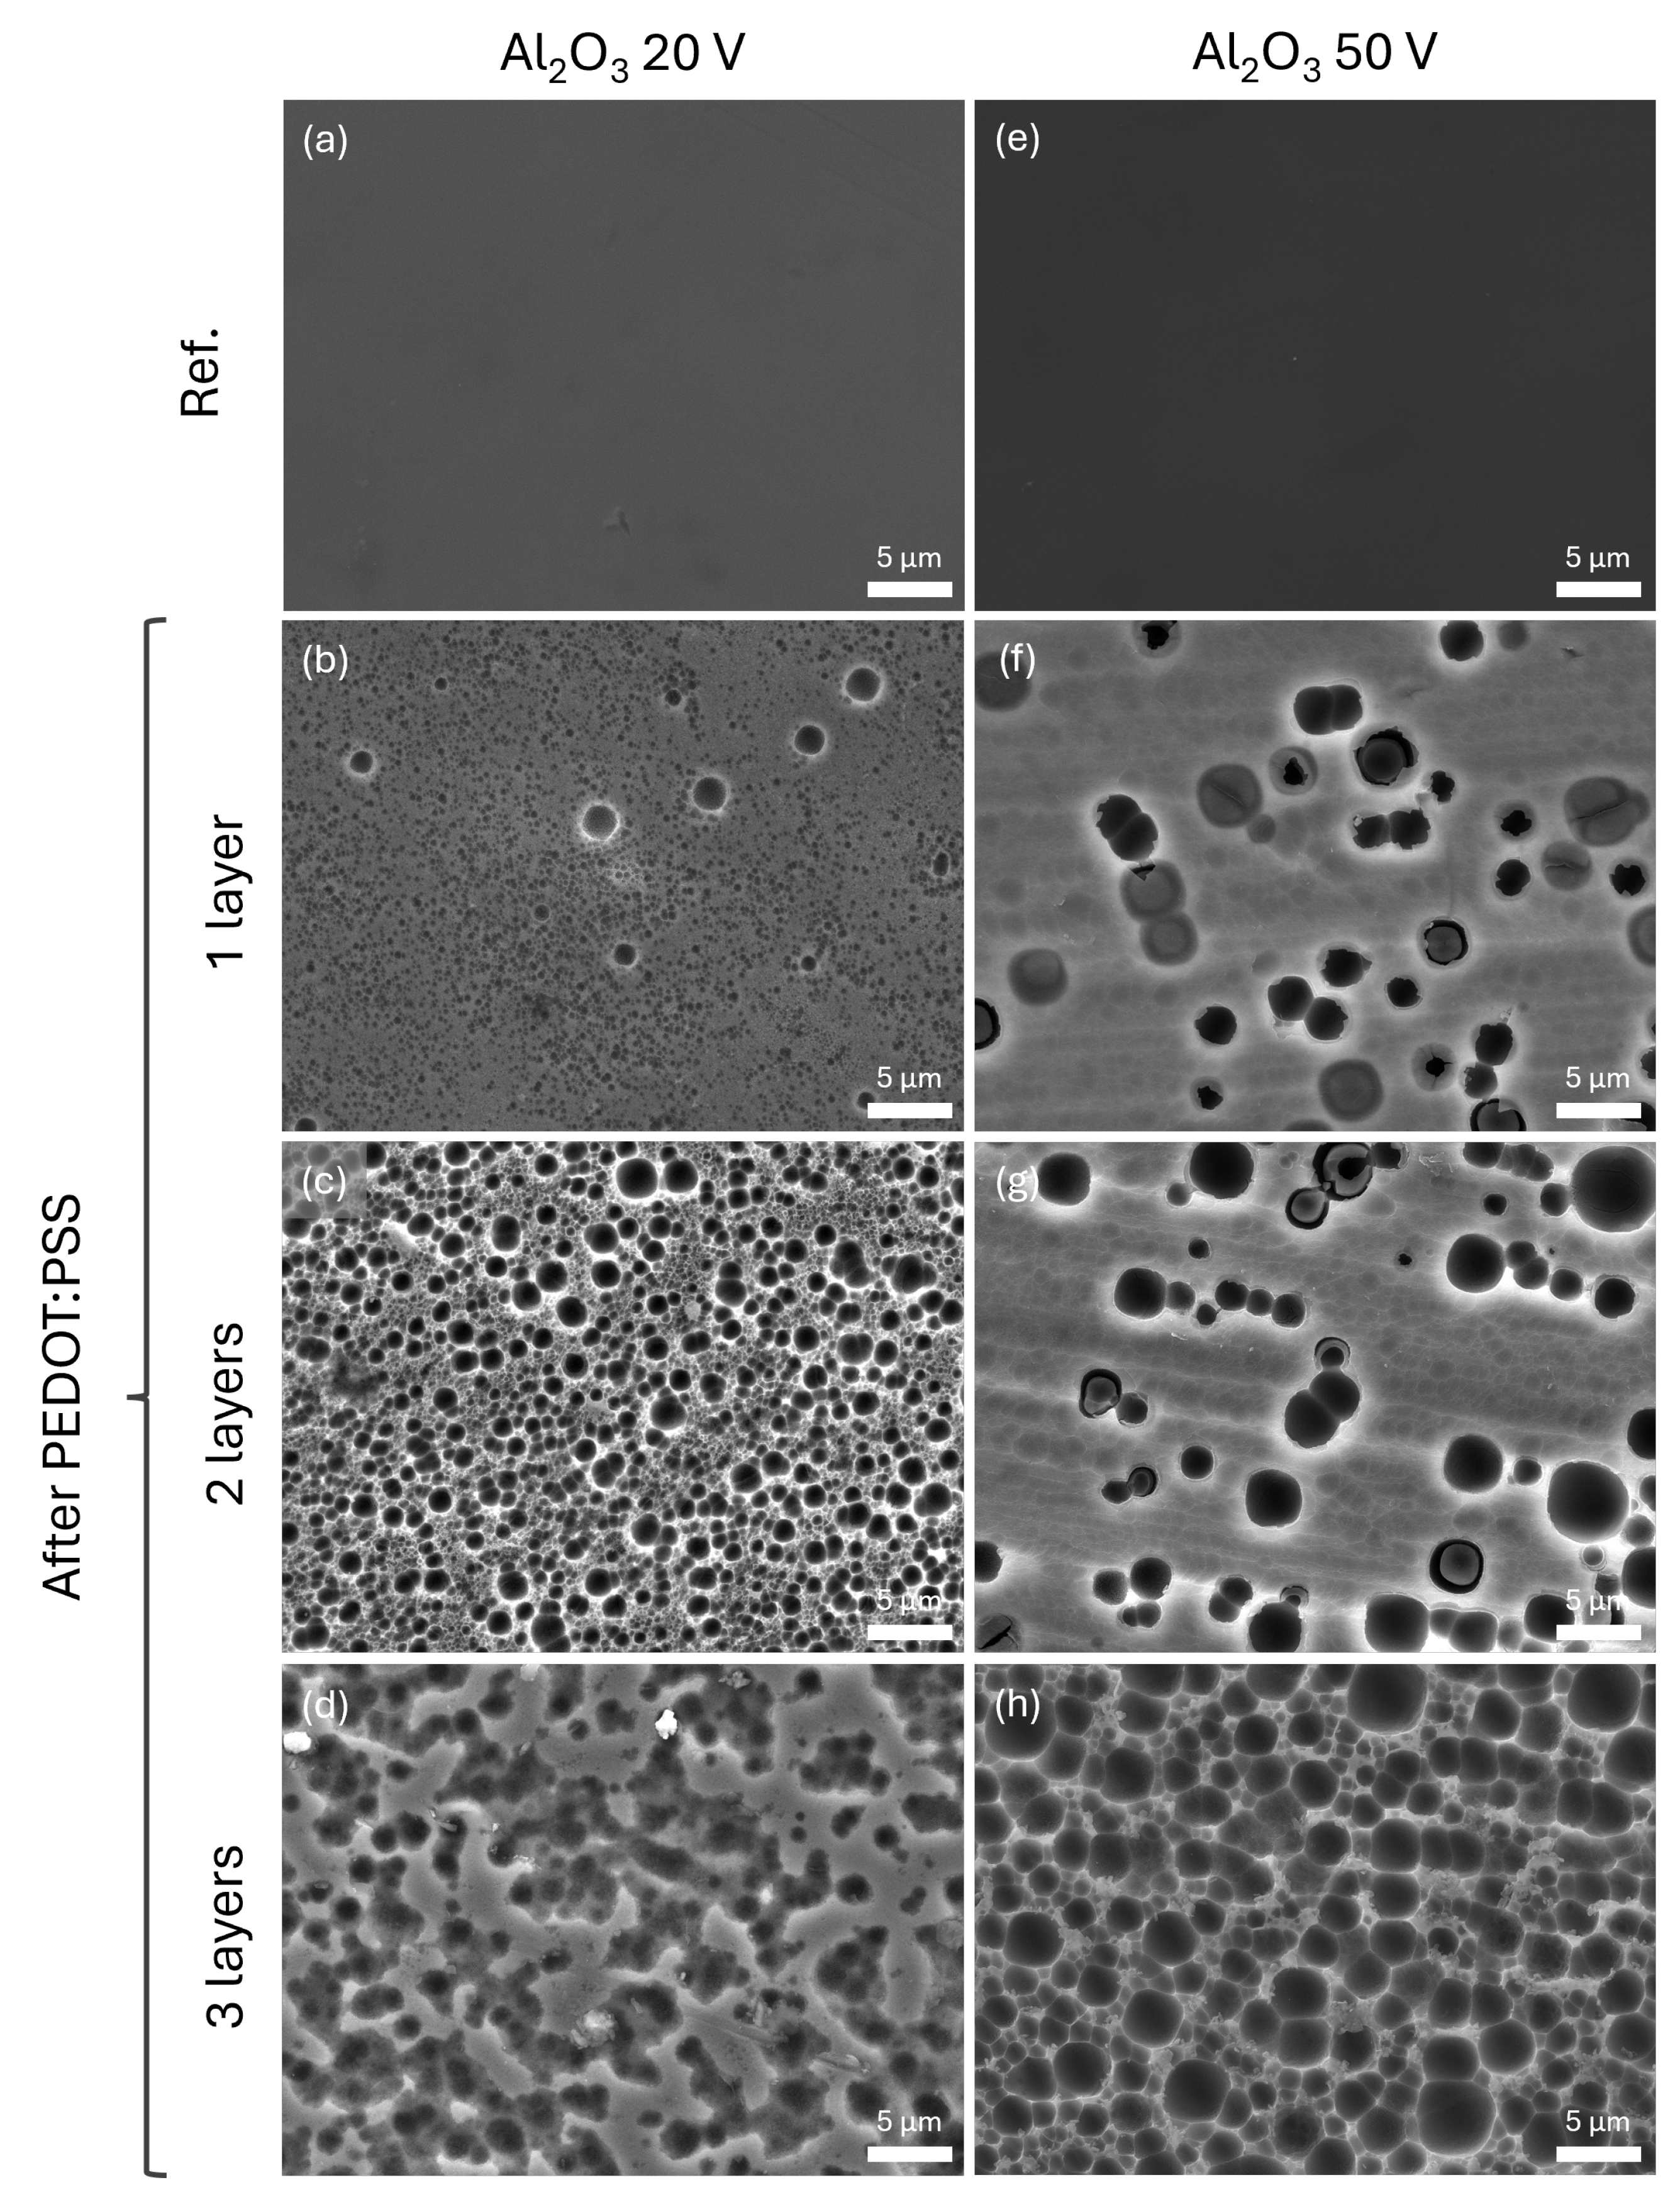
Examining the reference samples consisting of the aluminium oxide not exposed to PEDOT:PSS (Figure 6a,e), it was observed that the oxide layer has a uniform flat surface. However, the SEM micrographs of the surface on all the samples exposed to acidic PEDOT:PSS dispersion showed an attack onto the aluminium oxide in the form of pits. Focusing on those samples with an underlying oxide layer formed at 20 V, the pits appearing after the addition of one layer of PEDOT:PSS were of two types (Figure 6b): a matrix of small pits of around 0.4 μ m diameter that gave roughness to the surface and a number of larger pits of about 2 μ m diameter. Adding a second layer of PEDOT:PSS (Figure 6c) increased the number of the larger pits (diameters between 1.5 and 2.5 μ m diameter) on the overall grained surface. Finally, the addition of a third layer of PEDOT:PSS (Figure 6d) caused the pits to coalesce with one another, giving the surface an etched aspect. Continuing with the thicker aluminium oxide layer samples, the events are similar. The oxide layer underneath one layer of PEDOT:PSS (Figure 6e) depicted a larger number of bigger pits, compared to the sample with a thinner oxide, ranging between 1 and 3 μ m diameter on a surface roughened after the exposure. After the deposition of two layers (Figure 6g), the surface of the anodized aluminium showed little evolution on the size of the pits, but a larger number of small ones are observed after removal of the PEDOT:PSS coating. Finally, the oxide layer under three layers of the PEDOT:PSS (Figure 6h) resembled an etched aluminium surface where the entirety of the surface was covered in pits of approximately 3 μ m in diameter.
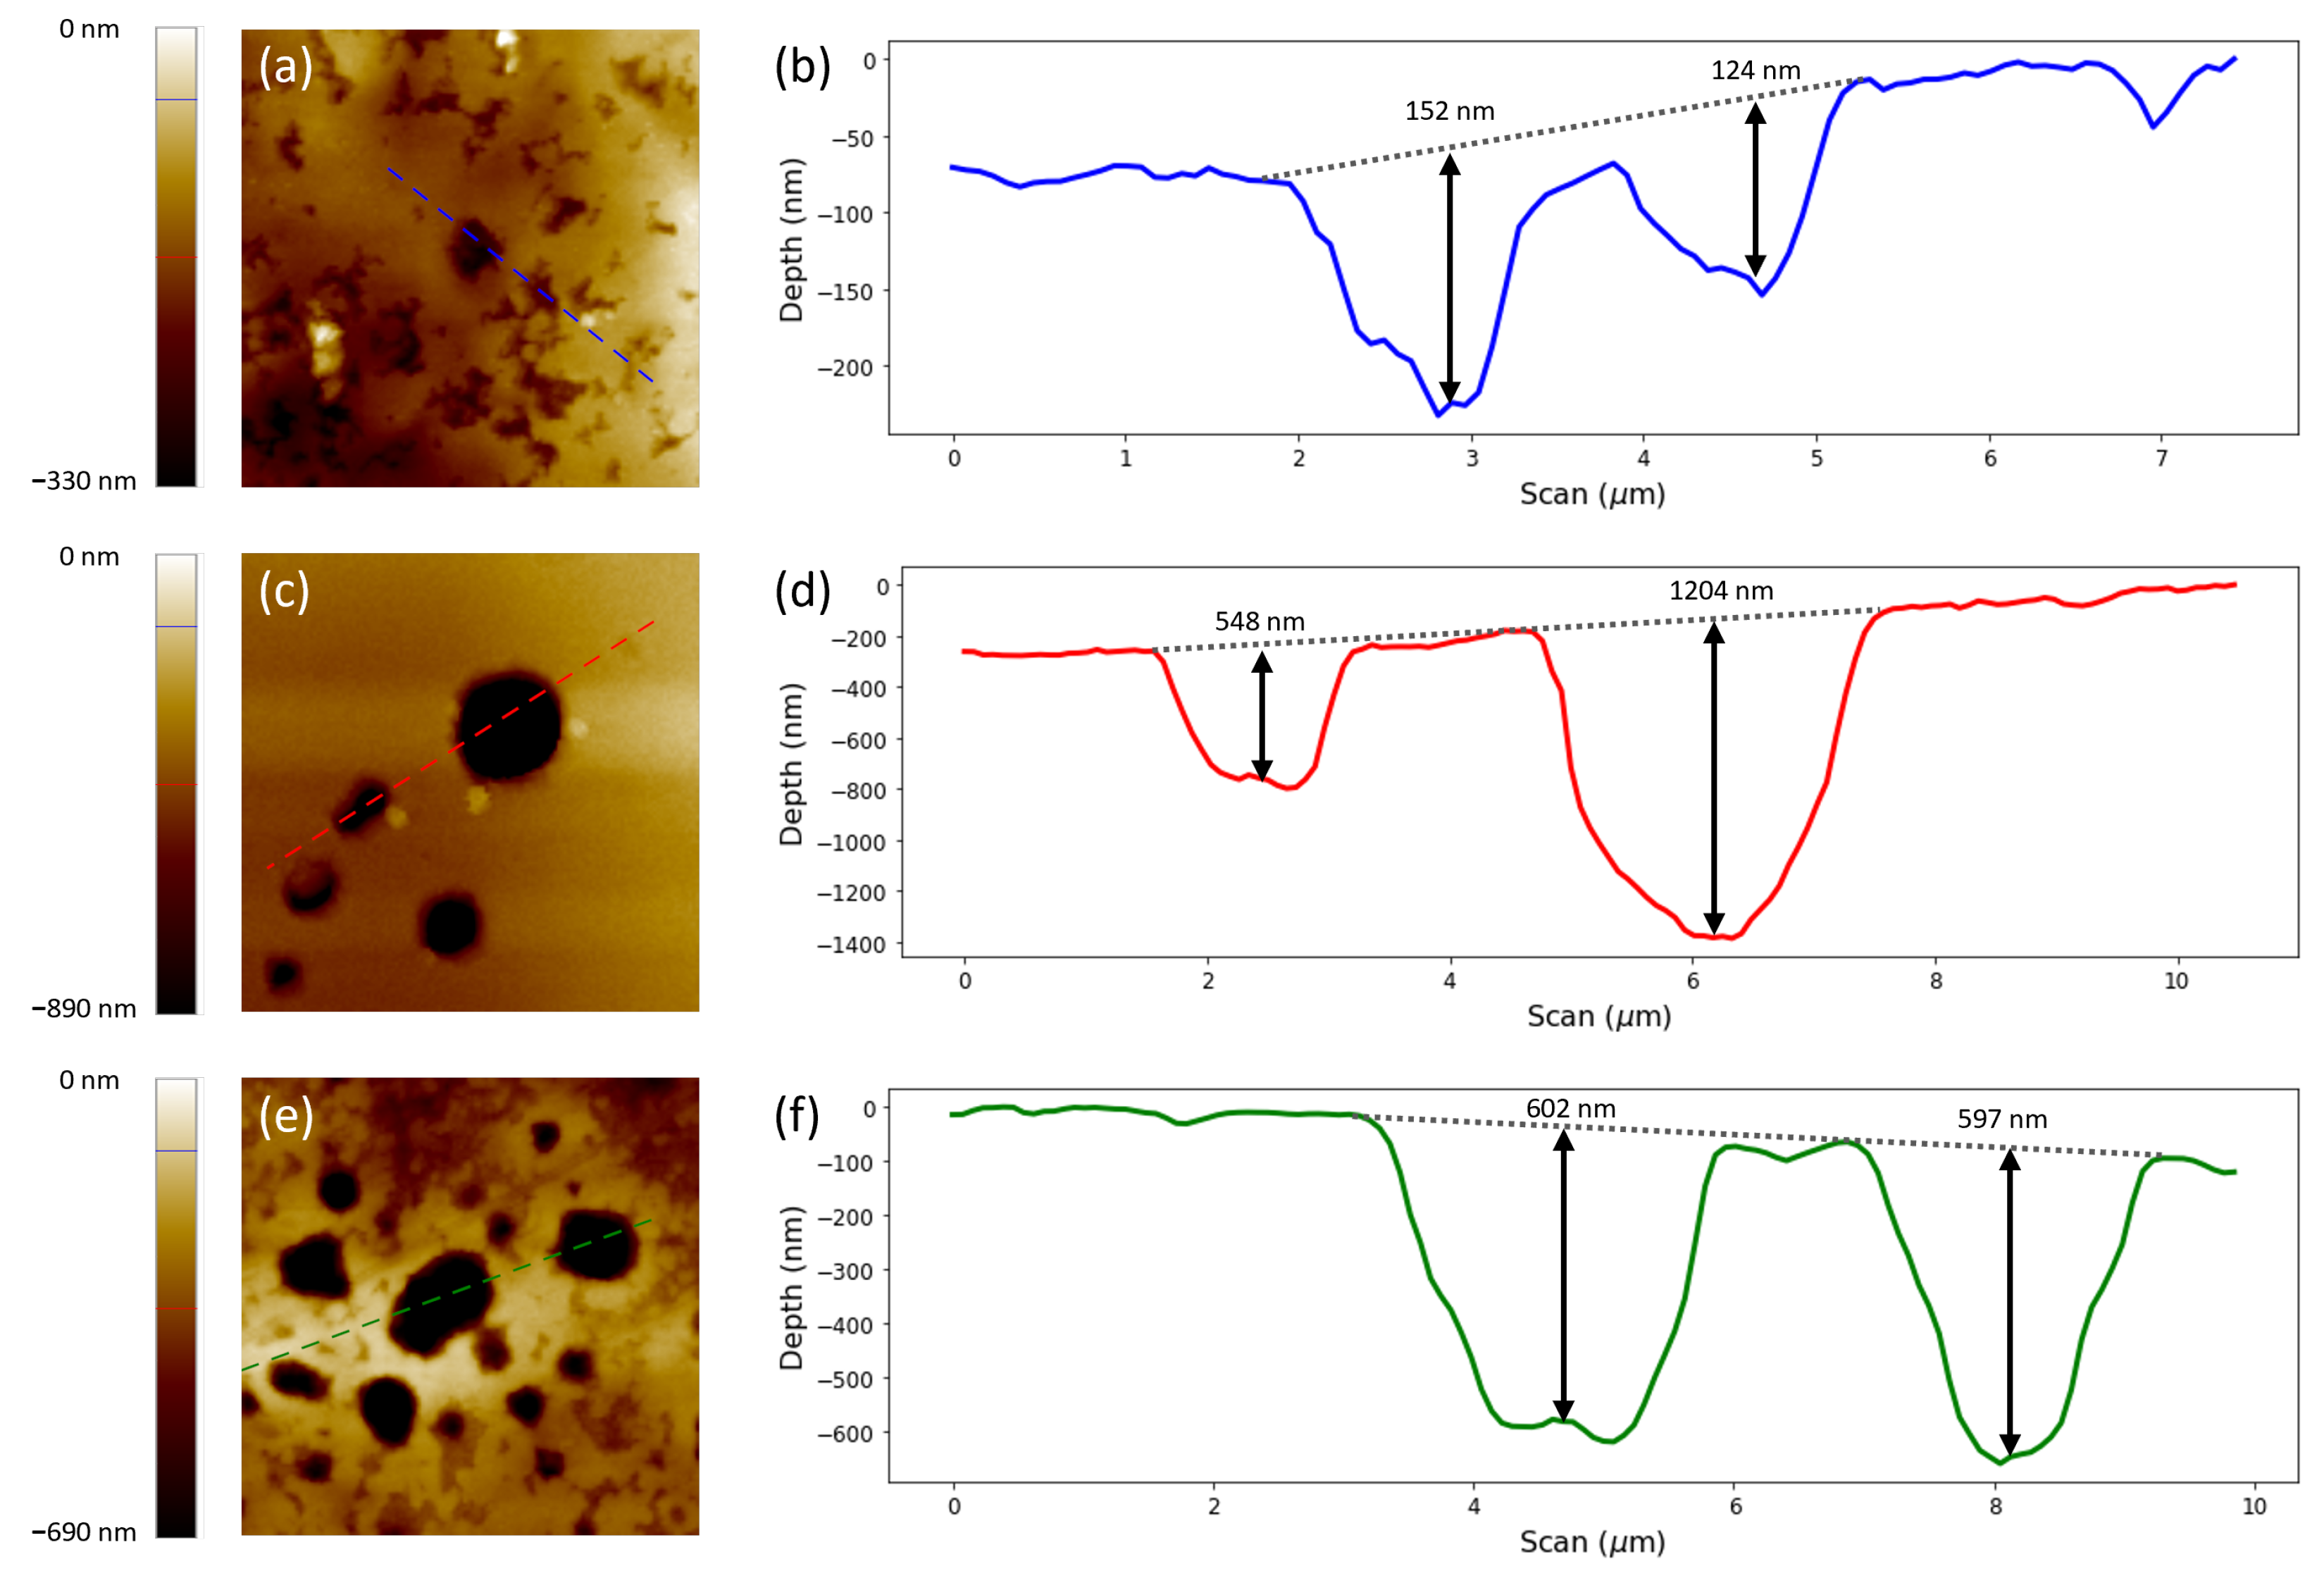
Based on the information on the SEM micrographs, those aluminium oxide layers that had been exposed to PEDOT:PSS showed an attacked surface in the form of pits. However, in order to have a complete analysis, the samples were analysed via AFM to study the topography of the surface, as the SEM micrographs only provided 2D information. Examining the scans performed in tapping mode, they revealed the diameter of the pits and their different heights (Figure 7). The surface scan of the aluminium oxide surface exposed to one layer of PEDOT:PSS (Figure 7a) depicted the attacked surface of the oxide layer. The topography for the samples exposed to two and three layers of PEDOT:PSS showed the attacked surface plus defined pits that are comparable with those observed in the SEM images (Figure 6c,d). Analysing the line scans (Figure 7b,d,f), it was observed that the depth of the different pits ranged around 194.3 ± 34.7 , 1067.5 ± 172.7 , and 526.5 ± 32.3 nm, respectively, for samples formed by one, two, and three layers of PEDOT:PSS. As a consequence of the coalescence of the pits on the surface under three layers of PEDOT:PSS, it was difficult to ascertain whether the tip of the AFM was measuring the real surface or an affected area. Therefore, it is not clear whether there was an evolution in depth between the samples under two and three layers of PEDOT:PSS as there was between samples under one and two layers of PEDOT:PSS. In spite of this, all of the pits were deeper than the thickness of the barrier aluminium oxide layer (26 nm and 65 nm).
Judging the obtained information from the electrochemical and surface analysis techniques, the application of acid PEDOT:PSS dispersion had an influence on the dielectric layer that acted as an insulator between the conductive polymer layer and the aluminium metal substrate. Aluminium and aluminium oxide are not thermodynamically stable in acidic environments. The dissolution rate increases drastically, decreasing the pH [21], and in pH ranges between 2 and 4, aluminium components can be considered metastable for short times of exposure. Pristine PEDOT:PSS dispersions have pH values between 1.9 and 2.1, resulting from the deprotonation of sulfonic groups that are part of the PSS chains. The time of contact between the PEDOT:PSS dispersion and the aluminium substrate before the former dries out was less than 20 min. Nevertheless, this time was sufficient to give rise to an attack that manifested itself in the form of deep pits that provided the aluminium surface the appearance of an etched surface, reaching these pits deeper than the aluminium oxide layer. Moreover, the reaction between PEDOT:PSS and aluminium oxide did not stop after the addition of one layer, as exhibited by the increase in number and shape of the pores buried underneath different numbers of PEDOT:PSS layers. The attack progressed with the addition of more PEDOT:PSS. As commented previously, PEDOT:PSS is an hydrophilic material. This property caused the solvent, water of the second and third additions of dispersion, to diffuse through the previously deposited PEDOT:PSS. The solvent then diffused until it reached the interface with aluminium oxide, where the attack could continue. In spite of this attack, the electrochemical analysis showed that the capacitive properties of the samples were not lost. In the presence of deep pits created by the acidic PEDOT:PSS dispersion, a short circuit is likely to occur the moment the conductive polymer layer and the aluminium substrate enter into contact. However, the impedance analysis displayed a capacitive behaviour and a tendency that connected the presence of PEDOT:PSS with an increase of the capacitance. The capacitance between two conductive plates depends on three properties according to the formula (Equation (2)). Among the hypotheses of why this change in capacitance occurs, the presence of PEDOT:PSS might have an influence in these systems. There are studies [27,28] that support the theory that PEDOT:PSS behaves as an intrinsic pseudocapacitive material and, therefore, it could contribute to the total capacitance. However, without the presence of a liquid electrolyte that interacts with the polymeric layers, it has not been proven that PEDOT:PSS has capacitive properties. Therefore, and considering that the PEDOT:PSS dispersion used for all samples is the same, the increase of capacitance is linked with the increase of the area of contact between the electrodes, which results in an increased capacitance. In addition, as commented in the analysis of the fitting, the calculated capacitance was connected with CPE that represents the aluminium oxide; therefore, the variation of the performance is connected to changes on the dielectric layer. Going back to the analysis of the surface, the presence of pits increased the surface area, which, in turn, increased the charge that can be stored at the interface. As a result, the differences in capacitance between samples are connected to the emergence of pits in the dielectric that causes an enlargement of the surface. Normally, the contact between the PEDOT:PSS in the pits and the aluminium substrate should cause a short circuit. However, researchers hint at the formation of corrosion products as a result of the attack that could form a layer that avoids direct contact between the components [16].

2.2. Analysis of the Interaction of an Aluminium Electrode with Neutral pH PEDOT:PSS Dispersions (pH 4.9 and pH 5.8)

The interaction between an acidic dispersion of PEDOT:PSS and an aluminium substrate gave rise to an attack that increases with successive additions of the dispersion. As commented previously, the origin of the acidic character of the dispersion is based on the sulfonic groups that are part of PSS chains. Wakabayashi et al. [16] determined that neutralizing PEDOT:PSS dispersions changes the electronic properties of the polymer before, affecting the colloids in the solvent, and after deposition, influencing the electrical properties. However, there is no information about the interaction with an aluminium substrate. As a next step, the PEDOT:PSS dispersion used to build the former samples was neutralized to two different pH values and those were deposited on top of aluminium substrates. In the previous analysis, it was observed that the difference in thickness of the aluminium oxide only gave rise to an overall shift of the impedance. Consequently, for the simplicity for the forthcoming analysis, only the aluminium substrate with an oxide formed at 20 V (approx. 26 nm) was used. Using a dropwise addition of 0.1 M NaOH solution, PEDOT:PSS dispersion was brought to pH 4.9 and 5.8. Such pH values are well within the thermodynamic stability range of aluminium [
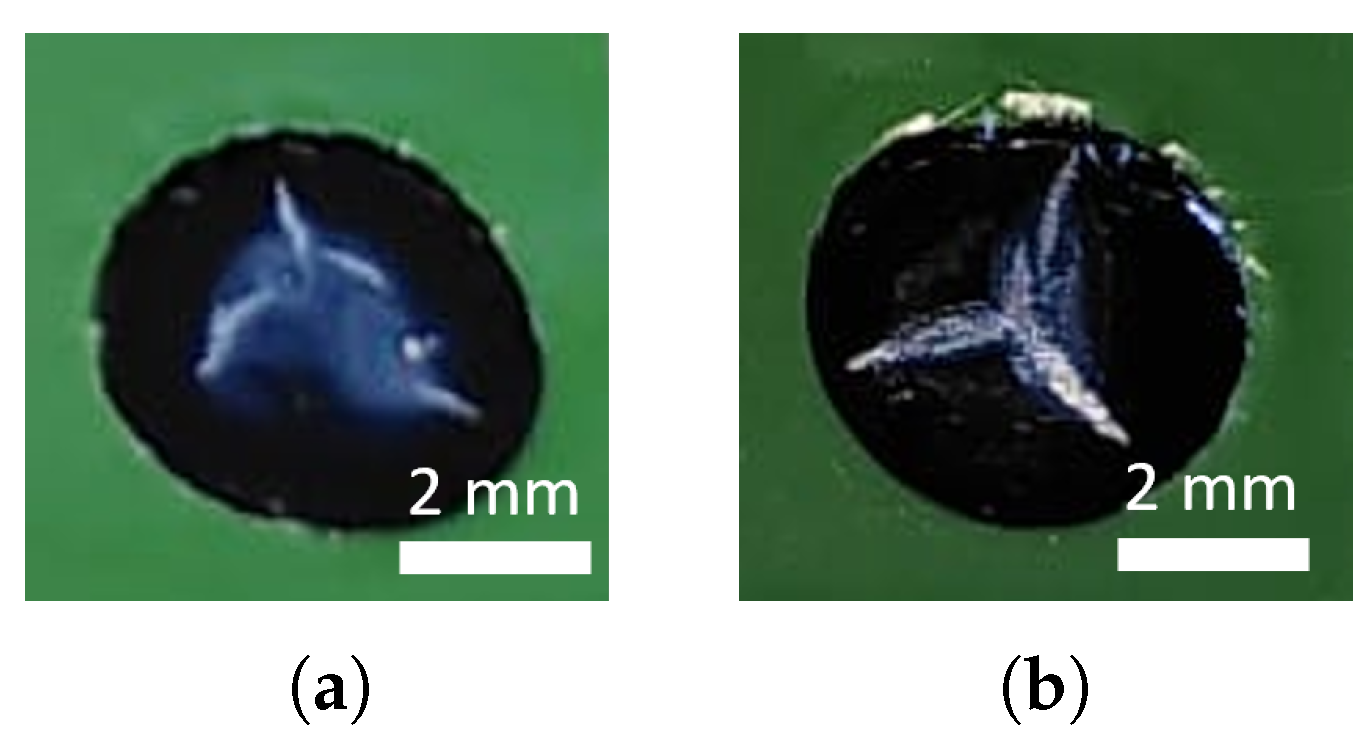
21], and no dissolution was therefore expected to occur on the aluminium substrate. The deposition process of these new dispersions was analogous to that used for the acidic dispersion. However, compared to the layers obtained out of the acidic dispersion, the neutral dispersions produced cracked polymer layers (Figure 8a,b), regardless of the number of layers deposited.
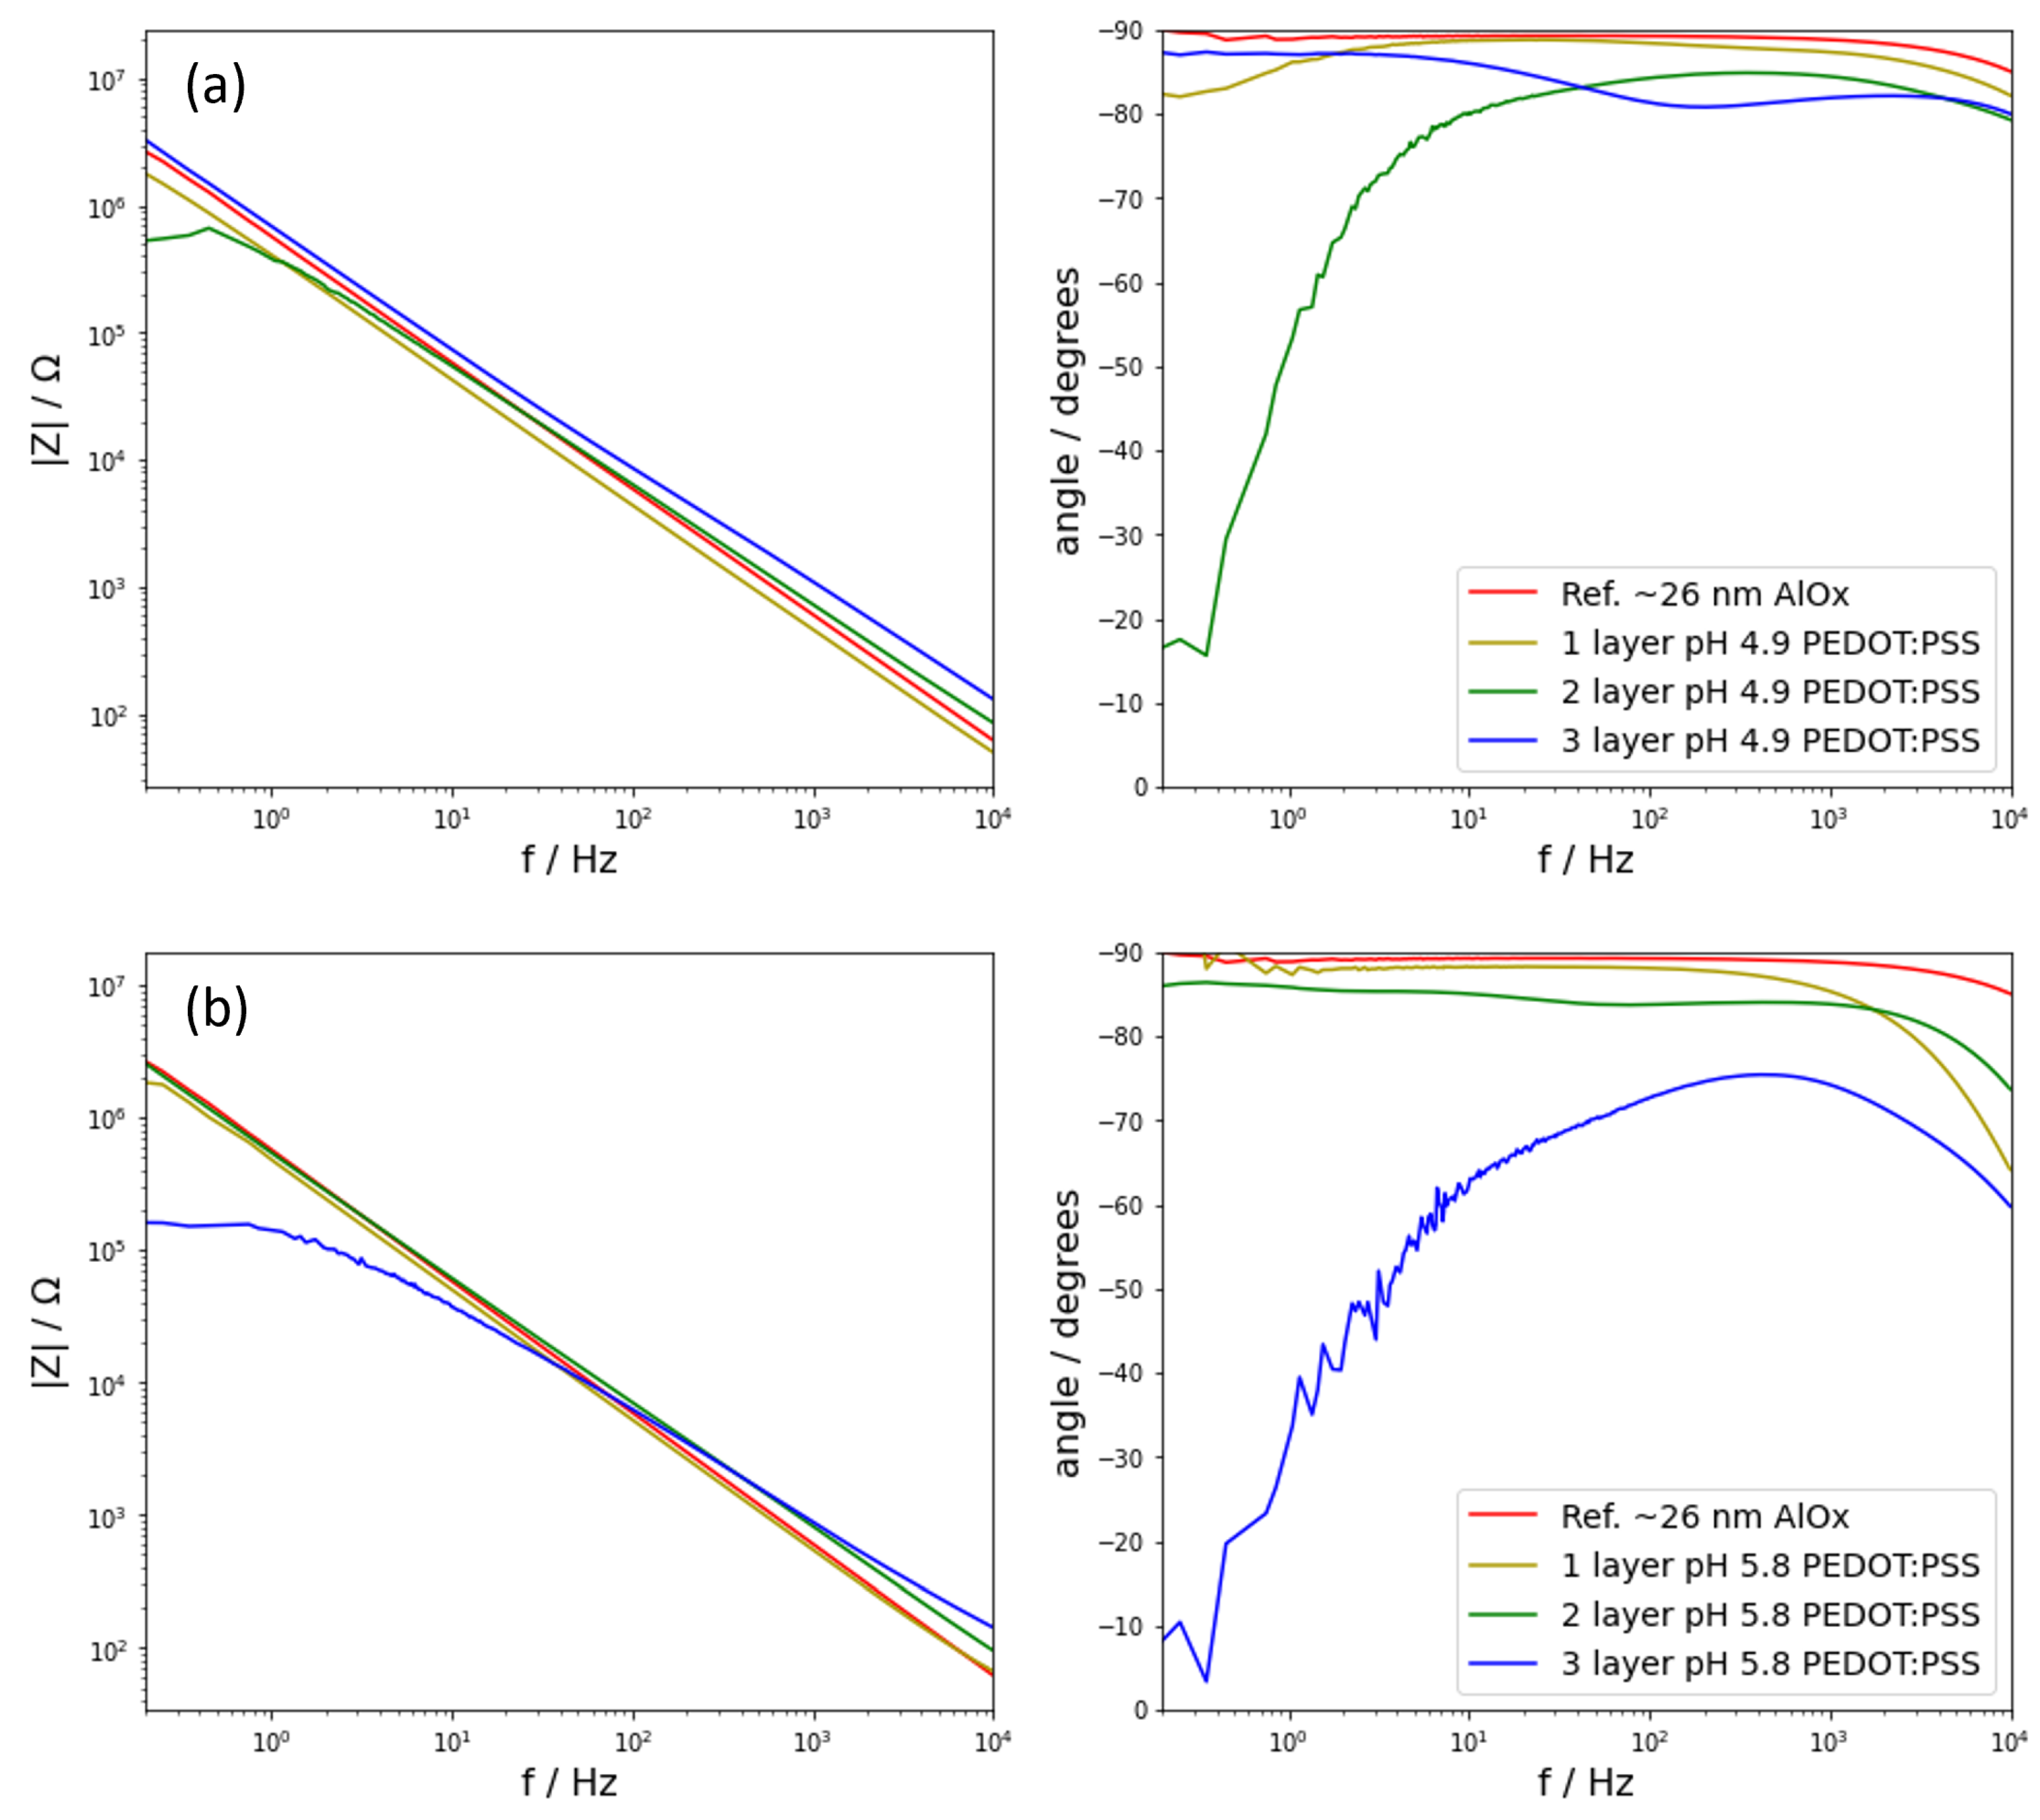
In spite of these cracks, the samples were subsequently prepared for the electrochemical analysis via ORP-EIS by applying a layer of silver paste. Using the same sample as before as a reference (aluminium oxide formed at 20 V covered by silver paste), the following EIS spectra were obtained (Figure 9). Compared to the analysis of samples with an acidic PEDOT:PSS, which showed generally capacitive behaviour (Figure 2), there was scatter in the behaviour of the neutral pH PEDOT:PSS samples. Whereas applying one layer of PEDOT:PSS delivered samples that resemble the behaviour of the analogous samples at pH 1.9, adding additional layers showed different phenomena. Regarding the samples produced from the PEDOT:PSS dispersion at pH 4.9 (Figure 9a), these showed dispersion in terms of EIS response. Adding one or three layers of PEDOT:PSS depicted a capacitive behaviour for the range of frequencies used. However, the sample with two layers of PEDOT:PSS did not behave capacitively below 10 Hz. This was observed as a drop in the phase angle that reached values below −20°, indicating a transition to resistive behaviour. Looking at the samples formed with a PEDOT:PSS dispersion at 5.8 (Figure 9b), once again, they did not resemble the behaviour of the previously studied samples. In this scenario, the samples formed by one and two layers of PEDOT:PSS behaved capacitively, but when a third layer was added, the capacitive properties were lost below 100 Hz. In comparison to the samples prepared with an acidic dispersion, the response of samples at neutral pH showed a larger dispersion in EIS response, regardless of the pH value and number of layers.
The fitting of this series of samples was started from the model of the reference sample (Figure 3d). Analogously to the samples with a PEDOT:PSS layer at an acidic pH, this model could not fit any of the spectra. The next used model was the one applied for the samples including layers of acidic PEDOT:PSS (
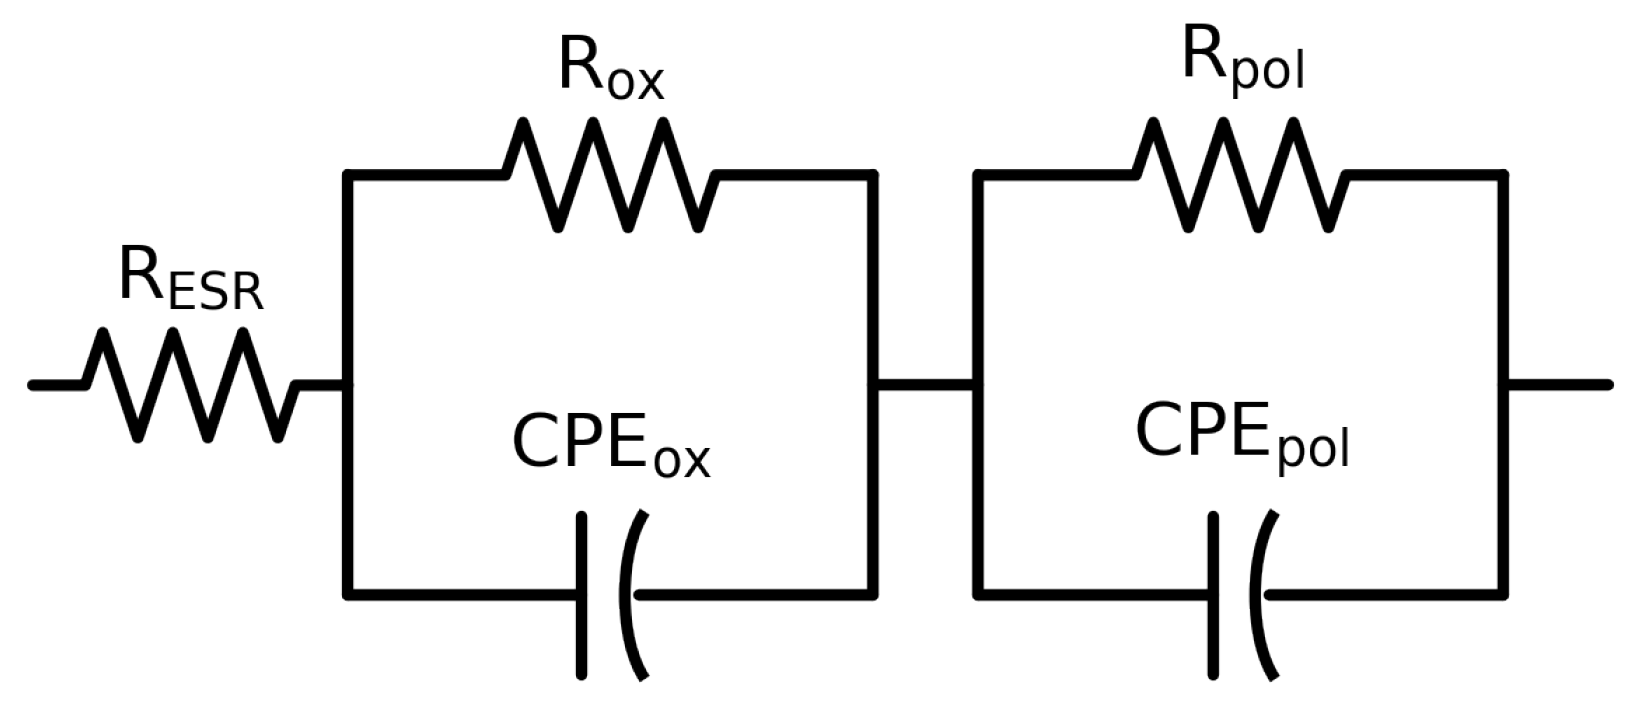
Figure 4d). Such a model rendered valid fitting values for those samples that depicted capacitive behaviour below 1000 Hz, namely three PEDOT:PSS layers at pH 4.9 and samples with one and two layers at pH 5.8. However, the remaining samples could not be fitted by this model. For those that could not be fitted with that model, an extra component had to be added. These samples share a characteristic, which is a decay in the phase angle below 10 Hz and a stabilization of the modulus of the impedance, namely samples with one and two layers of dispersion at pH 4.9 and three layers of dispersion at pH 5.8. Accounting for this transition to a resistive regime was achieved in the circuit model by adding an extra resistor in parallel to the first CPE (Figure 10). This transition reveals the resistive properties of the underlying oxide and it was consequently labeled as Rox.
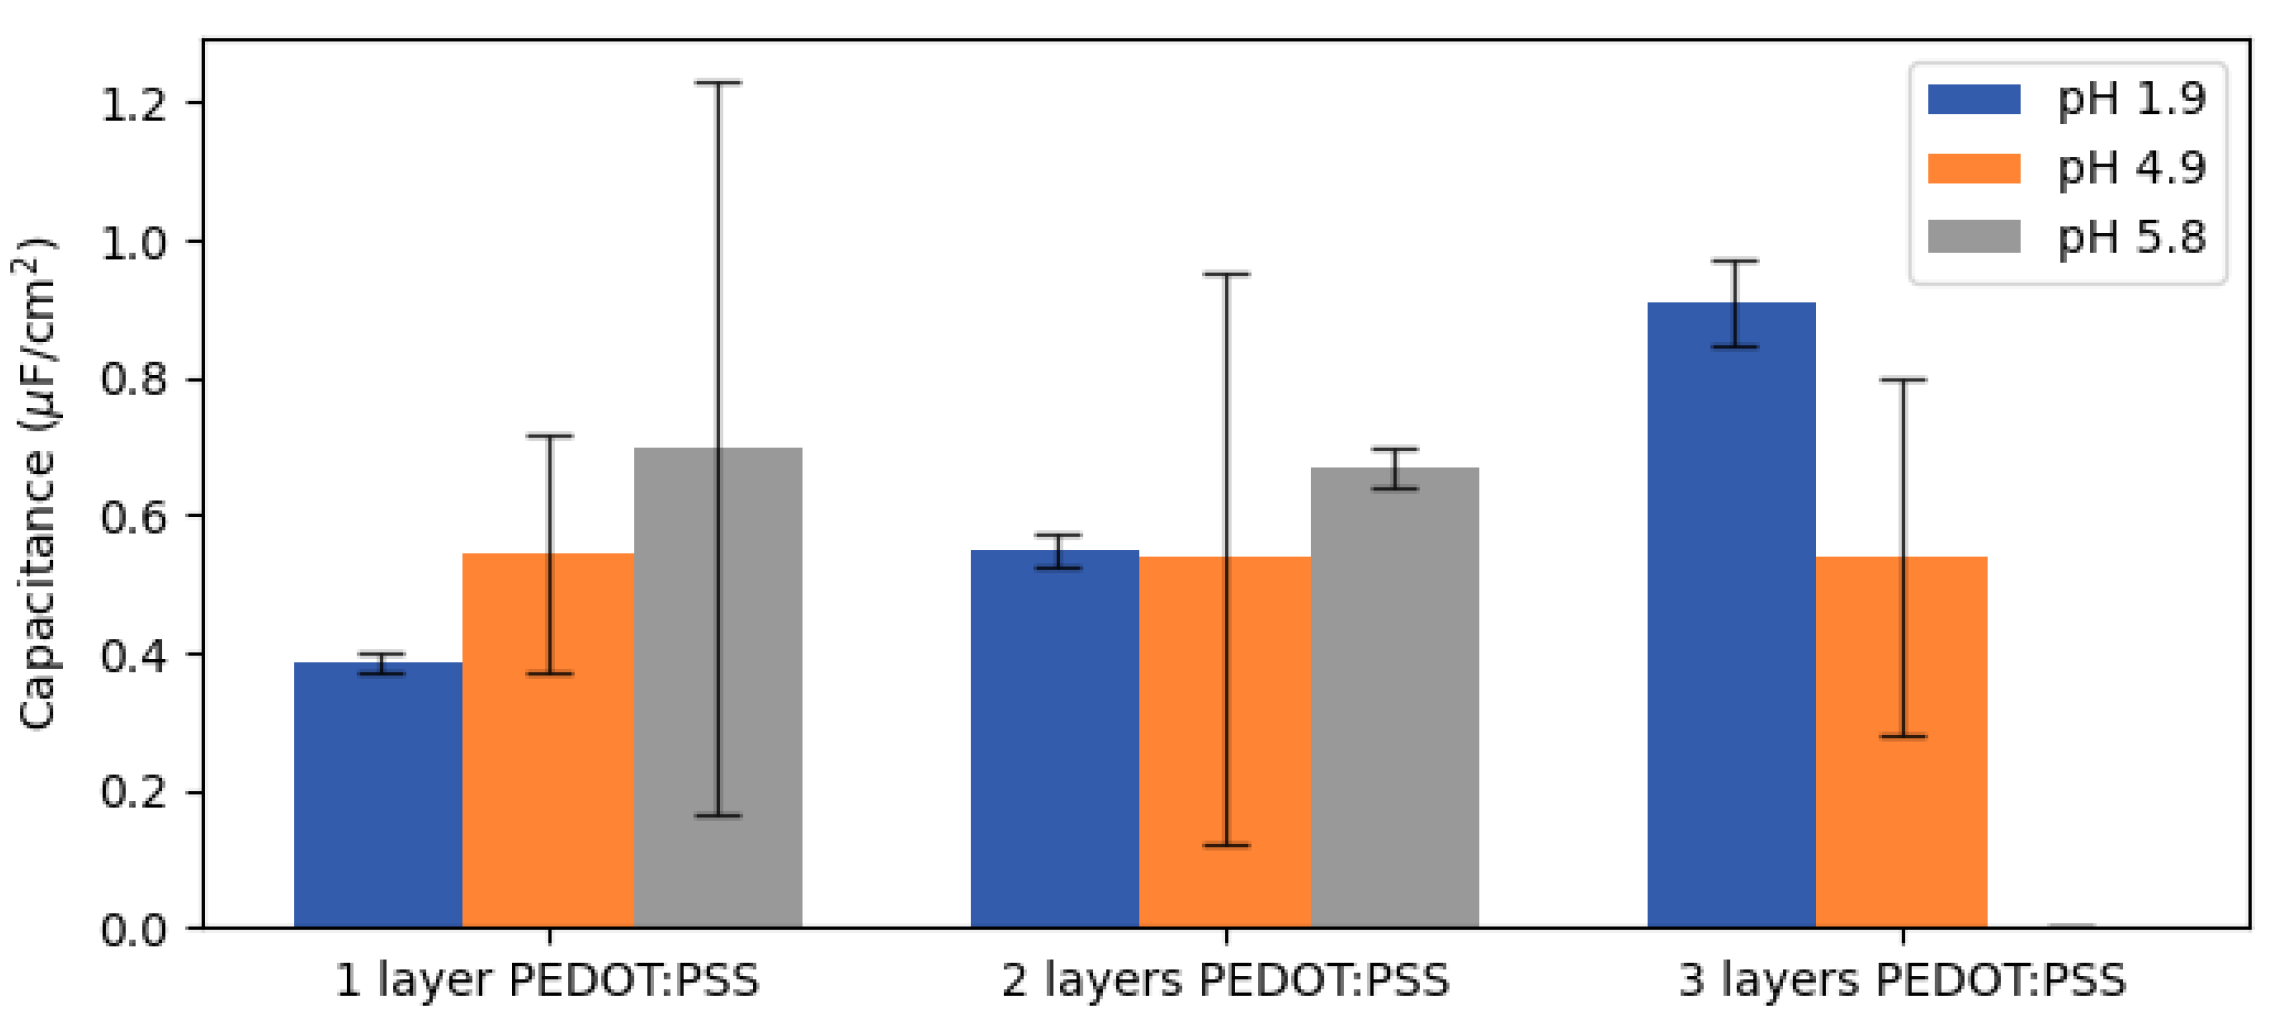
Once the circuit models that fit every system were found, the values of capacitance for the CPE component connected with the properties of the oxide layer were calculated. Assuming a power-law distribution of time constants, the capacitance values of all samples was calculated and compared to the samples produced at a lower pH (Figure 11).
Capacitance values could be obtained from all the CPE components except for the sample consisting of three layers of PEDOT:PSS at pH 5.8, for which the power-law distribution model could not provide reasonable values. Since this sample presented phase angles below −80° for every frequency, a suitable framework in which to apply the power-law distribution could not be ensured and could not provide, consequently, correct values. As expected from the dispersion in the impedance response (Figure 9), the average of the capacitance values led to a large uncertainty for the neutral PEDOT:PSS samples. Therefore, no progression of the impedance response could be extracted in function of the amount of PEDOT:PSS for systems formed with neutral PEDOT:PSS dispersions.
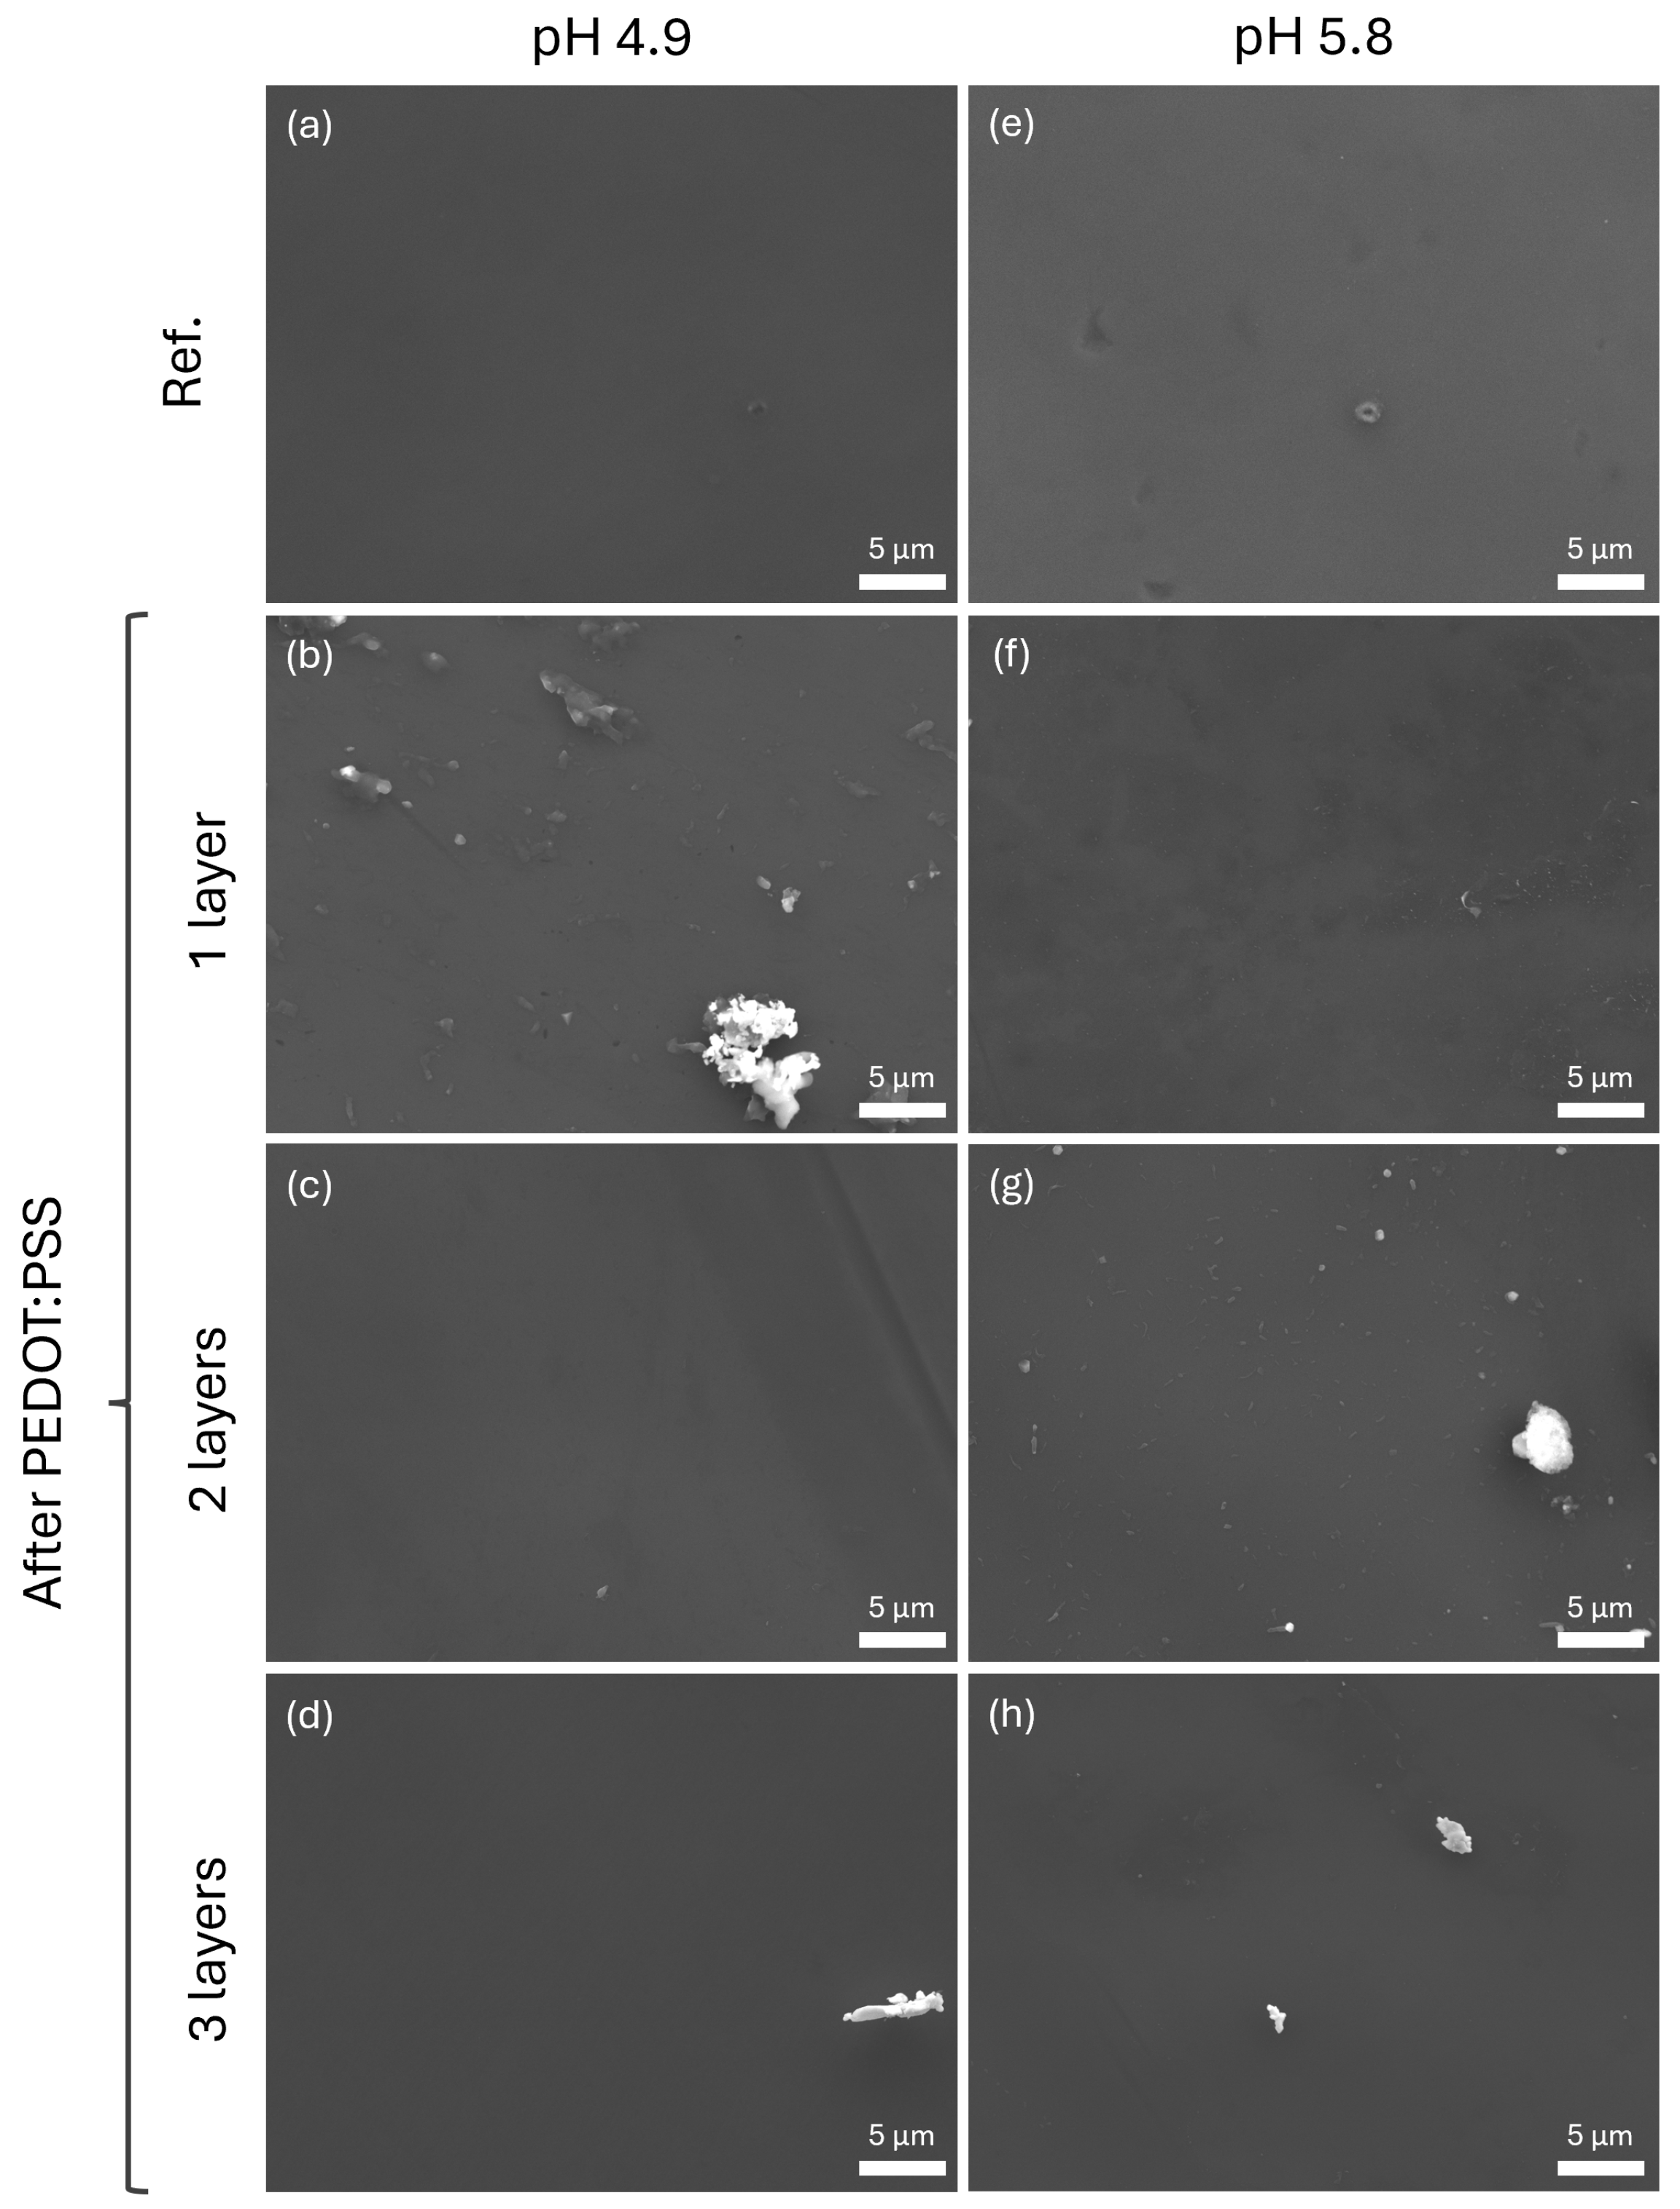
After performing the electrochemical analysis, an analysis of the surface followed analogously to the previous set of samples. After removing the layers on top of the aluminium substrate, the surfaces were studied via SEM (Figure 12). The two reference samples presented are identical to the one used for the samples exposed at an acidic PEDOT:PSS dispersion (Figure 12a,e). Similarly, when looking at the surfaces exposed to PEDOT:PSS, the surfaces showed as unaffected where no attack could be observed (Figure 12b–d,f–h). The resulting flat surfaces were not affected either by the pH of the dispersion used (4.9 or 5.8) or the number of layers used.
In view of the results, neutralizing the PEDOT:PSS dispersions prior to their deposition onto an aluminium electrode prevented the formation of pits on top of the electrode, as can be observed on the SEM micrographs (Figure 12). The absence of pits did not necessarily result in an improvement in electrochemical properties. The study of the electrochemical analysis revealed that the dispersion in the obtained samples during the production of the model systems when using neutral dispersions of PEDOT:PSS showed dispersion of results. Not only was there no trend in the samples as there was for the acidic ones, but the loss of capacitive properties below 100 Hz could be observed on some of the samples. The decrease in the electrochemical properties may have its origin in the poorer layer formation properties (Figure 8), motivated by the formation of bigger PEDOT:PSS colloids in dispersion and change in zeta potential between the Al2O3, as commented by Wakabayashi et al. [16]. However, that does not fully explain why neutral dispersions exposed the resistive properties of the underlying aluminium oxide layer but acidic ones did not, especially when the latter attacked the surface that penetrated through the aluminium oxide layer. It was observed how neutral pH PEDOT:PSS dispersions showed poor layer formation properties compared to acidic ones. As a result of the cracks appearing on the polymer layers (Figure 8), different current paths took place originating the dispersion in EIS response of the samples. In order to better understand the conformation of PEDOT chains in the polymer layers, XRD analysis could be an interesting technique as an approach in future work. The absence of reactions between the polymer and the aluminium substrate, as was the case for the neutral pH PEDOT:PSS dispersions, could imply that the current collector, silver paste, entered in contact with the aluminium oxide, therefore showing behaviours ranging from fully capacitive to resistive. However, when an acidic PEDOT:PSS dispersion was used, not only there was the formation of pits, but also the protection by the products either by a redeposition of the aluminium or by the formation of a smut layer [16]. Consequently, the capacitive behaviour was kept throughout the full range of frequencies, whereas, in absence of this protective layer, the performance of the model solid state systems shifted towards a more resistive behaviour.

3. Materials and Methods

3.1. Materials and Production of Samples

The aluminium anodes used for this study were formed from a 0.6 mm thick ultrapure aluminium sheet (99.99% rolled sheet). The aluminium was cut into pieces of a size of 10 × 10 cm and cleaned with isopropyl alcohol (99.9%, VWR Chemicals, Radnor, PA, USA) under the influence of ultrasound to remove the presence of dust and grease. Subsequently, these were etched in a solution of 25 g/L NaOH (Pellets, VWR Chemicals, Radnor, PA, USA) at 70 °C for 30 s. After the alkaline etching process, the aluminium pieces were rinsed with deionized water for 5 min to rinse any remnant of the alkaline solution and dried under compressed air. Immediately after, they were electroetched in a solution 80:20 ethanol:perchloric acid (ethanol, ≥99.8, Sigma-Aldrich, St. Louis, MO, USA; perchloric acid, 60%, VWR Chemicals, Radnor, PA, USA) at 10 °C using a current density of 70 mA/cm2 for 6 min. Next, their surface was anodized at a constant current density of 1 mA/cm2 up to a voltage of 20 V or 50 V to obtain aluminium oxide layers of 26 nm and 65 nm, approximately, in agreement with an anodizing ratio of 13–14 Å/V [29], in a 0.1 M diammonium tartrate solution (Pellets, Sigma-Aldrich, St. Louis, MO, USA) at 25 °C to form a barrier oxide layer. Once the anodization process was completed, the aluminium electrodes were rinsed off with deionized water and dried out with compressed air.
The PEDOT:PSS dispersions used were based on a pristine dispersion of PEDOT:PSS, an aqueous based solution that contains no additives (1.2 wt%, ORGACON ICP1030, Agfa-Gevaert N.V., Mortsel, Belgium). Two extra dispersions were produced upon addition of a base. Starting from PEDOT:PSS at a pH of 1.9, a NaOH 0.1 M solution was added dropwise while stirring and constantly monitoring the change in pH. These two new dispersions had pH values of 4.9 and 5.8. Before depositing the PEDOT:PSS dispersions, they were subjected to ultrasound for 5 minutes and then sieved through a 0.2 μ m filter.
The process to deposit the PEDOT:PSS dispersion was drop casting. To study whether the amount of polymer dispersion affected the performance of the capacitors, three different samples per dispersion were prepared. An amount of 20 μ L of the corresponding PEDOT:PSS dispersion was deposited on a circular area of 0.2 mm radius on the aluminium electrode. After each deposition, the polymer dispersion was dried out in an oven at 120 °C to evaporate the water electrolyte and form a film [30]. This process was repeated systematically once or twice, resulting in samples with double or triple the amount of PEDOT:PSS.

3.2. Characterization Techniques

The performance analysis of the samples was conducted via Odd Random Phase–Electrochemical Impedance Spectroscopy (ORP-EIS), an in-house developed technique. This technique, derived from single sine EIS, uses a multisine signal to excite different frequencies simultaneously. The multisine signal excites only certain odd frequencies, and one in three of these are not excited. Studying the output signal at both the excited and non excited frequencies provides information about the stationarity and linearity of the studied samples. Information about this technique can be found in Refs. [22,23]. The samples of this study were subjected to a multisine voltage signal with RMS amplitudes ranging from 5 mV to 40 mV on top of the open circuit voltage in a frequency range from 50 mHz to 10 kHz. The response signal was received and treated in a computer with an integrated NI PCI-4461 data acquisition card connected to an in-house developed analog potentiostat. The ORP-EIS setup was controlled thanks to custom software developed in Python 3.7. The electrochemical cells were finished by manually adding an electric contact, namely a layer of silver paste, on top of the polymer film. The cells were connected to the potentiostat in a 2-electrode setup connecting the working electrode on the silver paste to the PEDOT:PSS layer and the counter and reference electrodes both connected in series to the aluminium substrate (Figure 13).
After the electrochemical characterization was completed, the buried aluminium surface was studied post mortem via surface analysis techniques. To reach the aluminium surface, the silver paste was carefully removed with a blade and the layer(s) of PEDOT:PSS were washed off with deionized water. Subsequently, the samples were dried with compressed air. The morphology of the aluminium oxide surface was observed using scanning electron microscopy (SEM) with an FE–SEM JEOL JSM–7100F microscope (Tokyo, Japan) equipped with a tungsten filament using an accelerating voltage between 10 and 15 kV and a working distance of 4 mm. The topography measurements were carried out in ambient conditions using a Park-Systems (XE–100) (Suwon, Republic of Korea) atomic force microscope (AFM). An SCM-Pt probe with a rectangular cantilever having a nominal resonant frequency of 65 kHz and nominal force constant of 0.6 N/m was used.

4. Conclusions

In this work, PEDOT:PSS dispersions at different pH were brought into contact with a flat aluminium electrode, and the electrical behaviour of these systems plus interaction between the two phases were studied. When these dispersions were put in contact with an aluminium substrate with its correspondent grown aluminium oxide on top as a dielectric, the aluminium oxide layer reacted due to the acid environment. The use of a flat aluminium electrode that represented an ideal framework enabled the study of the interaction between different PEDOT:PSS dispersions and the aluminium electrode. It was found that the interaction between these two components caused the formation of pits on the aluminium oxide. However, instead of worsening the electrical properties of the produced capacitors, they experienced an increase in the capacitance for any probed frequency. The increase in capacitance was linked with increase of the area on the aluminium substrate as a result of the attack of the PEDOT:PSS. Successive addition of PEDOT:PSS layers resulted in bigger pores on the aluminium oxide. When PEDOT:PSS dispersions were neutralized and used to form layers, no attack was observed on the aluminium oxide. However, the impedance response of these systems displayed a scatter on their EIS response, and they were not consistently behaving capacitively, as opposed to the samples formed with the PEDOT:PSS dispersion at pH 1.9. This interaction provided knowledge of the type of attack that such dispersions produce on etched aluminium electrodes that are typical in commercial capacitors. Hence, it is expected that such dispersions are likely to attack the etched aluminium electrodes. Nevertheless, as the electrical properties of the produced systems are constant, the use of acidic PEDOT:PSS dispersions is preferred. Hence, the use of these PEDOT:PSS dispersions affect the aluminium oxide positively by increasing the area of contact between the electrodes, which, in turn, results in better performing solid state polymer electrolytic capacitors.

Author Contributions

Conceptualization, N.C.G., H.T. and A.H.; Formal analysis, N.C.G., R.I.R. and B.W.; Funding acquisition, H.T. and A.H.; Investigation, N.C.G. and R.I.R.; Methodology, N.C.G.; Project administration, H.T. and A.H.; Resources, H.T. and A.H.; Software, B.W.; Supervision, H.T. and A.H.; Validation, N.C.G., R.I.R. and B.W.; Visualization, N.C.G.; Writing—original draft, N.C.G.; Writing—review and editing, R.I.R., B.W., H.T. and A.H. All authors have read and agreed to the published version of the manuscript.

Funding

This research was funded by Research Council VUB grant number OZR4161BOF.

Data Availability Statement

Data are contained within the article.

Conflicts of Interest

The authors declare no conflicts of interest.

References

  1. Kaiser, C.J. The Capacitor Handbook; Springer Netherlands: Dordrecht, The Netherlands, 1993. [Google Scholar]
  2. Nishino, A. Capacitors: Operating principles, current market and technical trends. J. Power Sources 1996, 60, 137–147. [Google Scholar] [CrossRef]
  3. Shrivastava, A.; Bangerth, S.; Azarian, M.H.; Morillo, C.; Pecht, M.; Levin, M.; Steinhardt, L.; Callini, A. Detection of capacitor electrolyte residues with FTIR in failure analysis. J. Mater. Sci. Mater. Electron. 2014, 25, 635–644. [Google Scholar] [CrossRef]
  4. Burke, A. Ultracapacitors: Why, how, and where is the technology. J. Power Sources 2000, 91, 37–50. [Google Scholar] [CrossRef]
  5. Akin, M.; Zhou, X. Recent advances in solid-state supercapacitors: From emerging materials to advanced applications. Int. J. Energy Res. 2022, 46, 10389–10452. [Google Scholar] [CrossRef]
  6. Snook, G.A.; Kao, P.; Best, A.S. Conducting-polymer-based supercapacitor devices and electrodes. J. Power Sources 2011, 196, 1–12. [Google Scholar] [CrossRef]
  7. Dobashi, Y.; Fannir, A.; Farajollahi, M.; Mahmoudzadeh, A.; Usgaocar, A.; Yao, D.; Nguyen, G.T.M.; Plesse, C.; Vidal, F.; Madden, J.D.W. Ion Transport in Polymer Composites with Non-Uniform Distributions of Electronic Conductors. Electrochim. Acta 2017, 247, 149–162. [Google Scholar] [CrossRef]
  8. Bryan, A.M.; Santino, L.M.; Lu, Y.; Acharya, S.; D’Arcy, J.M. Conducting Polymers for Pseudocapacitive Energy Storage. Chem. Mater. 2016, 28, 5989–5998. [Google Scholar] [CrossRef]
  9. Calabia Gascón, N.; Terryn, H.; Hubin, A. The role of PEDOT:PSS in (super)capacitors: A review. Next Nanotechnol. 2023, 2, 100015. [Google Scholar] [CrossRef]
  10. Elschner, A.; Kirchmeyer, S.; Lovenich, W.; Merker, U.; Reuter, K. PEDOT; CRC Press: Boca Raton, FL, USA, 2010. [Google Scholar]
  11. Su, Z.; Jin, Y.; Wang, H.; Li, Z.; Huang, L.; Wang, H. PEDOT:PSS and Its Composites for Flexible Supercapacitors. ACS Appl. Energy Mater. 2022, 5, 11915–11932. [Google Scholar] [CrossRef]
  12. Chun, H.W.; Li, C. PEDOT: Fundamentals and Its Nanocomposites for Energy Storage. Chin. J. Polym. Sci. (Engl. Ed.) 2020, 38, 435–448. [Google Scholar]
  13. Lövenich, W. PEDOT-properties and applications. Polym. Sci. Ser. C 2014, 56, 135–143. [Google Scholar] [CrossRef]
  14. Groenendaal, L.; Jonas, F.; Freitag, D.; Pielartzik, H.; Reynolds, J.R. Poly(3,4-ethylenedioxythiophene) and its derivatives: Past, present, and future. Adv. Mater. 2000, 12, 481–494. [Google Scholar] [CrossRef]
  15. Shahrim, N.A.; Ahmad, Z.; Azman, A.W.; Buys, Y.F.; Sarifuddin, N. Mechanisms for doped PEDOT:PSS electrical conductivity improvement. Mater. Adv. 2021, 2, 7118–7138. [Google Scholar] [CrossRef]
  16. Wakabayashi, T.; Katsunuma, M.; Kudo, K.; Okuzaki, H. PH-Tunable High-Performance PEDOT:PSS Aluminum Solid Electrolytic Capacitors. ACS Appl. Energy Mater. 2018, 1, 2157–2163. [Google Scholar] [CrossRef]
  17. Mochizuki, Y.; Horii, T.; Okuzaki, H. Effect of pH on Structure and Conductivity of PEDOT/PSS. Trans. Mater. Res. Soc. Jpn. 2012, 37, 307–310. [Google Scholar] [CrossRef]
  18. Cameron, J.; Skabara, P.J. The damaging effects of the acidity in PEDOT:PSS on semiconductor device performance and solutions based on non-acidic alternatives. Mater. Horizons 2020, 7, 1759–1772. [Google Scholar] [CrossRef]
  19. Rathore, P.; Schiffman, J.D. Effect of pH Value on the Electrical Properties of PEDOT:PSS-Based Fiber Mats. ACS Eng. Au 2023, 3, 527–536. [Google Scholar] [CrossRef] [PubMed]
  20. Deltombe, E.; Pourbaix, M. The Electrochemical Behavior of Aluminum—Potential pH Diagram of the System Al–H2O at 25 C. Corrosion 1958, 14, 16–20. [Google Scholar] [CrossRef]
  21. Vargel, C. Corrosion of Aluminium, 2nd ed.; Elsevier: Amsterdam, The Netherlands, 2004. [Google Scholar]
  22. Van Gheem, E.; Pintelon, R.; Vereecken, J.; Schoukens, J.; Hubin, A.; Verboven, P.; Blajiev, O. Electrochemical impedance spectroscopy in the presence of non-linear distortions and non-stationary behaviour Part I: Theory and validation. Electrochim. Acta 2004, 49, 4753–4762. [Google Scholar] [CrossRef]
  23. Ingelgem, Y.V.; Tourwé, E.; Blajiev, O.; Pintelon, R.; Hubin, A. Advantages of odd random phase multisine electrochemical impedance measurements. Electroanalysis 2009, 21, 730–739. [Google Scholar] [CrossRef]
  24. Gateman, S.M.; Gharbi, O.; de Melo, H.G.; Ngo, K.; Turmine, M.; Vivier, V. On the use of a constant phase element (CPE) in electrochemistry. Curr. Opin. Electrochem. 2022, 36, 101133. [Google Scholar] [CrossRef]
  25. Orazem, M.E.; Frateur, I.; Tribollet, B.; Vivier, V.; Marcelin, S.; Pèbxexre, N.; Bunge, A.L.; White, E.A.; Riemer, D.P.; Musiani, M. Dielectric Properties of Materials Showing Constant-Phase-Element (CPE) Impedance Response. J. Electrochem. Soc. 2013, 160, C215–C225. [Google Scholar] [CrossRef]
  26. Hirschorn, B.; Orazem, M.E.; Tribollet, B.; Vivier, V.; Frateur, I.; Musiani, M. Determination of effective capacitance and film thickness from constant-phase-element parameters. Electrochim. Acta 2010, 55, 6218–6227. [Google Scholar] [CrossRef]
  27. Volkov, A.V.; Wijeratne, K.; Mitraka, E.; Ail, U.; Zhao, D.; Tybrandt, K.; Andreasen, J.W.; Berggren, M.; Crispin, X.; Zozoulenko, I.V. Understanding the Capacitance of PEDOT:PSS. Adv. Funct. Mater. 2017, 27, 1–10. [Google Scholar] [CrossRef]
  28. Proctor, C.M.; Rivnay, J.; Malliaras, G.G. Understanding volumetric capacitance in conducting polymers. J. Polym. Sci. Part B Polym. Phys. 2016, 54, 1433–1436. [Google Scholar] [CrossRef]
  29. De Wit, H.J.; Wijenberg, C.; Crevecoeur, C. Impedance Measurements during Anodization of Aluminum. J. Electrochem. Soc. 1979, 126, 779–785. [Google Scholar] [CrossRef]
  30. Sato, K.; Sakakura, M.; Koseki, K. Solid Electrolytic Capacitor and Method for Manufacturing Solid Electrolytic Capacitor. U.S. Patent US20180218844A1, 2 August 2018. [Google Scholar]
Figure 1. Top optical image of the sample resulting from depositing three layers of pristine PEDOT:PSS dispersion on top of a planar aluminium electrode.
Inorganics 12 00104 g001
Figure 2. Bode plot of the impedance response of two produced systems with an aluminium oxide formed at (a) 20 V and (b) 50 V. The signals correspond to bare aluminium oxide as reference (red), system formed by one layer (yellow), two layers (green), or three layers (blue) of pristine PEDOT:PSS dispersion at pH 1.9.
Inorganics 12 00104 g002
Figure 3. Fitting results on the reference sample with an aluminium layer formed at 20 V. On the Bode plot (a,c) the signals of impedance (orange), the different noise signals (brown, purple, and red) and the residuals of the fitting (green) are depicted. Next to them (b,d), the corresponding equivalent circuit model used for the fitting.
Inorganics 12 00104 g003
Figure 4. Fitting results on the sample formed by an aluminium substrate, an aluminium oxide formed at 20 V, and a layer of pristine PEDOT:PSS. The Bode plot (a,c) depicts the impedance signal (orange), the different noise signals (brown, purple, and red), and the residuals of the fitting (green). Next to them (b,d), the corresponding equivalent circuit model used for the fitting.
Inorganics 12 00104 g004
Figure 5. Capacitance evolution calculated from CPEox for the two thicknesses of aluminium oxide (formed at 20 V (blue) and 50 V (orange)) with one, two, and three layers of PEDOT:PSS on top. The values and the error bars were calculated averaging out the response of three samples of the same configuration.
Inorganics 12 00104 g005
Figure 6. SEM micrographs of the aluminium oxide surface after anodization process at (a) 20 V and (e) 50 V (reference sample), removing (b,f) one layer, (c,g) two layers, or (d,h) three layers of PEDOT:PSS at pH 1.9.
Inorganics 12 00104 g006
Figure 7. AFM scans of 10 × 10 μ m over the surface of (a) aluminium oxide formed at 20 V after removal of one layer of PEDOT:PSS, (c) two layers of PEDOT:PSS, and (e) three layers of PEDOT:PSS, accompanied with their respective linescans (b,d,f).
Inorganics 12 00104 g007
Figure 8. Top optical image of the samples resulting after the deposition of three PEDOT:PSS dispersions at pH (a) 4.9 and (b) 5.8.
Inorganics 12 00104 g008
Figure 9. Bode plot of the impedance response of the produced systems with PEDOT:PSS dispersion at pH of (a) 4.9 and (b) 5.8: bare aluminium oxide as reference (red), system formed by one layer of PEDOT:PSS (yellow), system formed by two layers of PEDOT:PSS (green), and system formed by three layers of PEDOT:PSS (blue).
Inorganics 12 00104 g009
Figure 10. Model circuit that represents the electrolyte resistance with RESR, the electrochemical properties in terms of charge accumulation and resistivity with a nested Rox-CPEox and an extra nested system that takes into account the PEDOT:PSS layer(s), Rpol-CPEpol.
Inorganics 12 00104 g010
Figure 11. Capacitance evolution calculated from CPEox for samples with a different number of layers produced with PEDOT:PSS dispersions at pH 1.9 (blue), pH 4.9 (orange), and pH 5.8 (gray). The values and the error bars were calculated averaging out the response of three samples of the same configuration.
Inorganics 12 00104 g011
Figure 12. SEM micrographs of the aluminium oxide surface formed at 20 V after deposition of PEDOT:PSS dispersions at pH (a) 4.9 and (e) 5.8 (reference samples), removing (b,f) one layer, (c,g) two layers, or (d,h) three layers of PEDOT:PSS.
Inorganics 12 00104 g012
Figure 13. Schematic of the PEDOT:PSS–aluminium solid state model system and respective connections for the electrochemical analysis.
Inorganics 12 00104 g013
Table 1. Extracted values out of the fitting of both reference samples with the circuit model presented in Figure 3d.
RESR
Ω
Qox
nF / s ( 1 α ) cm2
α ox
 
Ref. sample (20 V) 4.615 ± 0.013 282.52 ± 0.03 0.991 ± 1.8 × 10 5
Ref. sample (50 V) 4.652 ± 0.020 121.50 ± 0.01 0.994 ± 1.2 × 10 5
Table 2. Extracted values out of the fitting of the sample composed with a 20 V formed oxide layer and one, two, or three layers of pristine PEDOT:PSS with the circuit model presented in Figure 4d.
1 Layer PEDOT:PSS2 Layers PEDOT:PSS3 Layers PEDOT:PSS
RESR ( Ω ) 1.53 ± 0.02 0.71 ± 0.01 0.88 ± 0.01
Qox ( n F / s ( 1 α ) cm 2 ) 364.63 ± 0.03 481.12 ± 0.03 660.42 ± 0.05
α ox 0.989 ± 2  ×  10 5 0.988 ± 1  ×  10 5 0.977 ± 2  ×  10 5
Rpol ( Ω ) 22.89 ± 0.58 1.35 ± 0.05 48.99 ± 1.59
Qpol ( n F / s ( 1 α ) cm 2 ) ( 260.7 ± 8.7 )  ×  10 3 ( 77.3 ± 14.5 )  ×  10 4 ( 351.4 ± 6.1 )  ×  10 3
α pol 0.679 ± 0.003 0.909 ± 0.020 0.753 ± 0.001
Table 3. Capacitance values calculated for both reference samples. The different values correspond to the theoretical capacitance expected for a parallel plate capacitor and two types of calculation to extract capacitance from a CPE component.
Theoretical Cap.
μFcm−2
Surf. Dist. Cap.
μFcm−2
Power-Law Cap.
μFcm−2
Ref. sample (20 V)0.327 0.2524 ± 0.0007 0.3162 ± 0.0008
Ref. sample (50 V)0.131 0.1120 ± 0.0002 0.1311 ± 0.0002
Disclaimer/Publisher’s Note: The statements, opinions and data contained in all publications are solely those of the individual author(s) and contributor(s) and not of MDPI and/or the editor(s). MDPI and/or the editor(s) disclaim responsibility for any injury to people or property resulting from any ideas, methods, instructions or products referred to in the content.

