2.1. Material Characterization
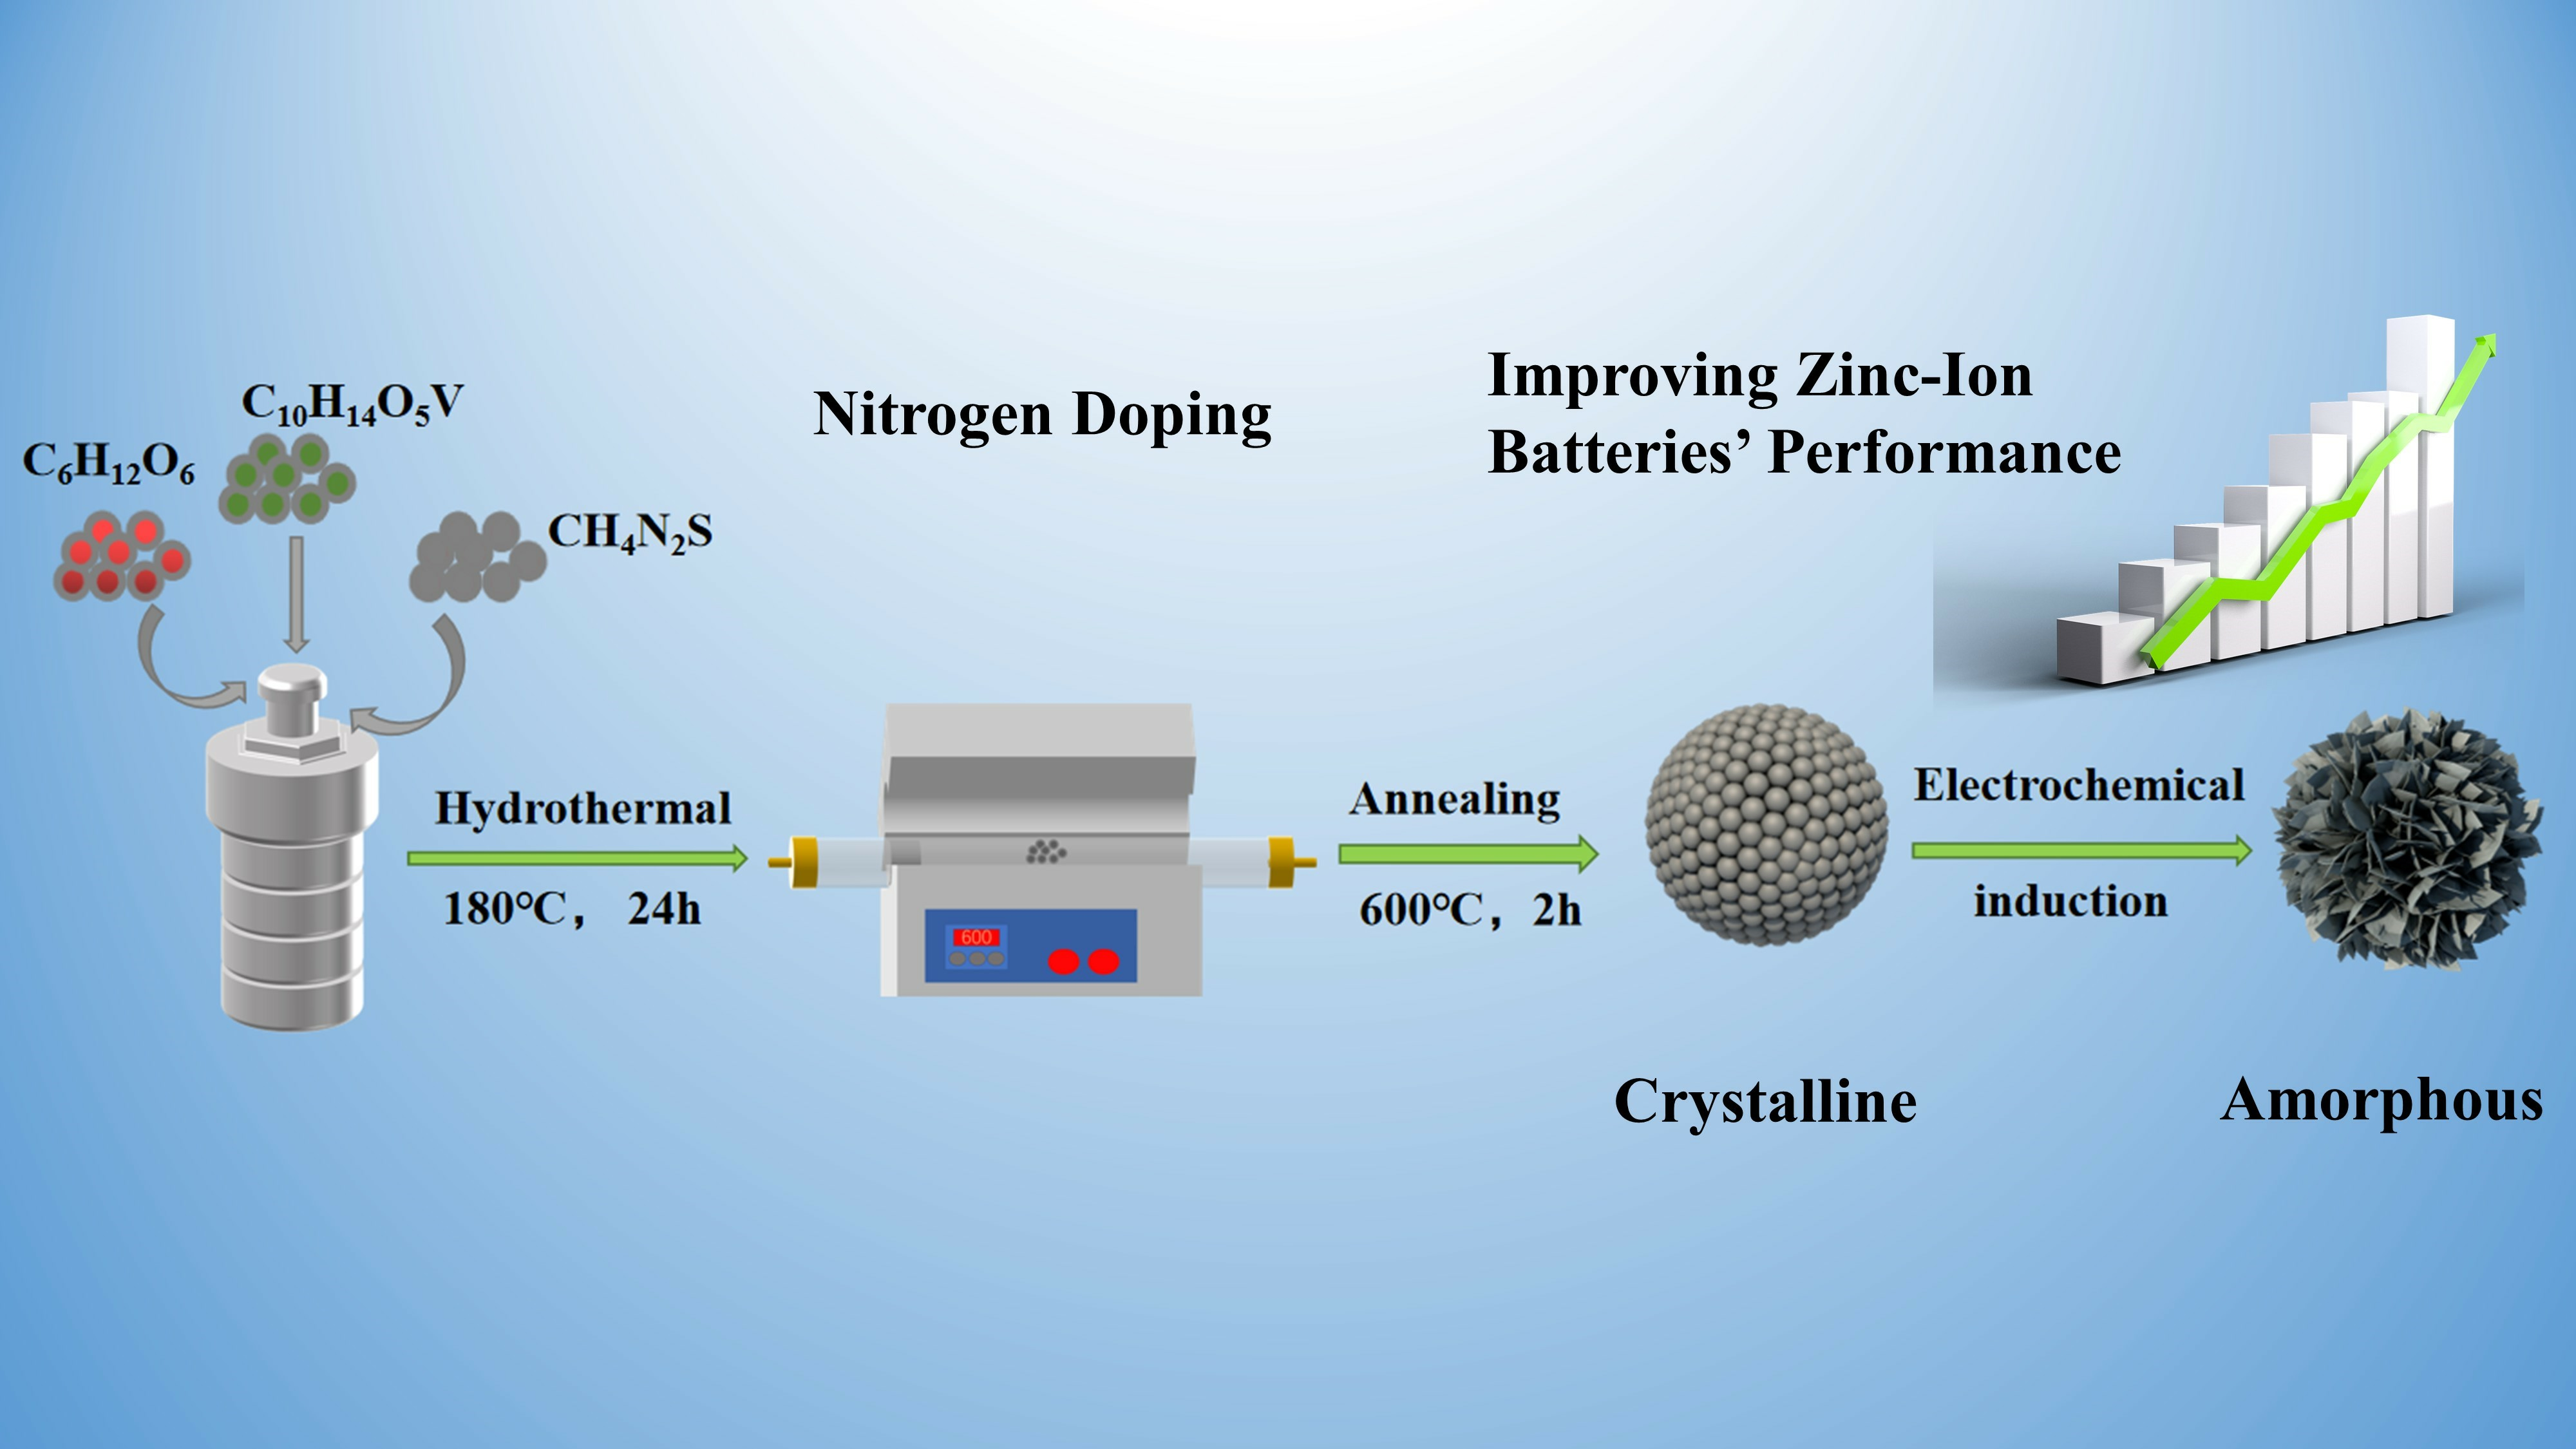
In contrast to the commonly utilized nitrogen source urea, the thiourea molecule features a less stable C=S double bond and amino
p−π-conjugated bonds, thereby facilitating a more ready detachment of nitrogen. Leveraging this property, thiourea was chosen as the nitrogen precursor, vanadium acetylacetonate as the vanadium source, and glucose as the carbon scaffold for the hydrothermal synthesis of N−V
2O
3/C. The structural paradigm of V
2O
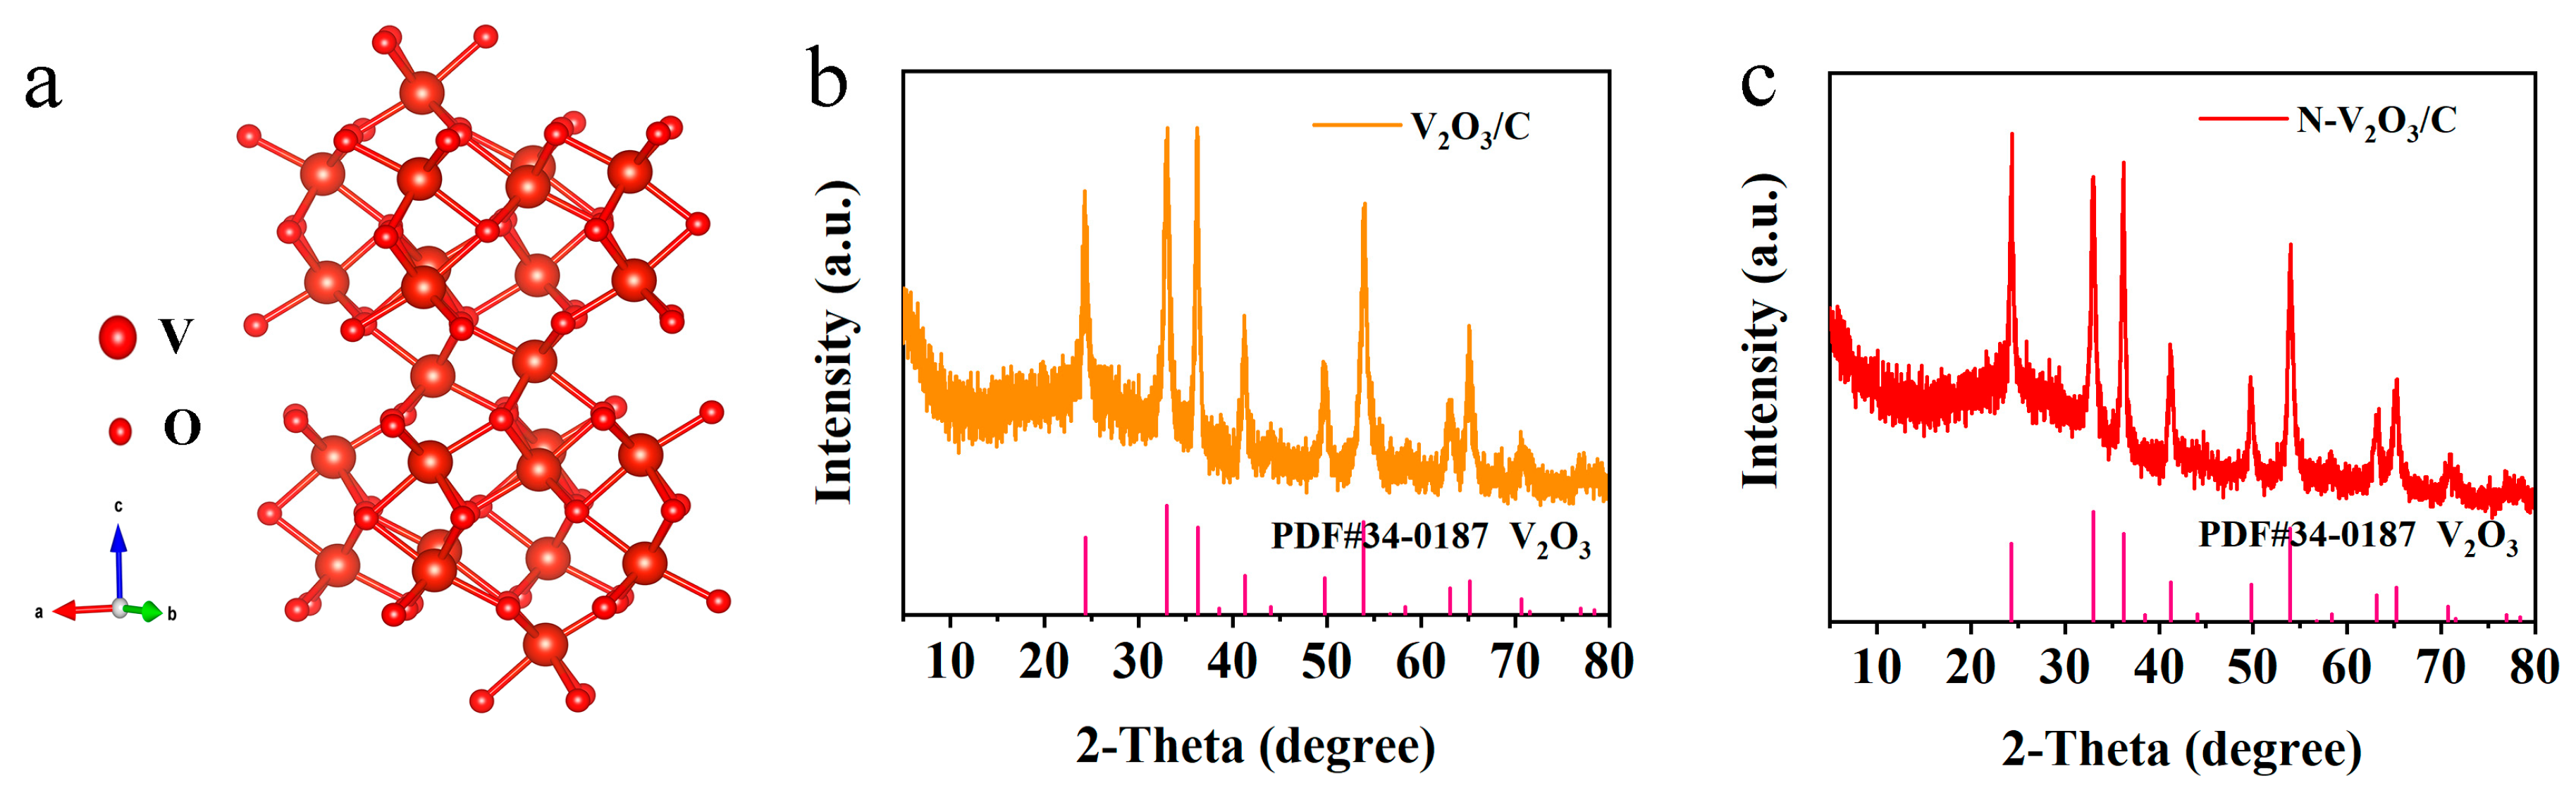
3, depicted in
Figure 1a, showcases a trigonal crystal system (space group
c) characterized by a three-dimensional lattice conducive to electron mobility within vanadium−vanadium (V−V) chain frameworks, thus exhibiting metallic properties. Vanadium atoms are strategically positioned within two-thirds of the octahedral sites formed by oxygen atoms. This arrangement is further complemented by the connectivity of two [VO
6] octahedra with their neighboring atoms through shared corners, faces, and edges, culminating in a tunnel-like three-dimensional matrix. Such a configuration is optimally designed to support the facile insertion and extraction of metal ions, pivotal for the material’s electrochemical performance.
The X-ray diffraction (XRD) patterns confirm the successful synthesis of the target product. Within the V
2O
3/C composite, the lack of distinctive carbon peaks indicates the carbon exists in an amorphous state, thereby not detracting from the crystalline integrity of V
2O
3, as demonstrated in
Figure 1b. Moreover, the incorporation of a nitrogen-doped carbon coating within the N−V
2O
3/C composite does not impede the crystallization of V
2O
3, corroborated by the data presented in
Figure 1c.
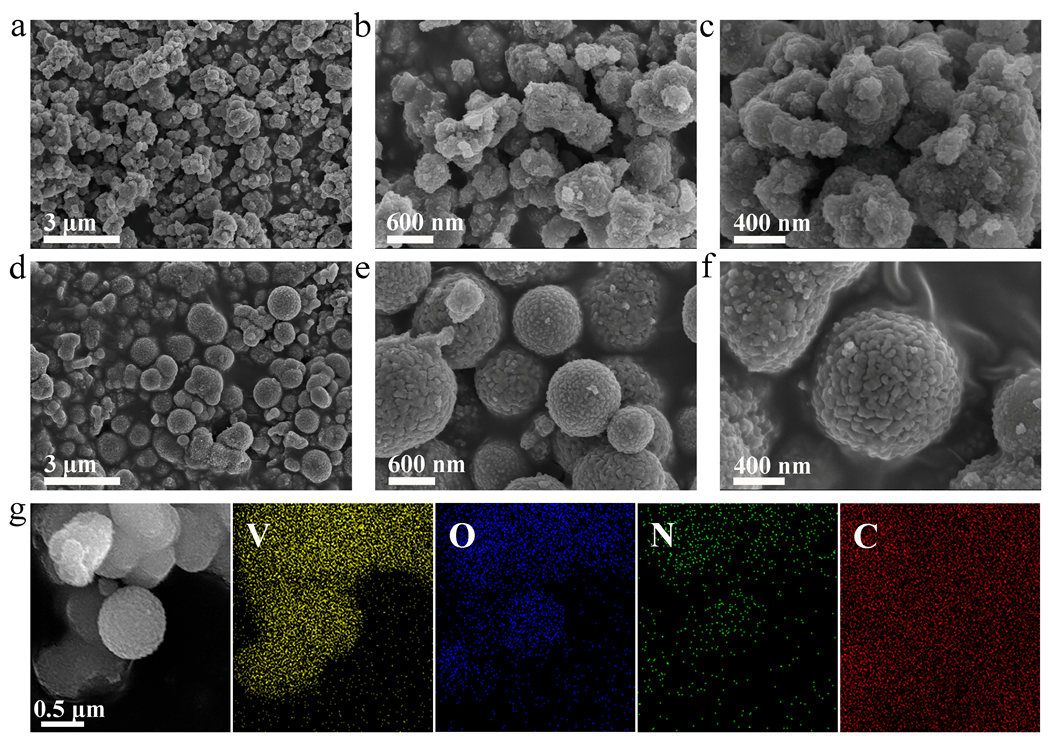
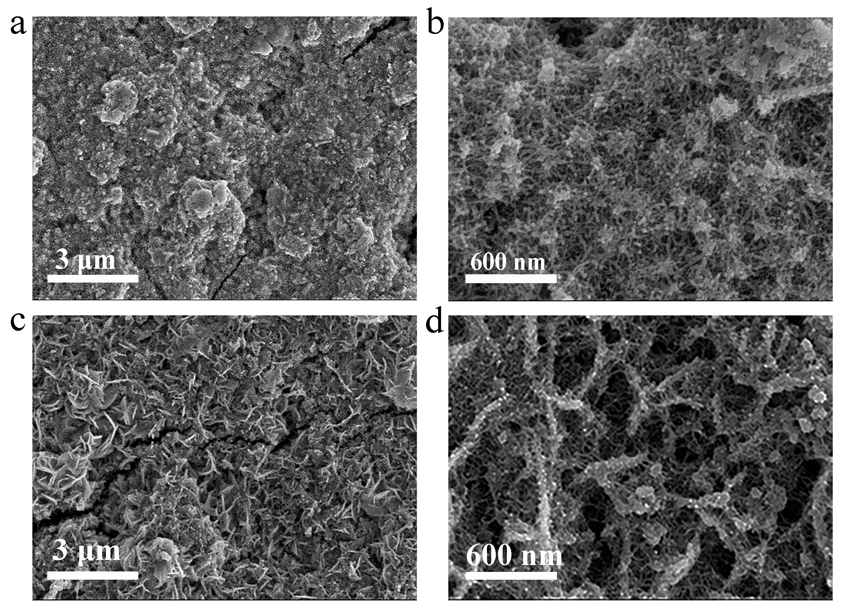
The SEM analysis of the synthesized samples elucidates a significant morphological transition attributed to the doping of N into the system. Initially, the V
2O
3/C composite showcases nanoparticles with irregular geometries, as evidenced by the SEM images presented in
Figure 2a–c at various magnifications. This irregularity indicates a non-uniform growth process in the absence of N doping. However, upon the introduction of N, as depicted in
Figure 2d–f, the composite N-V
2O
3/C transitions to a formation predominantly composed of nanospheres, exhibiting a more uniform and regular morphology.
The introduction of N atoms into the V2O3/C composite’s lattice structure fundamentally alters the surface energy and electronic configuration of the nanoparticles. N doping adjusts the surface properties by modifying the surface energy, which in turn influences the nucleation and growth processes of the nanoparticles. This modification facilitates a more isotropic growth mechanism, thereby promoting the development of a spherical morphology. The isotropic growth results from the uniform distribution of surface energy around the nanoparticle, leading to an equally distributed growth rate in all directions.
Furthermore, the doping of N enhances the uniformity in particle size, suggesting that N incorporation affects not just the surface energy but also the electronic properties of the nanoparticles. This change in electronic properties may influence the self-assembly process of the nanoparticles into nanospheres by altering the surface charge distribution and modifying interparticle interactions. Such alterations in the microscopic forces between particles could encourage a more orderly assembly process, favoring the formation of spheres over irregular shapes. This transformation suggests that N doping plays a critical role in controlling the nanostructure of the composite, thereby providing a tunable approach to modulate the material’s microstructure for potential applications.
The energy-dispersive X-ray spectroscopy (EDS) mapping of N−V
2O
3/C, provided in
Figure 2g, demonstrates a homogeneous distribution of the elements V, O, and N. The extensive presence of carbon is due to the conductive adhesive, highlighting its role in the composite’s structure.
2.2. Electrochemically Induced Phase Transition
In this study, 3 M Zn(CF
3SO
3)
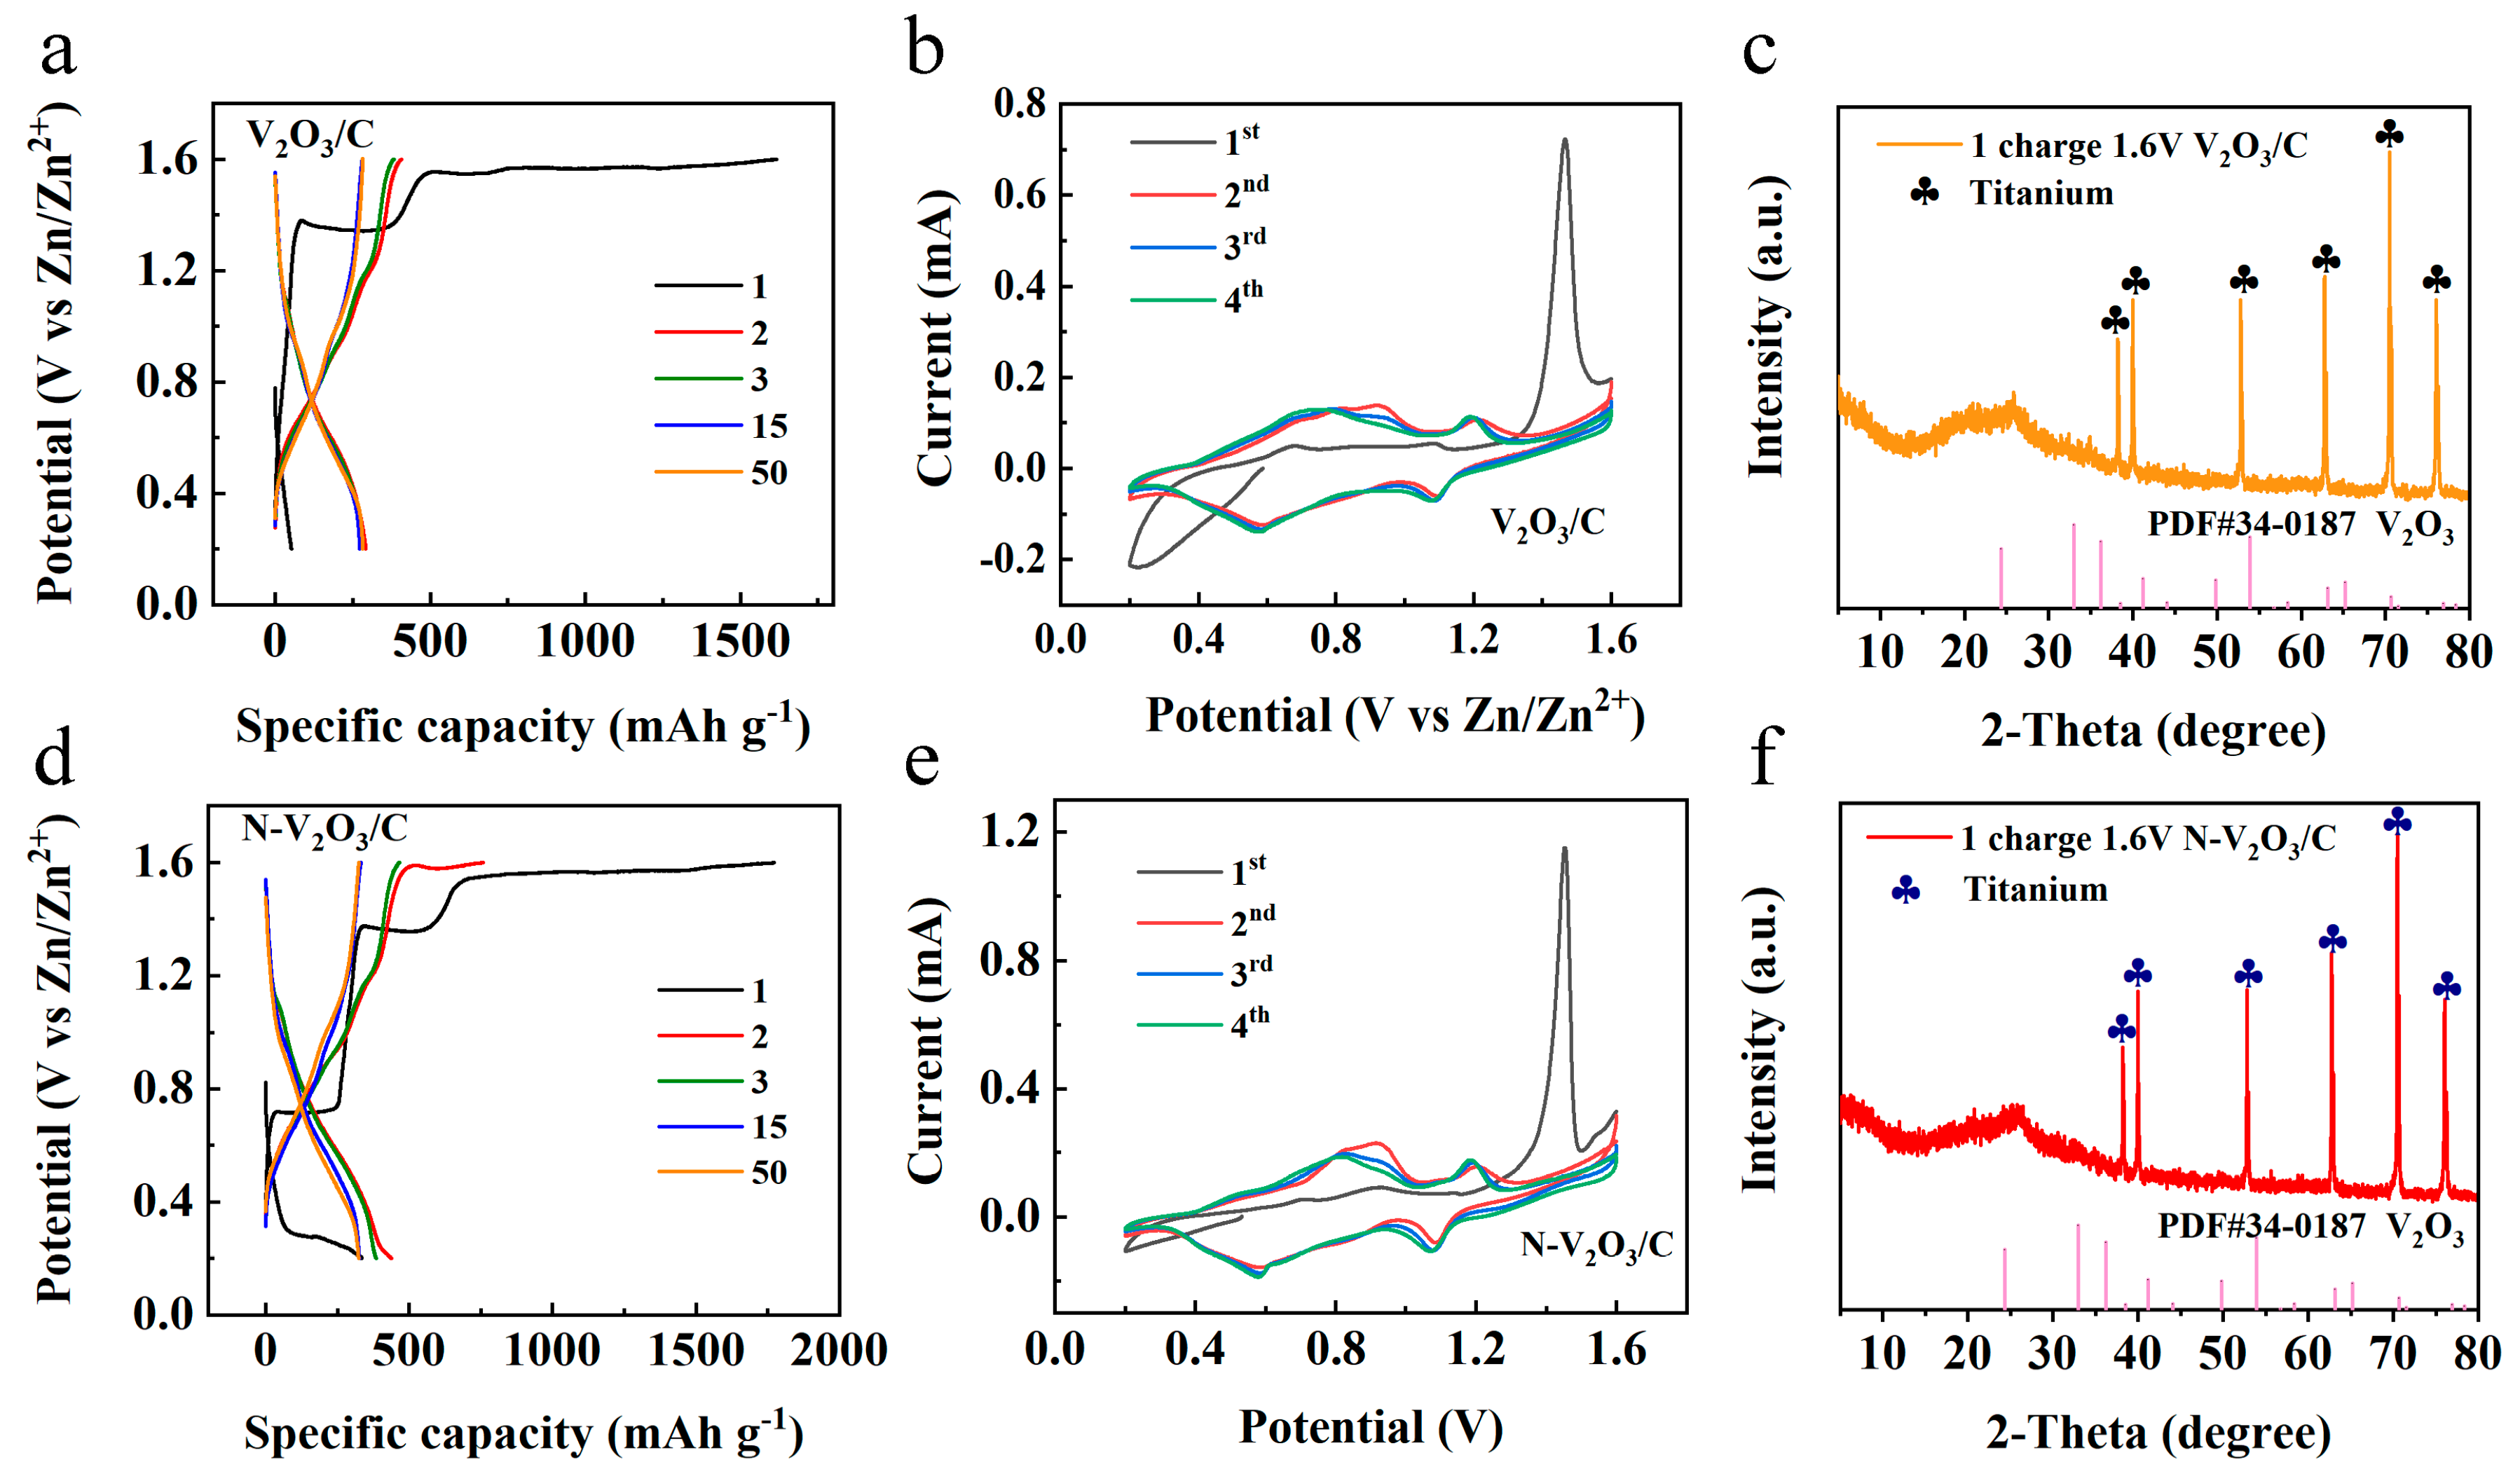
2 was employed as the electrolyte, with zinc foil serving as the anode and the synthesized products utilized as cathodes to fabricate button cells, aimed at evaluating their electrochemical performance. The initial tests involved constant current charge–discharge assessments, depicted in
Figure 3a,d. Notably, a distinct difference was observed in the electrochemical profiles between the initial and subsequent cycles of the two cells, indicating a pronounced overcharging phenomenon.
For the cell incorporating V2O3/C as the cathode material, an initial discharge capacity of 52 mAh g−1 was recorded, which significantly increased to a charging capacity of 1618 mAh g−1. In the cycles that followed, the capacity reached a relatively stable value of approximately 284.3 mAh g−1, with the observed voltage plateaus at 1.10/0.99 V and 0.62/0.87 V, respectively. Similarly, the cell featuring N-V2O3/C as the cathode exhibited an initial discharge capacity of 335.2 mAh g−1 and a charging capacity of 1773.1 mAh g−1. Subsequently, the capacity of this cell stabilized around 332.2 mAh g−1, with voltage plateaus at 1.18/1.01 V and 0.68/0.87 V, respectively.
Cyclic voltammetry (CV) analysis was conducted at a scan rate of 0.1 mV s
−1 for both cells, with the results presented in
Figure 3b,e. The analysis revealed a significant shift in the positions of oxidation and reduction peaks from the first cycle to subsequent cycles in both cells, indicative of irreversible phase transformations. Specifically, the initial cycle for V
2O
3/C was characterized by pronounced oxidation peaks at 0.68 and 1.52 V. In contrast, during the second cycle, these peaks were observed to migrate to 0.96/0.79 V and 1.22/1.09 V, respectively, with subsequent cycles demonstrating considerable overlap, implying the formation of a phase transition product with favorable reversibility. Similarly, the oxidation and reduction peak positions of N−V
2O
3/C closely matched those of V
2O
3/C, suggesting analogous reaction mechanisms. This alignment is corroborated by constant current charge and discharge profiles, which exhibited notable consistency across cycles, further confirming the reversibility of the phase transition product in a manner comparable to V
2O
3/C.
To gain comprehensive insights into the electrochemical changes occurring within the cells, XRD analyses were performed on the cathode materials post charging, as illustrated in
Figure 3c,f. The analyses demonstrated that following the initial charging process, the distinct characteristic peaks of both V
2O
3/C and N−V
2O
3/C were eradicated, indicating a transformation to an amorphous, non-crystalline state.
The post-cycling morphological transformations of V
2O
3/C and N−V
2O
3/C electrodes were meticulously examined via scanning electron microscopy (SEM). The analysis revealed that throughout the course of the electrochemical reactions, the V
2O
3/C electrodes underwent a morphological evolution from irregularly shaped nanoparticles to nanorods of diminished diameter (refer to
Figure 4a,b). In a contrasting manner, N−V
2O
3/C electrodes transitioned from well-defined nanospheres to nanosheets (illustrated in
Figure 4c,d). This alteration significantly enhanced their specific surface area, thereby optimizing them for improved Zn
2+ ion storage capabilities.
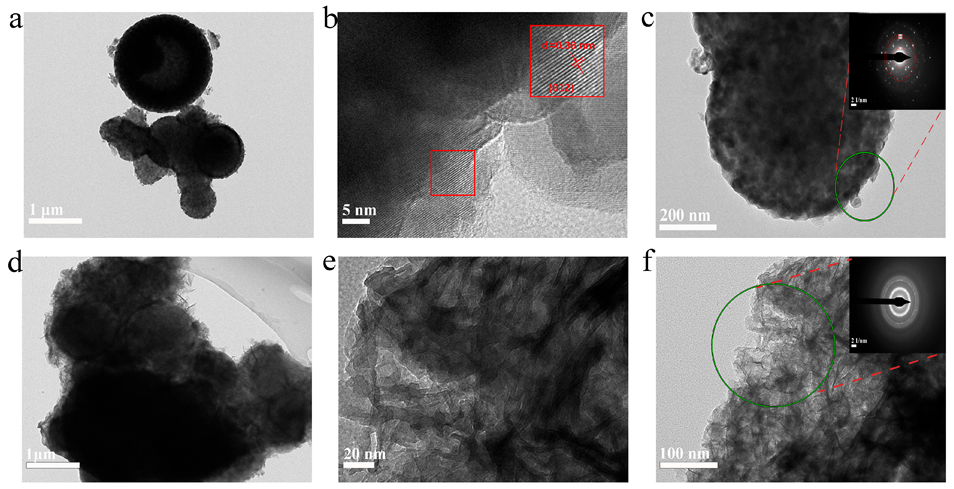
The morphological and microstructural evolutions of N-V
2O
3/C following its phase transition were meticulously characterized through high-resolution transmission electron microscopy (HRTEM). Prior to electrochemical cycling,
Figure 5a delineates the material’s initial structure as nanospheres encased by irregular entities, which were identified as amorphous carbon. The HRTEM imagery distinctly highlighted lattice fringes, elucidating that the introduction of nitrogen doping and carbon encapsulation preserved the crystalline integrity of V
2O
3.
This finding is in harmony with the crystallinity observations reported in the XRD analysis (refer to
Figure 1c). The selected area electron diffraction (SAED) pattern of N-V
2O
3/C, depicted in
Figure 5c, before cycling, exhibited luminous diffraction rings. These rings correspond to the (012), (024), and (018) crystallographic planes of V
2O
3, affirming the polycrystalline essence of the material. Post charging, the N−V
2O
3/C specimens transformed into more voluminous, albeit irregular and thinner structures, as illustrated in
Figure 5d,e. The SAED pattern after cycling, shown in
Figure 5f, revealed a diffuse halo devoid of sharp boundaries, a manifestation that aligns with the XRD findings post cycling. This unequivocally corroborates the electrochemical induction of a phase transition to an amorphous state after the initial cycle of charging and discharging.
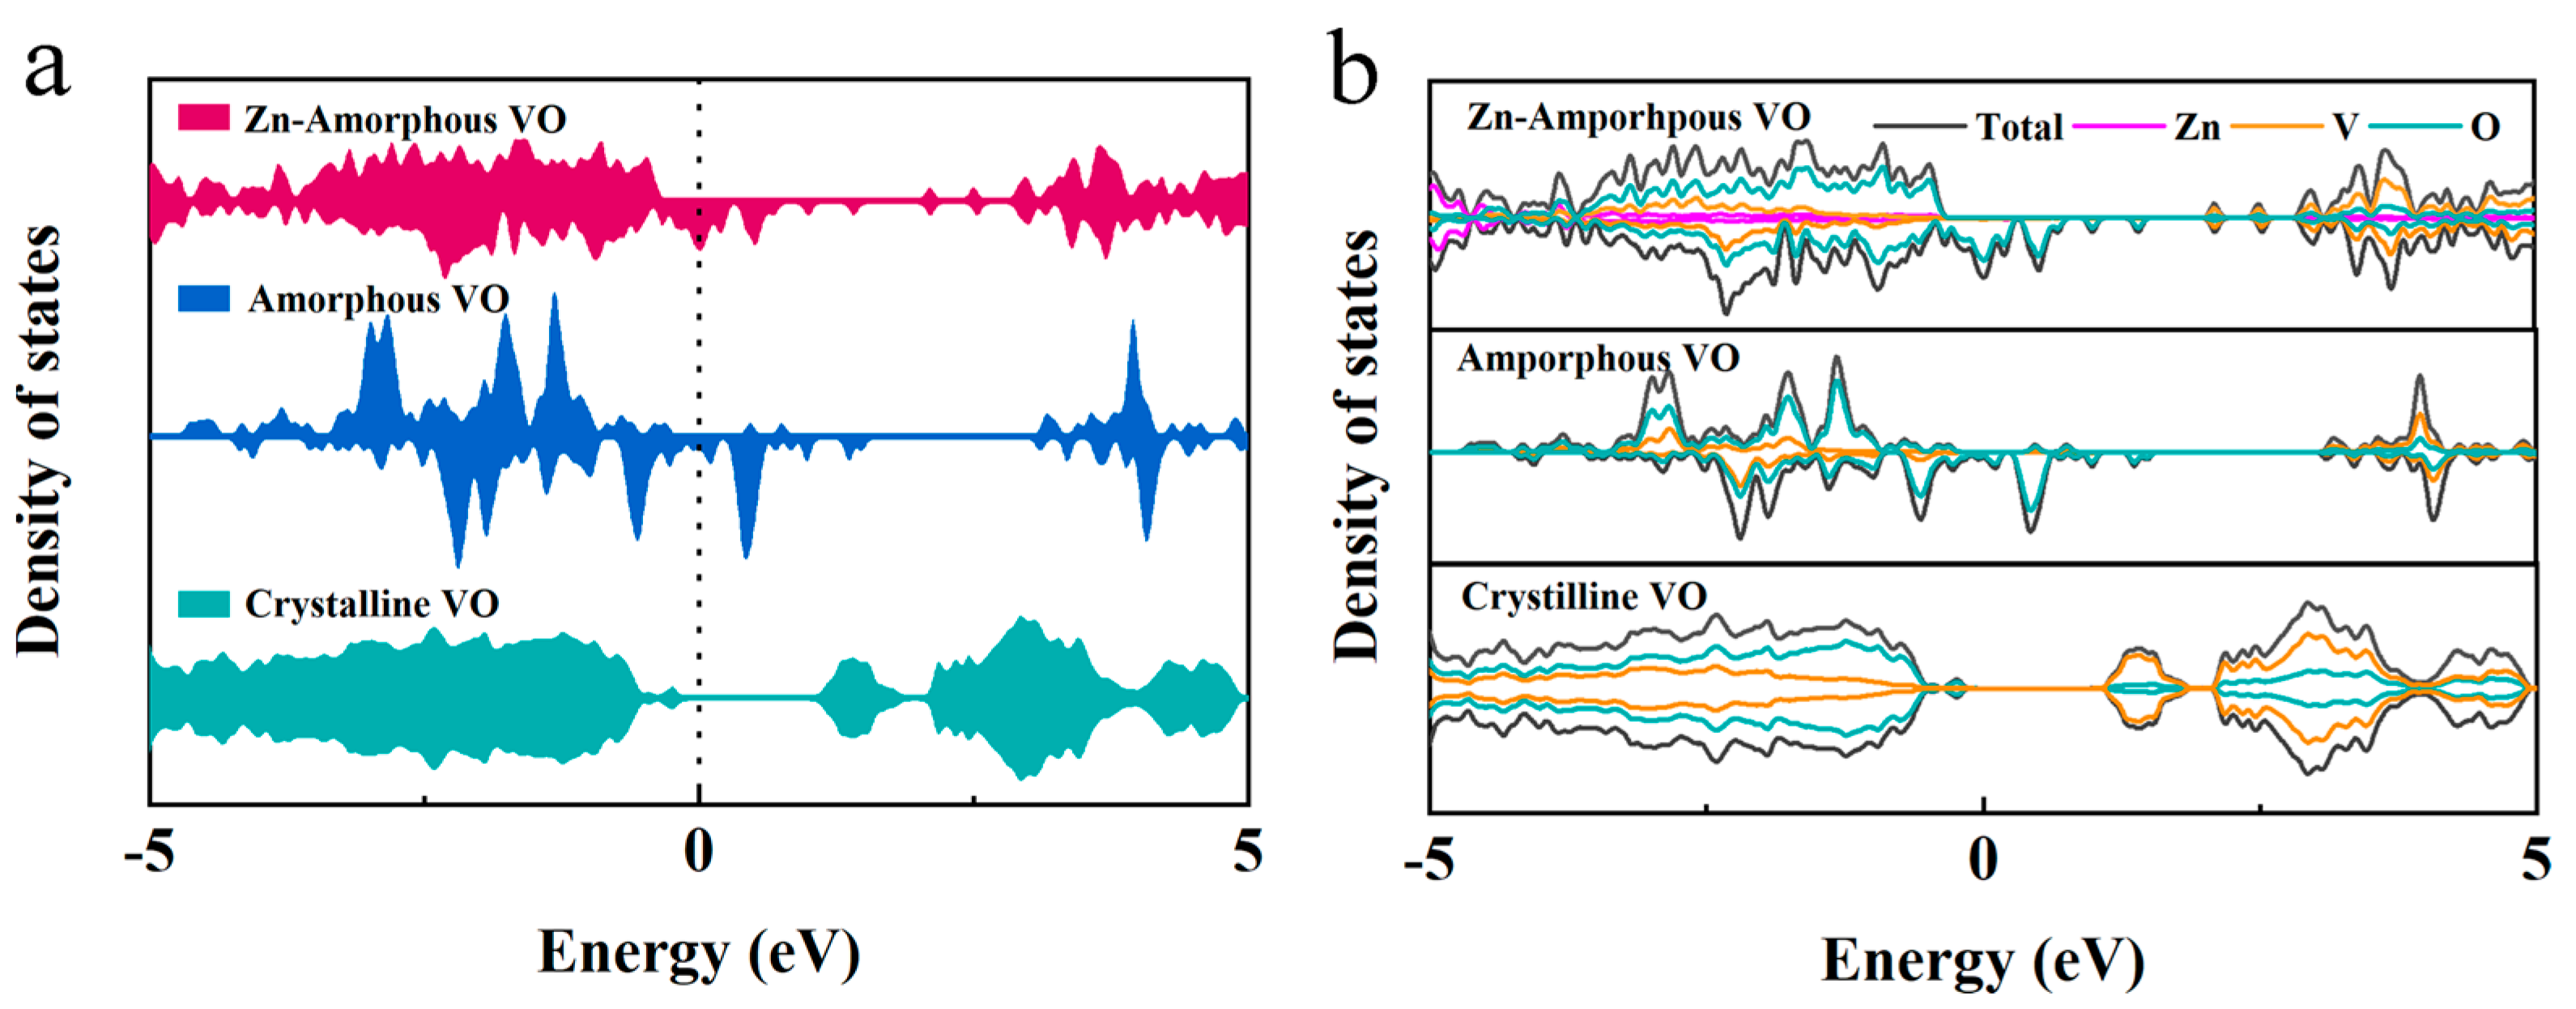
In an effort to further elucidate the transition from crystalline to amorphous structures in vanadium oxides, density functional theory (DFT) calculations were conducted on the amorphous vanadium oxide (amorphous VO) system, with Zn introduced as a dopant. The results, illustrated in
Figure 6a,b, showcase the density of states (DOS) and partial density of states (PDOS) for both the crystalline and amorphous VO structures, with a specific emphasis on the amorphous structure incorporating Zn.
The DFT findings indicate a significant peak at the Fermi level in the DOS of amorphous VO, primarily contributed by the 2p orbitals of oxygen. This feature highlights the metallic character of the system, which is associated with an enhanced electrical conductivity compared to its crystalline counterpart. The introduction of Zn into the amorphous VO structure further modifies the electronic environment. Specifically, Zn acts as an electron donor, transferring electrons predominantly to the oxygen’s 2p orbitals. This electron transfer intensifies the metallic characteristics of the amorphous VO, as reflected by the enhanced peak at the Fermi level and the subsequent increase in electrical conductivity.
The augmentation of the oxygen 2p orbital contribution in the presence of Zn not only supports the enhanced conductivity but also suggests a pivotal role for oxygen in the electrochemical performance of the system. This alteration in the electronic structure is crucial for understanding the phase transition’s impact on the material’s electrochemical properties. The transition to an amorphous structure, induced by electrochemical cycling and substantiated by these DFT calculations, appears to enhance the system’s electrochemical performance by fostering a more conducive electronic environment for charge transport.
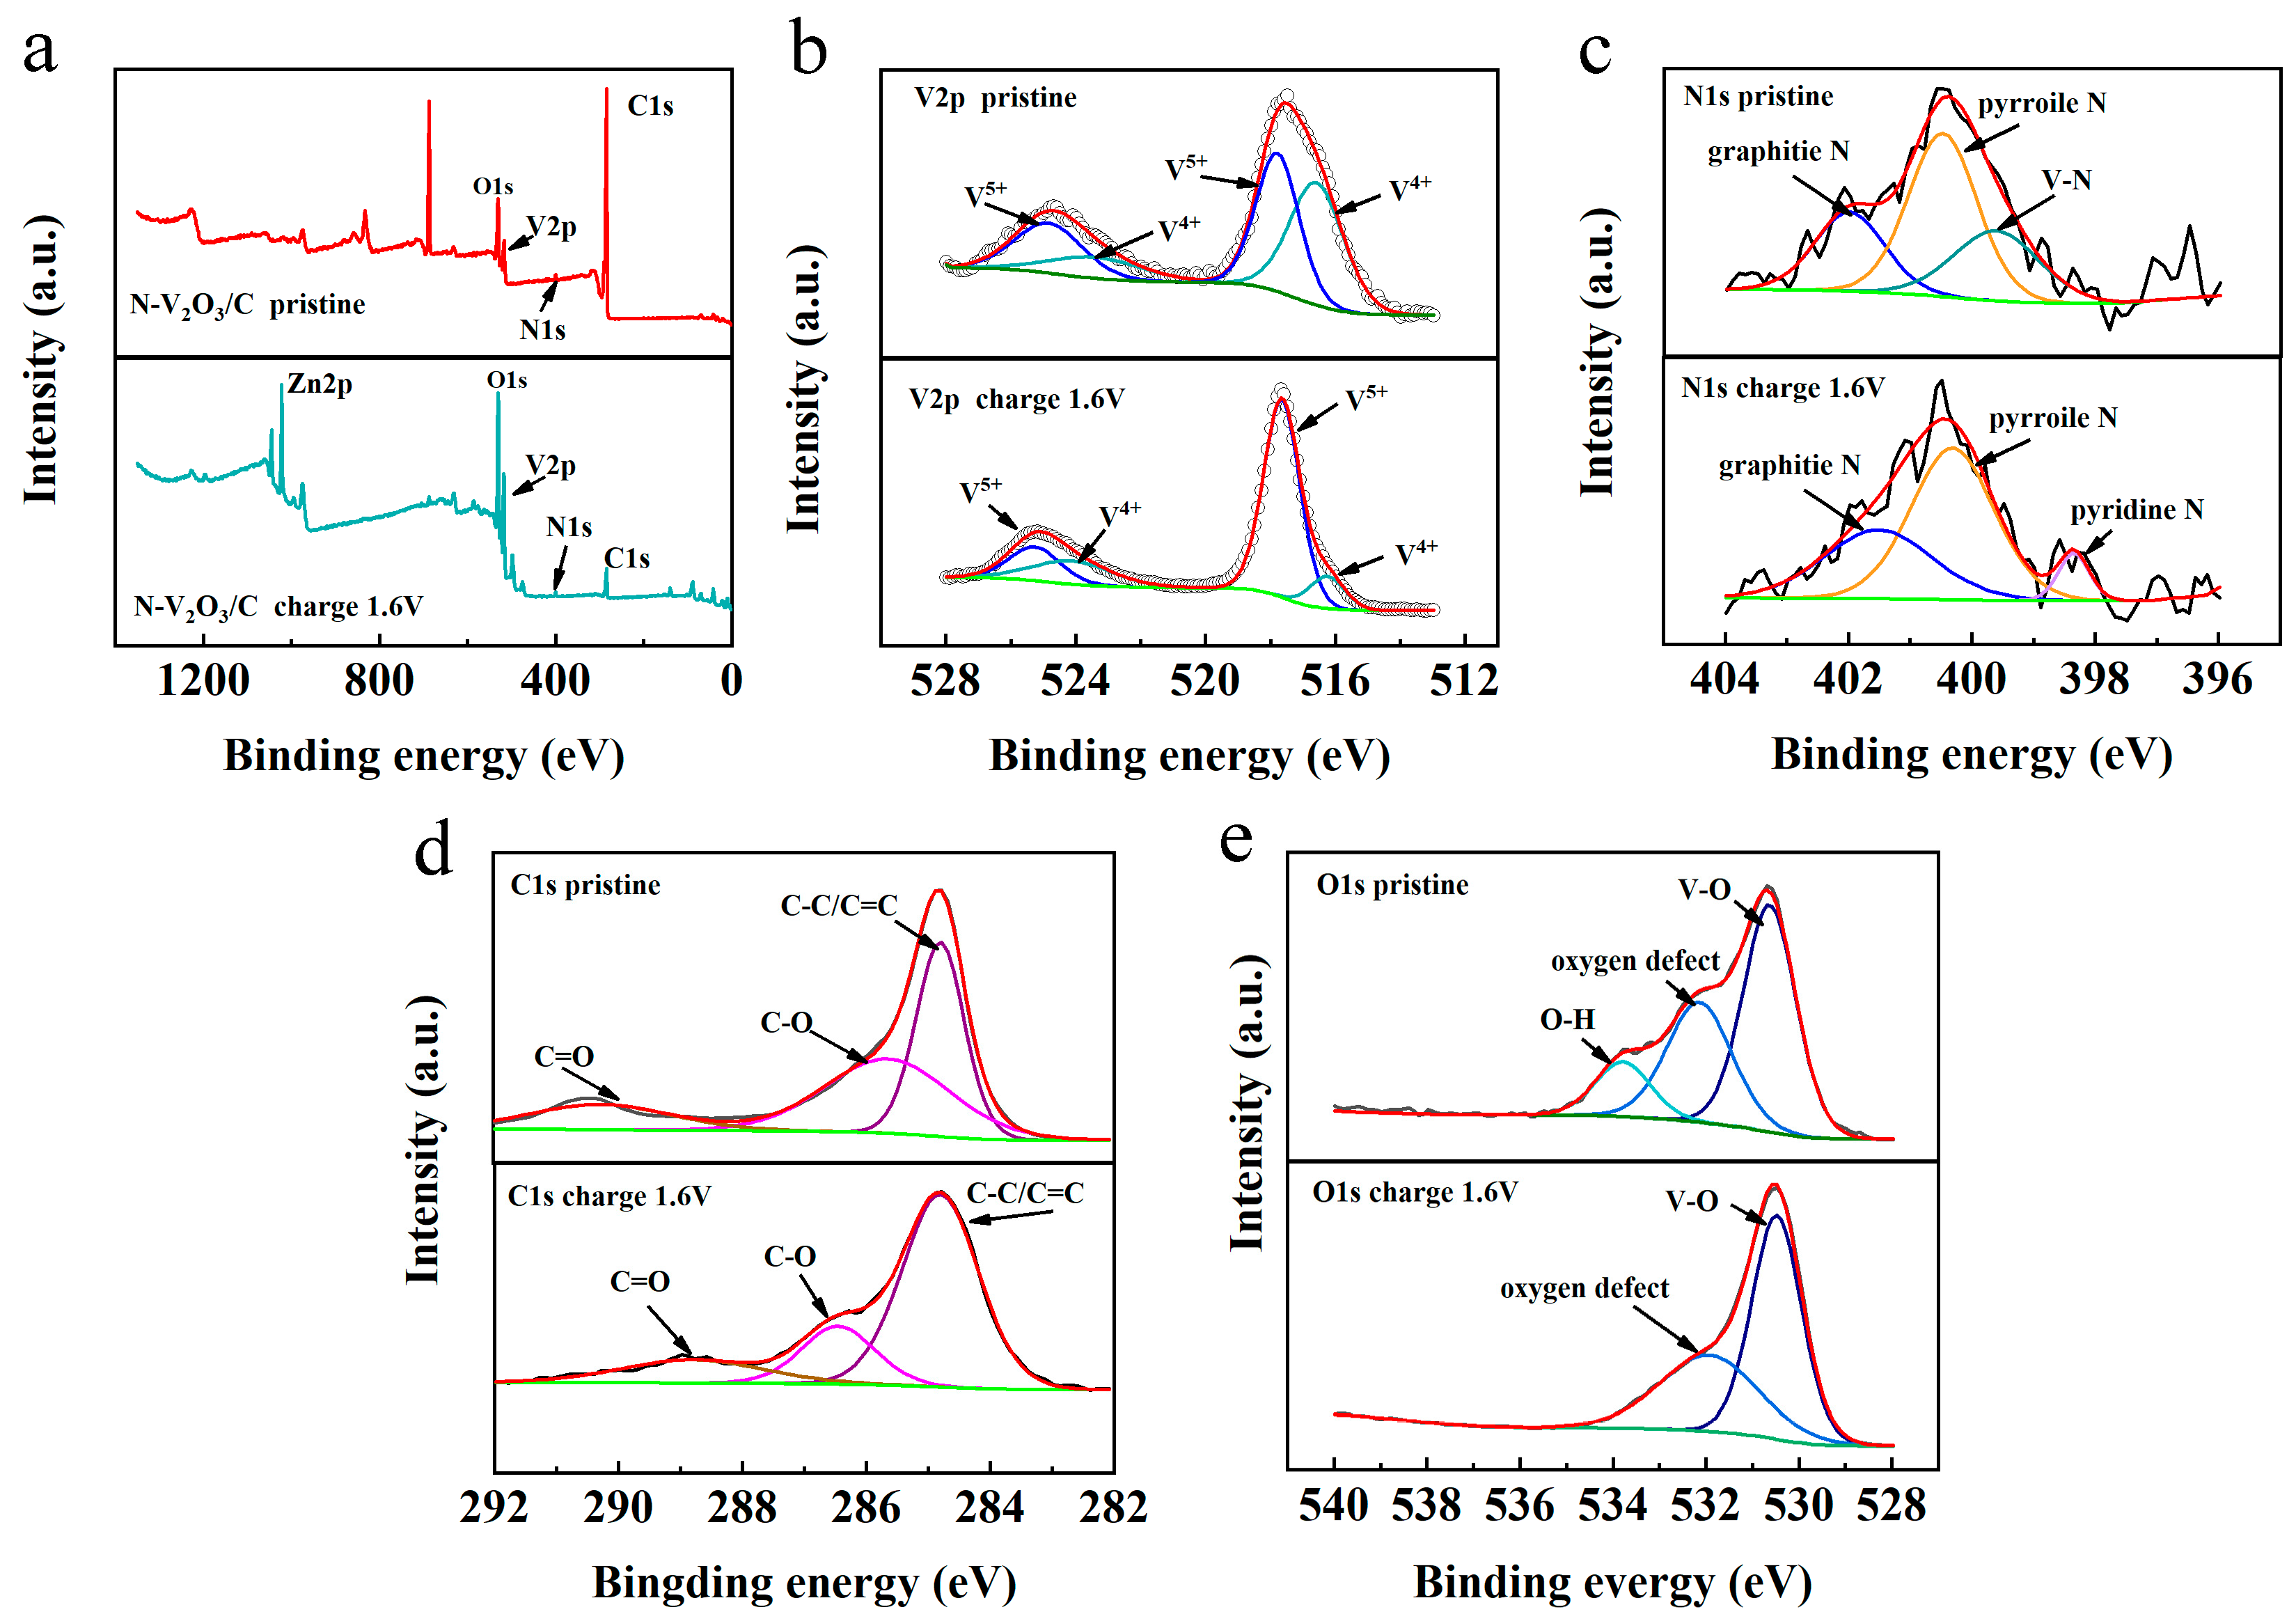
XPS was utilized to elucidate the chemical compositions and the states of elements within N−V
2O
3/C, both prior to and subsequent to the inaugural charging cycle, with the findings illustrated in
Figure 7. The survey spectrum, as presented in
Figure 7a, confirmed the presence of N, vanadium (V), oxygen (O), and carbon (C) in the pristine N−V
2O
3/C. Notably, post charging, the spectrum also revealed the presence of Zn. A detailed examination of the V 2p fine spectrum, depicted in
Figure 7b, revealed that the binding energies in the pristine sample were predominantly observed at 524.8/517.7 eV and 523.4/516.7 eV, indicative of the oxidation states V
4+ and V
5+, respectively. Following the charging process, the oxidation states of vanadium remained as V
4+ and V
5+. However, a discernible augmentation in the proportion of V
5+ was evident from the enhanced intensity and area of the respective peaks, setting a foundation for an escalated occurrence of redox reactions in the subsequent stages [
31].
The investigation into the N component within N−V
2O
3/C unveiled that the initial N binding energies were predominantly positioned at 399.6, 400.4, and 401.8 eV. These correspond to V−N bonds, pyrrolic N, and graphitic N, respectively, as illustrated in
Figure 7c. Post charging, the formation of pyridinic N was observed, with both pyrrolic and pyridinic N exhibiting more negative electronegativities. This characteristic is advantageous for enhancing the transport rate of Zn
2+ ions.
As depicted in
Figure 7d, the C 1s spectrum of the pristine N−V
2O
3/C reveals binding energies at 284.9 eV, 285.8 eV, and 290.7 eV, which correspond to C−C/C=C, C−O, and C=O bonds, respectively. These observations are indicative of a complex carbonaceous matrix within the composite, where both sp
2 and sp
3 hybridized carbon atoms coexist, facilitating a conducive environment for electron transport and structural stability. The presence of C−O and C=O functionalities suggests interactions between carbon and other components in the composite, which could play a pivotal role in the electrochemical performance of the material. Upon the completion of the charging cycle, a notable shift in the binding energies for C−O and C=O functionalities is observed, moving to 286.7 eV and 288.9 eV, respectively. This shift is attributed to the electrochemical interactions occurring during the charging process, leading to a reconfiguration of the electronic structure of carbon. These changes could enhance the electrochemical reactivity and facilitate the adsorption and desorption of ions, such as Zn
2+, on the surface of the N−V
2O
3/C, thereby improving the material’s performance in energy storage applications.
In addition, as illustrated in
Figure 7e, the O 1s spectrum from the initial N−V
2O
3/C sample exhibits binding energies at 530.6 eV, 532.7 eV, and 534.2 eV, corresponding to V−O, oxygen vacancies, and O−H, respectively. The presence of V−O signifies the strong interaction between vanadium and oxygen, crucial for the structural integrity and electrochemical activity of the oxide component. Oxygen vacancies, on the other hand, are known to enhance conductivity and promote redox reactions by serving as active sites. The O−H component suggests the presence of hydroxyl groups or absorbed water, which could influence ion transport and surface chemistry. Following the charging process, the O 1s spectrum undergoes significant changes; the peak associated with O−H disappears, while the peaks corresponding to V−O and oxygen vacancies remain. This indicates the dehydration or removal of hydroxyl groups on the surface, potentially leading to increased conductivity and a more favorable environment for the transport and intercalation of Zn
2+ ions. The preservation of oxygen vacancies further supports the material’s capacity for facilitating redox reactions, crucial for its electrochemical performance.
2.3. Electrochemical Performance
To investigate the post-phase transition electrochemical behavior of V
2O
3/C and N-doped V
2O
3/C, these materials were utilized as cathodes within AZIBs. Initially subjected to a current density of 0.2 A g
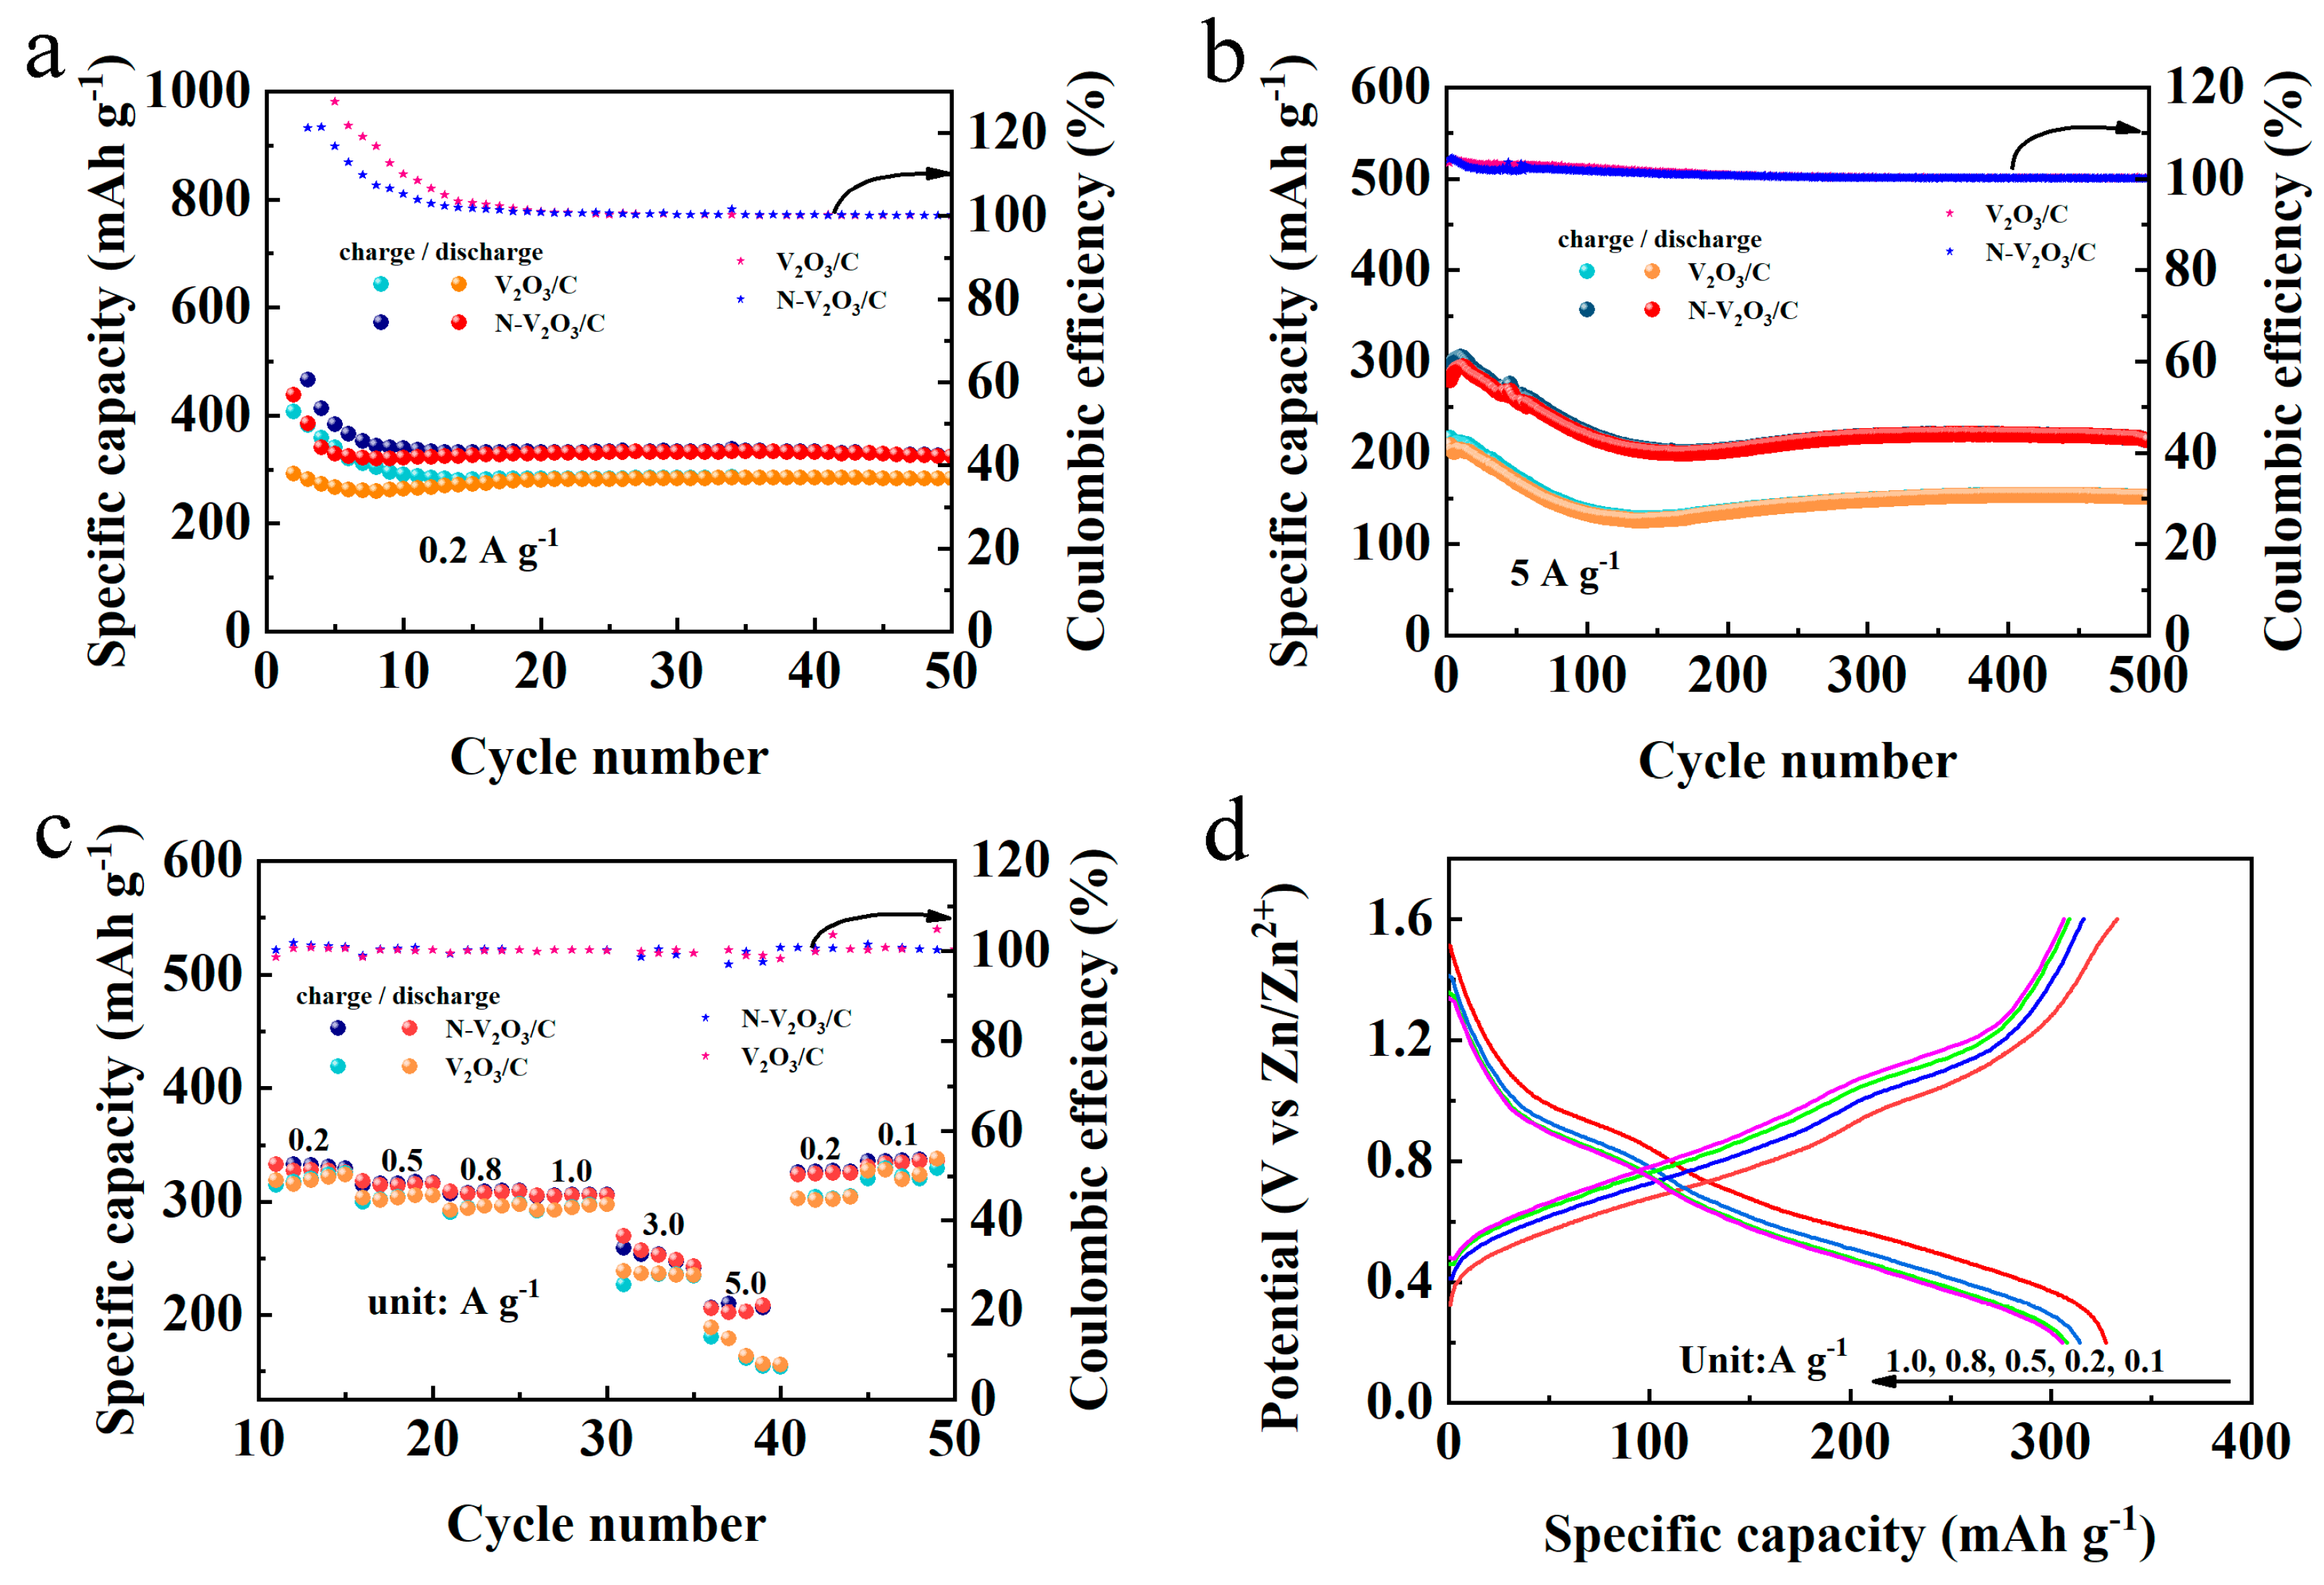
−1, the cycling performance depicted in
Figure 8a demonstrates that both V
2O
3/C and N−V
2O
3/C exhibited notably high specific capacities for both charging and discharging within the initial 10 cycles, alongside a coulombic efficiency surpassing 100%. This phenomenon is ascribed to the phase transition experienced by the cathode materials under subdued current densities, which precluded the attainment of a fully stable structural configuration, thereby leading to the misalignment of charge and discharge profiles. Beyond the preliminary 10 cycles, a commendable degree of stability was observed for both electrodes; V
2O
3/C recorded a capacity of 284.6 mAh g
−1, whereas N−V
2O
3/C demonstrated a superior capacity of 331.1 mAh g
−1. Subsequent to the initial evaluation, cycling performance at an escalated current density of 5 A g
−1 was assessed, as illustrated in
Figure 8b. Mirroring the low-current density findings, an activation process for the electrodes was discernible. Following an extended cycling duration of approximately 150 cycles, a stabilization in the capacities was noted, with V
2O
3/C attaining a capacity of 242.6 mAh g
−1 and N−V
2O
3/C achieving a capacity of 264.1 mAh g
−1, each maintaining a coulombic efficiency of 100%.
The rate performance of V
2O
3/C and N−V
2O
3/C following the stabilization of the phase transition was systematically evaluated across a spectrum of current densities, namely 0.2, 0.5, 0.8, 1.0, 3.0, and 5.0 A g
−1, as illustrated in
Figure 8c. The initial observations reveal that, at lower current densities, the specific capacities of both materials exhibit considerable similarity. However, with an increment in current density, N−V
2O
3/C not only manifests enhanced specific capacities but also displays augmented stability, underscoring its remarkable resilience against high current demands. This finding aligns with the patterns discerned during the cycling performance assessments, where the augmented electrochemical robustness of N−V
2O
3/C was evident. Remarkably, upon the diminution of current densities, both V
2O
3/C and N−V
2O
3/C succeeded in reinstating their original specific capacities, thereby demonstrating their exceptional rate capabilities.
Further,
Figure 8d delineates the constant current charge–discharge profiles for both electrodes across varying current densities, mirroring the observed rate performances. A noteworthy aspect of these profiles is the presence of two pronounced and analogous charge–discharge plateaus, pinpointed at 0.97/1.07 V and 1.02/1.22 V, respectively. These plateaus are in harmony with the oxidation and reduction peak positions previously identified in the CV analysis of N−V
2O
3/C.
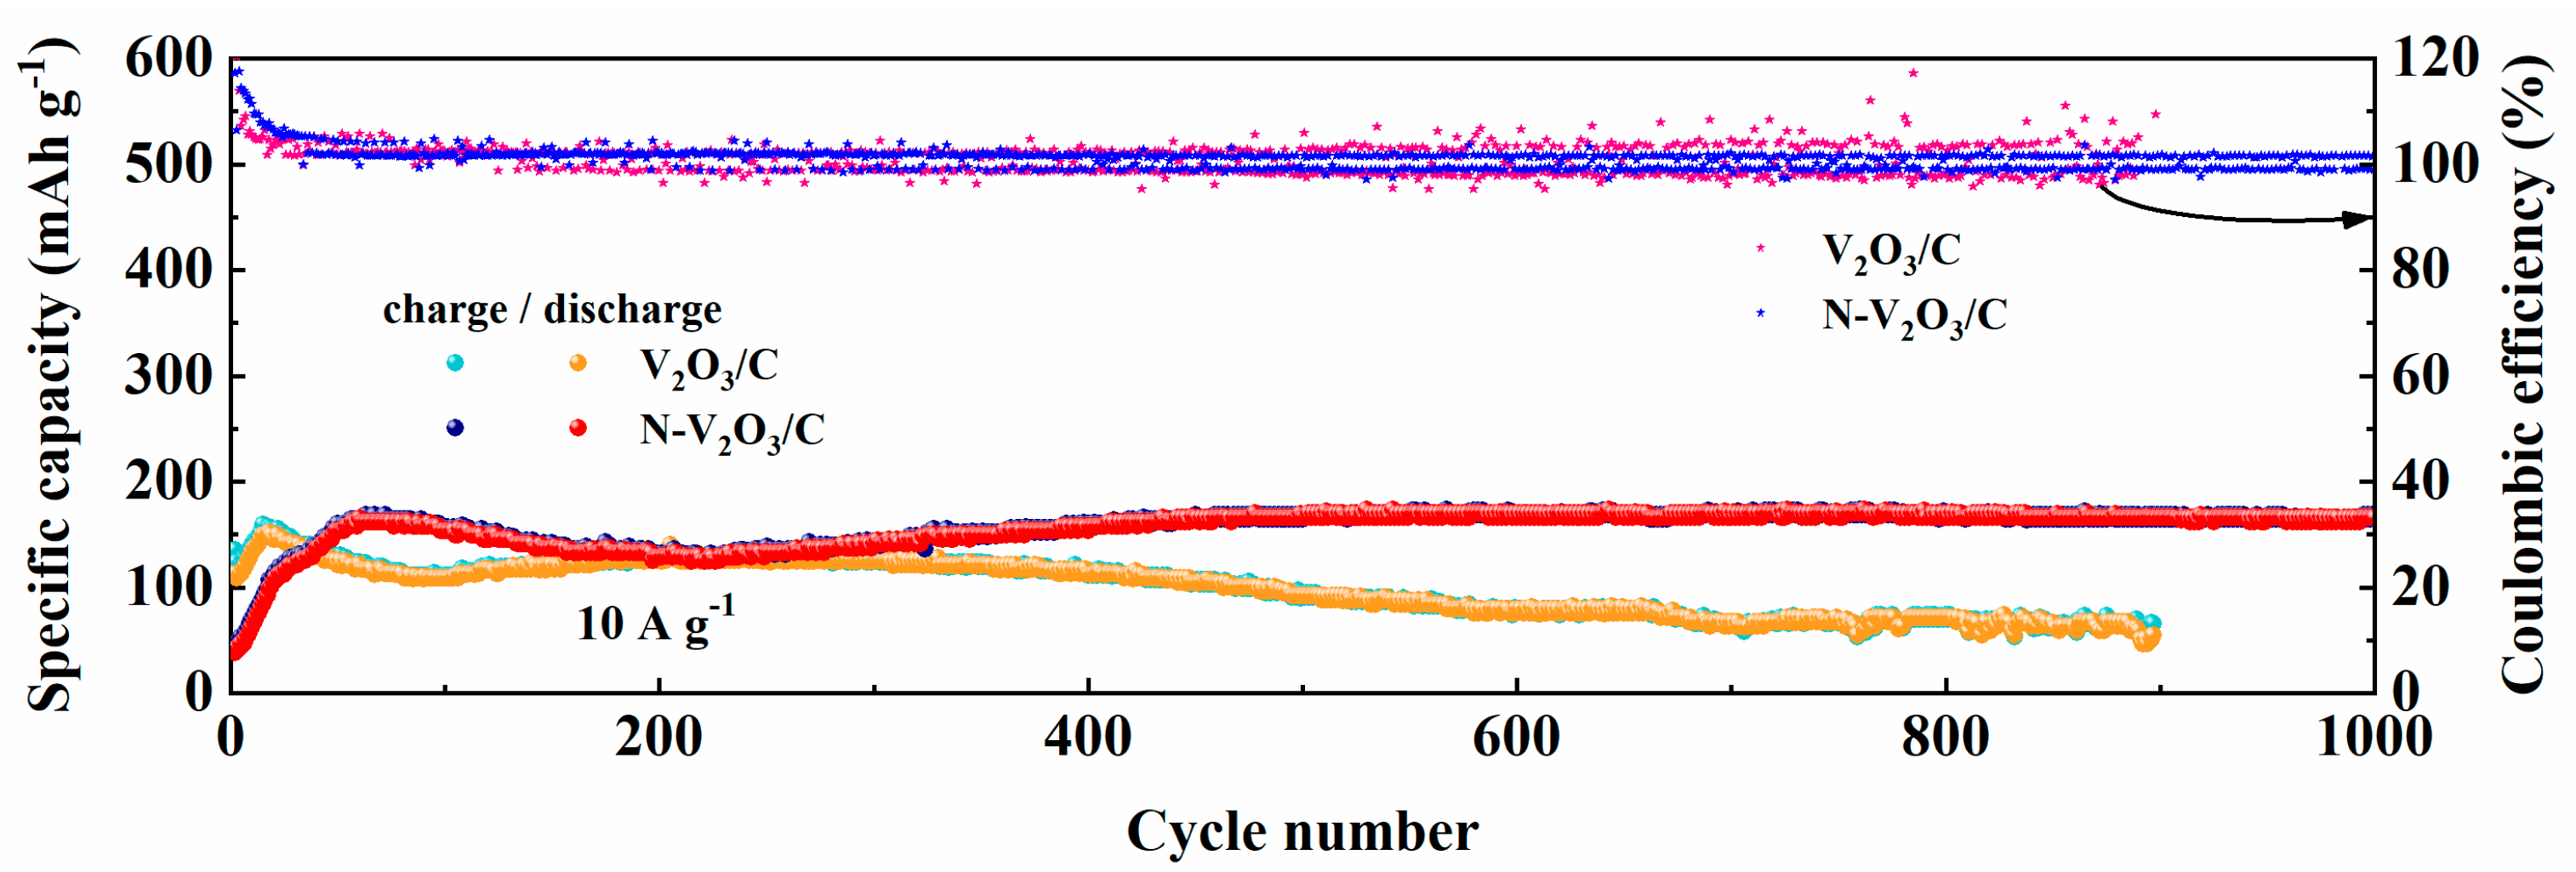
Figure 9 delineates the enduring cycling performance of both V
2O
3/C and N−V
2O
3/C under a substantial current load of 10 A g
−1. In the initial cycles, V
2O
3/C demonstrated an initial specific capacity of 110.3 mAh g
−1 in contrast to N−V
2O
3/C, which registered a notably lower capacity of 40.6 mAh g
−1. However, an upward trajectory in the capacities of both materials was observed thereafter, a phenomenon attributed to the progressive activation of the electrodes. Upon reaching full activation, the specific capacities were recorded at 151.6 mAh g
−1 for V
2O
3/C and an elevated 168.4 mAh g
−1 for N−V
2O
3/C. Post 900 cycles, V
2O
3/C’s capacity was reduced to 56.2 mAh g
−1, correlating to a capacity retention rate of 37%. Contrastingly, N−V
2O
3/C showcased remarkable endurance, maintaining a capacity of 160.5 mAh g
−1 even after 1000 cycles, which translates to an impressive retention rate of 95%. These findings underscore the substantial enhancement in capacity retention and cycling stability conferred by nitrogen doping.
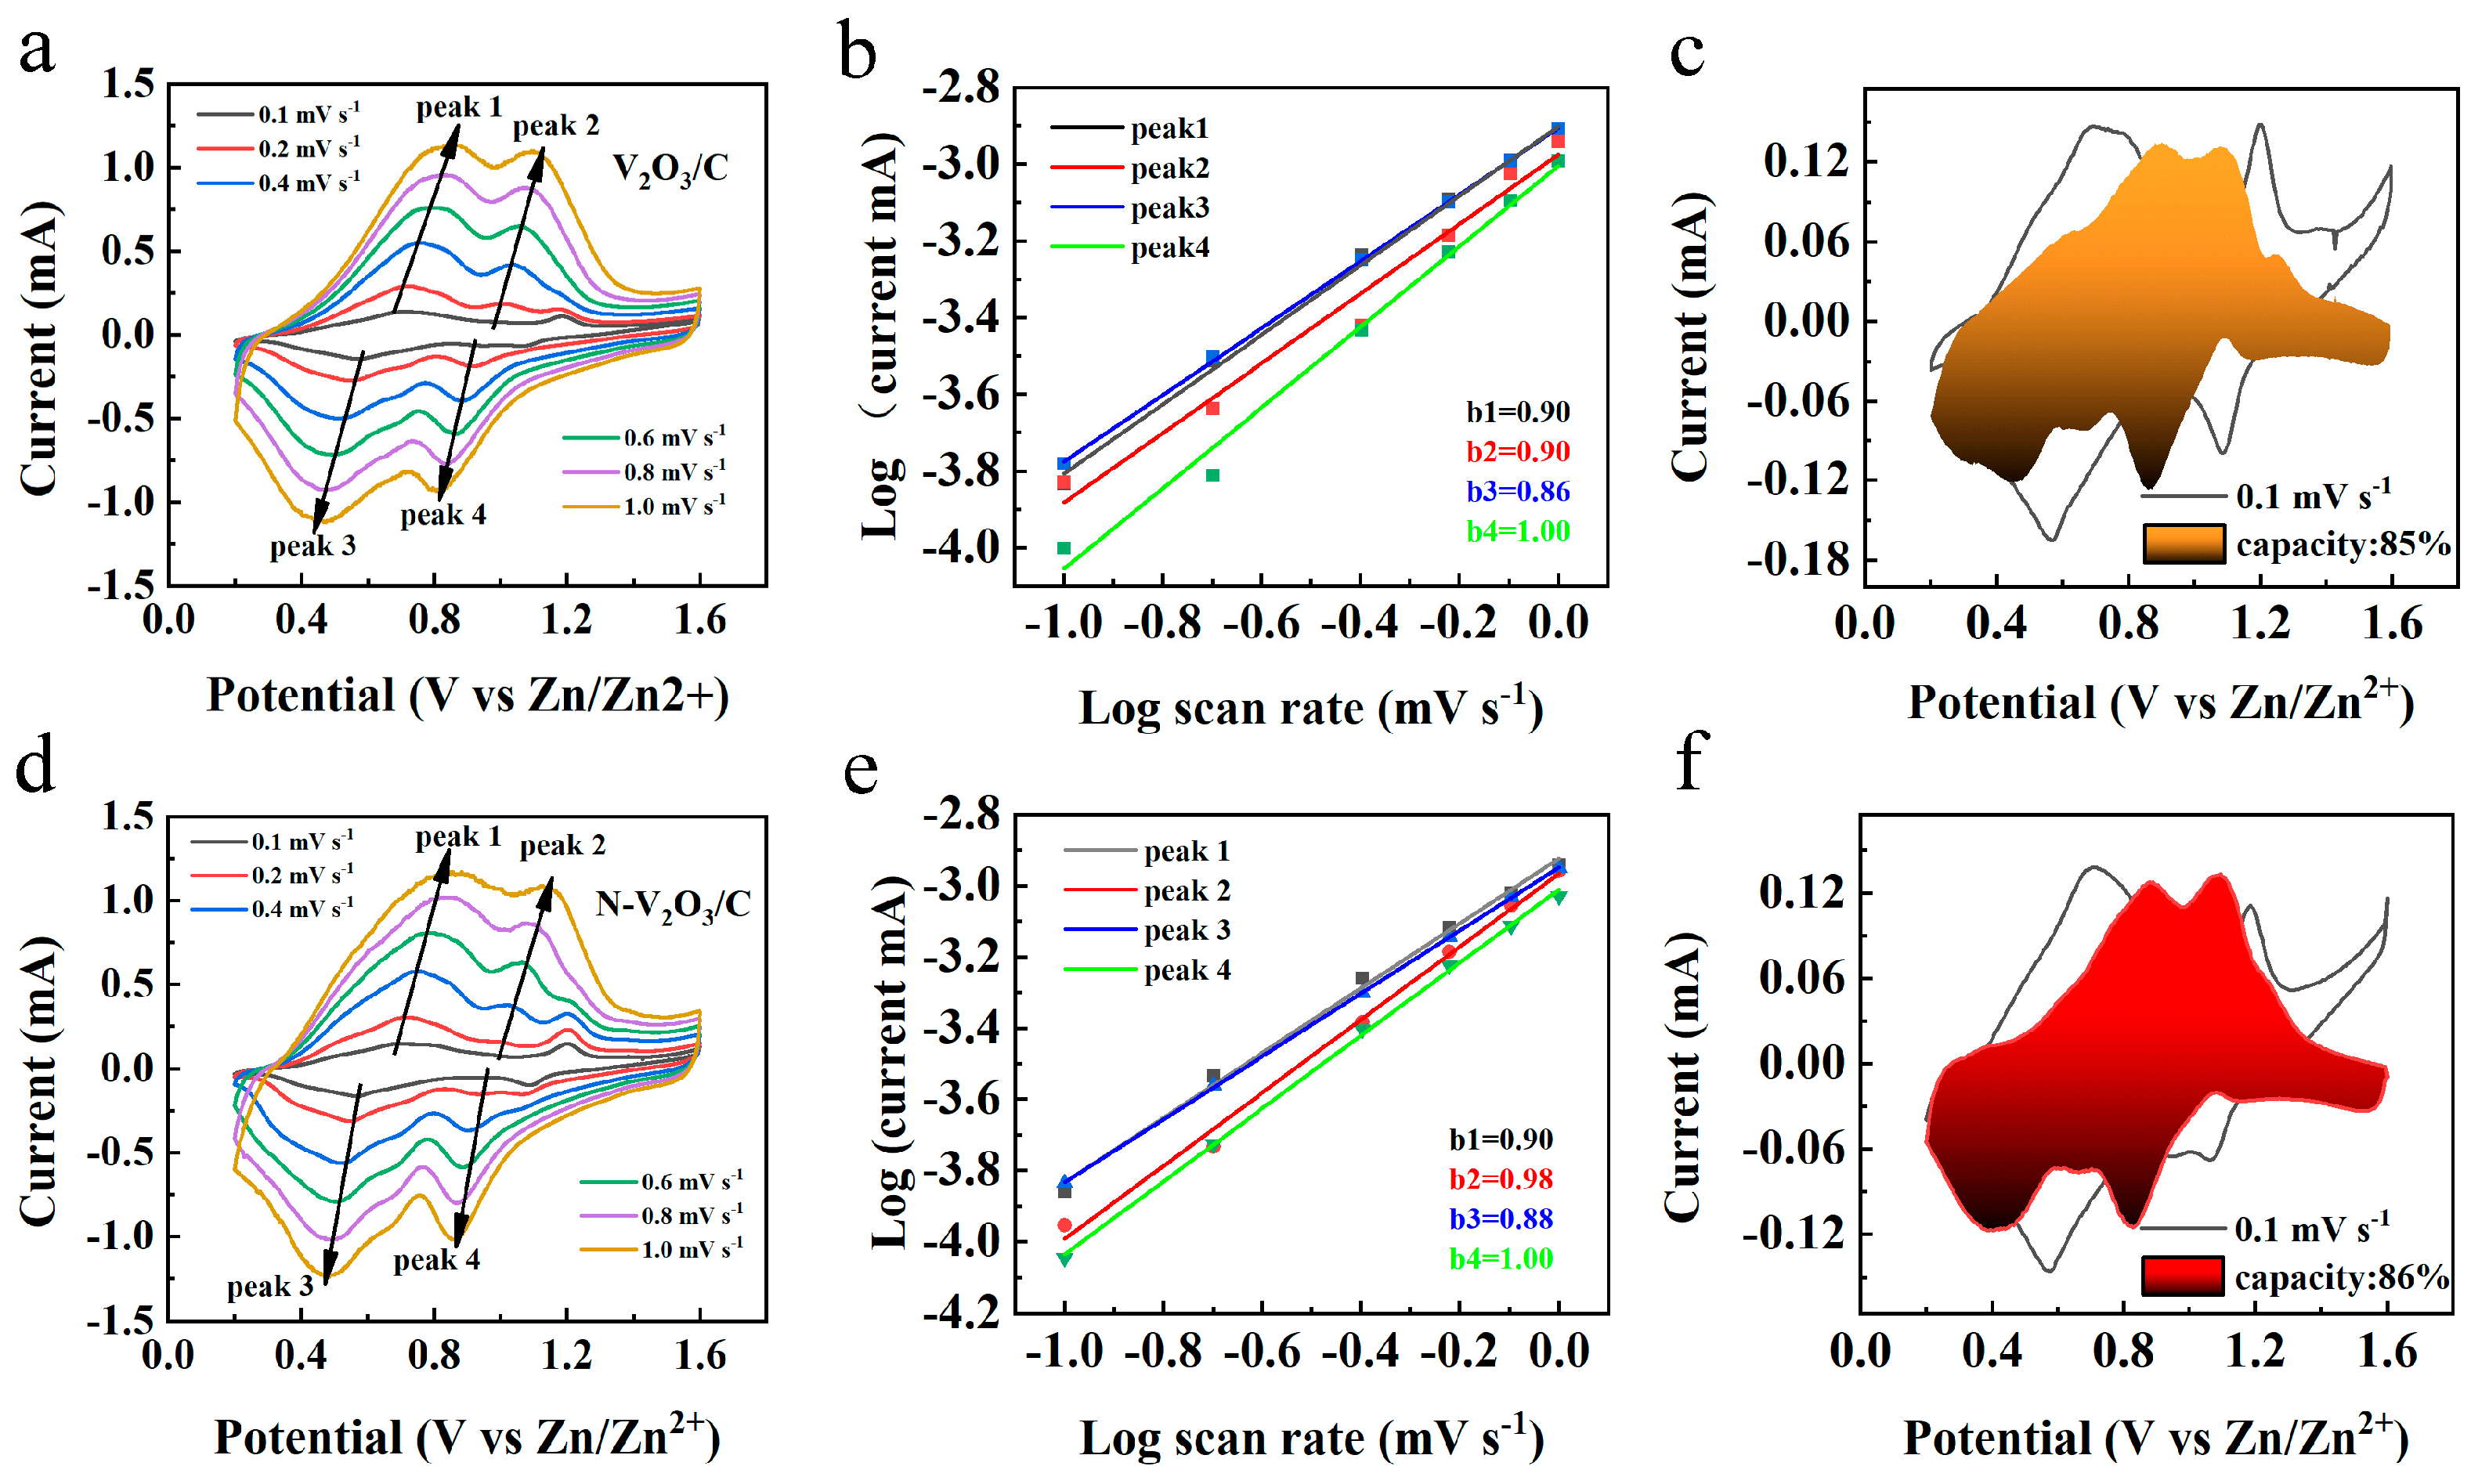
To elucidate the kinetic mechanisms underlying the electrochemical behavior of V
2O
3/C and N−V
2O
3/C, CV analyses were conducted across a spectrum of scan rates (0.1, 0.2, 0.4, 0.6, 0.8, and 1.0 mV s
−1), with the results depicted in
Figure 10a,d. The observations revealed analogous oxidation and reduction peaks for both materials, suggesting the occurrence of comparable electrochemical reactions. Notably, an escalation in scan rate led to a polarization-induced shift of these peaks to higher and lower potentials for oxidation and reduction processes, respectively. The empirical relationship between the peak current (
i) and the scan rate (
v) is formalized as follows:
Within these formulations, parameters
a and
b are indicative of the system’s electrochemical dynamics, with b serving as a determinant of the dominant control mechanism—diffusion or pseudocapacitance. Specifically, a
b value nearing 1.0 is indicative of pseudocapacitive control, whereas a value approaching 0.5 signifies diffusion dominance. Intermediate
b values suggest a mixed control mechanism. The linear regression analyses of log(
i) versus log(
v) for both V
2O
3/C and N−V
2O
3/C, presented in
Figure 10b,e, respectively, yielded
b values predominantly within the range of 0.5 to 1.0, implying a significant influence from both diffusion and pseudocapacitance on the electrochemical reactions. Crucially, a
b value of 1.0 for both materials underscores the substantial role of pseudocapacitive behavior in certain electrode processes, contributing to their enhanced rate capabilities. Additionally, CV profiles at a scan rate of 0.1 mV s
−1 are showcased in
Figure 10c,f, alongside the deduced pseudocapacitive contributions of 85% for V
2O
3/C and 86% for N−V
2O
3/C.
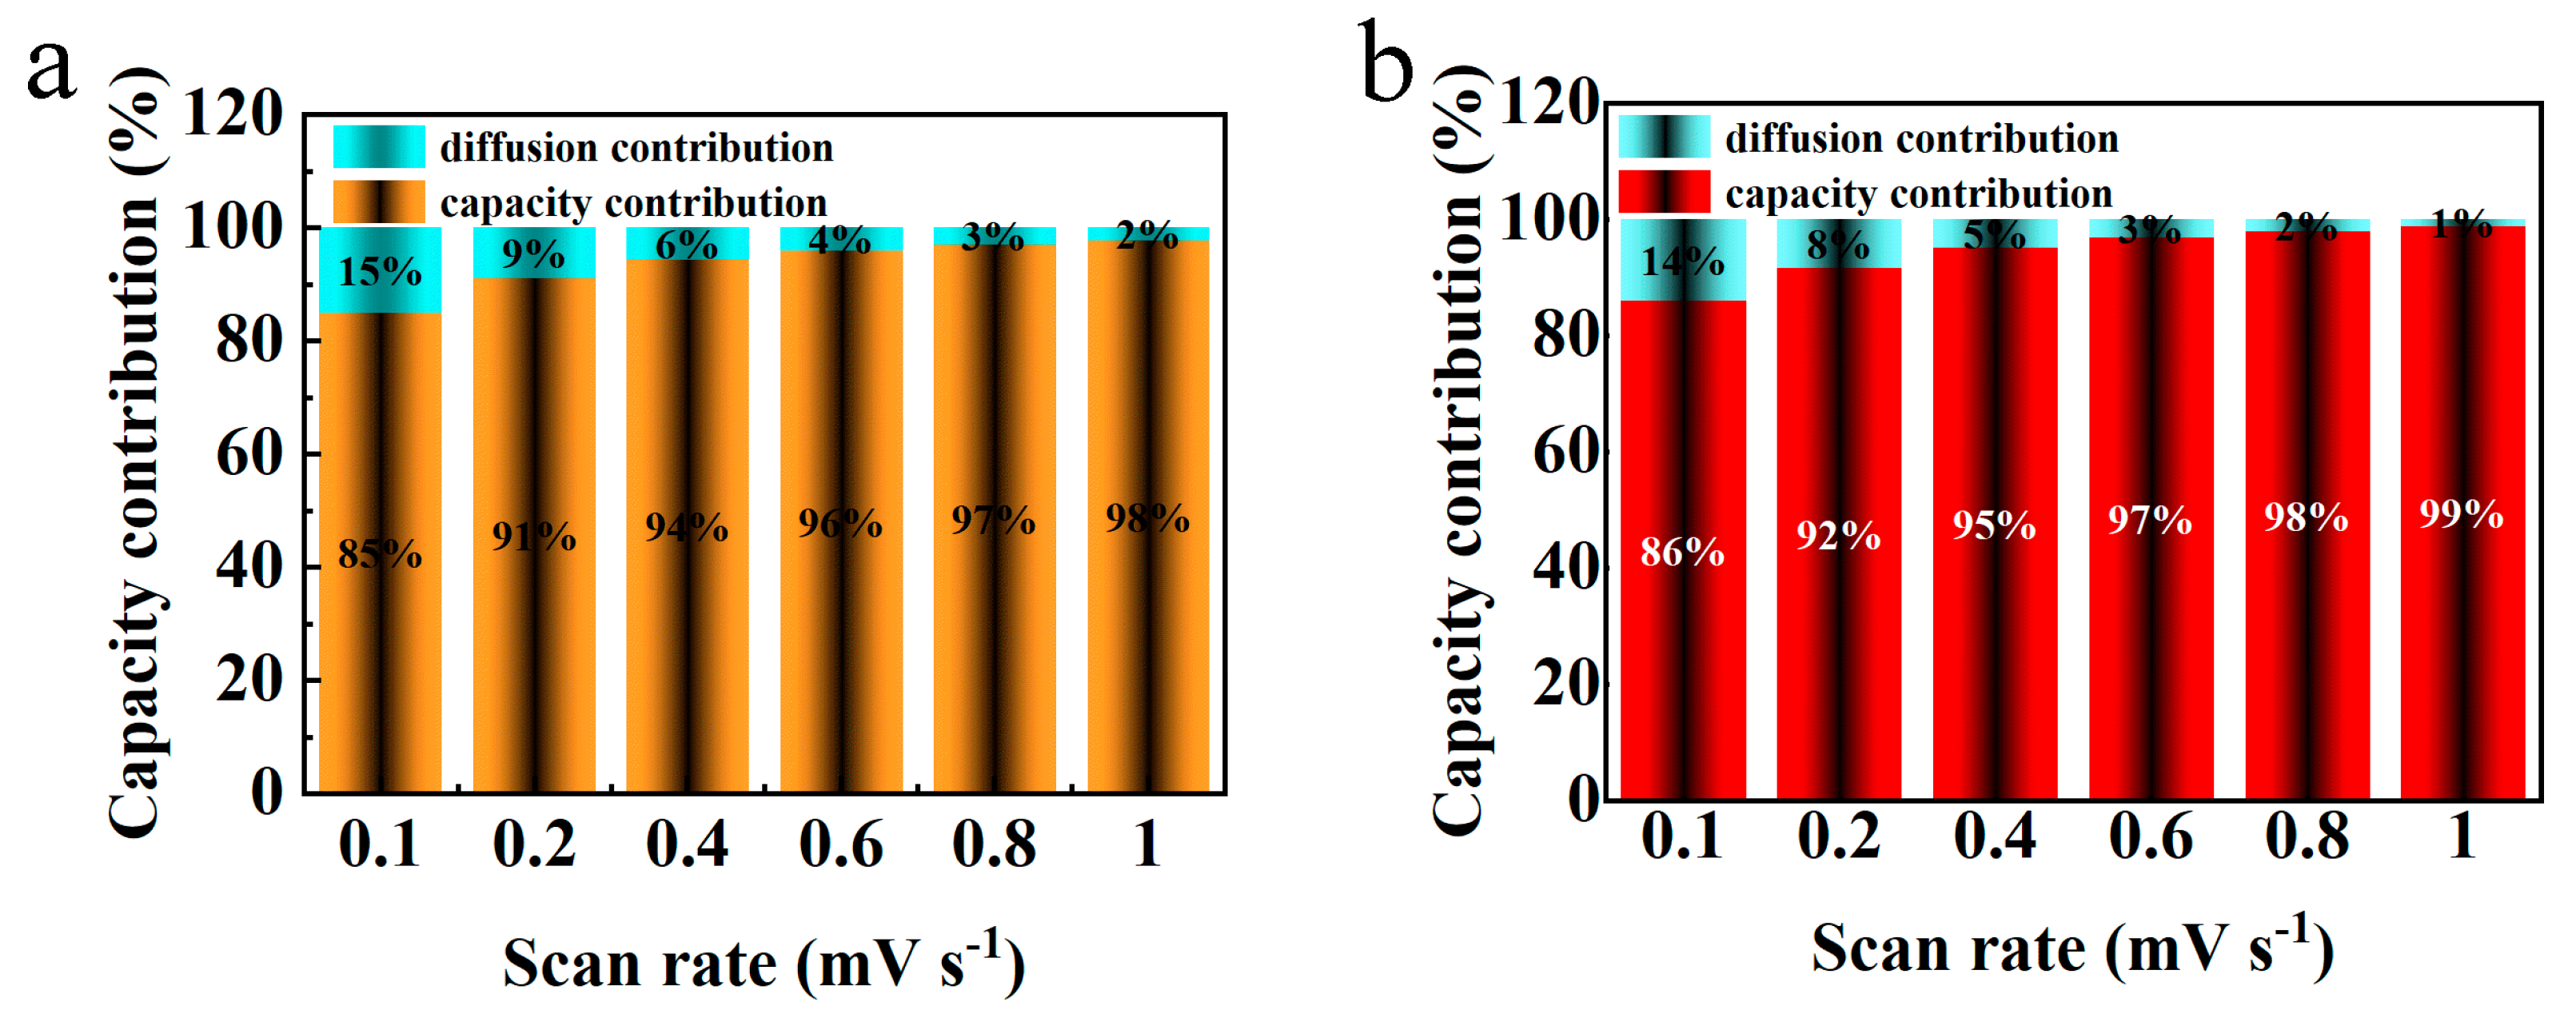
Figure 11 illustrates the variation in pseudocapacitive contribution rates for the electrode materials V
2O
3/C and N−V
2O
3/C across a spectrum of scan rates. The pseudocapacitive contributions for V
2O
3/C are recorded at 85%, 91%, 94%, 96%, 97%, and 98% for increasing scan rates, respectively. Conversely, the corresponding values for N−V
2O
3/C are slightly higher, being 86%, 92%, 95%, 97%, 98%, and 99%, respectively. This upward trend in pseudocapacitance with escalating scan rates signifies a shift towards more capacitive-dominated electrochemical reactions for both materials, a trait that enhances cyclic durability especially under conditions of high current. Remarkably, the consistently higher pseudocapacitive contributions observed for N−V
2O
3/C as compared to V
2O
3/C underscore superior electrochemical kinetics. This distinction not only underpins an improved diffusion rate for Zn
2+ ions but also aligns with the observed enhancements in the cyclic and rate performances of the materials.
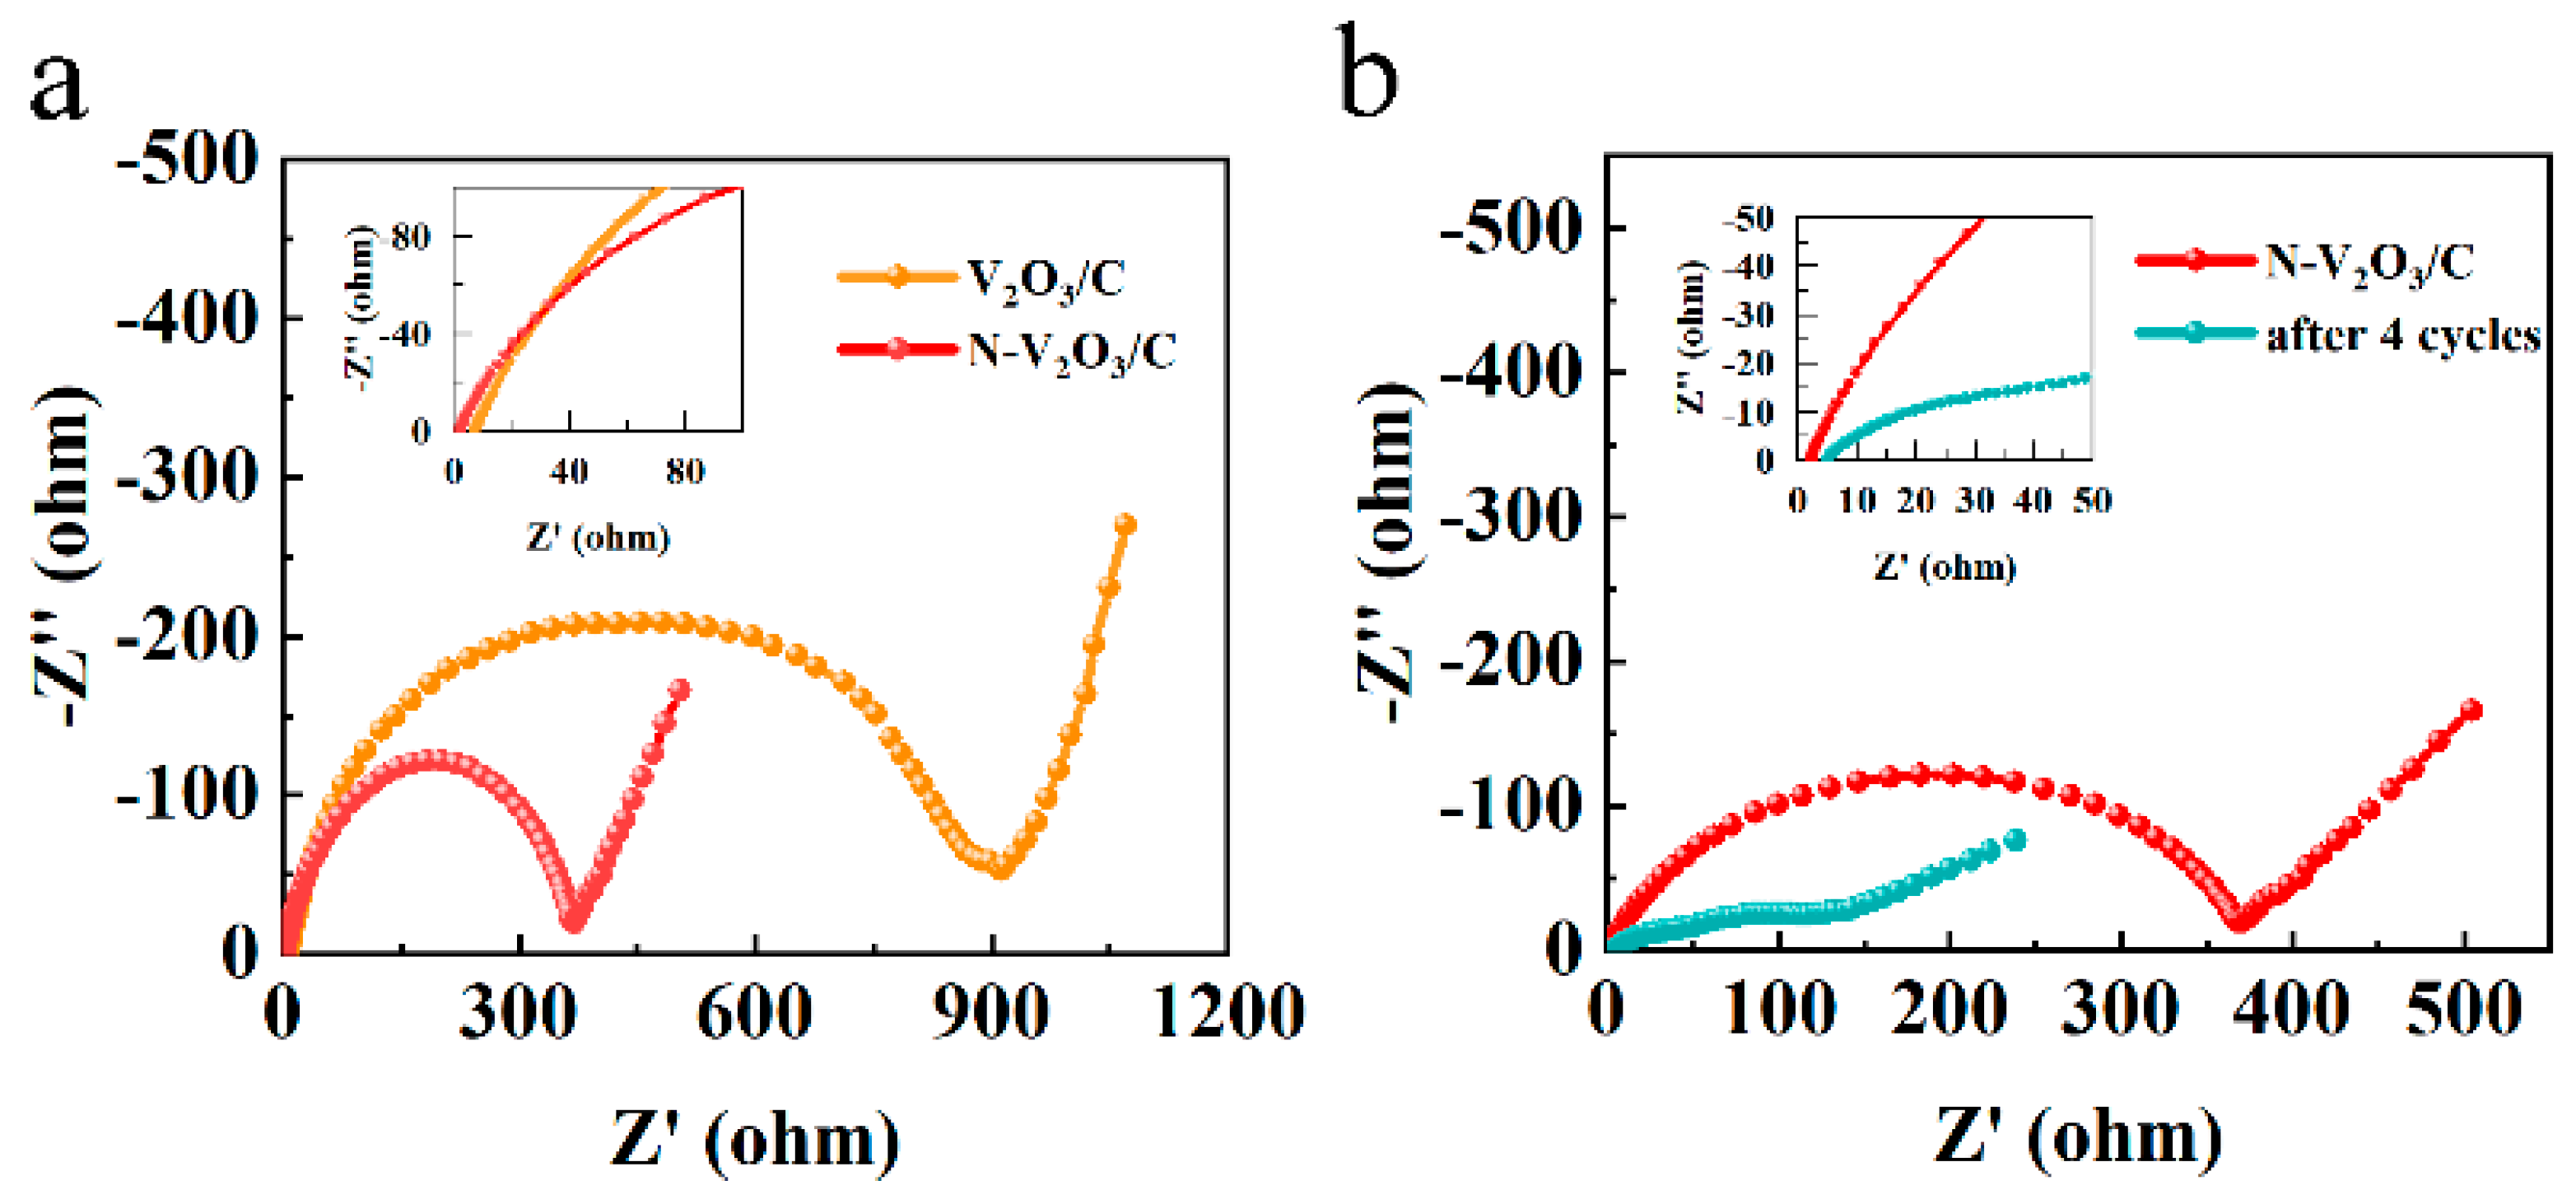
Electrochemical impedance spectroscopy (EIS) analyses were executed employing an electrochemical workstation, with the outcomes illustrated in
Figure 12a. These outcomes revealed a semicircle in the high-frequency range, indicative of charge transfer resistance, and a linear slope in the low-frequency range, indicative of ion diffusion processes. Importantly, the N−V
2O
3/C exhibited a markedly reduced charge transfer resistance in comparison to V
2O
3/C, which aligned with their respective electrochemical performances. Upon conducting four cycles, a notable reduction was observed in both charge transfer resistance and ion diffusion for N−V
2O
3/C, as demonstrated in
Figure 12b, thereby augmenting its electronic conductivity. This enhancement substantiates the observed initial capacity increment throughout the cycling process.
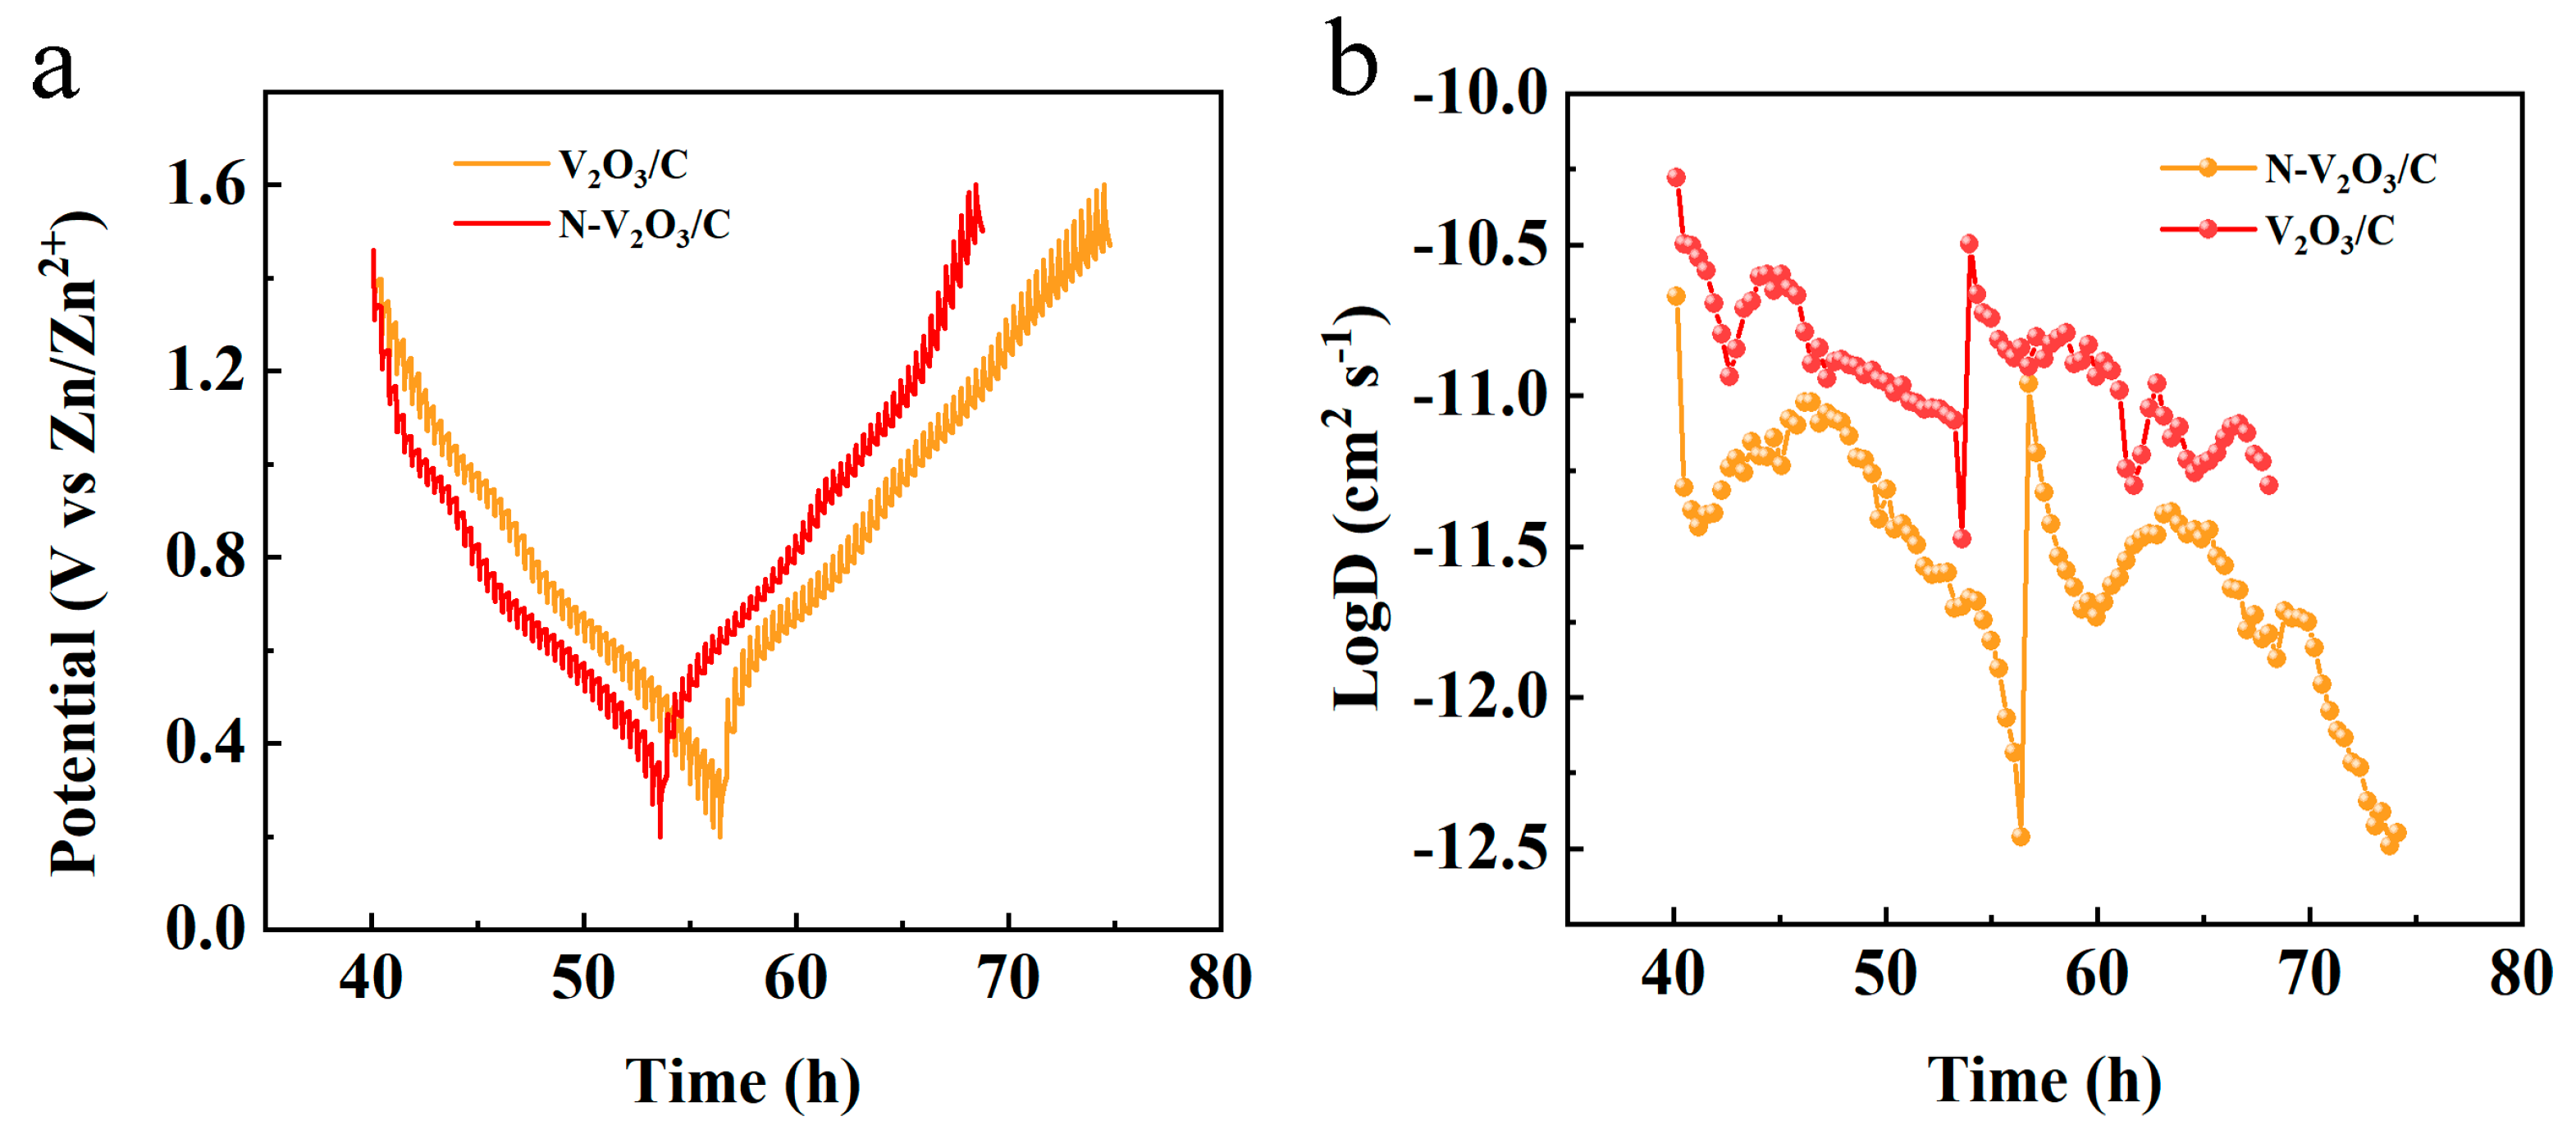
The Zn
2+ diffusion coefficient was quantified employing the galvanostatic intermittent titration technique (GITT), which substantiated the enhancement of ionic kinetics subsequent to nitrogen doping. The GITT experimentation was executed with a specified current density of 0.1 A g
−1, a relaxation time (τ) of 30 min, and measurement intervals set at 60 s.
Figure 13b reveals that the diffusion coefficient for V
2O
3/C was observed to lie between 10
−11 and 10
−12 cm
2 s
−1. Conversely, for N−V
2O
3/C, the Zn
2+ diffusion coefficient was determined to be within the range of 10
−10 to 10
−11 cm
2 s
−1.
2.4. Mechanistic Investigation
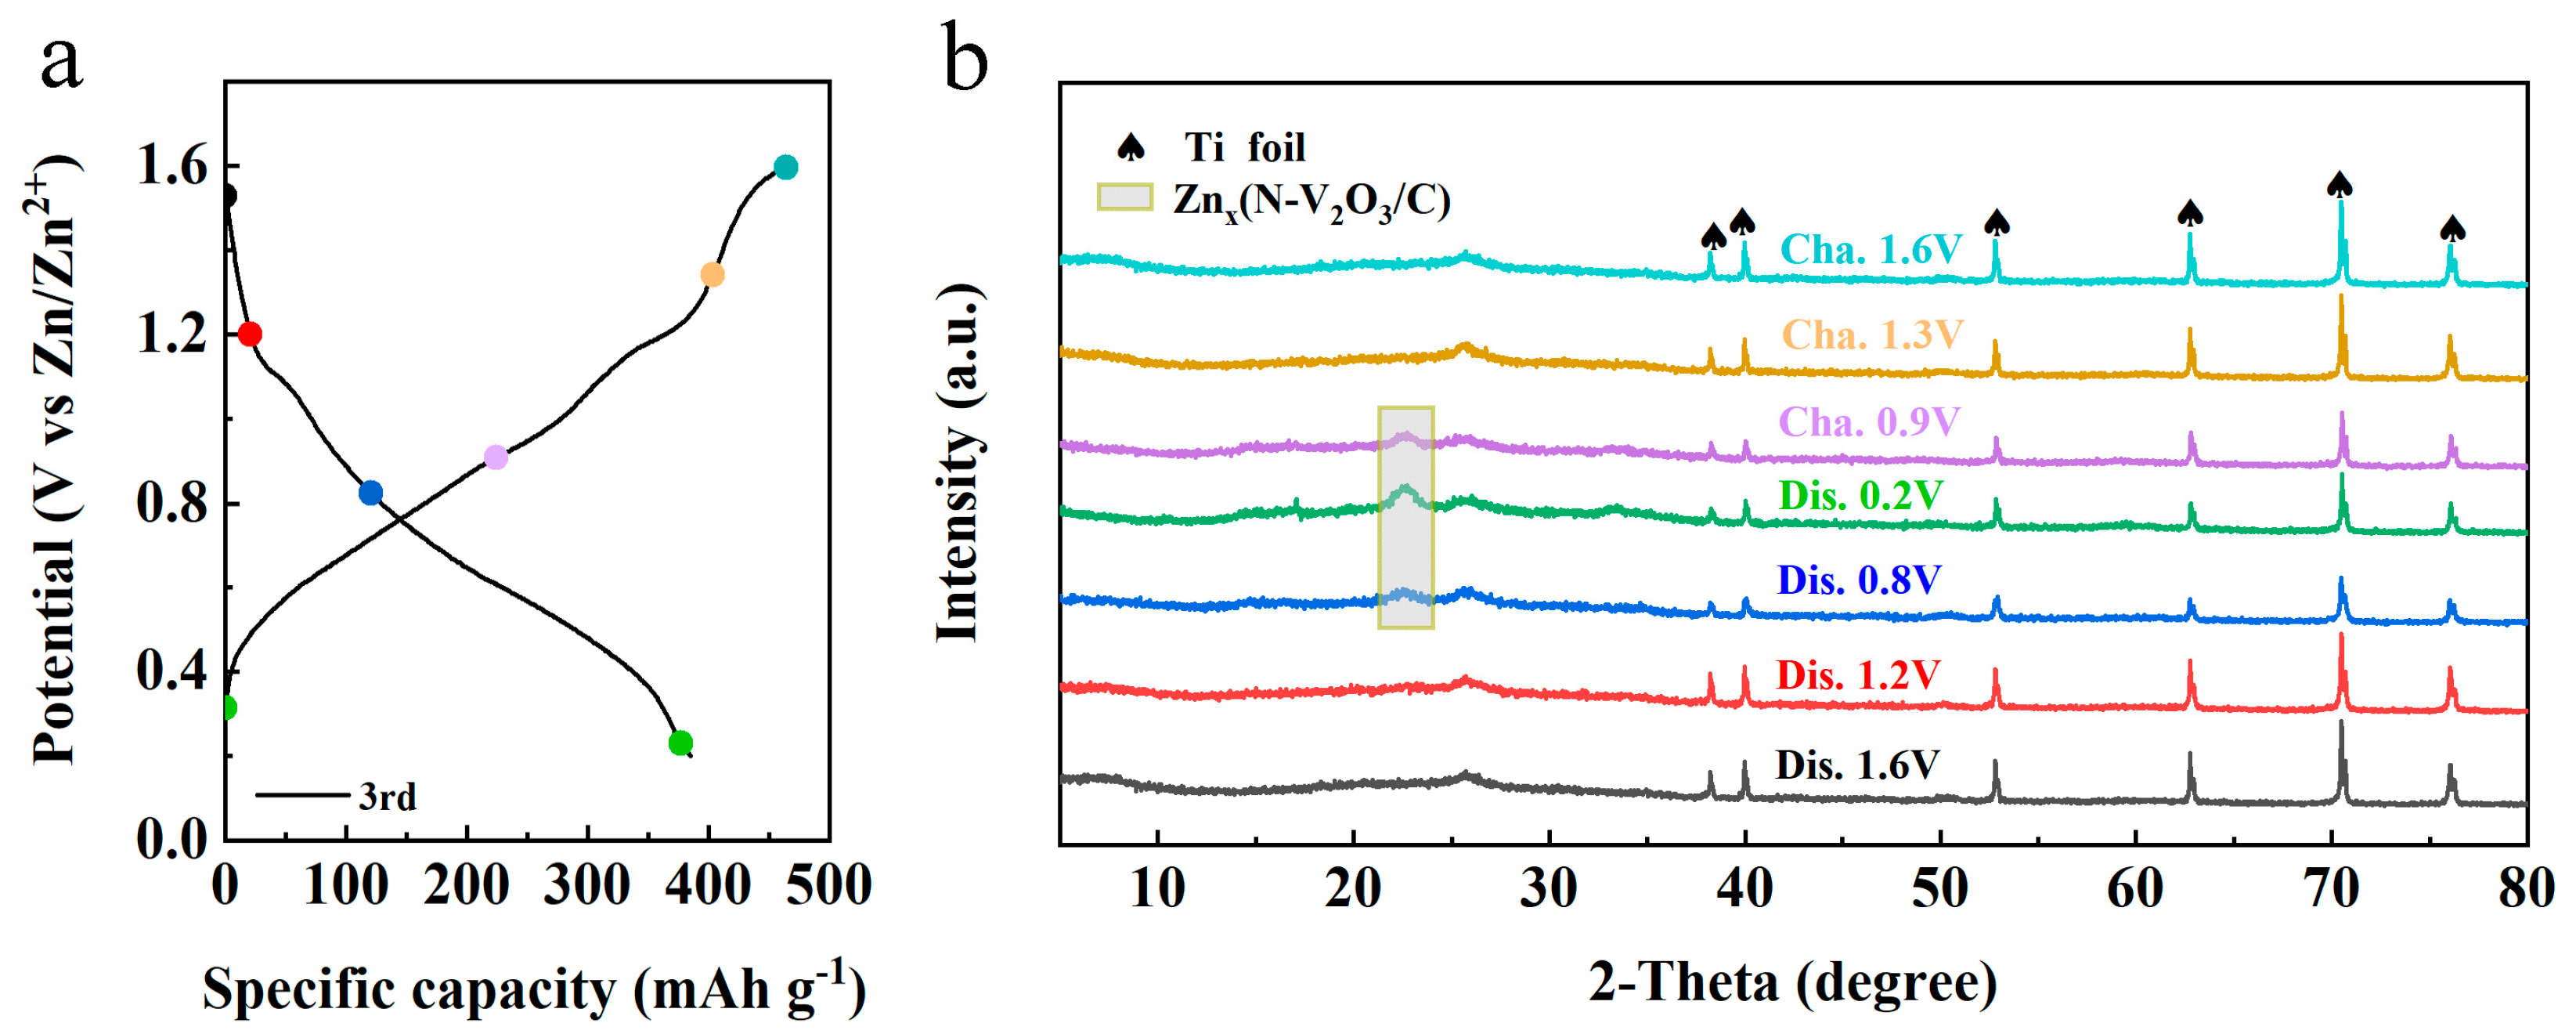
To elucidate the zinc storage mechanism within the N−V
2O
3/C matrix following its electrochemically induced phase transition, ex situ XRD analyses were conducted throughout the third charge/discharge cycle. As shown in
Figure 14b, minimal alterations in the peak positions were observed during the initial discharge phase, consistent with the patterns noted after the first charge cycle (refer to
Figure 3f). Notably, upon discharging to 0.8 V, a new peak emerged at 22.4°, indicative of a chemical reaction between Zn
2+ ions and N−V
2O
3/C, leading to the formation of the Zn−(N−V
2O
3/C) complex. The intensity of this peak increased significantly upon further discharging to 0.2 V. In contrast, as the cell was charged to 0.9 V and eventually reached 1.6 V, the intensity of this peak decreased, and upon completion of the charging process, all peaks indicative of intermediate phases were no longer detectable. This behavior highlights the pronounced reversibility of the structure with respect to the intercalation and deintercalation processes of Zn
2+ ions.
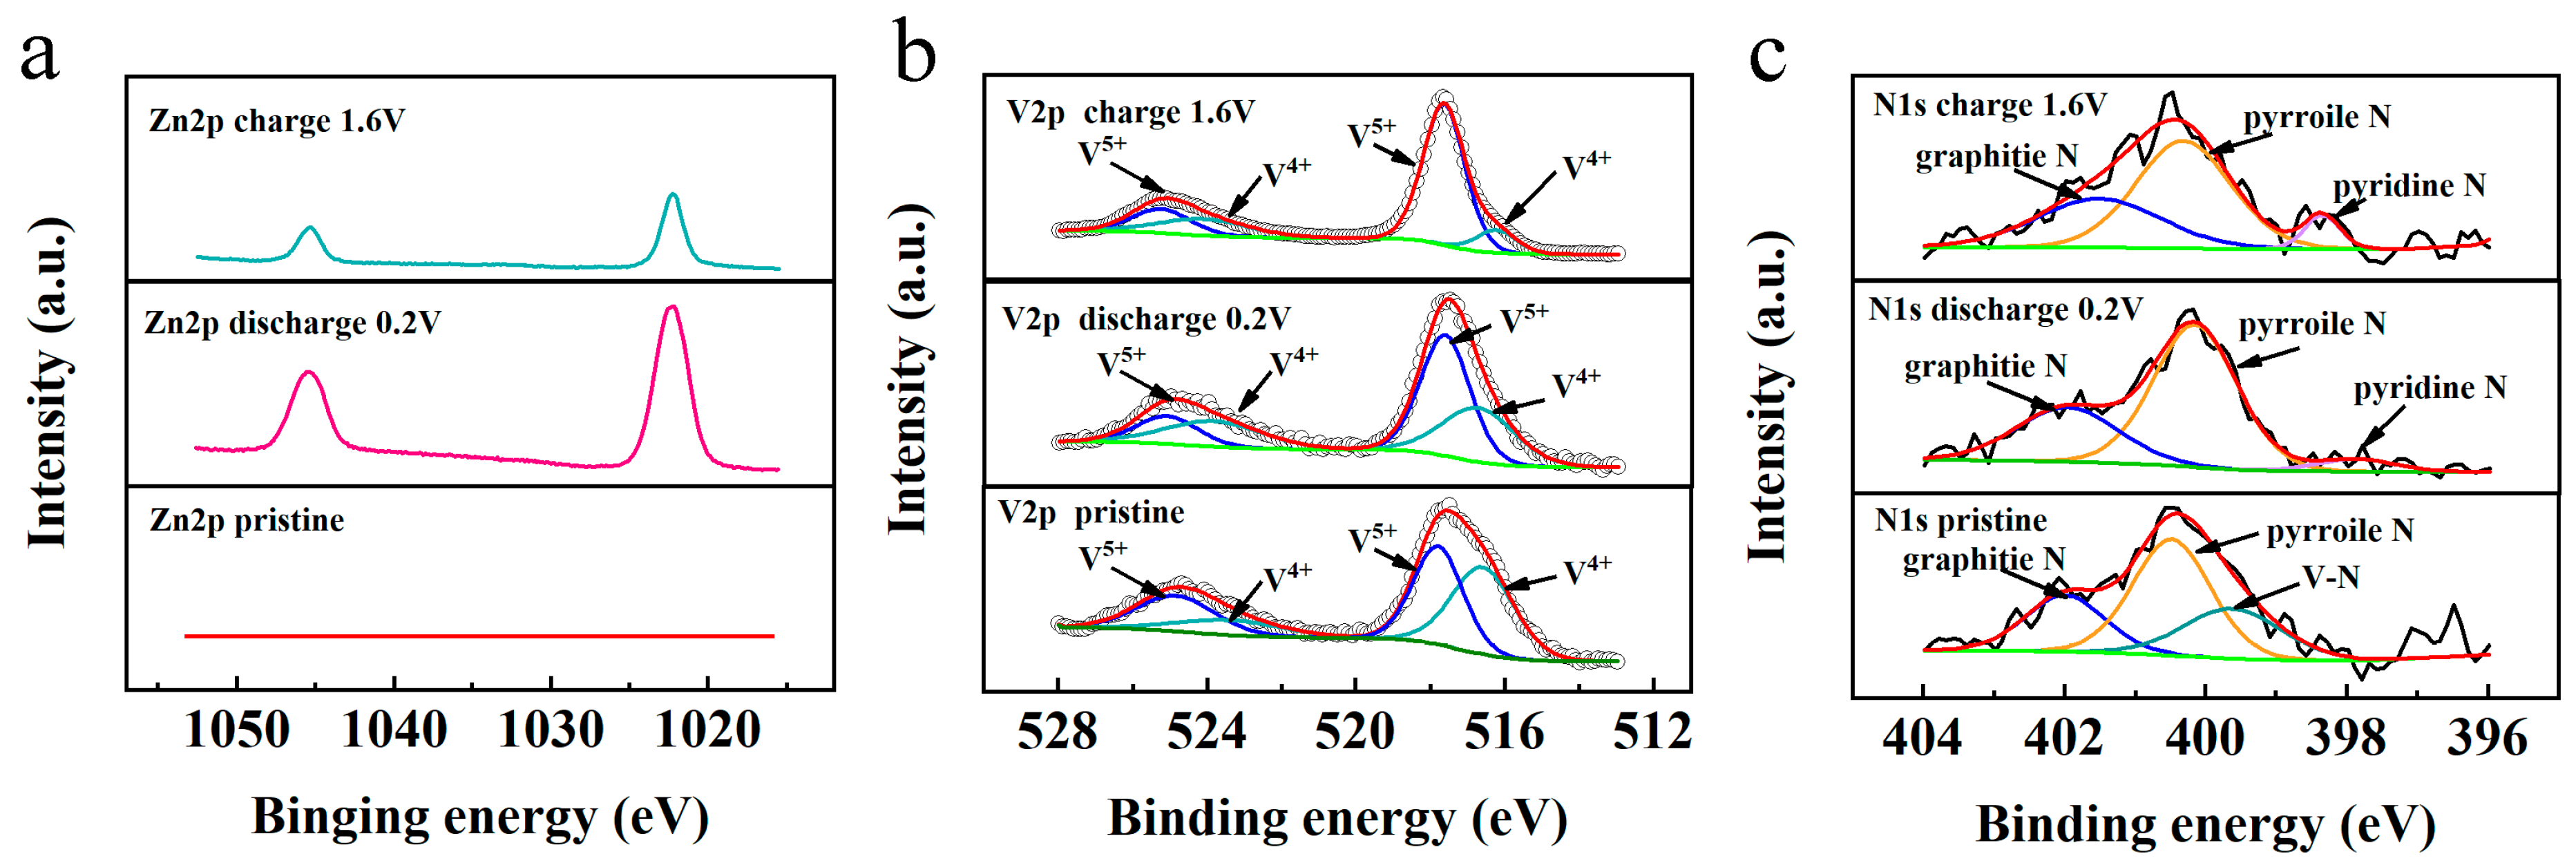
XPS analyses were performed to investigate the elemental state transformations in N−V
2O
3/C during the third charge/discharge cycle. Initially, the Zn 2p spectrum displayed no detectable Zn signals (
Figure 15a). This changed upon discharging the material to 0.2 V, where a prominent pair of Zn 2p peaks at 1022.2 eV and 1045.1 eV emerged, indicative of the successful intercalation of Zn
2+ ions. Upon recharging to 1.6 V, the intensity of these Zn 2p peaks significantly decreased, though they did not disappear entirely, suggesting a partial and potentially irreversible incorporation of Zn
2+ ions.
The valence state dynamics of vanadium are detailed in
Figure 15b. Initial spectra exhibited two peak pairs located at 524.8/517.7 eV and 523.4/516.7 eV, corresponding to the V
4+ and V
5+ oxidation states in V 2p3/2, respectively. Discharging the cell to 0.2 V resulted in a noticeable shift in the V
4+/V
5+ ratio, which was further modified upon recharging to 1.6 V. At this stage, an increase in the V
5+ content was observed, indicating a reversion of vanadium valence states post Zn
2+ deintercalation.
Additionally, changes in the chemical state of nitrogen were monitored through the N 1s spectra (
Figure 15c). A marginal increase in pyridinic nitrogen content was detected following discharge to 0.2 V, which intensified upon complete recharge. This alteration is proposed to facilitate the accelerated diffusion rate of Zn
2+ ions in N−V
2O
3/C compared to its V
2O
3/C counterpart during the electrochemical cycle. This comprehensive analysis underscores the complex interplay of ionic and electronic changes within N−V
2O
3/C that significantly impact its electrochemical behavior.
2.5. Investigation of Nitrogen Content
To investigate the impact of nitrogen doping levels on performance, the synthesis process involved varying the molar ratios of the vanadium source acetylacetonate vanadium to the nitrogen source thiourea as 2:1, 2:2, 2:3, and 2:4, using 0.076 g, 0.152 g, 0.228 g, and 0.304 g of thiourea, respectively. These were designated as N−V2O3/C−1, N−V2O3/C−2, N−V2O3/C−3, and N−V2O3/C−4, respectively.
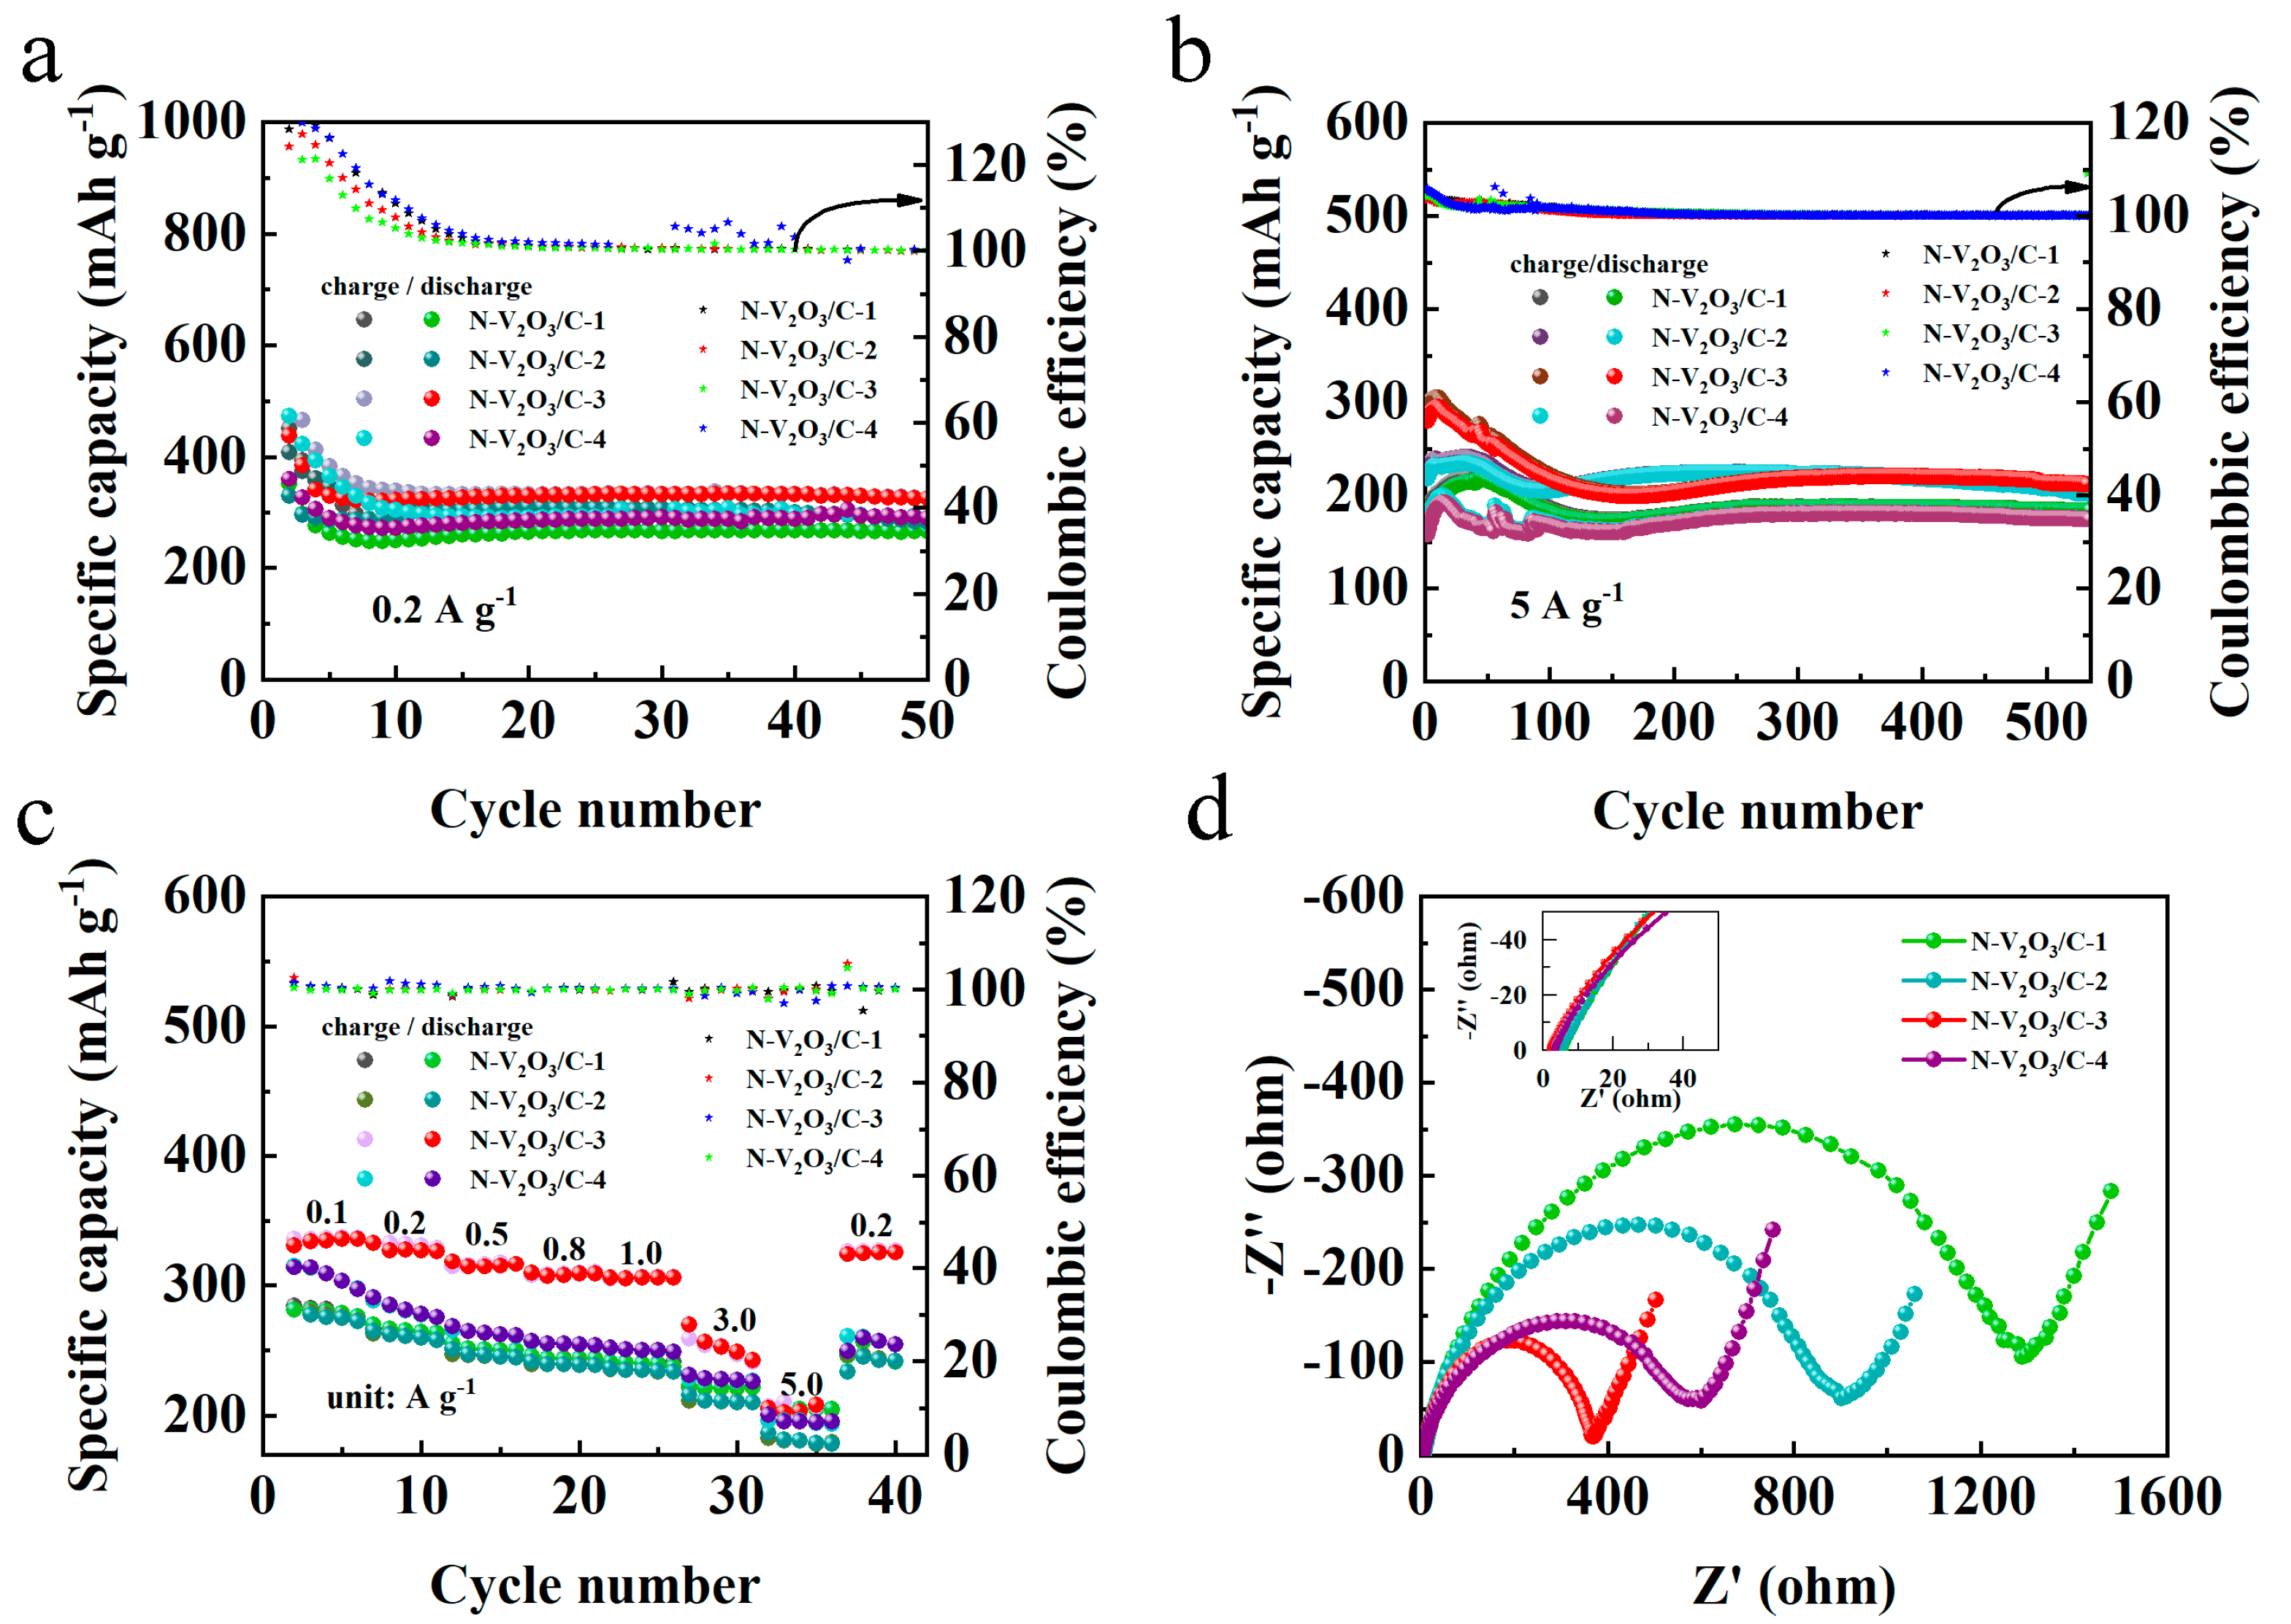
From the cycling performance at a current density of 0.2 A g
−1 (
Figure 16a), it can be observed that these materials all undergo similar cycling experiences. In the first 10 charge–discharge cycles, their charge and discharge profiles do not overlap, with the coulombic efficiency exceeding 100%, indicative of a transition from phase change to stability. After 10 cycles, the charge and discharge begin to stabilize, among which N−V
2O
3/C−3 exhibits the highest capacity after 50 cycles, reaching 331.1 mAh g
−1.
Figure 16b presents the cycling performance at a current density of 5 A g
−1. It is evident that their cycling processes are similar, among which N−V
2O
3/C−3 has the highest initial capacity. When reaching a stable cycle, N−V
2O
3/C−2 exhibits a relatively higher capacity, but its retention rate is not as favorable. After 500 cycles, N−V
2O
3/C−3 shows the highest capacity and the best retention rate, achieving 111%.
In
Figure 16c, the rate performance of N-V
2O
3/C electrodes, with varying levels of nitrogen doping, is evaluated across a series of current densities: 0.1, 0.2, 0.5, 0.8, 1.0, 3.0, and 5.0 A g
−1. Notably, the electrode designated N−V
2O
3/C−3 consistently demonstrated the most superior capacity, exhibiting negligible variation over the tested current density range. Furthermore, this electrode’s ability to recover its initial capacity upon the reduction in current density to lower rates signifies its exceptional rate capability. Electrochemical impedance spectroscopy (EIS) analysis, depicted in
Figure 16d, reveals that N−V
2O
3/C−3 possesses the minimal electrochemical charge transfer and ionic diffusion resistances among the tested materials, establishing a robust basis for its outstanding electrochemical attributes. The observed lower contact resistance of N−V
2O
3/C−3 also provides insight into its enhanced initial capacity, further validating the material’s electrochemical efficiency.
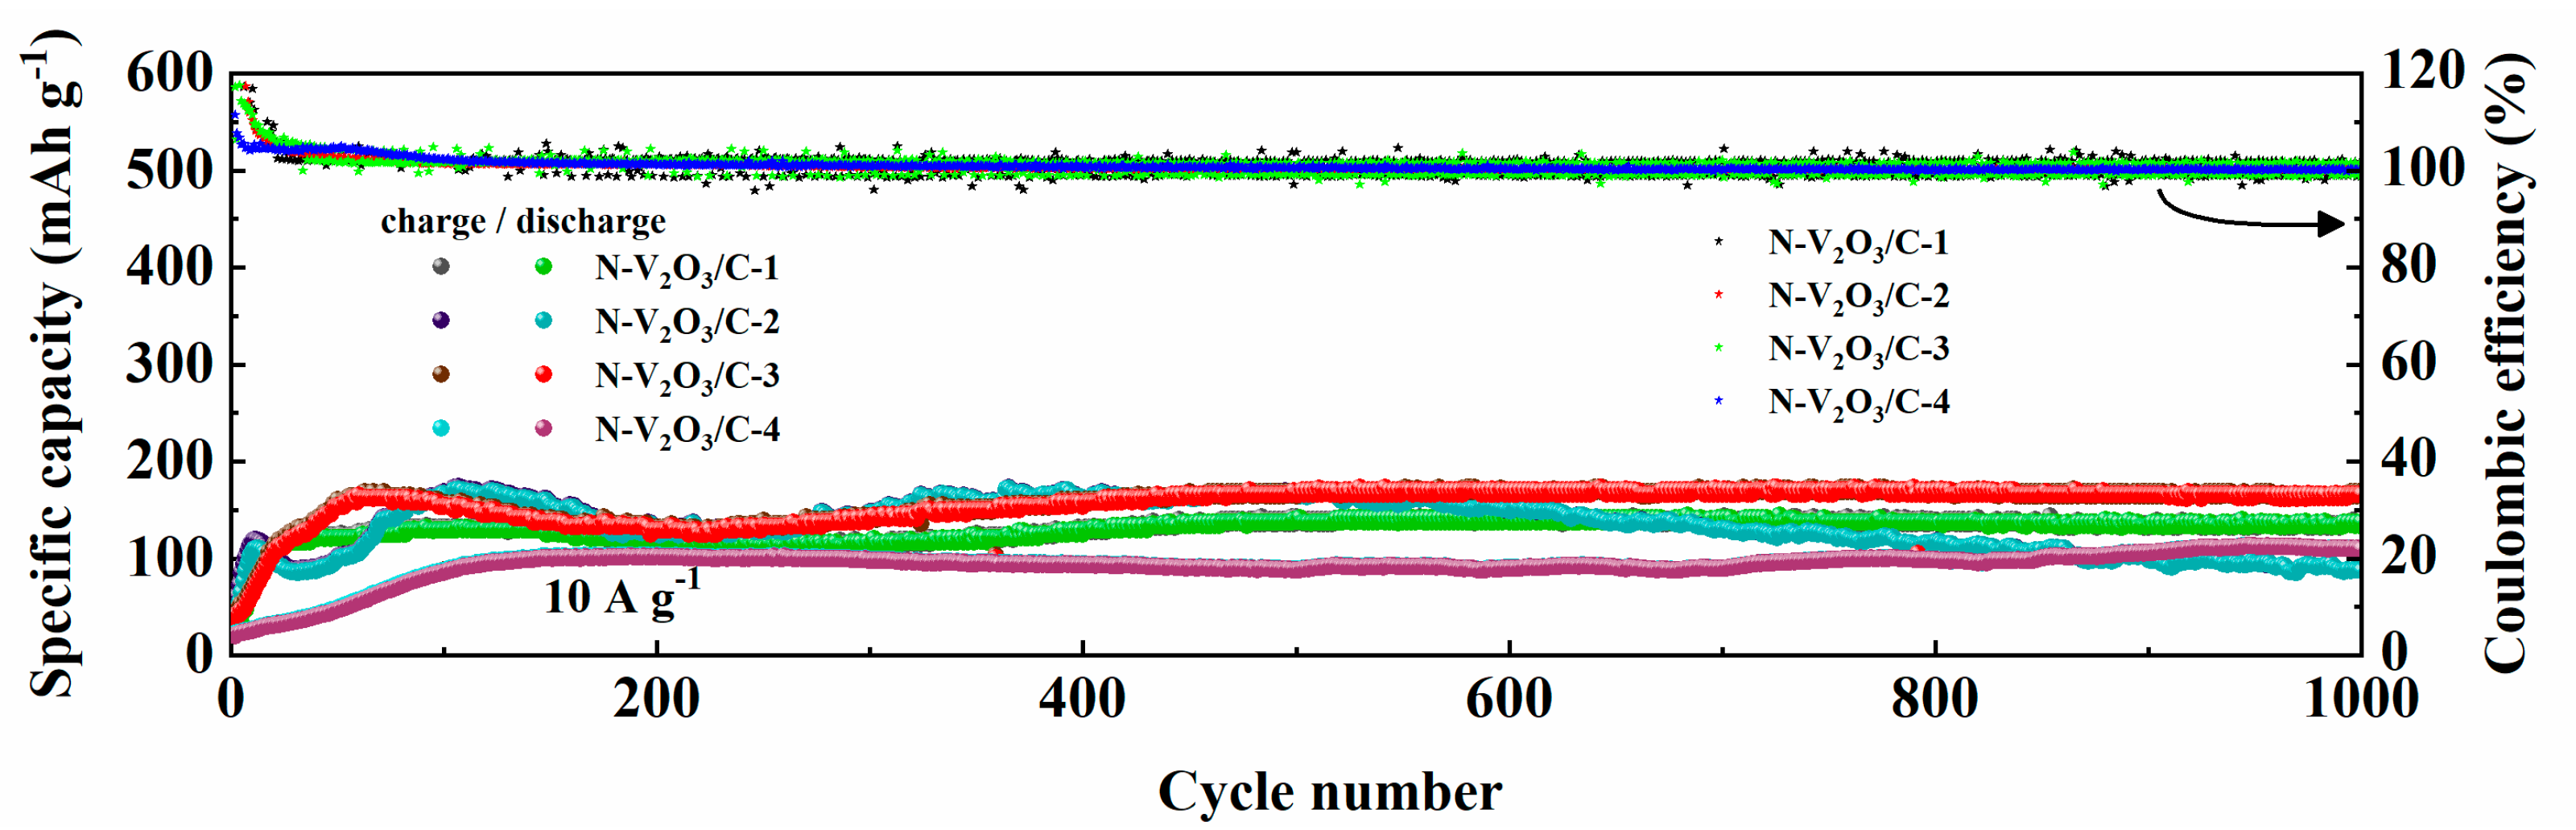
The long-term cycling stability of N−V
2O
3/C electrodes, differentiated by their nitrogen content, was rigorously evaluated under a high current density condition of 10 A g
−1. As depicted in
Figure 17, a trend towards stabilization was observed for all materials after the initial 100 cycles. Upon extending the cycling to 1000 cycles, the following observations were made: N−V
2O
3/C−1 demonstrated a stable capacity of 135.7 mAh g
−1, maintaining a retention rate of 100%. N−V
2O
3/C−2 recorded a capacity of 87.1 mAh g
−1, with a significantly lower retention rate of 51%. N−V
2O
3/C−3 showcased a superior capacity of 168.5 mAh g
−1, accompanied by a retention rate of 102%, whereas N−V
2O
3/C−4 achieved a capacity of 109.9 mAh g
−1, marking the highest retention rate among the samples at 111%. Notably, while N−V
2O
3/C−4 exhibited the highest retention rate, its initial capacity was comparatively lower. Conversely, N−V
2O
3/C-3 not only presented the highest initial capacity but also maintained a relatively high retention rate, underscoring that the electrochemical performance reached its zenith when the vanadium and nitrogen sources were combined at a molar ratio of 2:3. This composition was found to yield the most favorable outcomes in terms of both capacity and durability.


