Article

Effect of TiC Particles on the Properties of Copper Matrix Composites

1
College of Physics and Electronic Information Engineering, Qinghai Minzu University, Xining 810007, China
2
Asia Silicon (Qinghai) Co., Xining 810007, China
3
Qinghai Key Laboratory of Nanomaterials and Technology, Xining 810007, China
*
Author to whom correspondence should be addressed.
Inorganics 2024, 12(4), 120; https://doi.org/10.3390/inorganics12040120
Submission received: 5 March 2024 / Revised: 9 April 2024 / Accepted: 9 April 2024 / Published: 17 April 2024

Abstract

:
In this study, TiC particle-reinforced Cu-based composites were prepared by powder metallurgy and spark plasma sintering (SPS) techniques. The mechanical and electrical properties of TiC/Cu composites were analyzed in conjunction with micro-morphology. The results showed that: TiC was fully diffused in the Cu matrix at a sintering temperature of 900 °C. The micron-sized TiC particles were most uniformly distributed in the Cu matrix and had the best performance. At this time, the densification of 5 wt.% TiC/Cu composites reached 97.19%, and the conductivity, hardness, and compressive yield strength were 11.47 MS·m−1, 112.9 HV, and 162 MPa, respectively. The effect of TiC content on the overall properties of the composites was investigated at a sintering temperature of 900 °C. The TiC content of the composites was also found to have a significant influence on the overall properties of the composites. The best performance of the composites was obtained when the TiC mass fraction was 10%. The average values of density, hardness, yield strength and conductivity of the 10 wt.% TiC/Cu composites were 90.07%, 128.3 HV, 272 MPa and 9.98 MS·m−1, respectively. The yield strength was 272 MPa, and the compressive strain was 38.8%. With the increase in TiC content, although the yield strength increased, the brittleness increased due to more weak interfaces in the composites.

1. Introduction

In recent years, copper-based metal matrix composites have become a research area of interest for researchers due to their good thermal and electrical conductivity [1,2,3]. These unique properties have led to a wide range of applications of copper in spot welding electrodes, electrical sliding contacts, connectors and heat sinks [4,5,6,7]. However, their poor mechanical properties again limit the application of pure copper materials in the above fields. Therefore, in recent decades, the development of methods to enhance the mechanical properties of copper has become a new research hotspot. It has been shown that the introduction of a second phase into a copper matrix or copper alloy can effectively enhance the mechanical properties of copper matrix composites [8]. And the second phase particles such as ceramic particles and oxides of rare earths can optimize the mechanical properties of copper composites such as compression and tensile in the process of sintering [9]. Ceramic particles include oxides (Al2O3, La2O3), carbides (TiC, SiC, NbC, WC), borides (TiB2, ZrB2), and sulfides (WS2, MoS2) [10]. TiC, as a hard ceramic material, possesses excellent refractory and high temperature resistance properties, and has a melting point of about 3160 °C. TiC is also used as the main material for the sintering of copper composites. In addition, TiC has excellent mechanical properties and impact resistance [11,12]. It appears that the use of TiC reinforced Cu matrix composites to compound the above application requirements [13,14]. Bagheri et al. [14] prepared Cu matrix composites with different amounts of titanium carbide particles by mechanical milling and in situ formation of reinforcement and investigated the effect of different TiC contents on the mechanical properties of Cu matrix composites. The results showed that some Ti atoms were dissolved in the lattice of Cu with ball milling. The mechanical properties of the materials were significantly enhanced with the increase in TiC content, but the electrical conductivity decreased dramatically. In recent years, Huang et al. [15] have prepared TiC/Cu composites using Carbon Poly-mer Dot (CPD) as the carbon source and Ti in Cu-Ti alloy powder as the Ti source. The results showed that TiC was formed and uniformly distributed at the grain boundaries of the matrix, which led to the tensile strength of the composites reaching 385 MPa.
The use of liquid metallurgy in the production of metal composites usually leads to various problems, for example, the use of stir casting and squeeze casting can result in the particles of the reinforcing phase floating on the surface of the metal matrix, so that the surface of the particulate reinforcing phase can not be fully wetted, which leads to repulsion, and the high temperature of the molten state can also lead to unwanted reactions and chemical decomposition [13]. The traditional powder metallurgy (PM) method is not affected by the density gradient and avoids unnecessary interfacial reactions in the composites, so the PM method is still an excellent method for the preparation of metal composites [16]. In addition, the smaller the size of the reinforcing phase, the better its strengthening effect. The energy transfer from ball-powder–ball collisions and ball-powder–wall collisions during the ball milling process used in PM will play a role in refining the grains and distorting the lattice, which will result in higher mechanical properties of the prepared composites [17,18].
In summary, in this study, TiC particles were synthesized from Ti and C powders using ball milling and calcination processes, using powder metallurgy to mix and refine the powders with high-energy ball milling to improve the lattice strain energy. The TiC/Cu composites were prepared using discharge plasma spark sintering to investigate the effect of sintering temperature on the microstructure, physical phase composition, hardness, conductivity, and compression properties of TiC/Cu composites. Then the effect of TiC content on the composites was investigated at the optimum sintering temperature.
In this study, 5 wt.% TiC/Cu composites were prepared by an SPS sintering process at 850 °C, 900 °C, 950 °C, and 1000 °C, respectively. The sintered samples were labeled as T850TiC/Cu, T900TiC/Cu, T950TiC/Cu, and T1000TiC/Cu, in turn, and 900 °C was determined as the optimum sintering temperature based on the comprehensive performance of TiC/Cu composites. The above ball-milled TiC/Cu composite powders with different contents were subjected to SPS sintering, with a sintering time of 10 min, a uniaxial pressure of 40 Mpa, and a sintering target temperature of 900 °C. The sintered samples were taken out and labeled as 10 wt.% TiC/Cu, 15 wt.% TiC/Cu, 20 wt.% TiC/Cu, and 25 wt.% TiC/Cu, respectively. The samples for performance testing and characterization were prepared using an EDM wire cutting machine and a polishing machine.

2. Results and Analysis

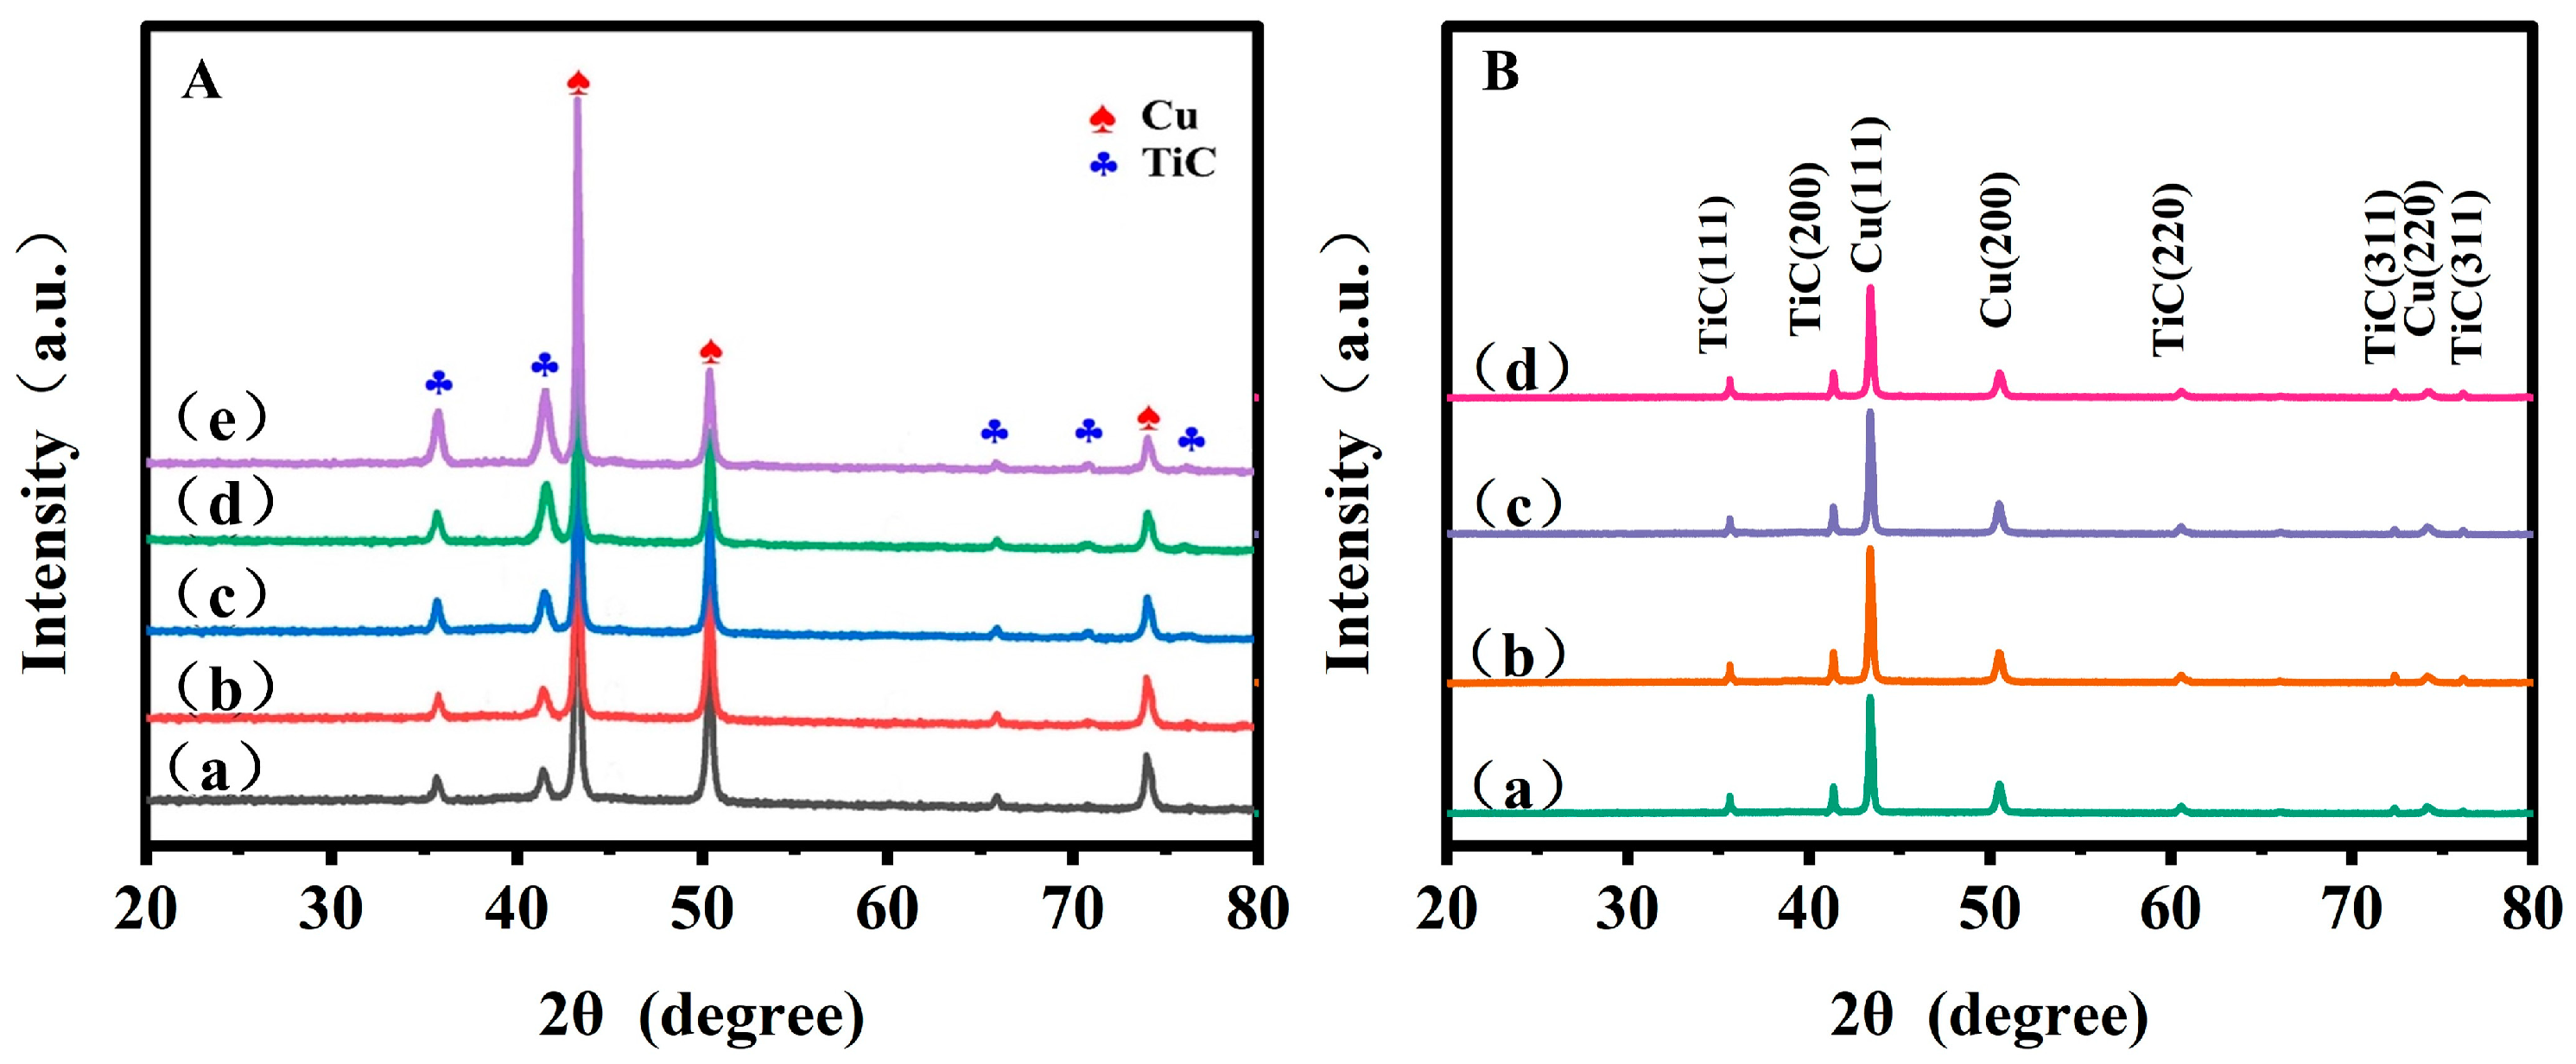
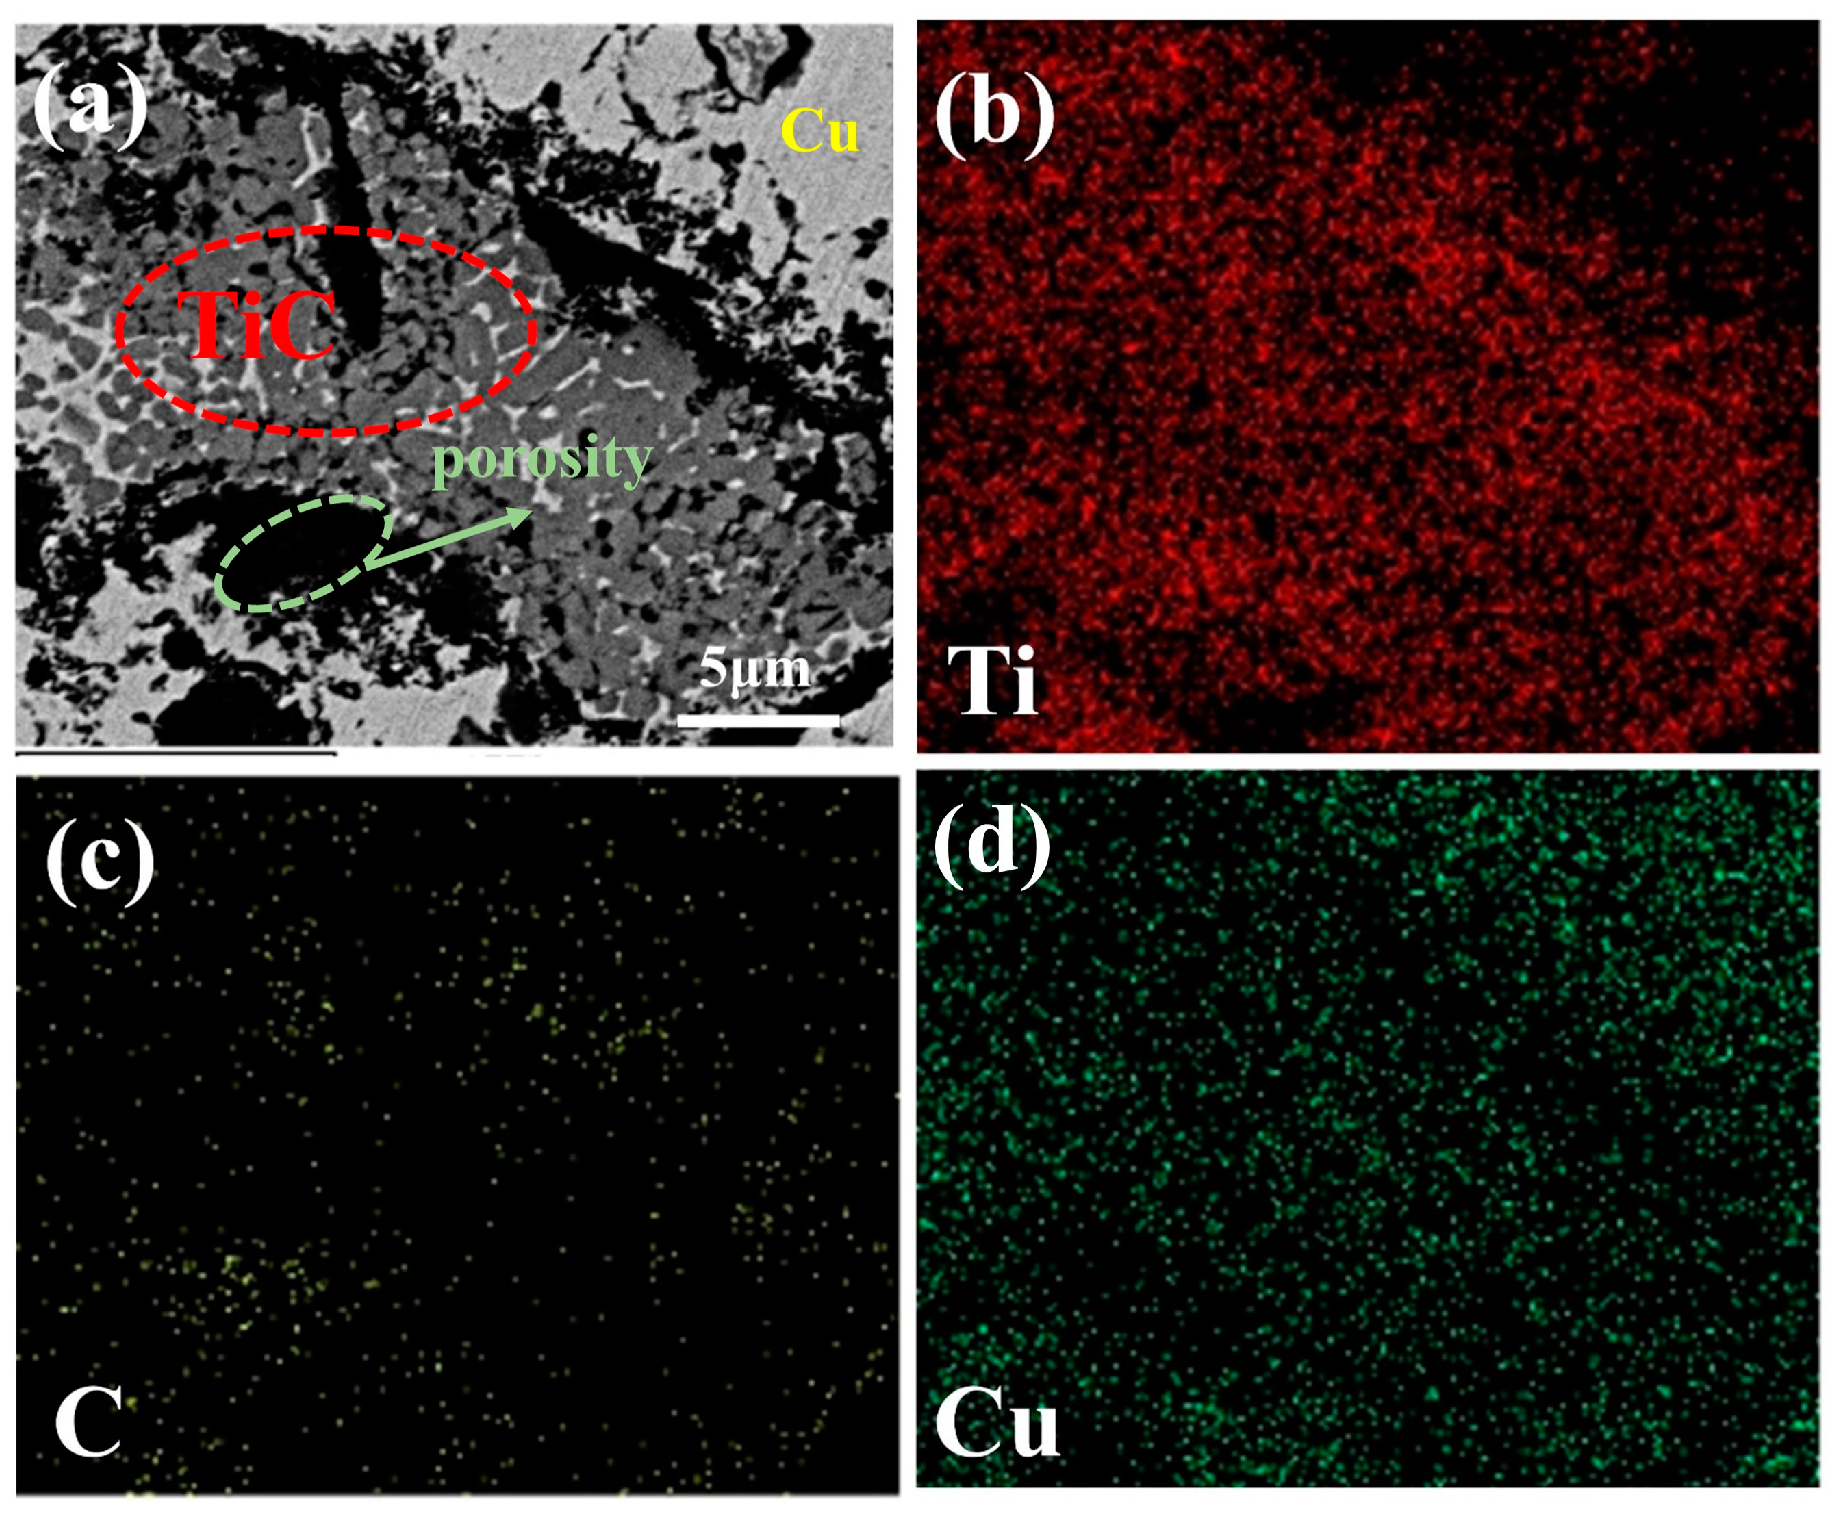
2.1. Physical Phase Composition and Microscopic Morphology of TiC/Cu with Different Sintering Temperatures

The phase composition of composite powders with different TiC content and TiC/Cu composite powders at different sintering temperatures is shown in Figure 1. XRD results of the composite powder and composite are consistent with those of Cu (PDF#04-003-2953) and TiC (PDF#97-007-7472). From small 2θ to large 2θ, the enhanced phase TiC has five diffraction peaks corresponding to the crystal planes of TiC (111), (200), (220), (311) and (222). No diffraction peaks of other substances are found in the figure. The results show that the oxidation of the composite powder can be prevented by filling argon in the milling process. In Figure 1A, the intensity of the TiC diffraction peak increases with the increase in TiC content. In addition, the diffraction peak of Cu does not shift. This shows that the lattice constant of Cu does not change during the high-energy ball milling process, and other elements do not enter the lattice of Cu due to the ball milling process, which may be related to the fact that Ti is not directly mixed with Cu during the ball milling process [14]. By comparing the position of the Cu diffraction peak in Figure 1A,B, it can be found that the lattice constant does not change, indicating that the same element does not diffuse into the lattice during the hot pressing sintering process.
Figure 2 shows the SEM images of 5 wt.% TiC/Cu composites at different sintering temperatures. As shown in Figure 2a–d, the light gray plane part is the Cu matrix, and the dark gray and black part is the TiC enhancement phase. The pores between TiC and Cu in T850TiC/Cu and T1000TiC/Cu composites are shown in Figure 2e,f, respectively. TiC typically uses a red ellipse mark in the graph after agglomeration. The high-energy ball milling process makes the matrix evenly distributed with a micron scale anomalous TiC intensification phase. The darker black part is condensed TiC particles. With the sintering temperature rising from 850 °C to 900 °C, although the TiC particles still agglomerate, the dispersion effect is obviously better than that of the samples sintered at 850 °C. This is mainly because the thermal kinetic energy of TiC increases with the increase in temperature. At 900 °C, the TiC particles and Cu matrix can be fully diffused. At sintering temperatures of 950 °C and 1000 °C, obvious black TiC accumulation points can be observed in Figure 3c,d, which is due to the fact that the grain boundary area is greatly reduced due to the high temperature, which makes the grain grow. TiC originally distributed at grain boundaries tends to aggregate [19]. This agglomeration phenomenon makes the separation of the reinforced phase from the matrix more serious, and the interface bonding between TiC and Cu deteriorates. This situation seriously destroys the continuity of the Cu matrix, which is very unfavorable to the mechanical properties and densification of composite materials. This change is consistent with the results of porosity change in Table 1, indicating that with the increase in sintering temperature, the porosity of the composite increases and the densification degree decreases. At a sintering temperature of 900 °C, the maximum density of the composite material is 8.33 g·cm−3, and the minimum porosity is 2.81%. The density of a TiC/Cu composite is less than that of pure copper (8.96 g·cm−3), mainly because the density of TiC is 4.95 g·cm−3 less than that of pure copper. When the sintering temperature is 950 °C, the density of the composite begins to decrease again. The main reason for the decrease in porosity is that the density of the composite reaches a maximum value of 8.33 g·cm−3 when sintered at 900 °C. The minimum porosity is 2.81%. The decrease in porosity of TiC/Cu composite is mainly due to the increase in sintering temperature, which leads to the increase in atomic vibration amplitude between the Cu matrix and TiC particles, thus promoting diffusion and mutual bonding. As the binding particles grow, the gas between the particles is expelled, resulting in an increase in the density of the composite. However, too high a temperature will cause TiC agglomeration, resulting in the formation of pores at the interface with Cu, and the Cu grain size increases. In addition, the rapid growth of Cu grains hindered the timely discharge of gas, and eventually led to pore defects [20].
Figure 3 shows the distribution of elements in the TiC agglomeration zone of a typical TiC/Cu composite sintered at 950 °C. The distribution of Ti and C elements indicates the aggregation of TiC in the Cu matrix. The structure of the Cu matrix, TiC and pores is shown in Figure 3a. This aggregation increases the porosity of TiC/Cu composites and destroys the dispersion of TiC in the Cu matrix. Uniform dispersion is an important prerequisite for TiC reinforcement phase to effectively improve the mechanical properties of a Cu matrix [21].

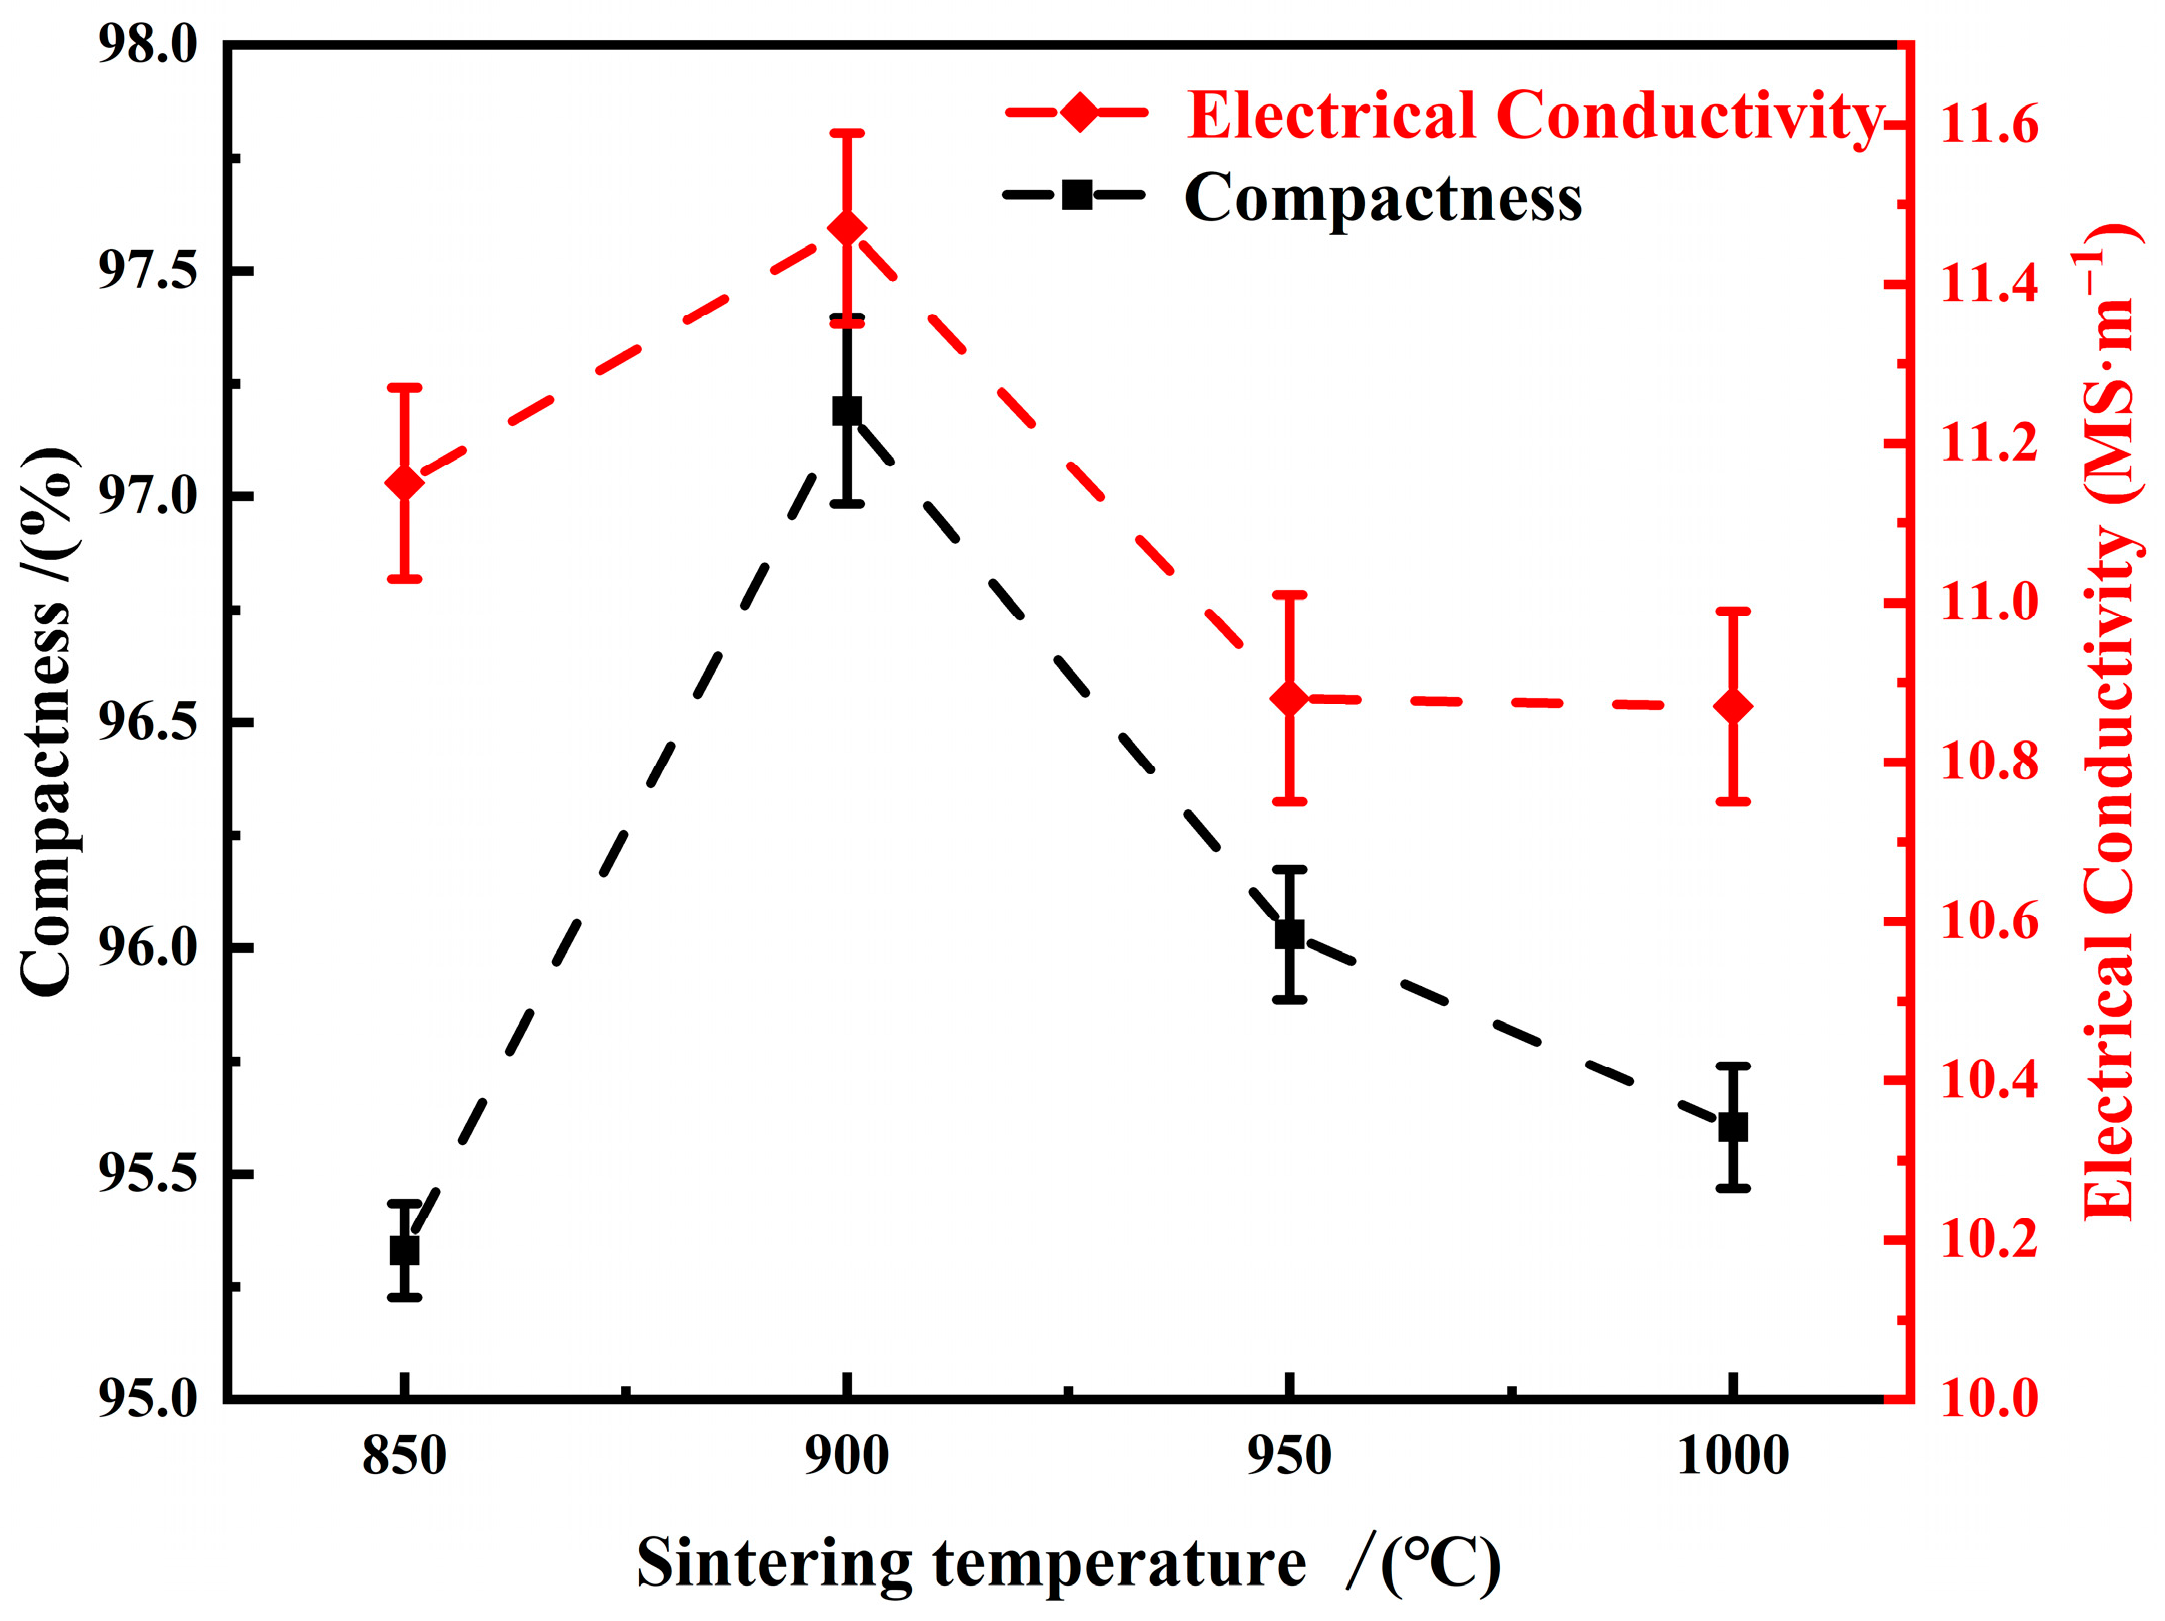
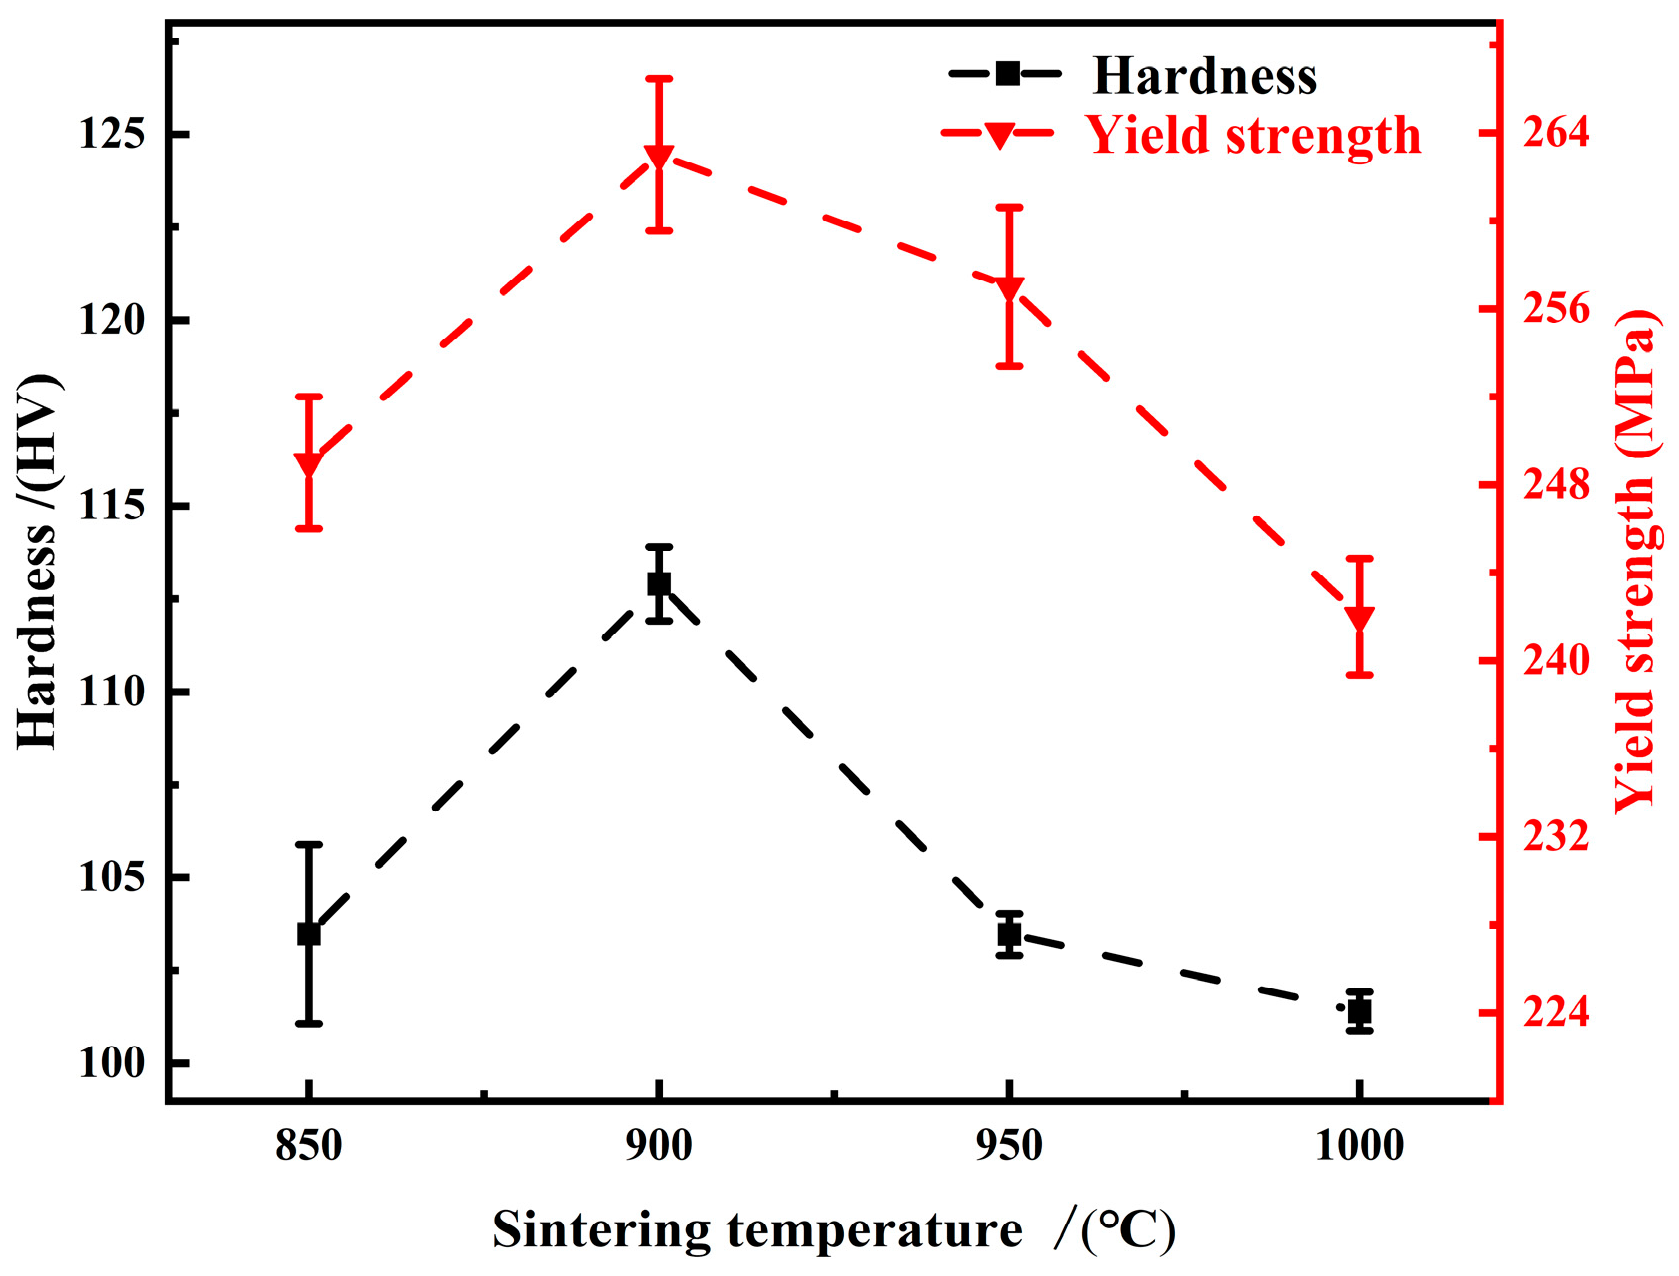
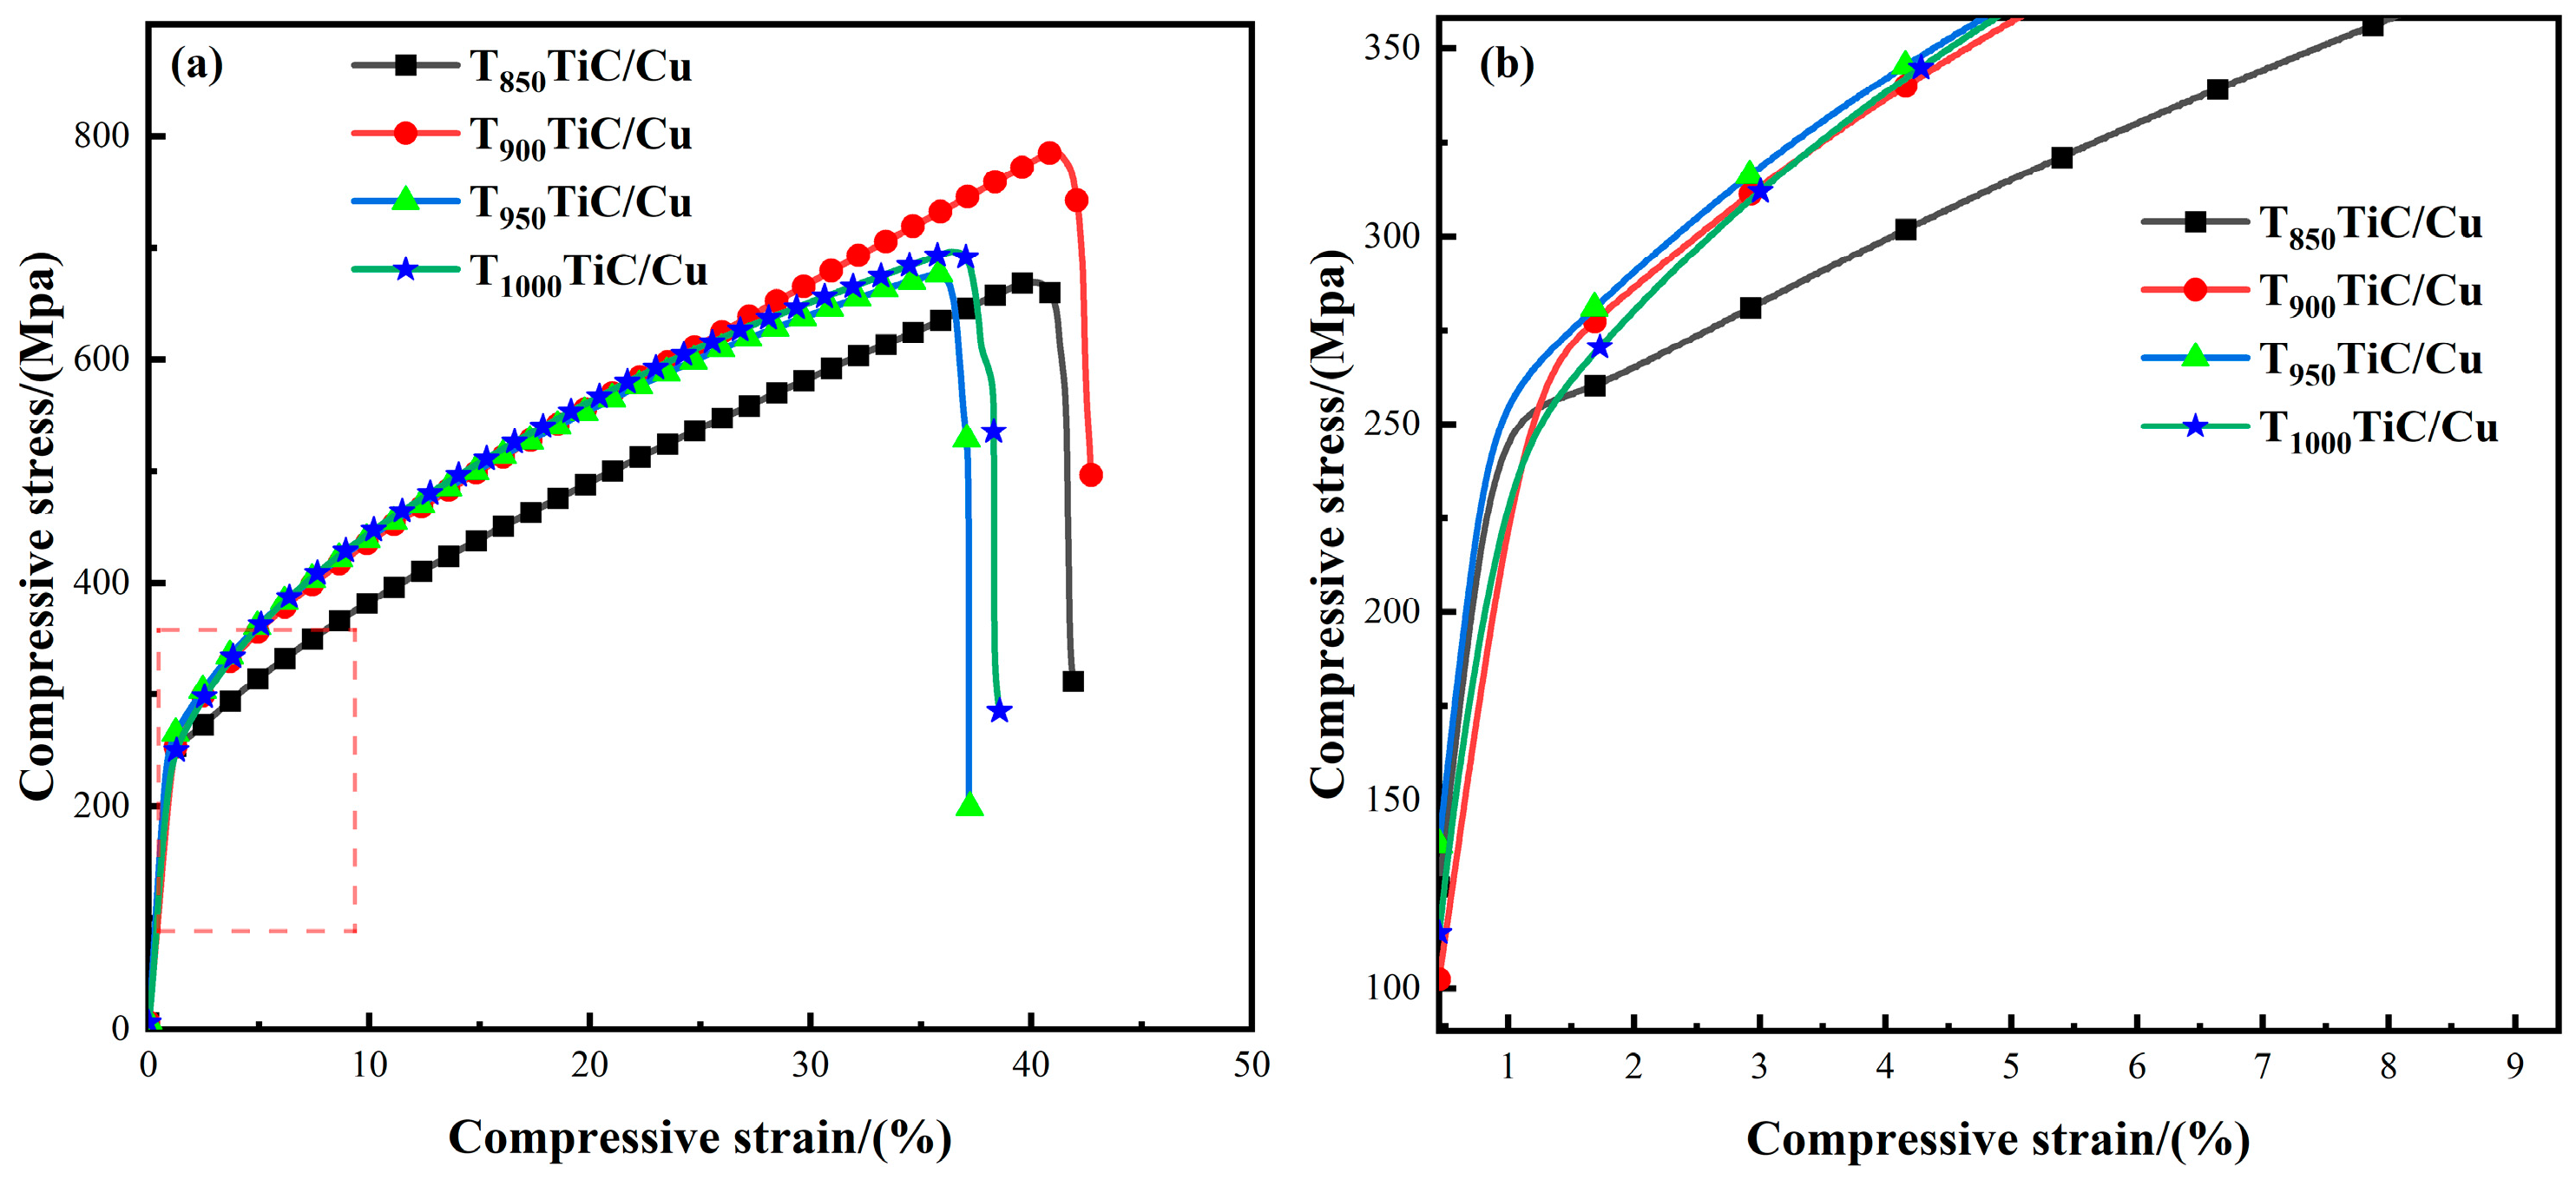
2.2. Effect of Sintering Temperature on Electrical and Mechanical Properties of TiC/Cu Composites

The conductivity and densification trends of 5 wt.% TiC/Cu composites at different SPS sintering temperatures are shown in Figure 4. When the sintering temperature of SPS was increased from 850 °C to 900 °C, the average conductivity of the composite was increased from 11.15 MS·m−1 to 11.47 MS·m−1. The results of SEM showed that the average density increased from 95.33% to 97.19%. In Cu-based composites, the movement of electrons is hindered by the scattering effect of the reinforced particles on the one hand and the residual pores in the composite on the other [19]. Although with the increase in sintering temperature the porosity of TiC/Cu composites decreases with the increase in densification degree, and the scattering effect of pores on electrons in the composites is weakened, TiC particles also increase with the increase in temperature, and the obstruction to electron movement is enhanced, resulting in no significant improvement in electrical conductivity. When the sintering temperature is 950 °C and 1000 °C, the agglomeration and growth of TiC particles have obvious scattering effect on electrons, which reduces the electrical conductivity of TiC/Cu composites. This phenomenon is fully reflected when the sintering temperature is increased from 900 °C to 950 °C.
Figure 5 shows the variation curves of hardness and compressive yield strength of 5 wt.% TiC/Cu composites at different sintering temperatures. When the sintering temperature is 900 °C, the average hardness and yield strength of the composite reach the maximum value, the hardness is 112.9 HV, and the yield strength is 263 MPa. Figure 6 shows the compressive stress–strain diagram of TiC/Cu composites at different sintering temperatures, where Figure 6b is the enlarged diagram of the area in the box in Figure 6a, representing the elastic strain end point of the composites at different sintering temperatures. When the sintering temperature is 900 °C, the maximum compressive strength reaches 779 MPa, the compressive strain rate reaches 40.97%, and the balance between strength and toughness is reached. This change is due to the increase in the density of the composite material at 900 °C and the dispersion of TiC in the Cu matrix. When the sintering temperature exceeds 950 °C, the hardness and yield strength of the composite begin to decrease. When the temperature is too high, on the one hand, the diffusion rate between atoms is greater than the gas movement rate, resulting in an increase in porosity, on the other hand, when the temperature is high and the grain is growing (the coefficient of thermal expansion of copper is 16.6 × 10⁻⁶/°C), this change is contrary to the effect of fine grain strengthening; the grain becomes coarser, thereby reducing the mechanical properties of the composite material. The agglomerated TiC particles cannot bind closely with the copper matrix, resulting in brittle strengthening of the material. This is also the reason for the decrease in ductility of composites sintered at 950 °C and 1000 °C. A similar situation also appeared when Li et al. [22] discussed the effect of sintering temperature on 4 wt.% NbC/Cu composites.

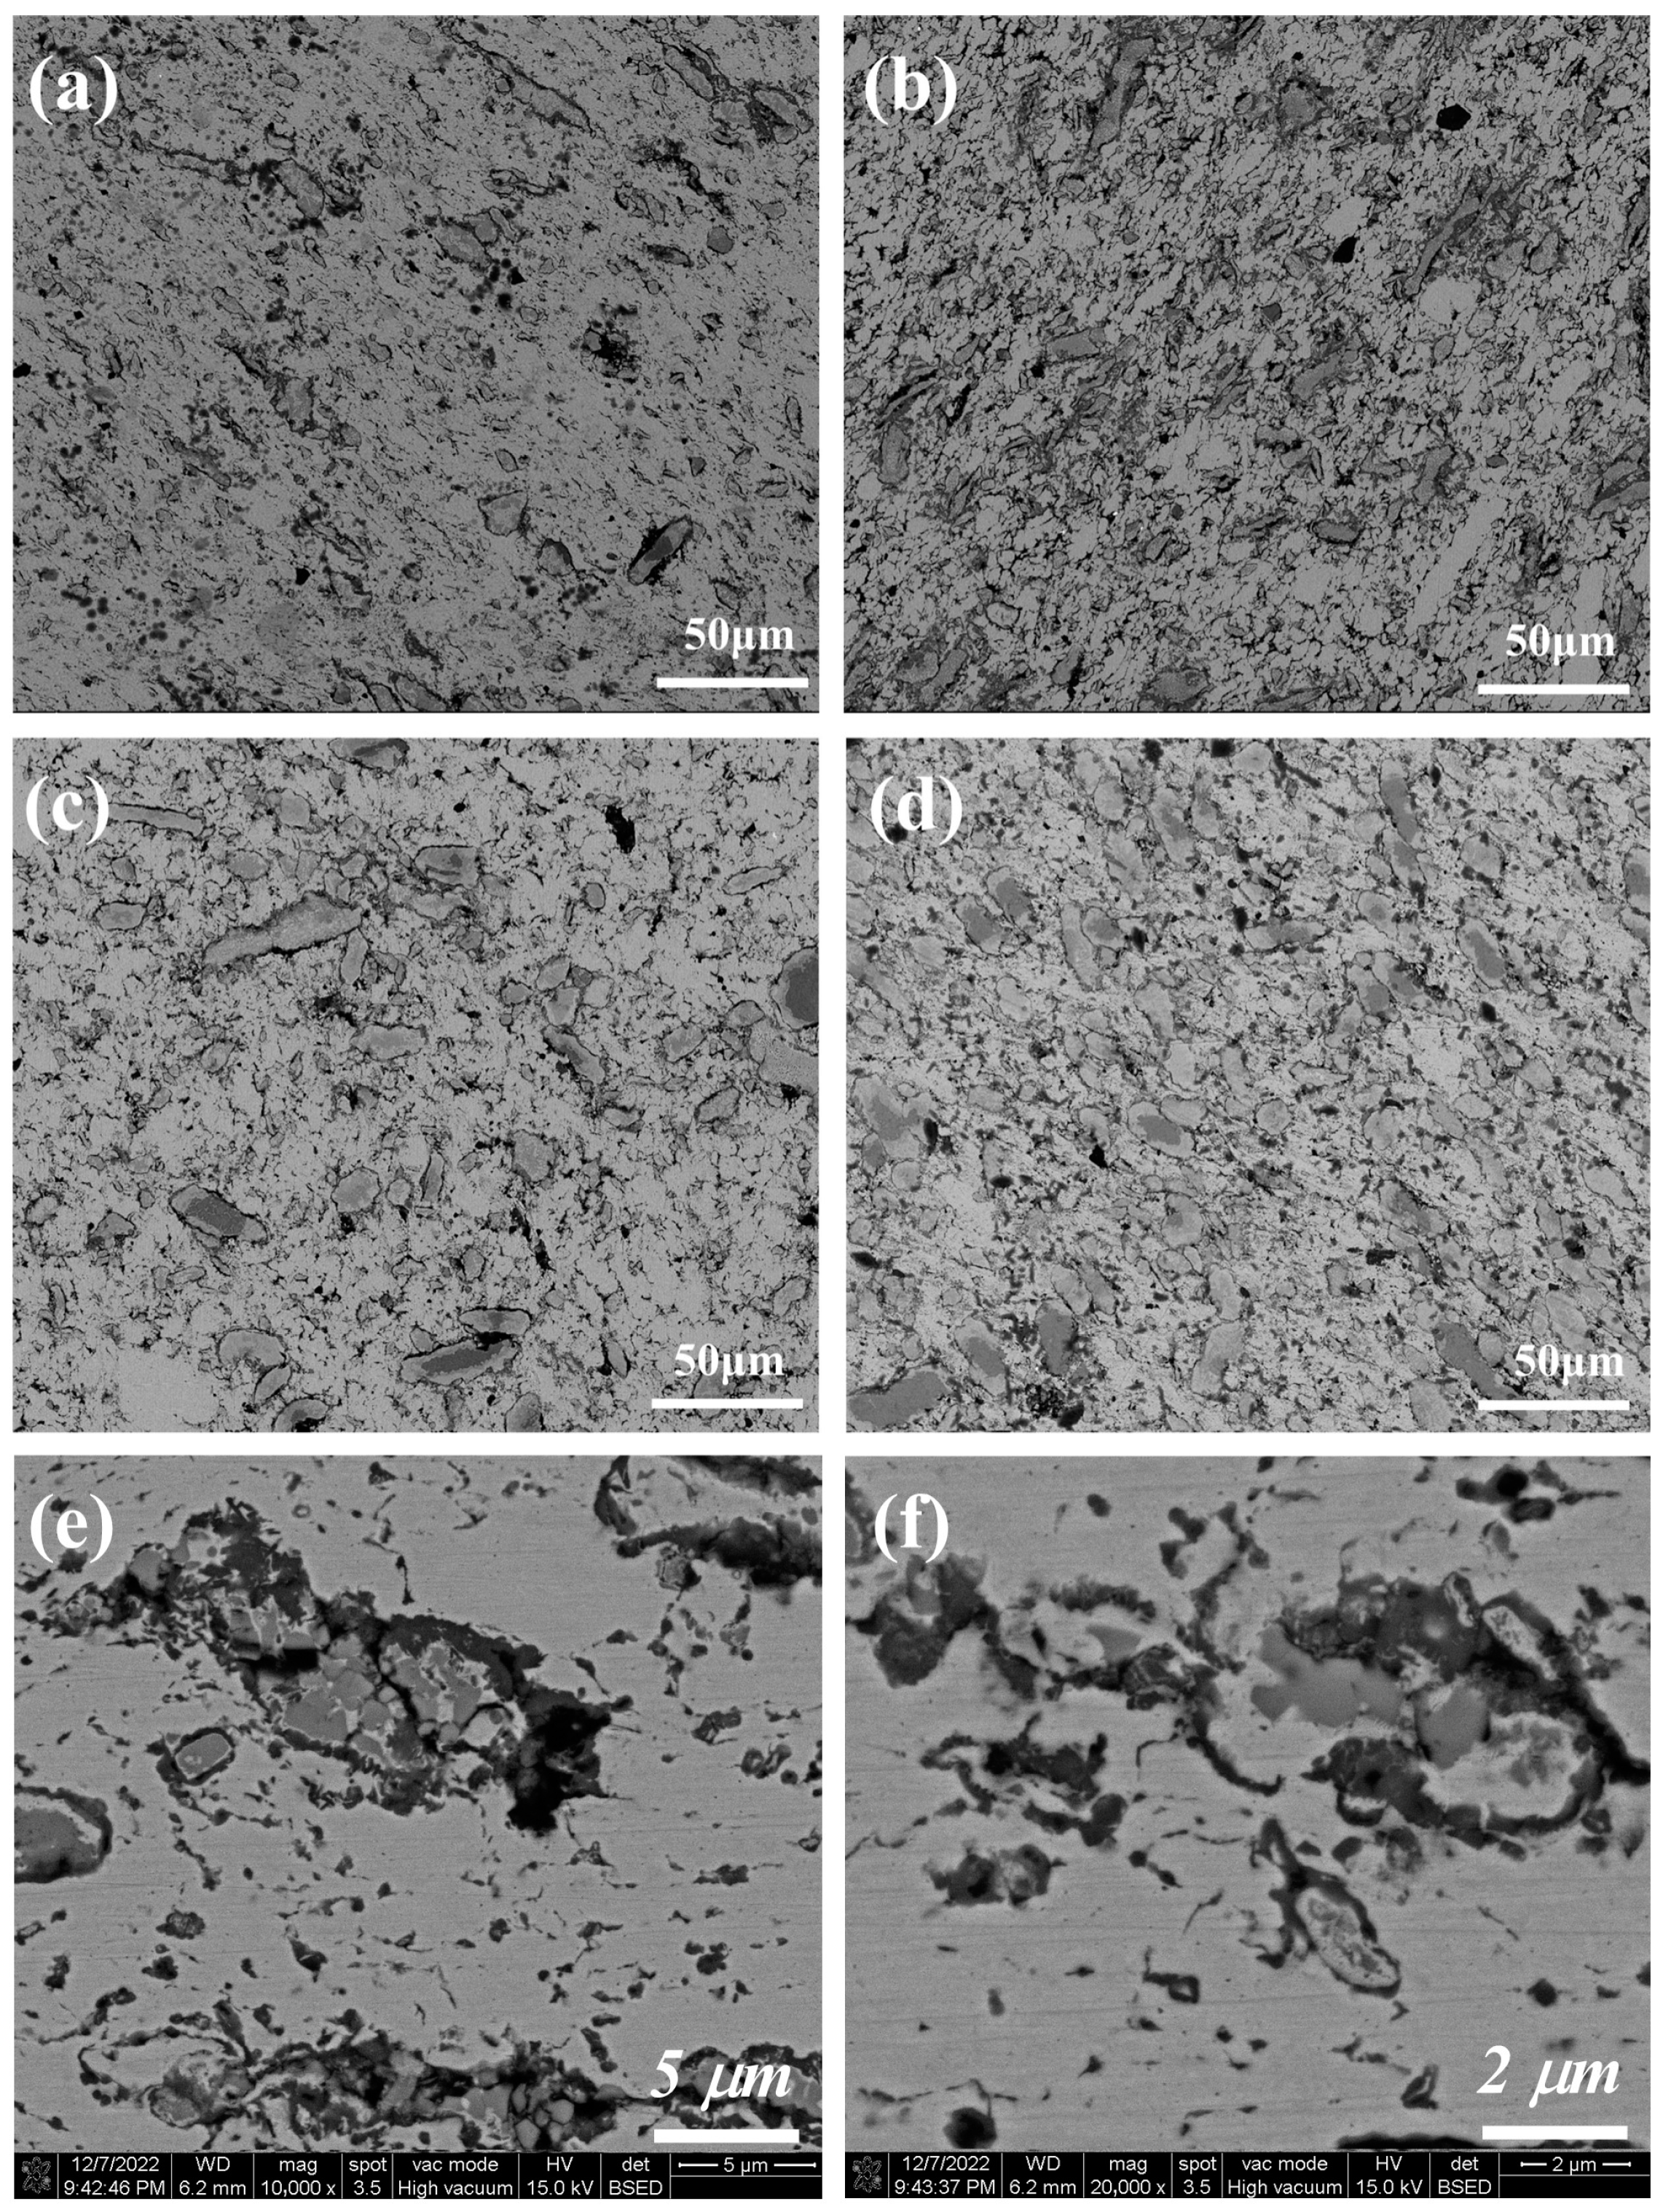
2.3. Microscopic Morphology of TiC/Cu Composites with Different TiC Contents

Figure 7 shows TiC/Cu composites with different TiC contents prepared by SPS sintering at 900 °C, the mass fraction of TiC increases from 10% to 5% to 25%, corresponding to parts (a) to (d) in Figure 7, respectively. TiC particles are dispersed and agglomerated in the Cu matrix, and agglomeration becomes more and more significant with the increase in TiC mass fraction. As can be seen from Figure 7, the dispersion effect is best when the mass fraction of TiC is 10%. Diffusion strengthening is the main method of strengthening a Cu matrix by TiC. As shown in Table 2, the density of TiC/Cu composites decreases with the intensification of agglomeration. When the TiC content reaches 25 wt.%, the porosity of the composite increases from 2.81% to 19.30%, which means that the density is reduced. The reason is that as the TiC content increases, the weak bonding surface between TiC and Cu in the TiC/Cu composite increases. Pores appear easily on weak bonding surfaces. In addition, the intensification of agglomeration will also promote the formation of surface pores. Figure 7e,f shows the agglomeration morphology of TiC particles in a typical 20 wt.% TiC/Cu composite. With the increase in TiC content, the agglomeration enhancement phase seriously destroys the continuity of the Cu matrix, resulting in the emergence of pores.

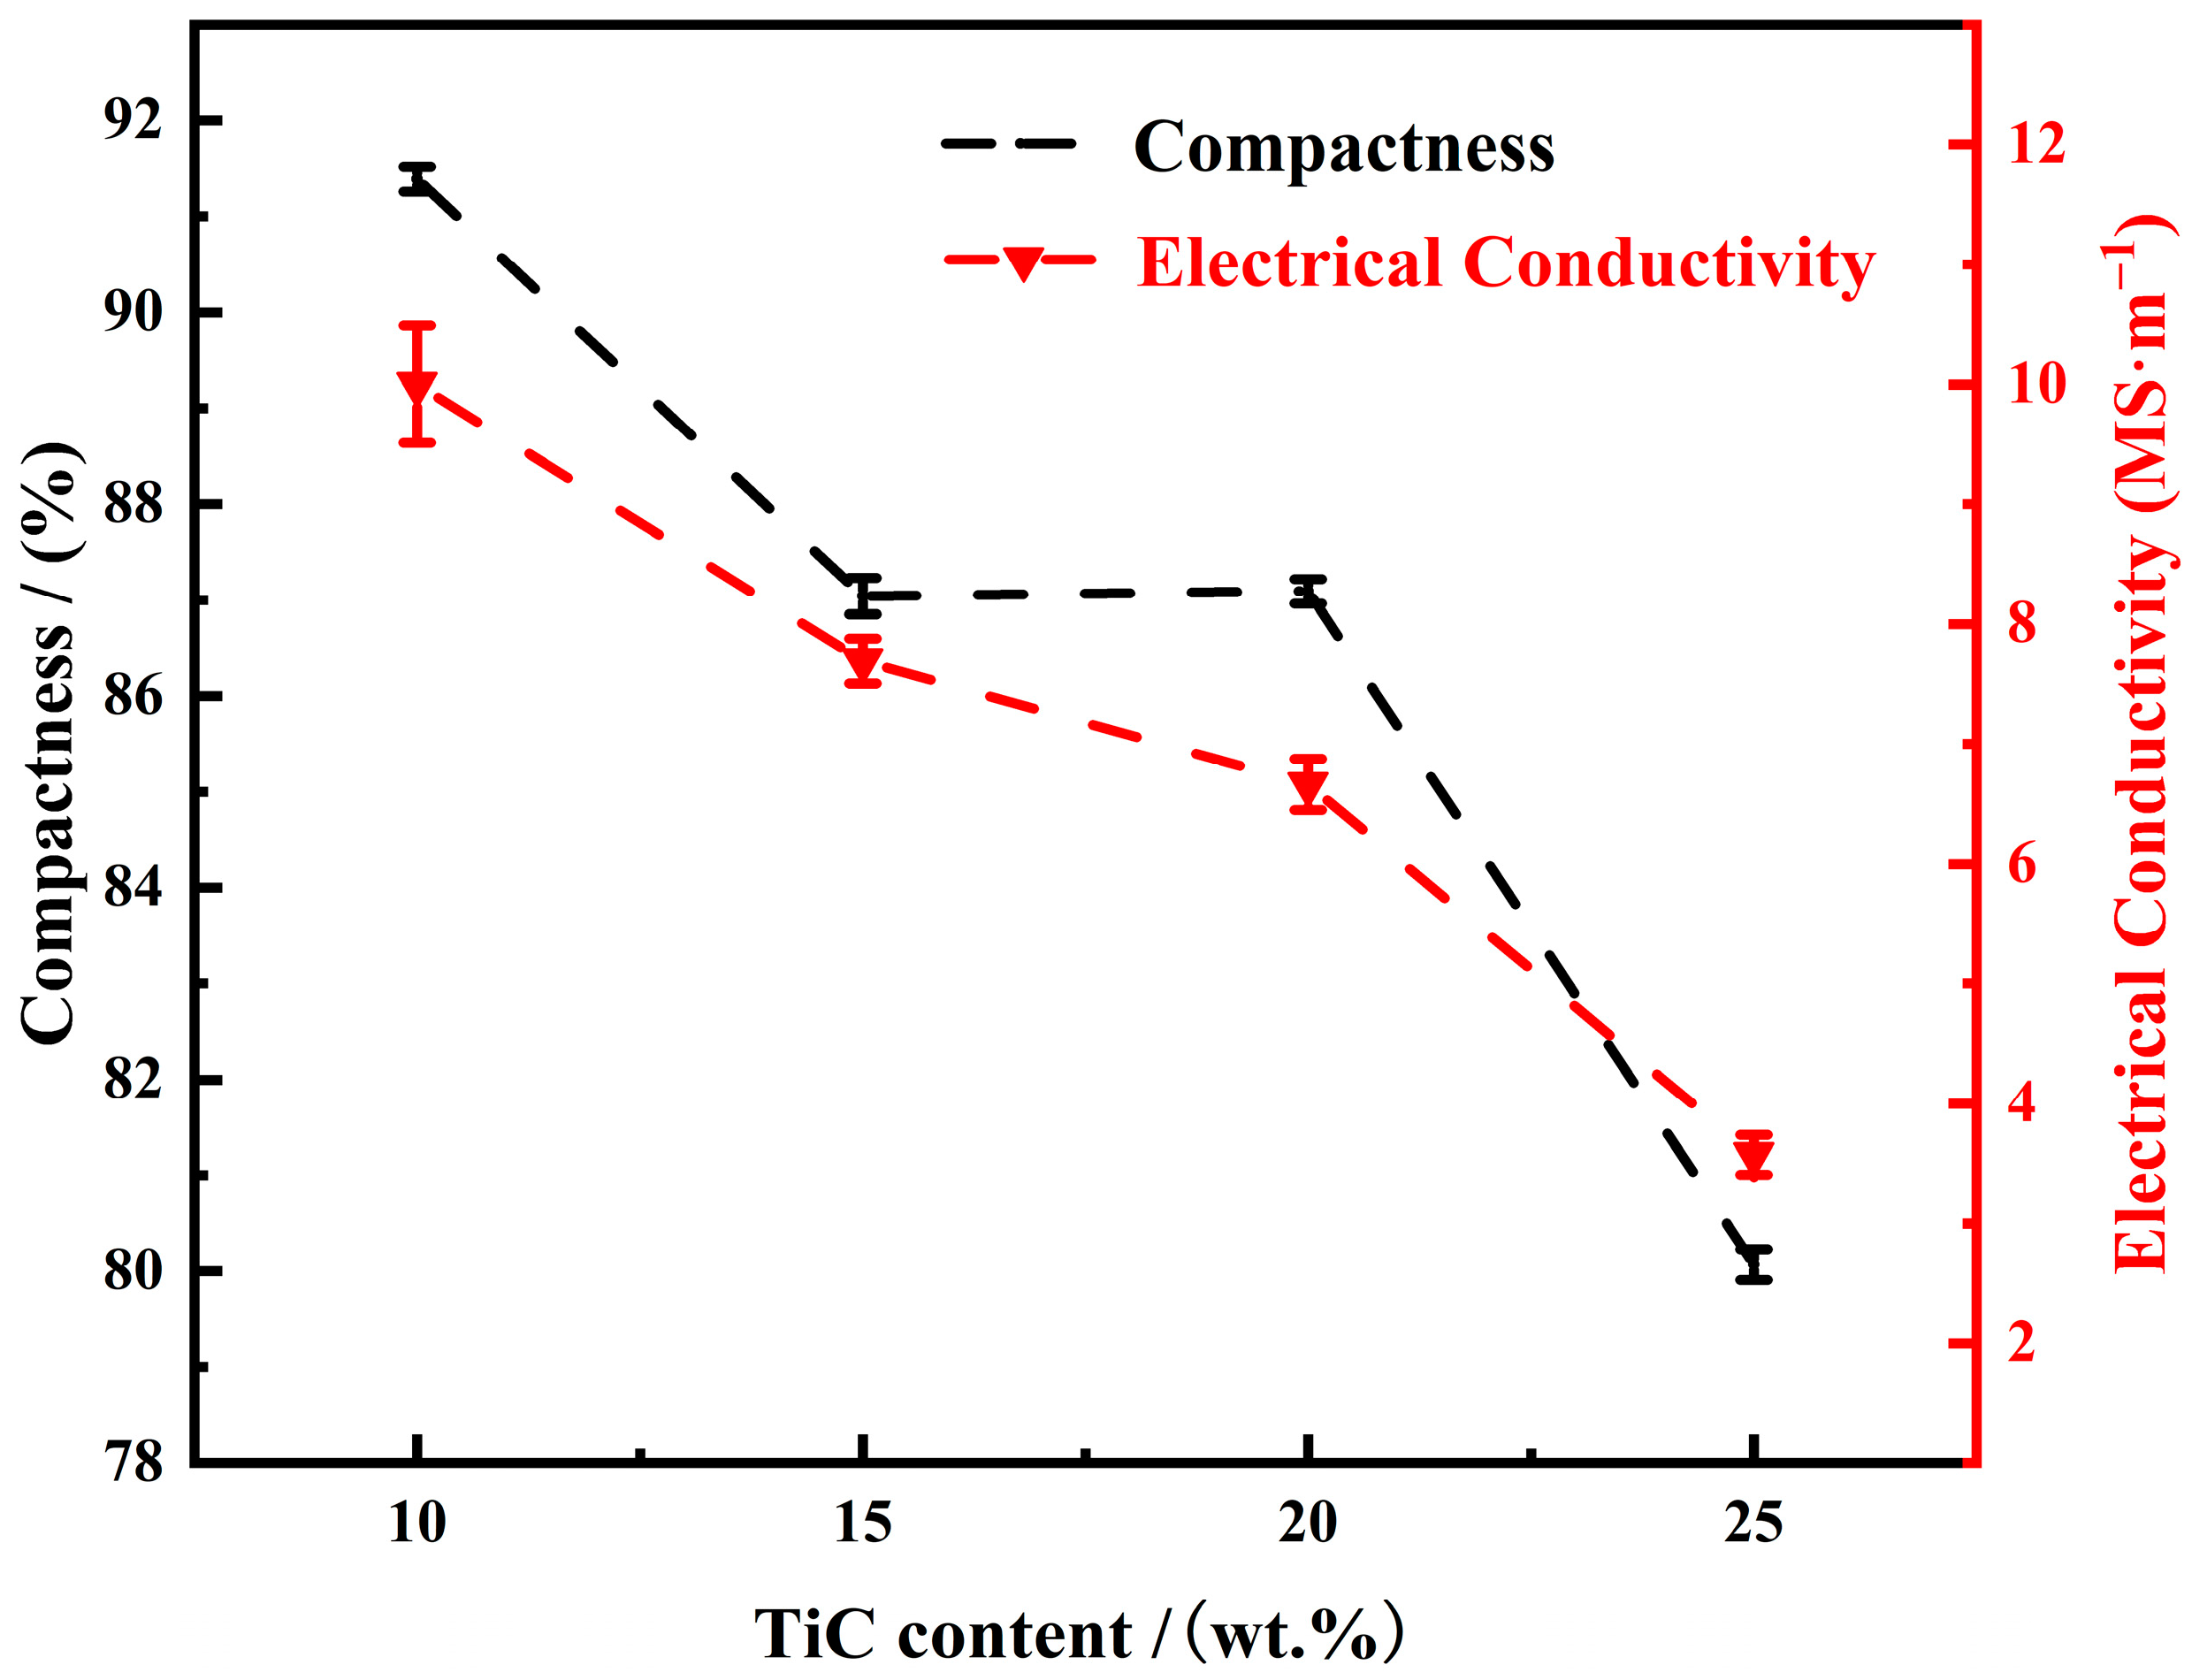
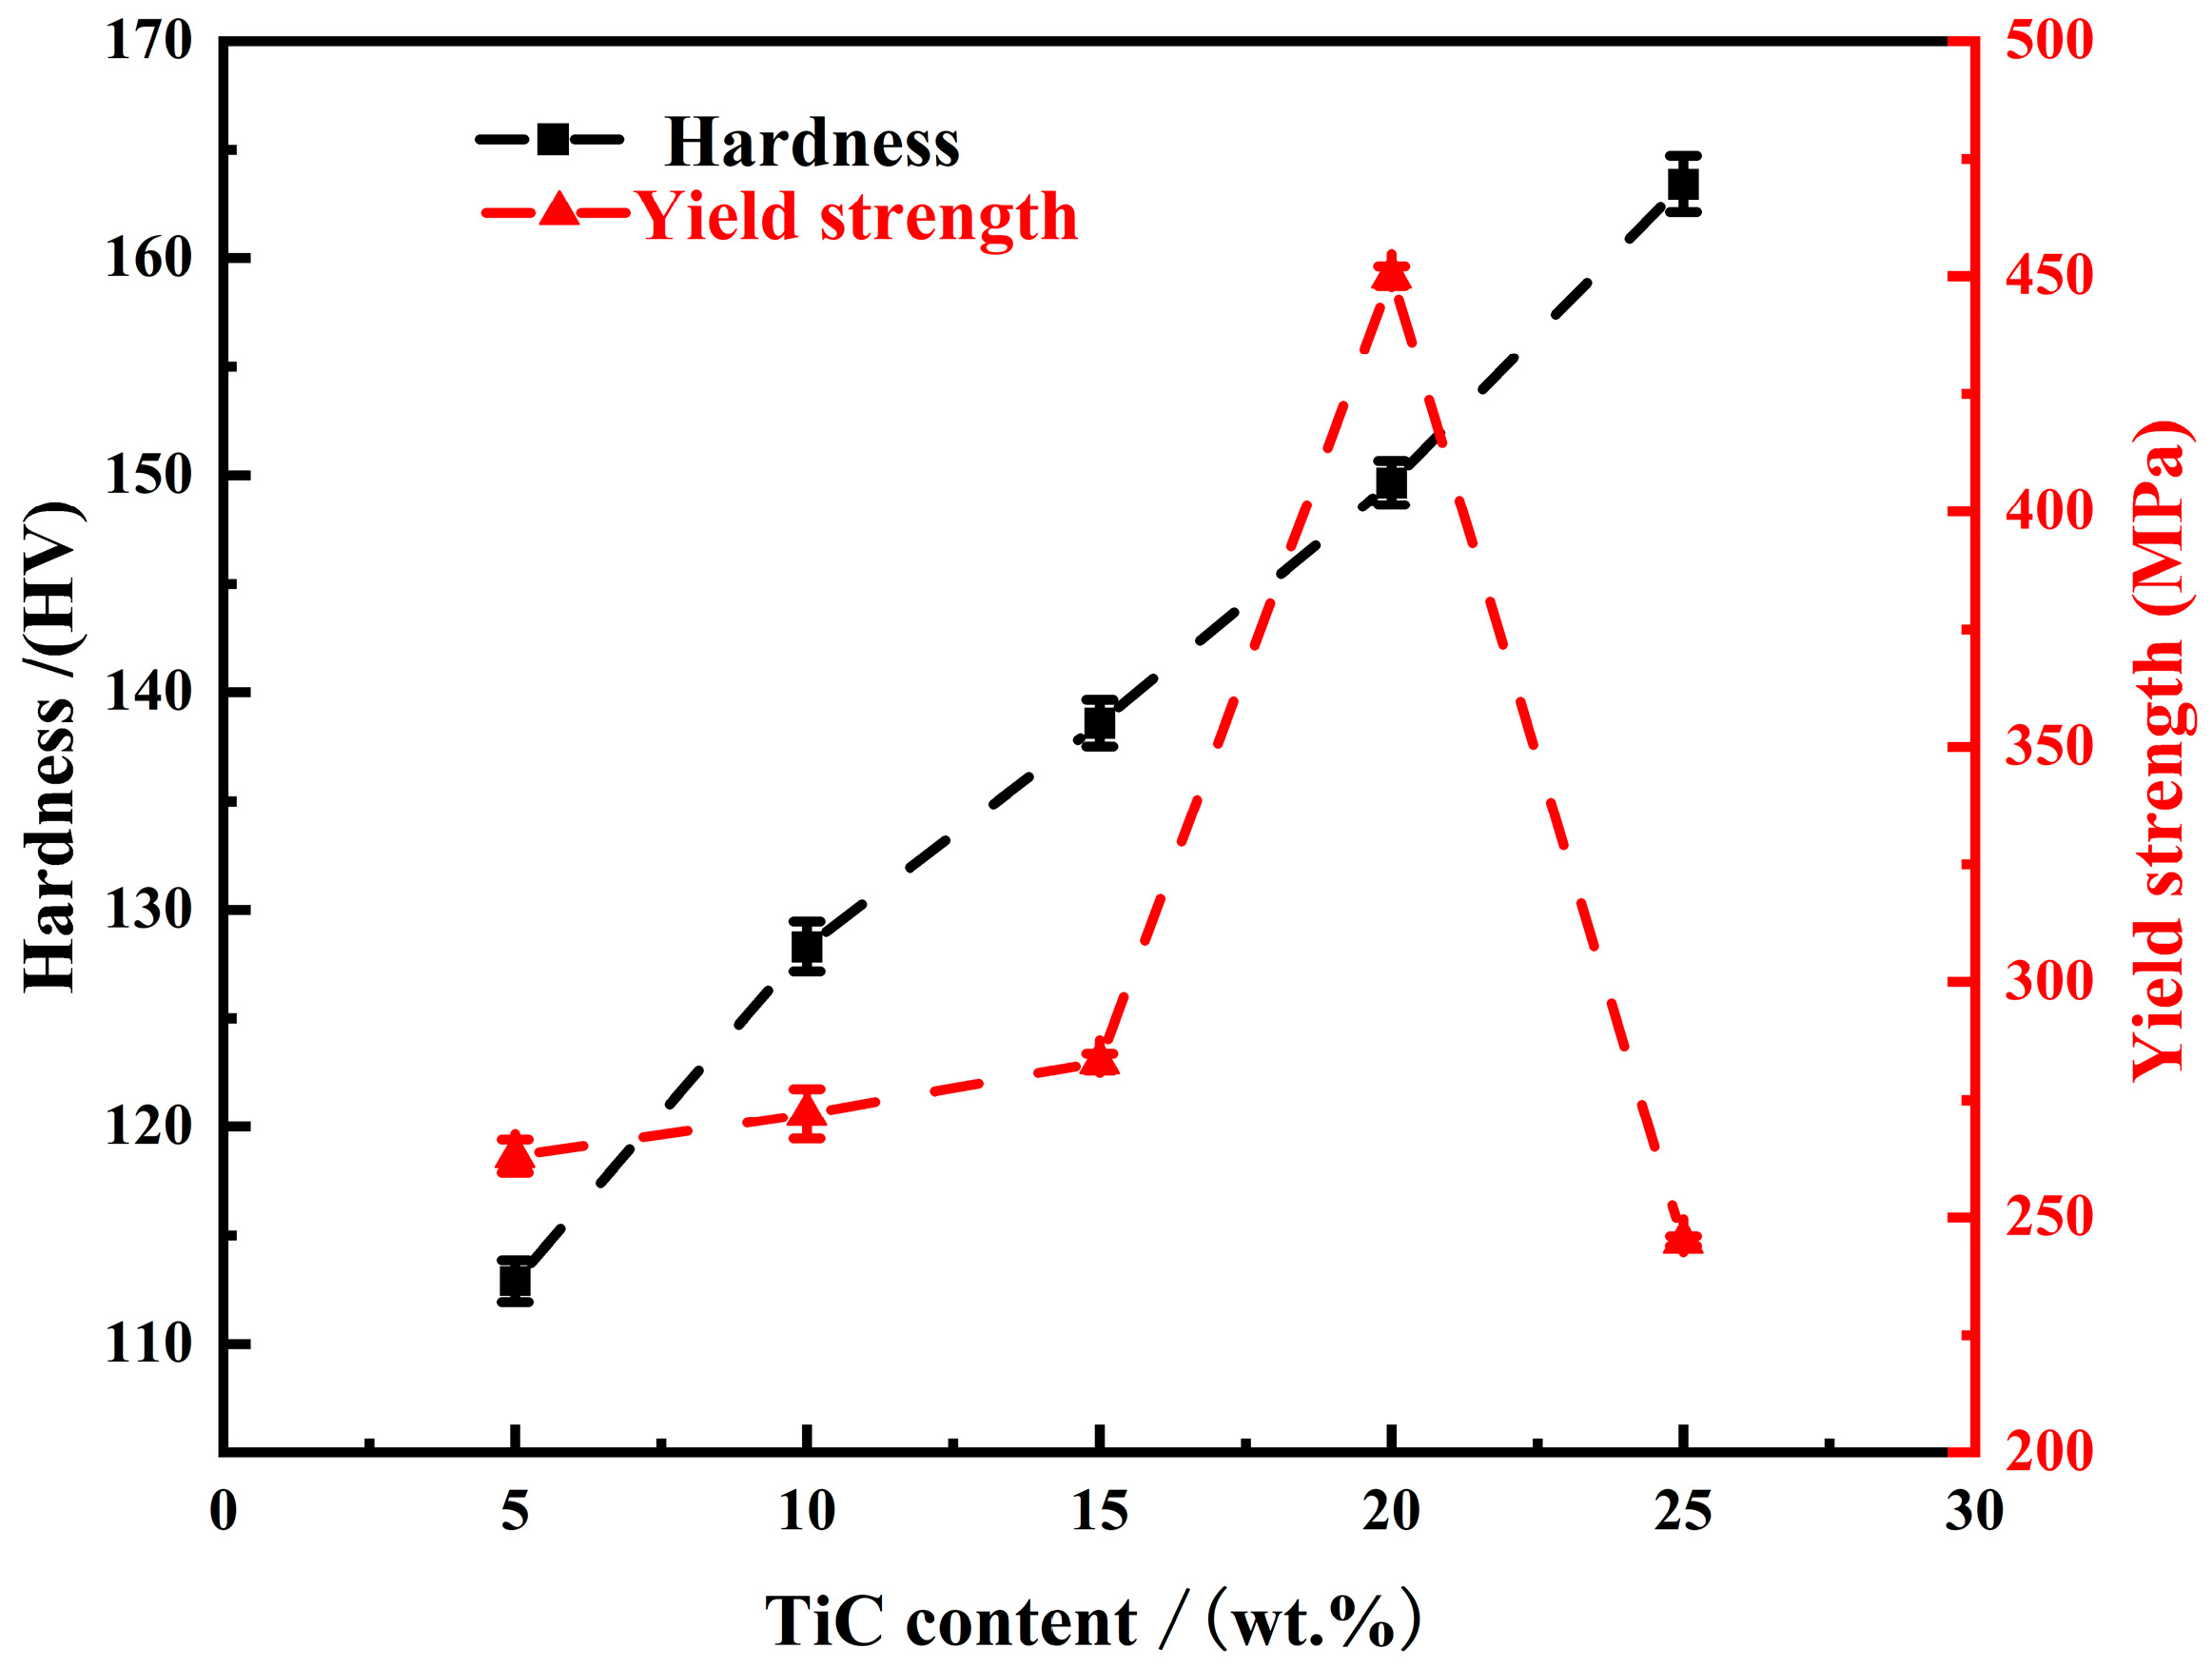
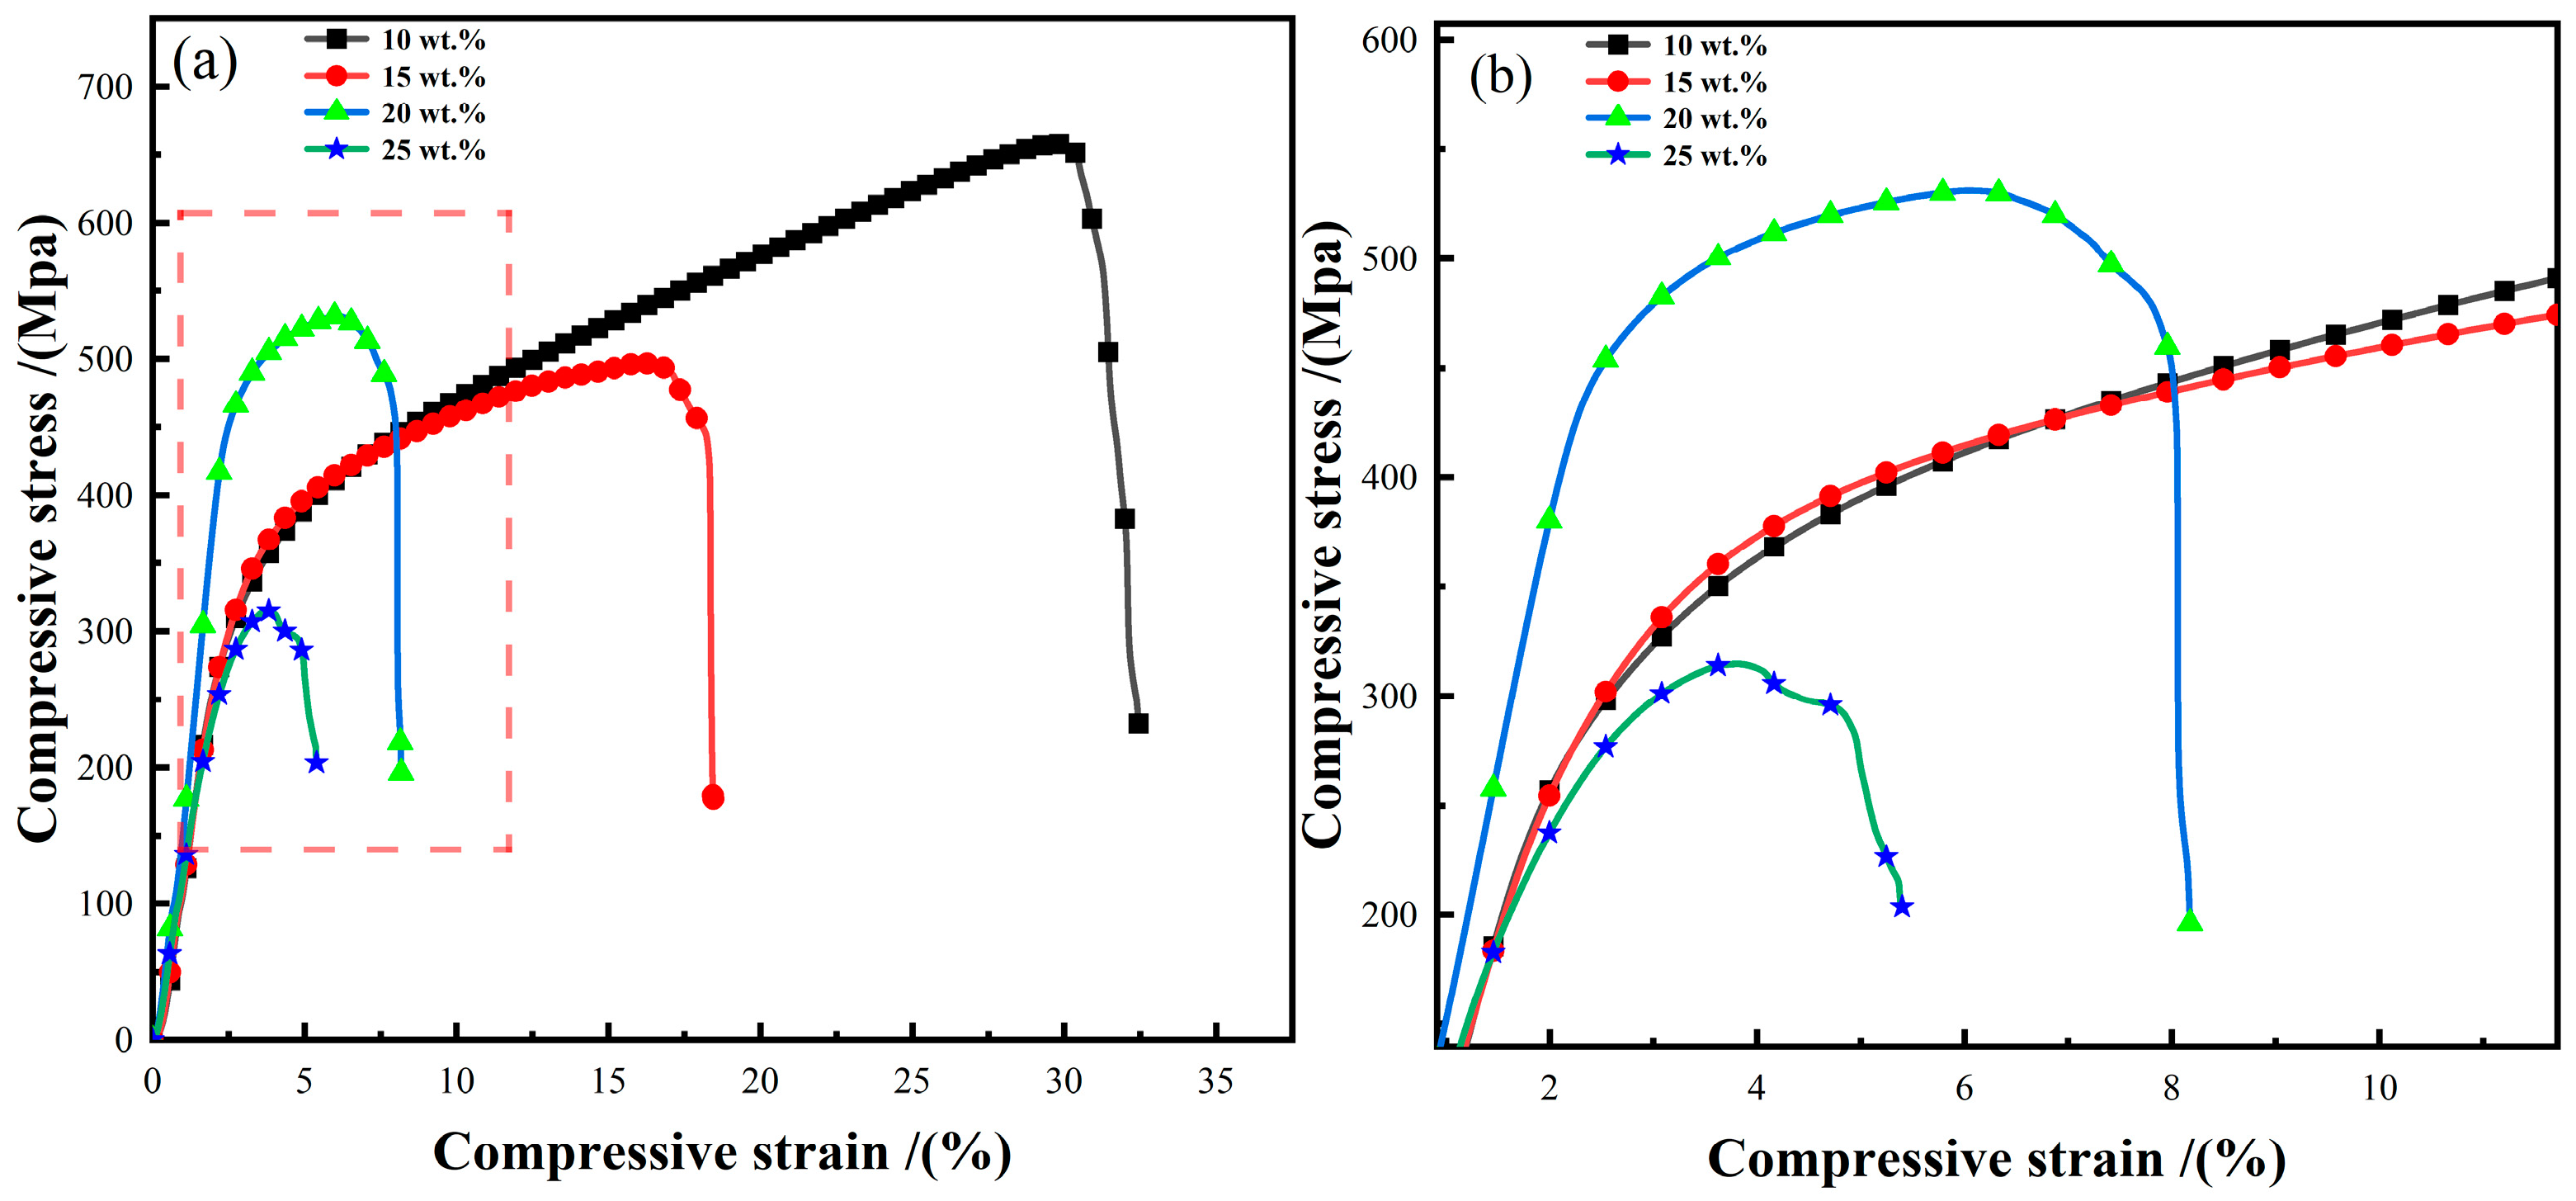
2.4. Effect of TiC Content on Electrical and Mechanical Properties of TiC/Cu Composites

Figure 8 shows the curves of electrical conductivity versus the degree of densification for TiC/Cu composites with different TiC contents. The average electrical conductivity of 5 wt.% TiC/Cu, 10 wt.% TiC/Cu, 15 wt.% TiC/Cu, 20 wt.% TiC/Cu and 25 wt.% TiC/Cu composites is 11.47 MS·m−1, 9.98 MS·m−1, 7.70 MS·m−1, 6.58 MS·m−1 and 3.57 MS·m−1, 9.98 MS·m−1, 7.70 MS·m−1, 6.58 MS·m−1 and 3.57 MS·m−1, respectively. The electrical conductivity of the composites decreases with the increase in TiC content. The trend of TiC content is consistent with the trend of densification. The effect of pores in the composites on the directional movement of electrons is more significant as the density decreases. When the mass fraction of TiC is increased from 15% to 20%, although the density of the composites only decreases by 0.3%, the conductivity still decreases by 1.12 MS·m−1, which is because the movement of the electrons in the composites is not only affected by the pores, but also by the TiC particles. The TiC particles distributed on the grain boundaries scatter the electrons more obviously with the increase in concentration, and the weak bonding surface increases. The consequent increase in weak bonding surfaces also increases the loss of electrical conductivity in the composites [23].
The variation trend of hardness and compressive yield strength of TiC/Cu composites with different TiC content is shown in Figure 9. With the increase in TiC mass fraction, the average hardness of the composite increases from 112.9 HV to 163.42 HV, and shows an increasing trend. This is because the hardness of TiC itself is much higher than that of Cu, and the increase in TiC content leads to the rising trend of hardness of TiC/Cu composites [24]. The average compressive yield strength of the composite reaches a maximum value of 451 MPa when the TiC content is 20 wt.%, and decreases significantly when the TiC content is 25 wt.%. The reason for the improvement in yield strength is that TiC itself has excellent deformation resistance (hardness 2600–3000 hv; the bending strength is 1500~2400 MPa), and the diffuse distribution of TiC particles in the Cu matrix can effectively withstand the load of external compression force. Secondly, TiC particles also play a role in preventing dislocation movement in the composite. However, when the TiC mass fraction reaches 25%, the agglomeration of TiC and the weak bonding surface between TiC and Cu cause the continuity of the Cu matrix to be seriously damaged. TiC cannot withstand the load effectively, resulting in a reduction in its yield strength. This change also causes the ductility of the composite to decrease significantly and the brittleness to increase. As shown in Figure 10, compressive stress–strain curves of TiC/Cu composites with different contents, where Figure 10b is the enlarged image of the elastic strain endpoint of the composite in box Figure 10a, it can be seen that the ductility of the composite is the best when the TiC mass fraction is 10%. The maximum compressive strength is 650 MPa. The compressive strain decreases with the increase in TiC content. It is worth noting that when the TiC mass fraction reaches 25%, the yield strength and compressive strain of the composite decrease sharply, which is due to excessive TiC aggregates and a weak bonding surface leading to serious deterioration of the mechanical properties of the composite.
This study focuses on exploring the effect of sintering temperature and TiC content on TiC/Cu composites. However, it is worth mentioning that the interfacial bond strength between TiC and Cu depends on the interfacial wettability between TiC and Cu. Xiao et al. [25] reported earlier that the Cu wetting effect on TiC is lower than the low stoichiometric composition of TiC. According to Froumin et al. [26], stoichiometric TiC is poorly wetted with Cu, and the wetting evolution of the TiC/Cu system is controlled by the partial dissolution of the TiC phase. The enhancement of TiC wettability on Cu is attributed to the transfer of Ti from the carbide phase to the solid solution. While stoichiometric TiC was used in this study, the XRD results in Figure 1 also show that the diffraction peaks of Cu are not shifted, and there is no solid solution formation, which may also be related to the fact that the sintering temperature does not reach the melting point of Cu, both of which imply that the wettability between TiC and Cu is poor.

3. Experimental Materials and Methods

3.1. Experimental Raw Materials

Titanium powder (Ti, purity: 99.90%; 200 mesh), graphite powder (C, purity: 99.90%; 100 mesh) and copper powder (Cu, purity: 99.99%; 200 mesh) were provided by Maya Reagent Co. The manufacturer is located in Urumqi, Xinjiang Uygur Autonomous Region, China.

3.2. Experimental Methods

(1)
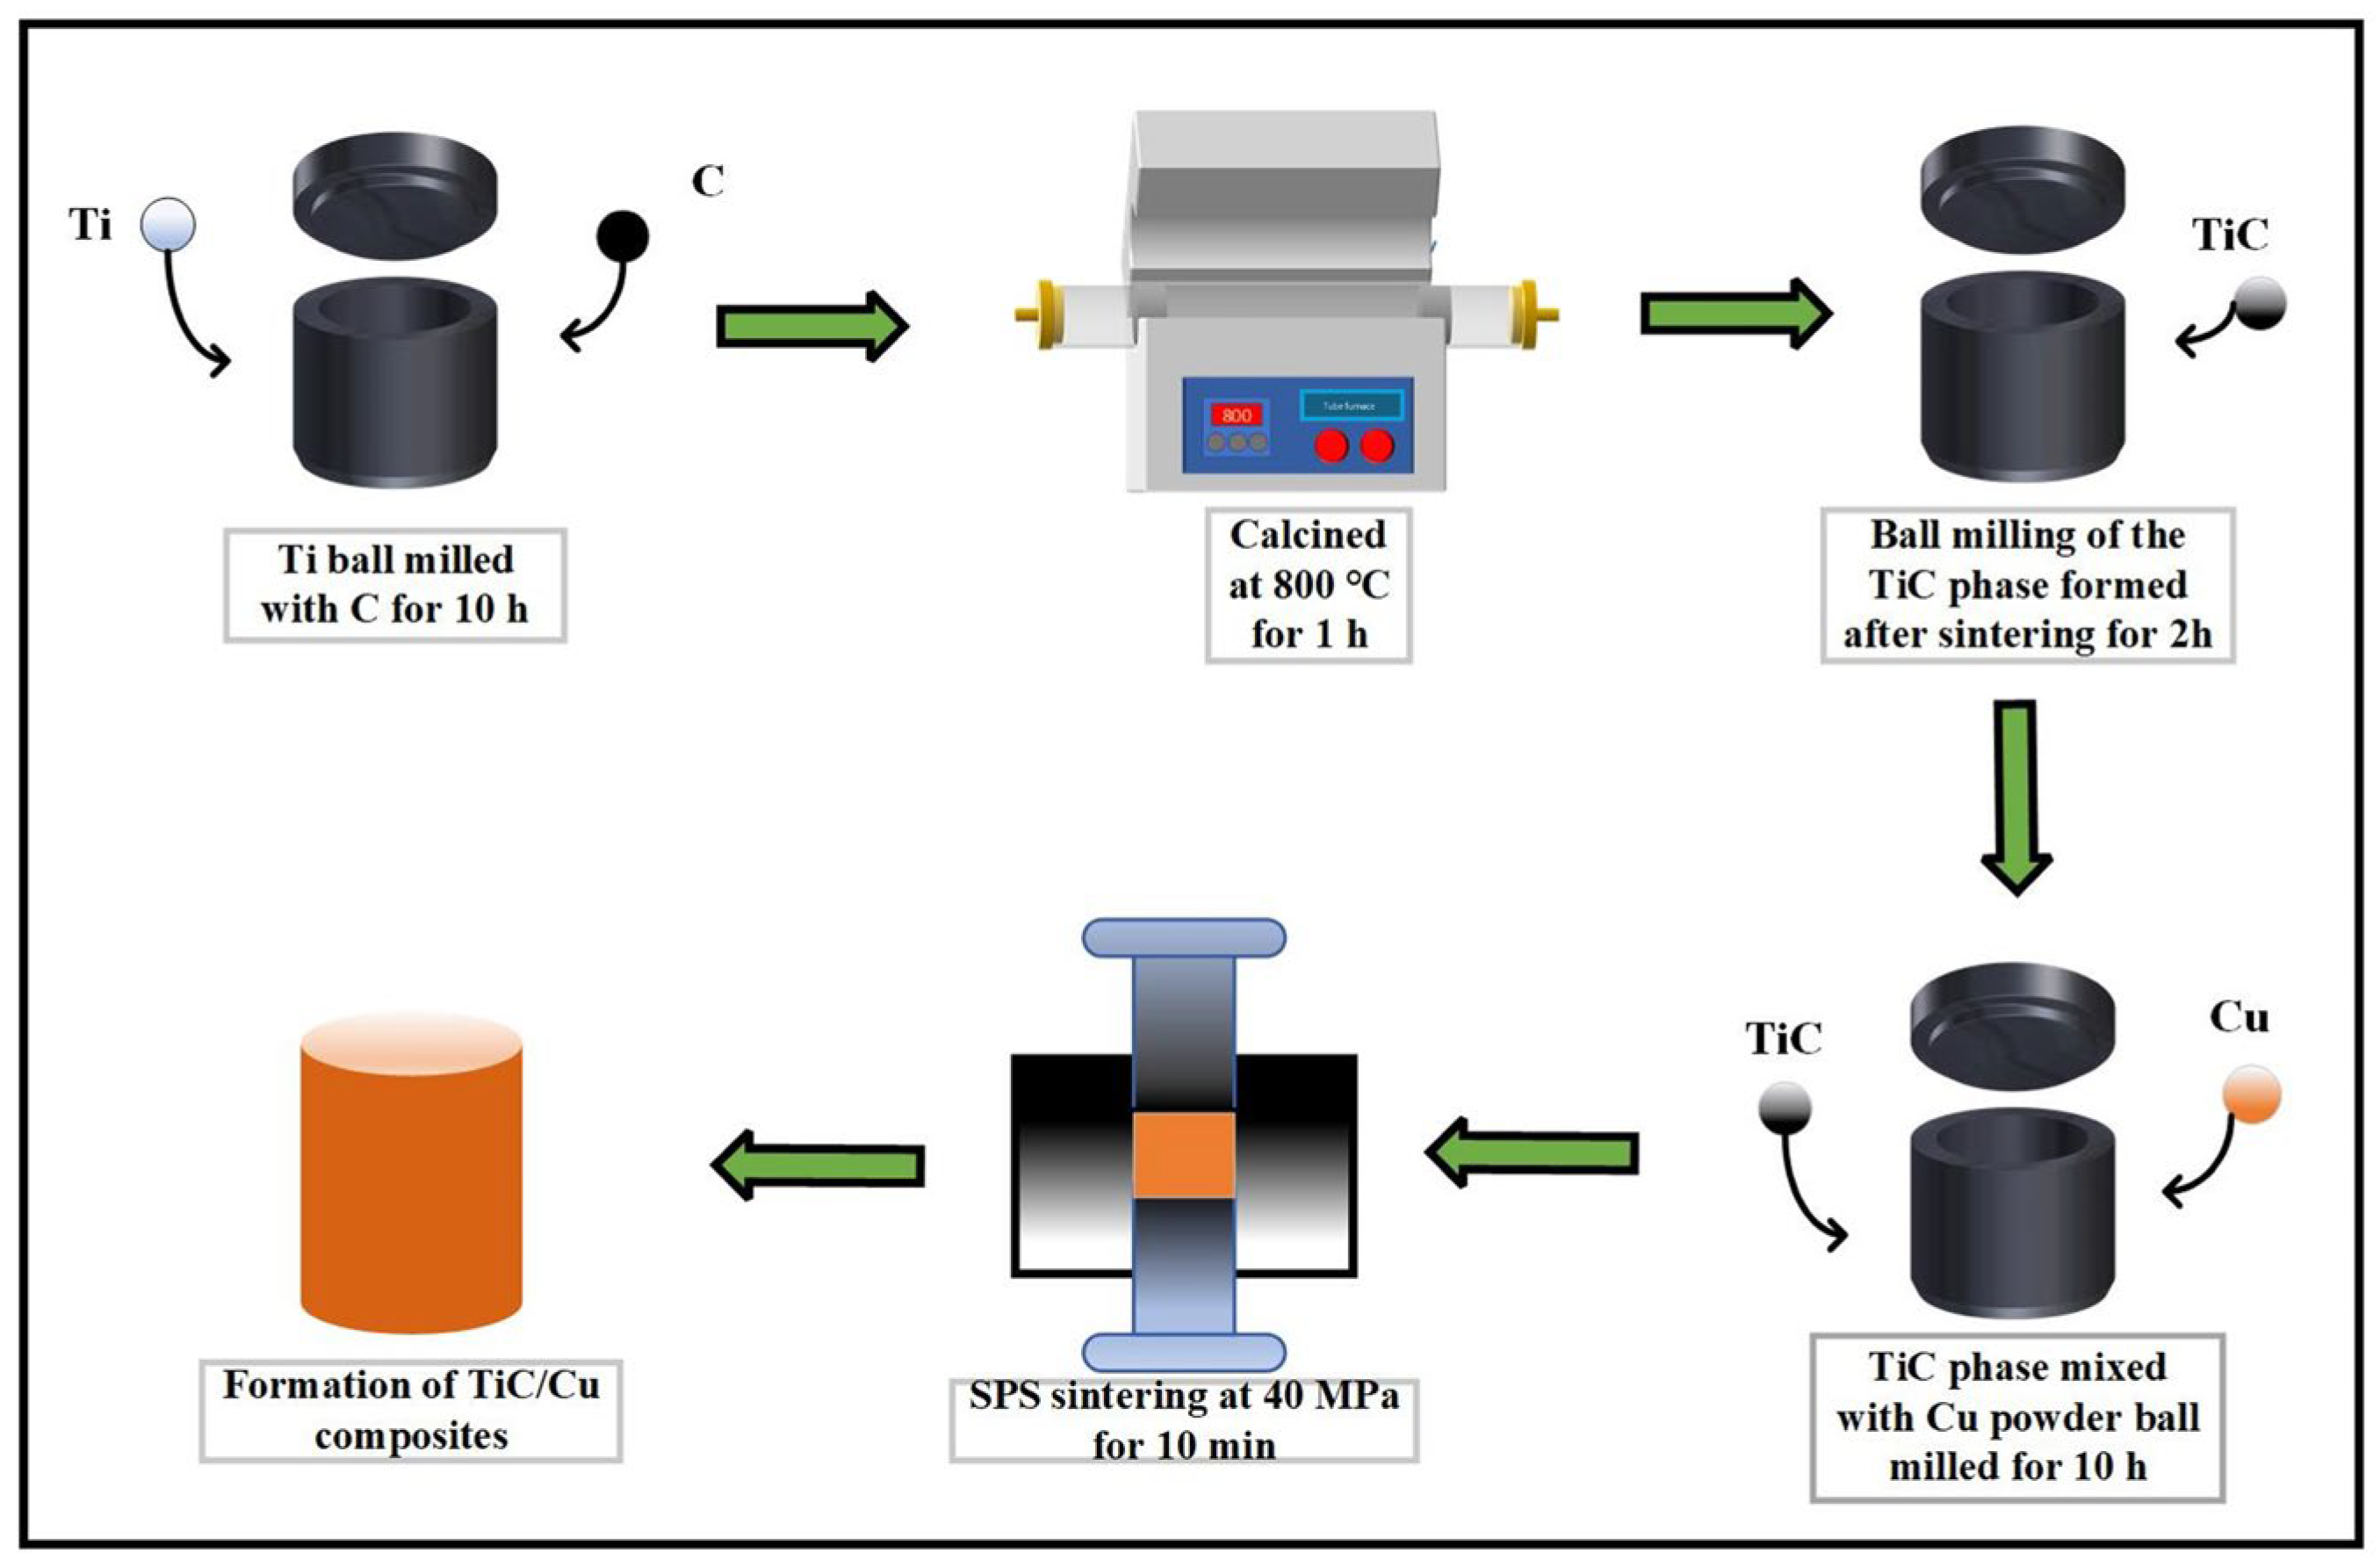
Preparation of composite powder
The process flow diagram for the preparation of TiC/Cu composites is shown in Figure 11. Ti powder and C powder were configured according to a molar ratio of 1:1.1 to ensure the complete reaction of Ti powder. The first high-energy ball milling included the following: ball material ratio of 10:1, speed of 400 r/min, 10 h in the tube furnace at 800 °C calcined 1 h, and then 200 r/min low-speed ball milling. The third ball milling was carried out at 400 r/min after adding Cu powder and mixing. Ball milling time was 10 h. All the ball milling processes were passed through argon as a protective gas to protect the powder from oxidation. Anhydrous ethanol was used as the ball milling medium.
(2)
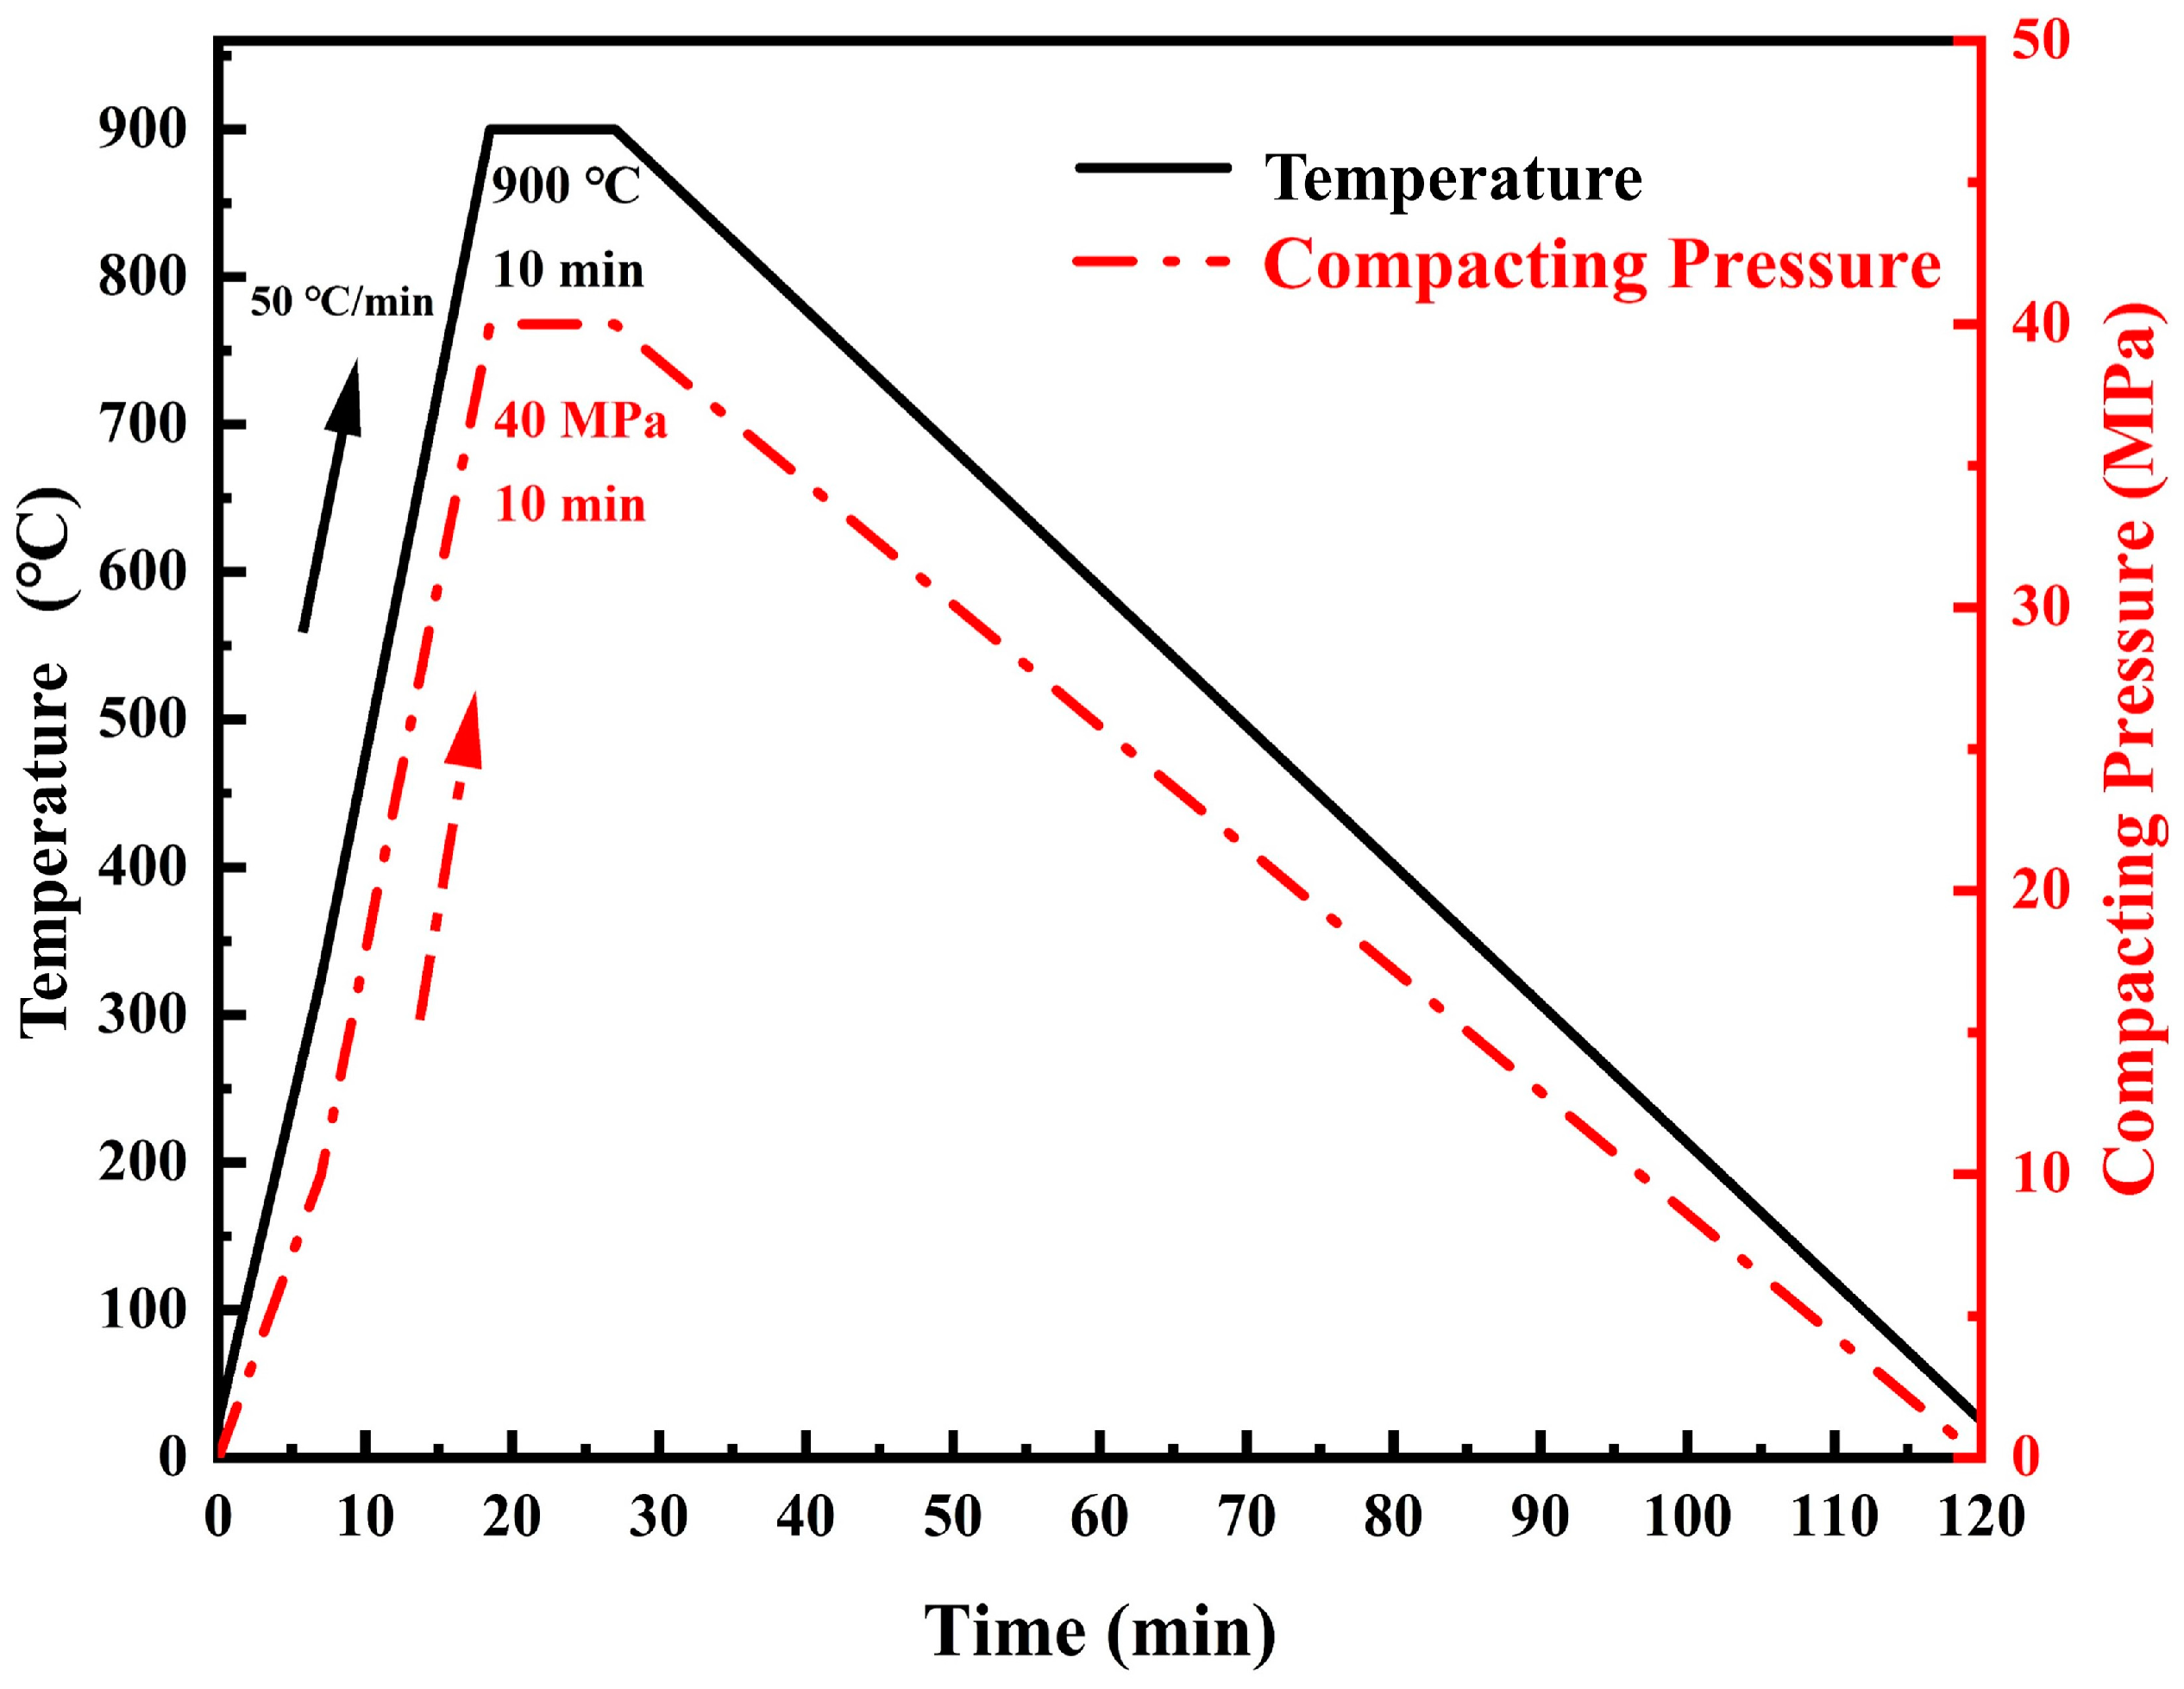
Preparation of TiC/Cu composites
Finally, TiC/Cu composites were formed by SPS sintering using a graphite abrasive with a diameter of 30 mm, a holding time of 10 min, and a uniaxial pressure of 40 MPa. The temperature was increased from 25 °C at a rate of 50 °C/min, the pressure was increased from 0, and the temperature reached the target temperature while the pressure reached the maximum value of 40 MPa. The temperature was kept warm and the pressure was maintained for 10 min, and then the temperature was naturally lowered and the pressure was lowered. The vacuum level is 10 Pa. A typical plot of SPS sintering temperature versus pressure versus time at 900 °C is shown in Figure 12.

3.3. Testing and Characterization

In this study, the phase composition of the material was analyzed using a Bruker D2 phaser X-ray diffractometer(Bruker AXS, Billerica, MA, USA) and a Cu target was used. The range of 2θ was 20–80° and the scanning speed was 5°/min. The microstructure of the composites was analyzed by a NOVA NanoSEM 230 field emission scanning electron microscope produced by FEI Company(Hillsboro, OR, USA). The resolution was 1.0 nm@15 kV in high vacuum mode, and the acceleration voltage was continuously adjustable from 200 V to 30 KV. The content and distribution of microelements in the composite were analyzed using the Oxford-X-MAX 50 energy spectrometer(Oxford Group, Oxford, UK). Its resolution was 127 ev and the detector crystal size was 50 mm2. HVS-1000A Vickers hardness(Jining Jiechen Testing Instrument Co., Ltd., Jining, China.) tester was used for hardness test, and the average hardness of five different locations of the same sample was taken as the average hardness. The density of the composite was measured using an AUY-120 densitometer(Shimadzu Corporation, Tokyo, Japan) based on the Archimedean drainage method. The compression properties of composites at room temperature were tested using a CMT5105 universal testing machine(Meters Industrial Systems (China) Co., Shenzhen, China). The cylindrical specimen with radius of 3 mm and height of 12 mm was machined with a DK7745 wire-cutting machine(C&J Machinery Co., Ltd., Dafeng, China) for a compression performance test. The electrical properties of TiC/Cu composites at room temperature at 0–5 V were measured using a lattice ST2263 double electric four-probe resistivity tester(Suzhou Lattice Electronics Co., Ltd, Suzhou, China).

4. Conclusions

(1)
In this study, TiC/particle-reinforced Cu composites with uniform particle distribution were prepared by high-energy ball milling and SPS sintering using Ti, C and Cu powders as raw materials. The effects of different SPS sintering temperatures and TiC contents on the microstructure and morphology, mechanical and electrical properties of the composites were investigated.
(2)
When the sintering temperature was 900 °C, the dispersion of TiC in the copper matrix was good. The pores were eliminated in time. The densification of 5 wt.% TiC/Cu composites reached 97.19%. The average values of conductivity, hardness and compressive yield strength reached 11.47 MS·m−1, 112.9 HV and 162 MPa, respectively, at which time the comprehensive performance of the composites were at their best. As the sintering temperature increased or decreased, the dispersion effect of TiC obviously deteriorated, and the comprehensive performance of the composites also deteriorated.
(3)
The yield strength of the composites increased with the increase in TiC content. However, the degree of agglomeration of TiC and the brittleness of the composites also increased. When the mass fraction of TuC reached 25%, the mechanical properties of the composites decreased significantly. The best overall performance of the composites was obtained when the TiC content was 10%. At that time, the yield strength was 272 MPa, the hardness was 128.3 HV, the conductivity was 9.98 MS·m−1, and the densification was 90.70%.

Author Contributions

Conceptualization, Z.Z. and C.C.; methodology, Z.Z.; software, C.S.; validation, H.D. and D.L.; formal analysis, C.C.; investigation, H.D.; resources, C.S. and Z.W.; data curation, D.L.; writing—original draft preparation, Z.Z.; writing—review and editing, C.C.; visualization, H.D.; supervision, C.C.; project administration, Z.Z.; funding acquisition, Z.W. All authors have read and agreed to the published version of the manuscript.

Funding

This study was supported by the Natural Science Foundation of Qinghai Provincial Science and Technology Department. The grant number is (2021-ZJ-706).

Data Availability Statement

Data are contained within the article.

Acknowledgments

We thank the Natural Science Foundation of Qinghai Province for its support and authors such as Zhai for their time and efforts in this study.

Conflicts of Interest

Haitao Dong, Zhe Wang, Cong Chen are currently working at Asia Silicon (Qinghai) Co. and Qinghai Minzu University. Cong Chen is also with the Qinghai Provincial Key Laboratory of Nanomaterials and Technology. The remaining authors declare that the research was conducted in the absence of any commercial or financial relationships that could be construed as a potential conflict of interest. Asia Silicon (Qinghai) Co. was not involved in the design and research of this study, nor in the writing and publication of the paper.

References

  1. Ankit; Kumar, V.; Mishra, A.; Mohan, S.; Singh, K.; Mohan, A. The effect of titanium carbide particles on microstructure and mechanical properties of copper/graphite composites prepared by flake powder metallurgy route. Mater. Today Proc. 2020, 26, 1140–1144. [Google Scholar] [CrossRef]
  2. Mohanavel, V.; Vinoth, T.; Iyankumar, R.; Vinoth, N. Mechanical and corrosion behaviour of copper matrix composites fabricated by powder metallurgy process. Mater. Today Proc. 2020, 33, 3394–3398. [Google Scholar] [CrossRef]
  3. Dong, L.; Fu, Y.; Liu, Y.; Lu, J.; Zhang, W.; Huo, W.; Jin, L.; Zhang, Y. Interface engineering of graphene/copper matrix composites decorated with tungsten carbide for enhanced physico-mechanical properties. Carbon 2021, 173, 41–53. [Google Scholar] [CrossRef]
  4. Hussain, Z.; Kit, L.C. Properties and spot welding behaviour of copper–alumina composites through ball milling and mechanical alloying. Mater. Des. 2008, 29, 1311–1315. [Google Scholar] [CrossRef]
  5. Sheibani, S.; Heshmati-Manesh, S.; Ataie, A. Structural investigation on nano-crystalline Cu–Cr supersaturated solid solution prepared by mechanical alloying. J. Alloys Compd. 2010, 495, 59–62. [Google Scholar] [CrossRef]
  6. Besterci, M.; Ivan, J.; Kováč, L.; Weissgaerber, T.; Sauer, C. Strain and fracture mechanism of Cu–TiC. Mater. Lett. 1999, 38, 270–274. [Google Scholar] [CrossRef]
  7. Wu, J.; Zhou, Y.; Wang, J. Tribological behavior of Ti2SnC particulate reinforced copper matrix composites. Mater. Sci. Eng. A 2006, 422, 266–271. [Google Scholar] [CrossRef]
  8. Huang, K.; Marthinsen, K.; Zhao, Q.; Logé, R.E. The double-edge effect of second-phase particles on the recrystallization behaviour and associated mechanical properties of metallic materials. Prog. Mater. Sci. 2018, 92, 284–359. [Google Scholar] [CrossRef]
  9. Han, L.; Wang, J.; Chen, Y.; Huang, Y.; Liu, Y.; Wang, Z. Fabrication and mechanical properties of WC nanoparticle dispersion-strengthened copper. Mater. Sci. Eng. A 2021, 817, 141274. [Google Scholar] [CrossRef]
  10. Wang, Z.; Bian, Y.; Ni, J.; Li, X.; Xu, Y.; Shao, Y.; Zhen, J.; Cai, L.; Luo, L. Tribological and electrochemical corrosion behaviors of Cu-based powder metallurgy composites reinforced by in-situ WC with different morphology. J. Mater. Res. Technol. 2022, 21, 4067–4078. [Google Scholar] [CrossRef]
  11. Frage, N.; Froumin, N.; Rubinovich, L.; Dariel, M.P. Infiltrated TiC/Cu composites. In Powder Metallurgical High Performance Materials; Plansee Holding AG: Breitenwang, Austria, 2001; pp. 202–216. [Google Scholar]
  12. Nemati, N.; Khosroshahi, R.; Emamy, M.; Zolriasatein, A. Investigation of microstructure, hardness and wear properties of Al–4.5 wt.% Cu–TiC nanocomposites produced by mechanical milling. Mater. Des. 2011, 32, 3718–3729. [Google Scholar] [CrossRef]
  13. Dinaharan, I.; Albert, T. Effect of reinforcement type on microstructural evolution and wear performance of copper matrix composites via powder metallurgy. Mater. Today Commun. 2023, 34, 105250. [Google Scholar] [CrossRef]
  14. Bagheri, G. The effect of reinforcement percentages on properties of copper matrix composites reinforced with TiC particles. J. Alloys Compd. 2016, 676, 120–126. [Google Scholar] [CrossRef]
  15. Huang, X.; Bao, L.; Bao, R.; Liu, L.; Tao, J.; Wang, J.; Zhang, Z.; Ge, Z.; Tan, S.; Yi, J.; et al. Reinforced copper matrix composites with highly dispersed nano size TiC in-situ generated from the Carbon Polymer Dots. Adv. Powder Mater. 2023, 2, 00090. [Google Scholar] [CrossRef]
  16. Zhu, J.; Li, J.; Liu, T.; Chen, Z.; Fang, H.; Xiao, P.; Kong, F. Differences in mechanical behaviors and characteristics between natural graphite/copper composites and carbon-coated graphite/copper composites. Mater. Charact. 2020, 162, 110195. [Google Scholar] [CrossRef]
  17. El-Eskandarany, M.S. Mechanical Alloying: For Fabrication of Advanced Engineering Materials; William Andrew: Norwich, NY, USA, 2001. [Google Scholar]
  18. Shehata, F.; Fathy, A.; Abdelhameed, M.; Moustafa, S. Fabrication of copper–alumina nanocomposites by mechano-chemical routes. J. Alloys Compd. 2009, 476, 300–305. [Google Scholar] [CrossRef]
  19. Duan, B.H.; Zhou, Y.; Wang, D.C. Effect of microwave sintering temperature on the structure and properties of CNTs/Cu composites. Powder Metall. Technol. 2018, 5, 323–330. [Google Scholar]
  20. Zhang, X.; Peng, K.; Cao, E.B.; Gao, Q.; Song, M. Effect of hot pressing temperature on the organization and properties of graphene copper matrix composites. Therm. Process. Technol. 2020, 49, 5. [Google Scholar]
  21. Yue, H.; Yao, L.; Gao, X.; Zhang, S.; Guo, E.; Zhang, H.; Lin, X.; Wang, B. Effect of ball-milling and graphene contents on the mechanical properties and fracture mechanisms of graphene nanosheets reinforced copper matrix composites. J. Alloys Compd. 2017, 691, 755–762. [Google Scholar] [CrossRef]
  22. Jingwei, L.I.; Ming, W.E.; Zengwu, Z.H. Effect of NbC particles on the properties of copper matrix composites. Nonferrous Met. Eng. 2023, 13, 30–36. [Google Scholar]
  23. Wang, H.S.; Chen, H.G.; Gu, J.W.; Hsu, C.E.; Wu, C.Y. Effects of heat treatment processes on the microstructures and properties of powder metallurgy produced Cu–Ni–Si–Cr alloy. Mater. Sci. Eng. A 2014, 619, 221–227. [Google Scholar] [CrossRef]
  24. Zhang, P.; Guo, B.; Zhou, S.; Zhang, Z.; Li, W. Study on Sliding Wear Characteristics of Tungsten Carbide Particle Reinforced Copper Matrix Composites Under Electrical Contact. Tribol. Trans. 2023, 66, 292–301. [Google Scholar] [CrossRef]
  25. Xiao, P.; Derby, B. Wetting of titanium nitride and titanium carbide by liquid metals. Acta Mater. 1996, 44, 307–314. [Google Scholar] [CrossRef]
  26. Froumin, N.; Frage, N.; Polak, M.; Dariel, M.P. Wetting phenomena in the TiC/(Cu–Al) system. Acta Mater. 2000, 48, 1435–1441. [Google Scholar] [CrossRef]
Figure 1. (A) XRD of TiC/Cu composite powders with different TiC contents, [(a–e), 5 wt.%; 10 wt.%; 15 wt.%; 20 wt.%; 25 wt.% TiC/Cu]; (B) XRD plots of 5 wt.% TiC/Cu composites at different sintering temperatures, [(a–d),T850TiC/Cu; T900TiC/Cu; T950TiC/Cu; T1000TiC/Cu].
Inorganics 12 00120 g001
Figure 2. SEM images of 5 wt.% TiC/Cu composites at different SPS sintering temperatures: [(a) T850TiC/Cu; (b) T900TiC/Cu; (c) T950TiC/Cu; (d) T1000TiC/Cu; (e) porosity of T850 TiC/Cu; (f) porosity of T1000 TiC/Cu.].
Inorganics 12 00120 g002
Figure 3. Elemental distribution of T950TiC/Cu composites. (a) Agglomeration morphology of TiC particles; (b) Distribution image of Ti elements; (c) Distribution image of C elements; (d) Distribution image of Cu elements.
Inorganics 12 00120 g003
Figure 4. Trends of conductivity and densification of TiC/Cu composites with different sintering temperatures.
Inorganics 12 00120 g004
Figure 5. Effect of sintering temperature on hardness and yield strength of 5 wt.% TiC/Cu composites.
Inorganics 12 00120 g005
Figure 6. Compressive stress-strain curves of 5 wt.% TiC/Cu composites at different sintering temperatures: [(a): compression curve; (b): end points of elastic strain in the box area in (a)].
Inorganics 12 00120 g006
Figure 7. SEM images of T900TiC/Cu composites with different TiC contents: [(a) 10 wt.% TiC/Cu; (b) 15 wt.% TiC/Cu; (c) 20 wt.% TiC/Cu; (d) 25 wt.% TiC/Cu; (e,f) TiC agglomerated in 20 wt.% TiC/Cu].
Inorganics 12 00120 g007
Figure 8. Variation curves of conductivity and densification of T900TiC/Cu composites with different TiC contents.
Inorganics 12 00120 g008
Figure 9. Variation curves of hardness and compressive yield strength of TiC/Cu composites with different TiC contents.
Inorganics 12 00120 g009
Figure 10. Compressive stress-strain curves of TiC/Cu composites with different TiC contents: [(a): image of the compression curve; (b): magnified image of the elastic strain endpoint of the composite].
Inorganics 12 00120 g010
Figure 11. Preparation process of TiC/Cu composites.
Inorganics 12 00120 g011
Figure 12. A typical plot of SPS sintering temperature versus pressure versus time at 900 °C.
Inorganics 12 00120 g012
Table 1. Theoretical density, actual density and porosity of 5 wt.% TiC/Cu composites with different SPS sintering temperatures.
Composite MaterialTheoretical Density (g·cm−3)Actual Density (g·cm–3)Porosity (%)
T850TiC/Cu8.578.174.67 ± 0.12
T900TiC/Cu8.578.332.81 ± 0.22
T950TiC/Cu8.578.233.97 ± 0.12
T1000TiC/Cu8.578.204.40 ± 0.14
Table 2. Theoretical density, actual density and porosity of T900TiC/Cu composites with different TiC content.
Composite MaterialTheoretical Density (g·cm−3)Actual Density (g·cm–3)Porosity (%)
5 wt.% TiC/Cu8.578.332.81 ± 0.22
10 wt.% TiC/Cu8.257.499.30 ± 0.13
15 wt.% TiC/Cu7.956.9912.00 ± 0.22
20 wt.% TiC/Cu7.676.6513.30 ± 0.13
25 wt.% TiC/Cu7.415.9819.30 ± 0.19
Disclaimer/Publisher’s Note: The statements, opinions and data contained in all publications are solely those of the individual author(s) and contributor(s) and not of MDPI and/or the editor(s). MDPI and/or the editor(s) disclaim responsibility for any injury to people or property resulting from any ideas, methods, instructions or products referred to in the content.

