Article

Physicochemical and Toxicological Screening of Silver Nanoparticle Biosynthesis from Punica granatum Peel Extract

by
Oana Silvana Sarău
1,2,
Elena-Alina Moacă
3,4,*,
Alexandra-Denisa Semenescu
3,4,
Raluca Dumitru
5,
Alex-Robert Jijie
3,4,
Marioara Poenaru
1,
Cristina-Adriana Dehelean
3,4 and
Adelina Chevereşan
1
1
Faculty of Medicine Timisoara, “Victor Babeş” University of Medicine and Pharmacy, 2nd Eftimie Murgu Square, 300041 Timisoara, Romania
2
Hematology Department, the Municipal Emergency Clinical Hospital Timisoara, Gh. Dima Street, No. 5, 300254 Timisoara, Romania
3
Faculty of Pharmacy Timisoara, “Victor Babeş” University of Medicine and Pharmacy, 2nd Eftimie Murgu Square, 300041 Timisoara, Romania
4
Research Centre for Pharmaco-Toxicological Evaluation, “Victor Babeş” University of Medicine and Pharmacy, 2nd Eftimie Murgu Square, 300041 Timisoara, Romania
5
Faculty of Industrial Chemistry and Environmental Engineering, “Politehnica” University of Timisoara, 2nd Victoriei Square, 300006 Timisoara, Romania
*
Author to whom correspondence should be addressed.
Inorganics 2024, 12(6), 160; https://doi.org/10.3390/inorganics12060160
Submission received: 3 May 2024 / Revised: 29 May 2024 / Accepted: 1 June 2024 / Published: 4 June 2024

Abstract

:
Silver nanoparticles (AgNPs) were successfully synthesized via the biological route using a 1 M silver nitrate (AgNO3) aqueous solution and an ethanolic peel extract of Punica granatum (Pg), at 60 °C. The physicochemical analysis revealed the formation of green synthesized Pg-AgNPs with a semi-spherical shape, non-uniformly distributed, and a particle size distribution between 5 and 100 nm. As regards the preliminary in vitro toxicological screening, the green synthesized Pg-AgNPs did not significantly affect the neonatal BALB/c epidermal cells’ viability (JB6 Cl 41-5a) at lower concentrations and did not produce visible changes in the morphology of the JB6 Cl 41-5a cells. In contrast, at higher concentrations (>50 μg/mL), the green Pg-AgNPs exhibited an important decrease in cell viability and confluency. In addition, the impact of Pg-AgNPs on cell membrane integrity suggests a potential cytotoxic effect. Contrary to the in vitro assays, after the evaluation of the anti-irritant effect in ovo, the lower concentration of Pg-AgNPs (10 μg/mL) produced hemorrhage and lysis when applied to the chorioallantoic membrane, while at 50 μg/mL, only slight coagulation was observed. Therefore, regarding the in ovo toxicological screening, the higher concentration of the Pg-AgNPs exhibited a better safety profile compared to the lower concentration, as indicated by the irritation score.

1. Introduction

Green nanotechnology, a field that combines nanotechnology with green chemistry principles, has garnered significant attention for its potential applications in medicine. This approach emphasizes the sustainable and environmentally friendly production of nanomaterials, offering a promising avenue for advancements in biomedicine while prioritizing environmental and health considerations [1,2]. By utilizing biological entities (e.g., plant extracts, fungi, algae, bacteria, viruses, yeast, etc.), green nanotechnology has facilitated the creation of various nanoparticles such as metallic, polymeric, and lipid-based nanoparticles, each possessing unique properties suitable for therapeutic applications [3,4,5]. These green synthesized nanoparticles have demonstrated great potential in addressing biofilm formation, infectious diseases, cancer, and drug-resistant bacteria due to their distinct physicochemical characteristics and biocompatibility [6,7,8].
Punica granatum, commonly known as the pomegranate, is a plant with a rich history of traditional medicinal uses. Research has shown that P. granatum exhibits a wide range of pharmacological properties and health benefits, highlighting its therapeutic effects in various conditions such as diabetes, cardiovascular diseases, cancer, inflammation, and gastrointestinal issues [9,10,11,12,13]. It was stated that extracts of various parts of P. granatum have an important role in reducing osteoporosis, as well as a gastro-protective effect through the inhibition of gastric mucosal injury [14,15].
The green synthesis of silver nanoparticles (AgNPs) has gained significant attention due to both its eco-friendly nature and potential applications in various fields. The protocol is based on the reduction of silver ions (Ag+) to metallic silver nanoparticles (Ag0) using natural sources such as plant extracts, microorganisms, and other environmentally friendly materials [16]. These methods offer cost-effective, biocompatible, and safe approaches for synthesizing AgNPs [17]. The green synthesis of AgNPs from P. granatum offers a sustainable and cost-effective method with diverse applications, including in medicine. Utilizing extracts from P. granatum not only provides a green alternative to traditional nanoparticle synthesis methods but also leverages the bioactive compounds present in the plant to enhance nanoparticle functionalities. In AgNP synthesis, the P. granatum has been found to act as a reducing and capping agent, contributing to the eco-friendliness of the process [18,19]. The most investigated part of P. granatum is the leaf. The aqueous leaf extract is effectively used in the biomedical domain, showing antimicrobial properties [20,21,22], antioxidant effects [23], and potential anticancer activity [18,24]. The peel extract of P. granatum has been used for the synthesis of AgNPs and Ag/GO nanocomposites, highlighting the potential of utilizing waste materials in nanoparticle production [25].
After synthesis and physicochemical characterization, the biological screening of AgNPs is underscored through in vitro and in vivo studies, to establish their efficacy in biomedical applications. In vitro studies are the first performed using various components of an organism, like the cells, microorganisms, or biological molecules. Although these types of studies allow detailed and safely conducted experiments, sometimes it is very difficult to extrapolate the results of an in vitro test, due to the absence of biokinetics [26]. In addition to the in vitro studies, there are the in vivo studies conducted in living organisms, usually animals (preclinical tests). Lately, the use of animal experimentation for medical purposes has become an international concern, due to ethical and legally restrictive perspectives. Therefore, many international organizations and scientific committees have contributed to the development and validation of alternative in vivo models, even in vitro, based on innovative technologies (e.g., three-dimensional (3D) cell culture (organoids and spheroids)) [27] and human reconstructed microtissue models [28,29]), to reduce or avoid the use of animals, following the “3R” rule (replacement, refining, and reduction). In ovo studies utilizing the chick chorioallantoic membrane (CAM) model represent a valuable alternative to traditional in vivo experimentation, described for the first time by Leighton et al. [30]. In nanotoxicological research, the CAM assay underscores its utility in assessing the toxicological impact of nanoparticles, by offering enhanced accessibility to the CAM surface and improved visibility for studying the effects of nanomaterials [31]. Moreover, the CAM model serves as an excellent tool for evaluating the biocompatibility and angiogenic responses of biomaterials, providing insights into their potential applications in tissue engineering and regenerative medicine [32]. Due to its simplicity, easy accessibility, low cost, reliability, and reproducibility, the CAM experimental model can be considered a complementary test for biological screening, capable of predicting the capacity of green synthesized nanoparticles in living organisms.
Thus, the aim of the present work is focused on the green synthesis of AgNPs using the ethanolic extract of Punica granatum peel (Pg), followed by the physicochemical characterization of the pre-formed Pg-AgNPs. The novelty of the present work relies on the preliminary toxicological screening, in vitro and in ovo, after which we will be able to draw a safety profile regarding the use of the green synthesized Pg-AgNPs. In this regard, the in vitro model employed was based on the neonatal BALB/c epidermal cells (JB6 Cl 41-5a). To the best of our knowledge, this is the first study that deals with the use of green-synthesized Pg-AgNPs on healthy murine epidermal cells, as well as the first study in which the green-synthesized Pg-AgNPs are investigated in an in ovo model, such as the CAM assay. Following this study, we believe that we will be able to extrapolate the in vitro outcomes obtained from healthy 2D murine epidermal cells to healthy/tumor 2D human cells and even to 3D human reconstructed microtissue models. In addition, due to the promising outcomes regarding the biological activity of green Pg-AgNPs, this study could provide a starting point to further investigate their effects on angiogenesis and potentially other biological processes, thus underscoring their utility in cancer therapy.

2. Results

2.1. Physicochemical Characterization of Green Synthesized Pg-AgNPs

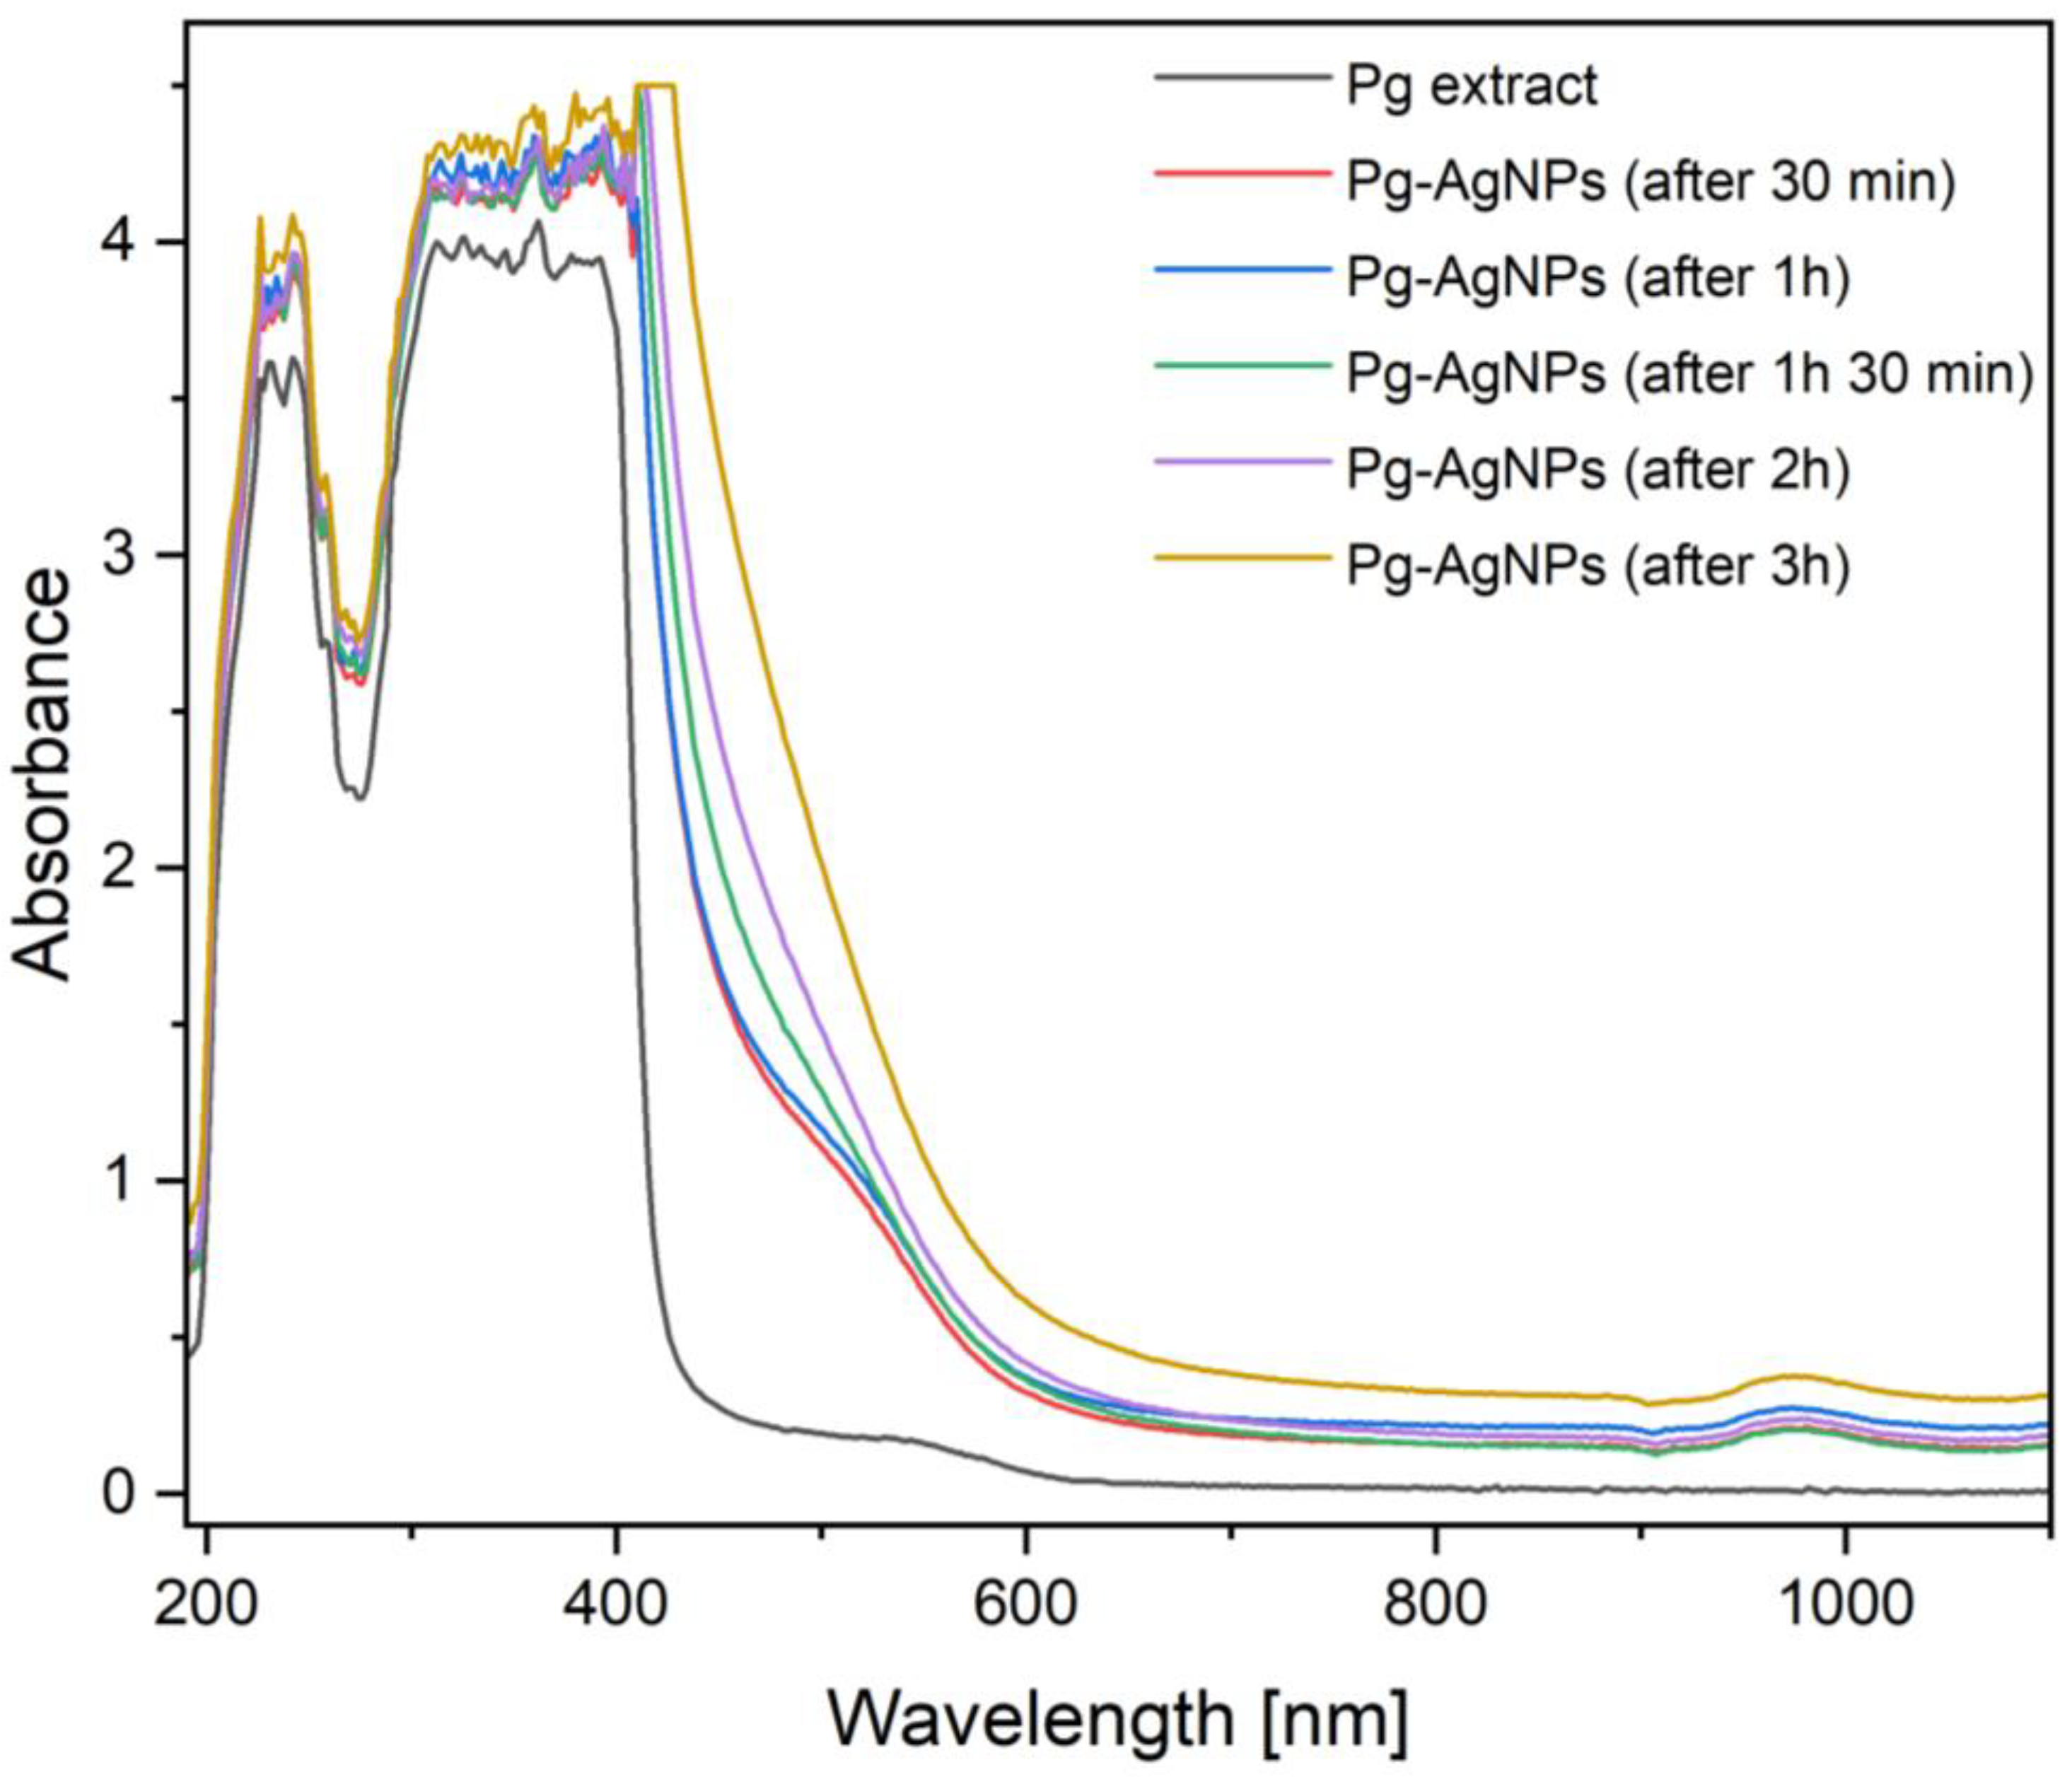
2.1.1. UV–Visible Spectroscopy

Figure 1 shows the UV–Vis spectra of green Pg-AgNPs synthesized using a Pg peel ethanolic extract, at different time intervals. First, the Pg ethanolic extract was analyzed (black band), and the absorbance band had a maximum peak at 362 nm with an intensity of 4.067. Upon the addition of AgNO3 solution (1 M) to the Pg peel ethanolic extract under continuous stirring, at 60 °C, the color of the solution changed from red-orange to reddish brown and finally to black-brown, indicating the formation of AgNPs. This affirmation was further confirmed by UV–Vis spectroscopy, by measuring the absorbance of the solution at time intervals.
Table 1 shows the Pg extract and Pg-AgNPs characteristics (absorbance and wavelength) recorded in time intervals. The reaction occurs over time, and by increasing the time interval, the absorbance values increase, leading to higher concentrations of Pg-AgNPs. In addition, increasing the Pg-AgNP concentration leads to a wavelength shift from 362 to 410 nm, until equilibrium, indicating the formation of more Pg-AgNPs with time. One can observe that the formation of green Pg-AgNPs takes place after 1 h and 30 min from the addition of 1 M AgNO3 solution. Nevertheless, the green synthesis was conducted for 3 h and 30 min to ensure that any changes in nanoparticle formation did not occur.

2.1.2. Fourier Transform Infrared (FT-IR) Spectroscopy

Figure 2 shows the FT-IR spectra of Pg peel ethanolic extract and green synthesized Pg-AgNPs. The investigation was performed to identify the main biomolecules from the ethanolic Pg extract which reduced the Ag+ ions to Ag0, indicating the formation of Pg-AgNPs.
As shown in Figure 2 and Table 2, the main important peaks recorded in the case of green Pg-AgNPs were recorded on the FT-IR spectrum at 3402.43/cm, 2924.09/cm, 1600.92/cm, and 1384.89/cm. The broad medium absorption peak at 3402.43/cm corresponds to the O-H stretching vibration functional groups of the alcohols (phenolic compounds) from the Pg peel ethanolic extract. At the same time, between 3400 and 3300/cm, the aliphatic primary amines were evidenced through the N-H stretching vibration functional groups recorded.
The weak absorption peak located at 2924.09/cm may correspond either to the O-H stretching vibration functional groups from the carboxylic acids or alcohols contained in pomegranate peel extract or to N-H stretching functional groups from amine salts. At the same time, the absorption peak could be assigned also to C-H stretching vibration functional groups from alkanes. The weak band recorded at 1716.65/cm could be ascribed to the C=O stretching vibration functional groups from aldehydes, esters, aliphatic ketones, or carboxylic acids. The aromatic compounds that absorb at the same wavenumber are highlighted through the C-H bending vibration functional groups (the band absorption recorded is weak).
The medium band recorded at 1600.92/cm could be ascribed either to the C=C stretching vibration of conjugated or cyclic alkene or to N-H bending functional groups from amines. At 1384.89/cm wavenumber, the absorption peaks of the C-H bending functional groups from alkanes or aldehydes appeared, as well as the absorption peaks of the O-H bending functional groups from alcohols or phenols. At the same time, at this wavenumber, the C-F stretching vibration functional groups from fluoro compounds could be recorded. This band is characteristic of AgNPs, due to the N-O stretching vibration functional groups from nitro compounds. The band located at 1068.56/cm could be assigned either to the C-N stretching vibration functional groups from amines, or to the C-O stretching vibration functional groups from primary alcohols. The absorption peak recorded at 1035.77/cm could be ascribed to the C-N stretching vibration functional groups from amines, or CO-O-CO stretching vibration functional groups from Pg peel ethanolic extract anhydrides.
The rest of the absorption peaks recorded (831.32/cm; 773.46/cm and 524.64/cm) correspond to the halo compounds, visible through the appearance of the C-Cl, C-Br, and C-I stretching vibration functional groups. At the same time, the peak recorded at 831.32/cm could be ascribed to the C=C bending functional groups from alkenes or to the C-H bending functional groups from compounds with substituted arrays. C-H bending functional groups are also highlighted at 773.46/cm.
In the case of Pg peel ethanolic extract, the FT-IR spectrum revealed the presence of some absorption bands, which are not evidenced on the Pg-AgNP spectrum. These bands have absorption peaks located at 1444.68/cm, 1230.58/cm, and 877.61/cm and could be assigned to the stretching (C=C; C-N; C-O; C-F) and bending (C-H) functional groups from aromatic compounds, amines, ethers, fluoro compounds as well as compounds with substituted arrays.

2.1.3. Thermal Behavior

Figure 3 shows the TG-DTG curves (the thermogravimetric and the derivative of the TG curve) of green synthesized Pg-AgNPs obtained from the ethanolic extract of pomegranate peel.
One can observe that the total mass loss recorded on the TG curve is 47.1%. The slight mass loss that occurred up to 100 °C, highlighted on the TG curve, is due to water elimination from the Pg-AgNP sample. Between 200 and 600 °C, the largest mass loss recorded took place. This process can be assigned to the degradation of aromatic compounds, amines, phenols, carbohydrates, alkenes, esters, and ketones present on the surface of green Pg-AgNPs, coming from the ethanolic extract of Pg, as well as to nitrogen compounds from AgNPs. In addition, between 400 and 500 °C, another slight mass loss can be observed, which can be attributed to the decomposition of Ag+ to Ag0. Over 900 °C, the aluminum crucibles contain only the metallic oxide (AgO).

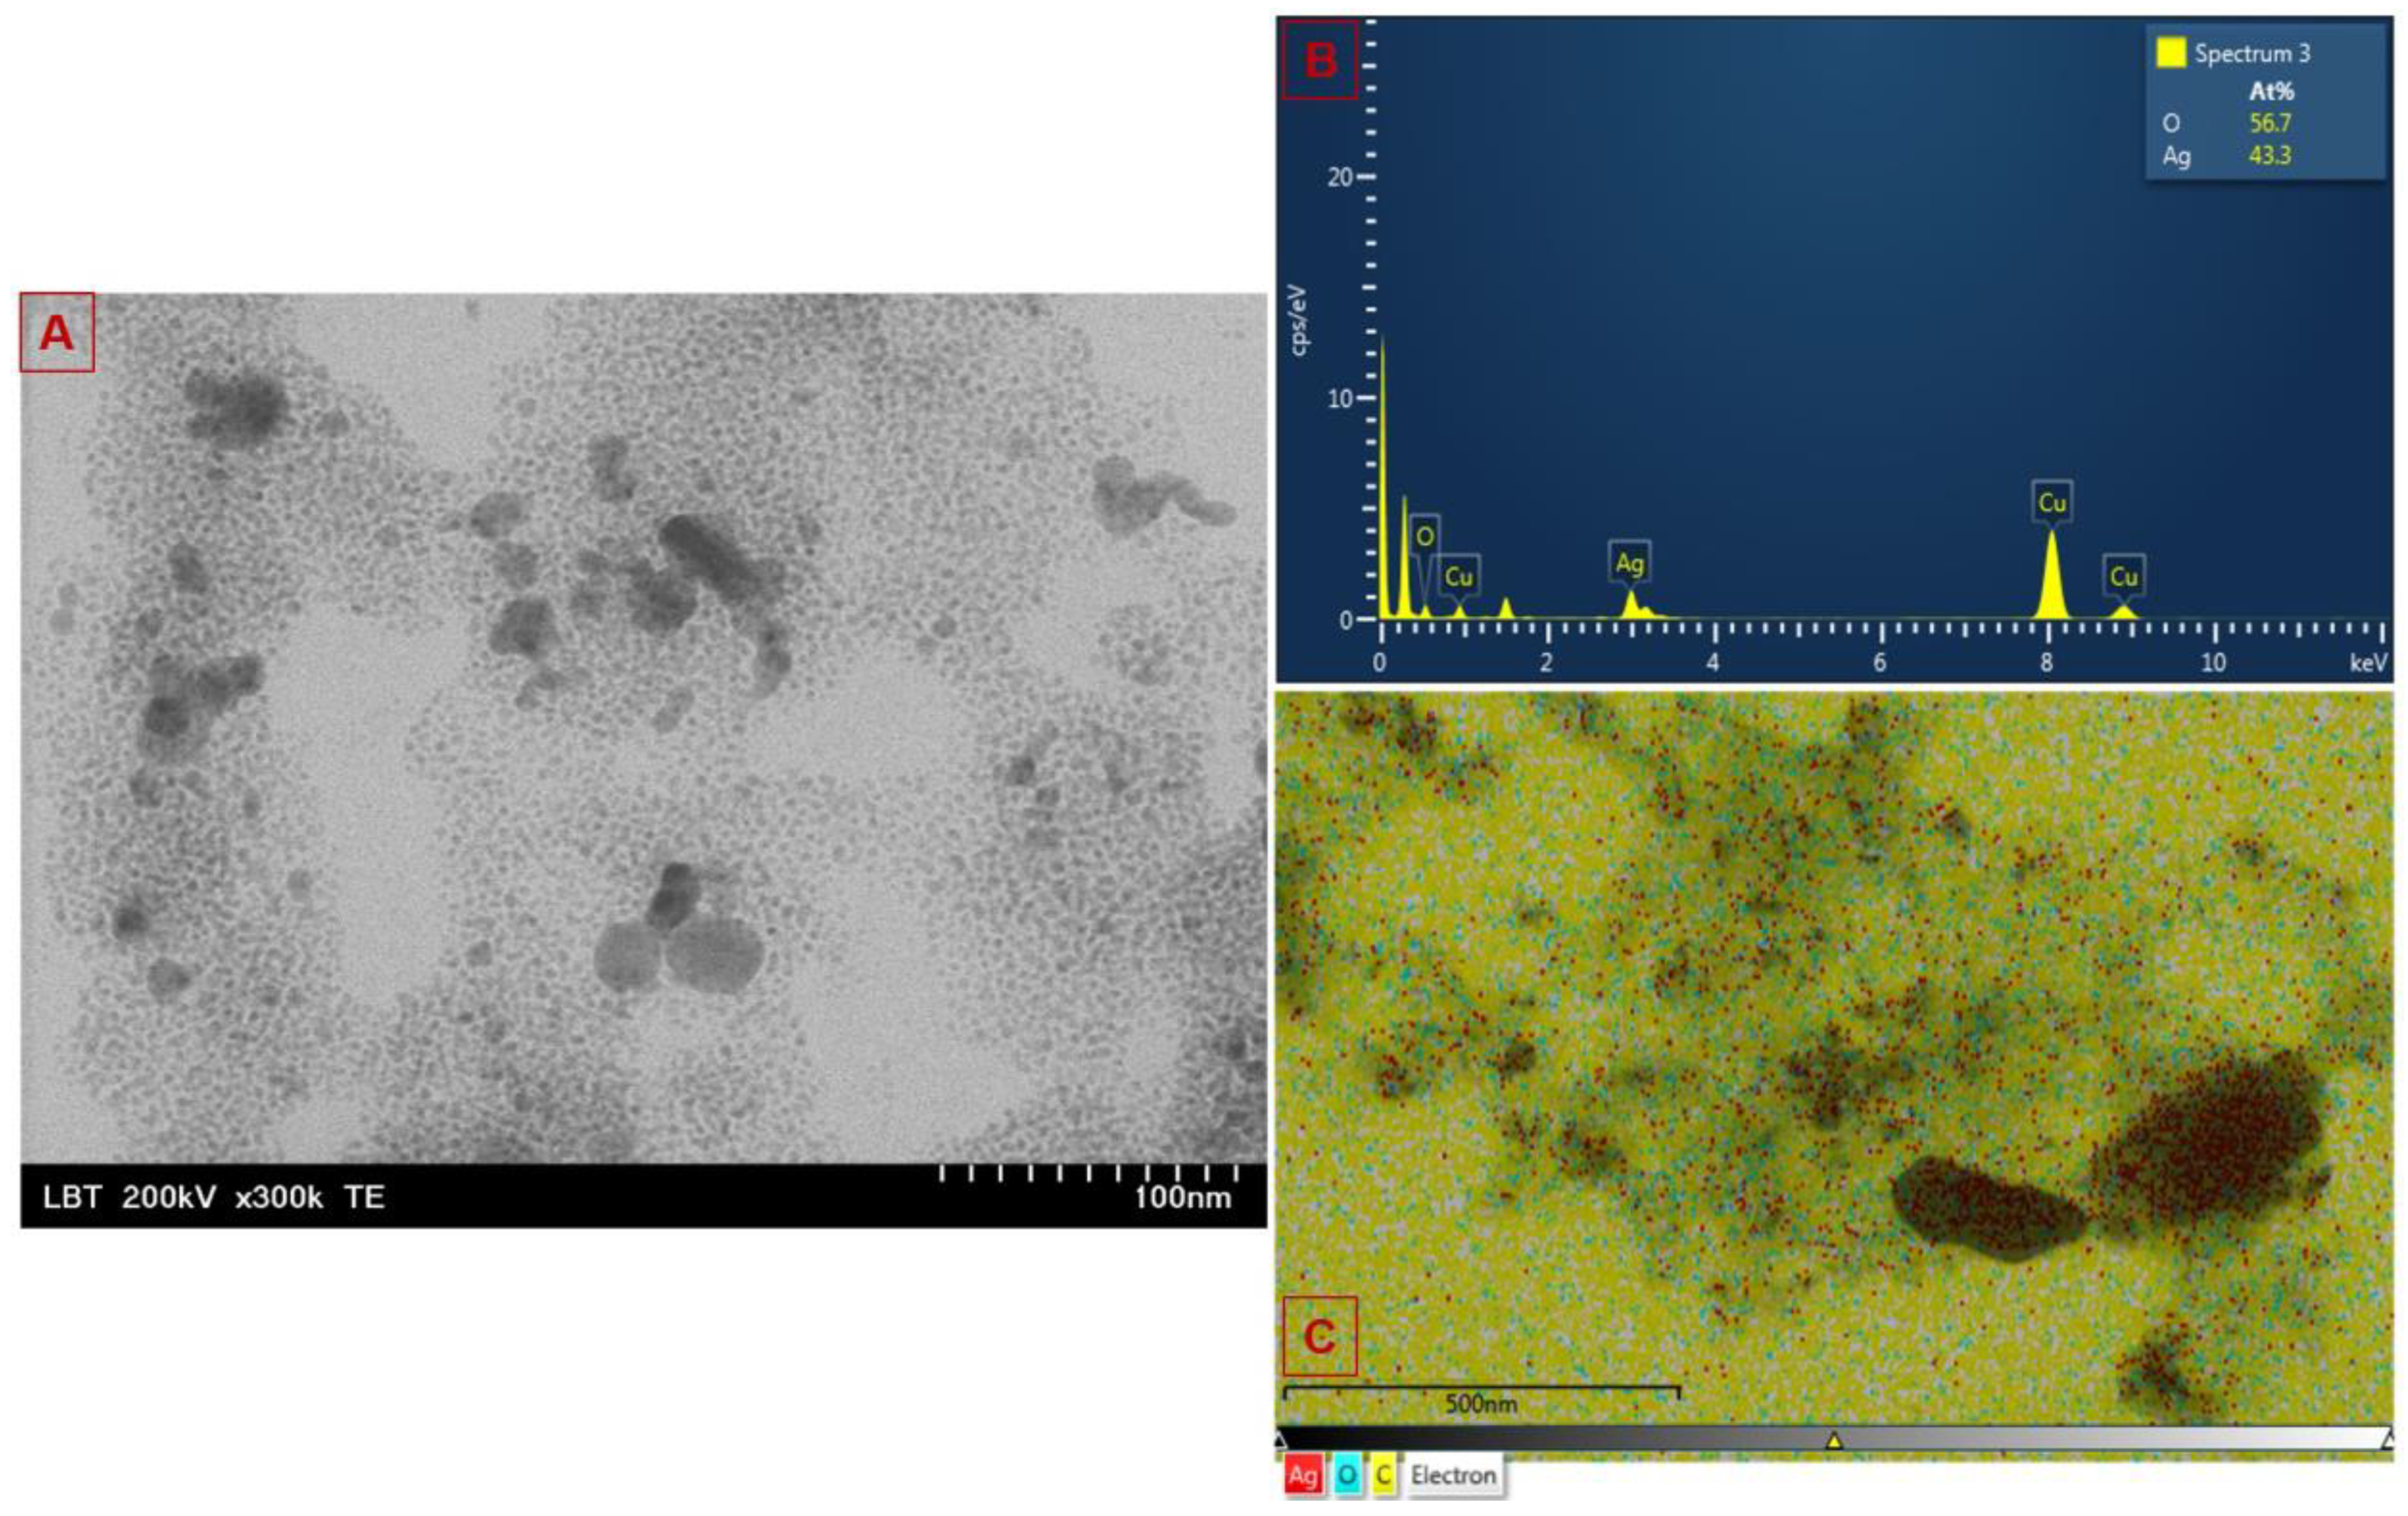
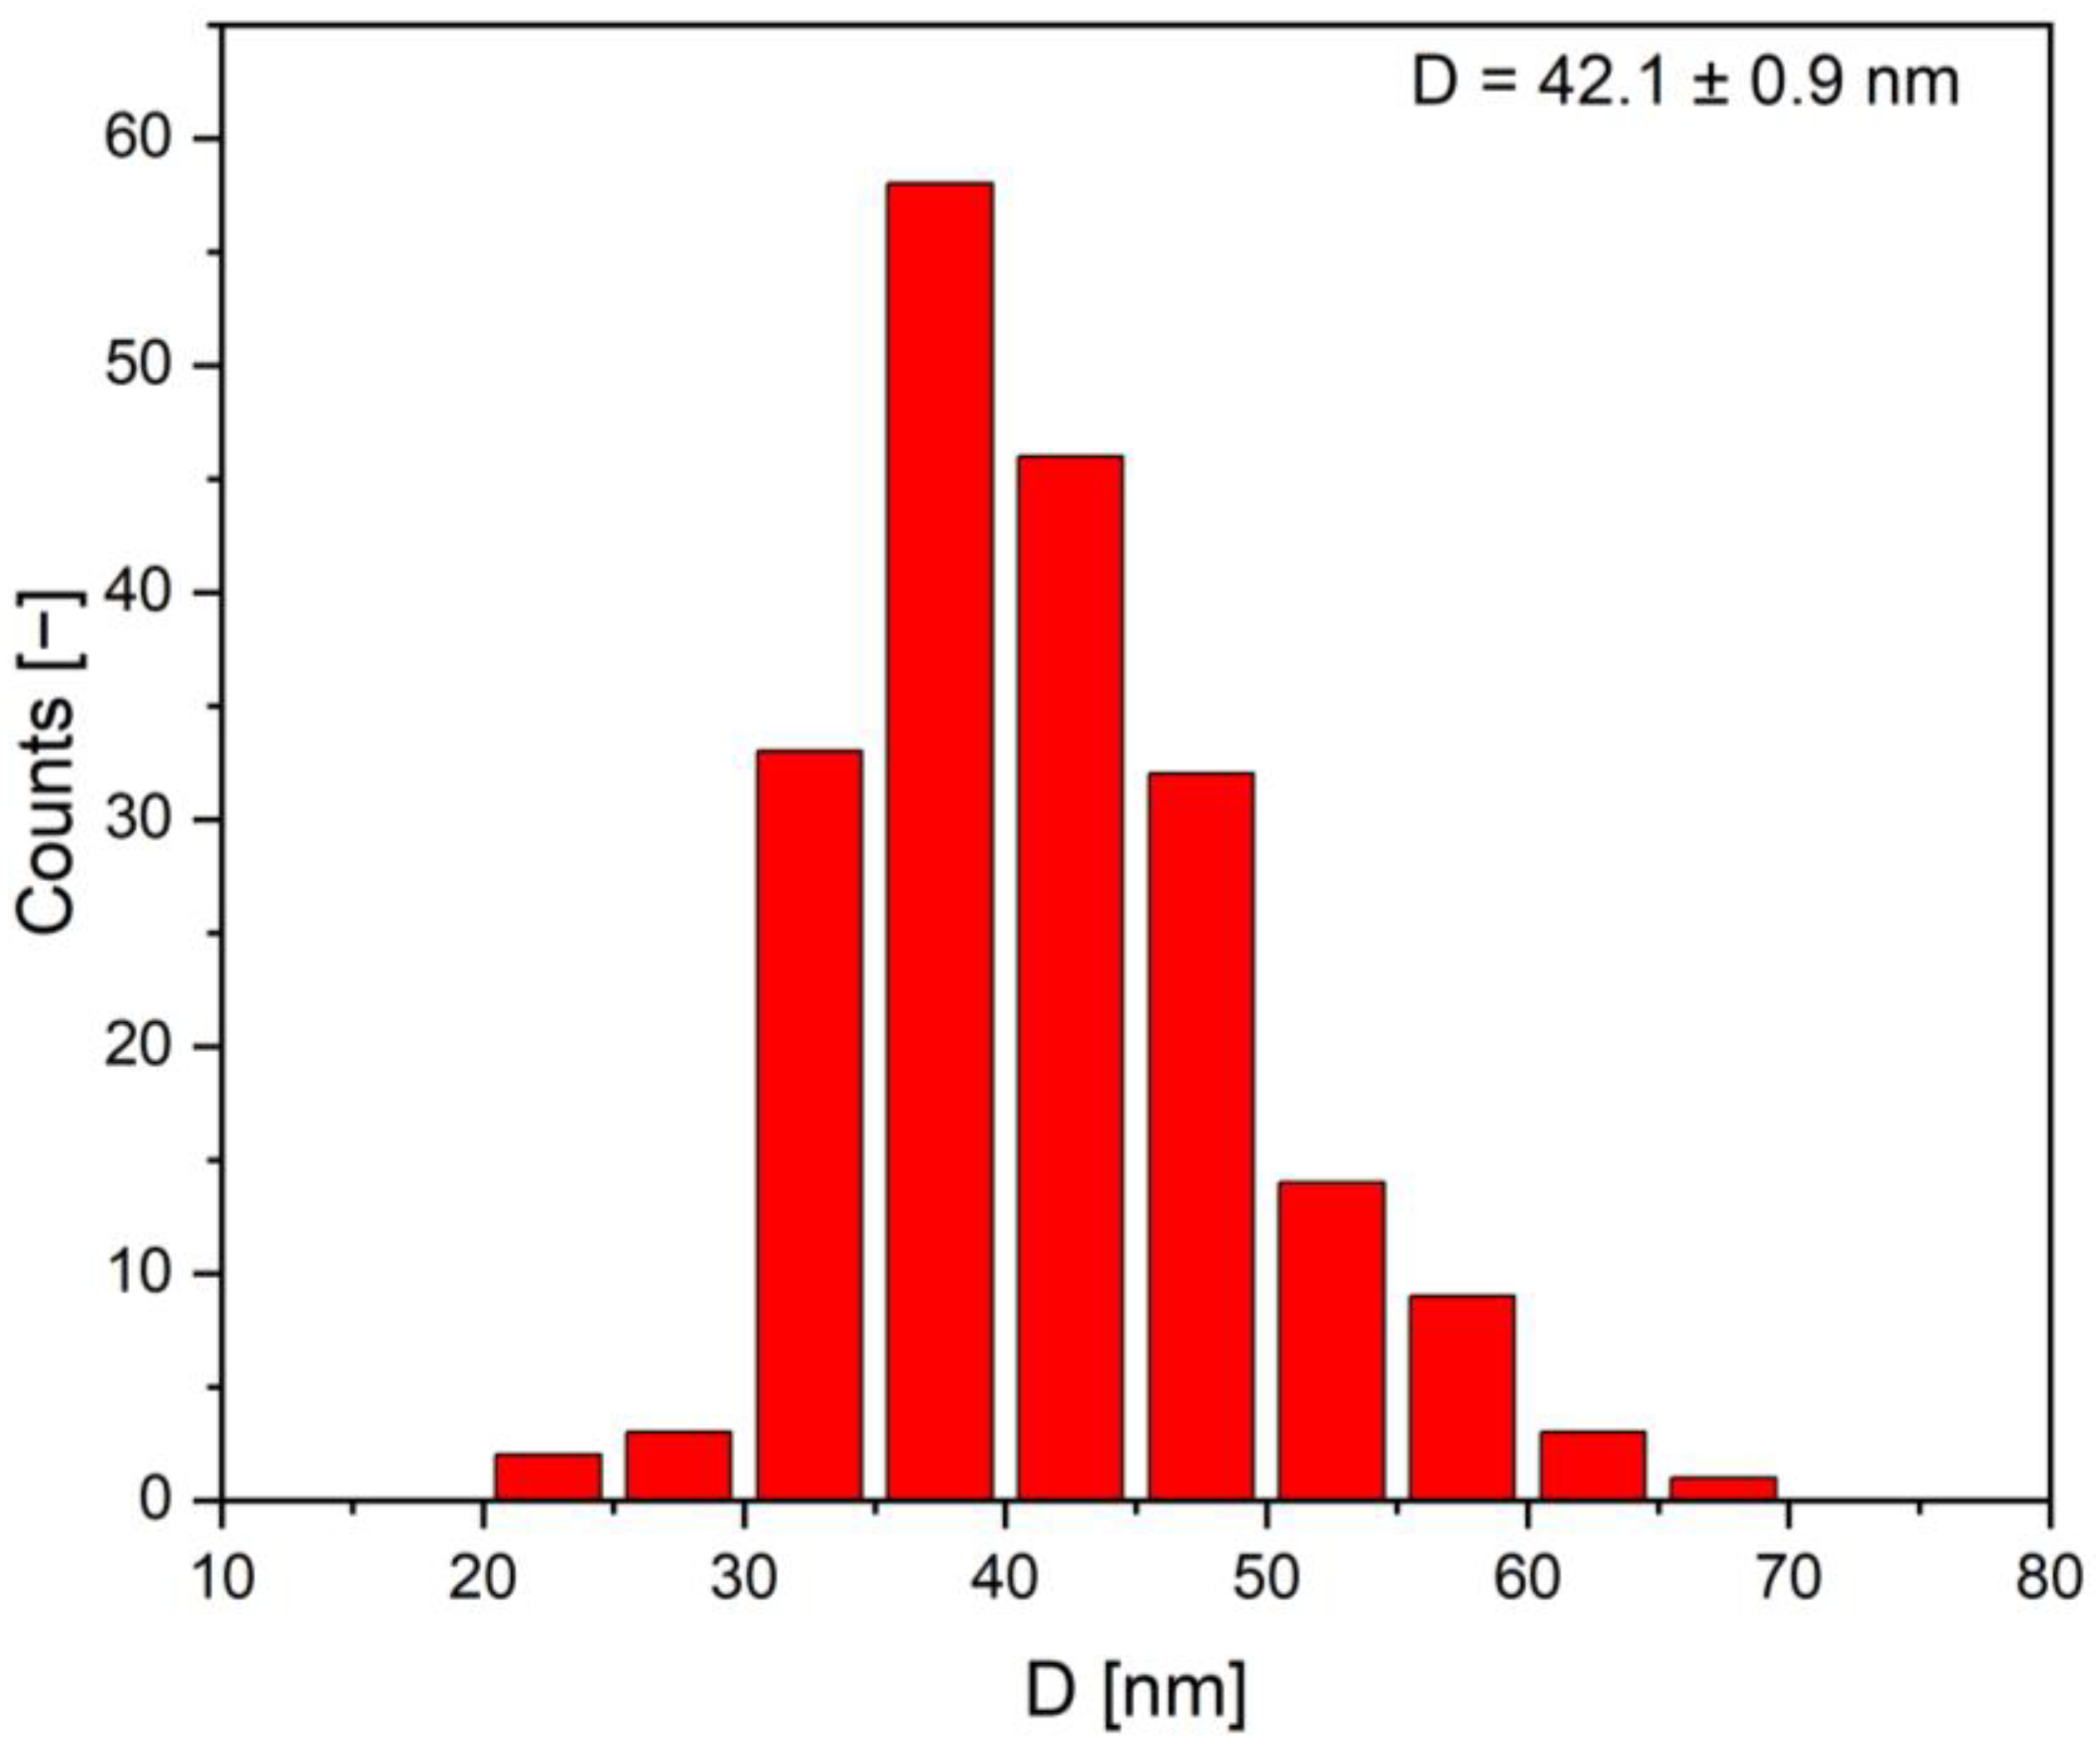
2.1.4. Electron Microscopy Analysis

Figure 4A shows the TEM image of green synthesized Pg-AgNPs and Figure 4B,C show the energy dispersive spectroscopy (EDS) through element mapping.
One can observe that the green synthesized Pg-AgNPs obtained at 60 °C starting from an ethanolic extract of P. granatum peel, using 1 M of AgNO3 aqueous solution, are semi-spherical, non-uniformly distributed, with a particle size distribution between 5 and 100 nm. The EDX profile recorded from the green synthesized Pg-AgNPs depicts the microelements present in the sample (C, O, Cu, and Ag), identified by the peak amplitude. The presence of a carbon signal is due to the carbon sputter coating, applied for better conductivity, and the presence of a Cu signal represents the grid support. The EDS mapping is in agreement with the EDX profile of green synthesized Pg-AgNPs. The mapping analysis was performed to determine the presence of dispersed and homogeneous elements contained in the green synthesized Pg-AgNPs, and the analysis confirmed the presence of Ag, O, and C atoms.
To determine the Pg-AgNPs size distribution, ImageJ software (ImageJ 1.54 g, https://imagej.nih.gov/ij/) was used and the data obtained is reported in a histogram (Figure 5). Figure 5 depicts the particle size distribution extracted from a TEM image used for granulometry, and the results are presented as an average of more than 200 nanoparticles. The majority of the nanoparticles were counted in the size range between 30 and 60 nm; yet, a few silver nanoparticles were also counted around the size of 80 nm. Overall, the green synthesized Pg-AgNPs had an average size of 42.1 ± 0.9 nm.

2.2. In Vitro Toxicological Screening of Green Synthesized Pg-AgNPs

2.2.1. Antibacterial Assay

The antibacterial activity of the green Pg-AgNPs was assessed against a Gram-positive bacterial strain as well as against two Gram-negative strains, using various concentrations of Pg-AgNPs (25; 50; 75, and 100 μg/mL), and the results are presented in Table 3. The antimicrobial effect was measured by micro-dilution assay, and the MIC (μg/mL) and MBC (μg/mL) determinations were assessed. The MIC value was exhibited at 18 μg/mL for E. coli at the highest concentration of Pg-AgNPs tested (100 μg/mL), whereas, at the same concentration, the antibacterial spectrum showed an MIC value of 15 μg/mL for P. aeruginosa and 97 μg/mL for S. aureus.
The antibacterial spectrum activity of Pg-AgNPs at the highest concentration tested (100 μg/mL) revealed an MBC value of 10 μg/mL for E. coli, whereas, at concentrations of 25 to 75 μg/mL Pg-AgNPS, no anti-bactericidal spectrum was observed. A similar trend was also observed for P. aeruginosa; the MBC value of 10 μg/mL was obtained when the highest concentration of Pg-AgNPs was tested. By decreasing the Pg-AgNPs concentration, no anti-bactericidal spectrum was observed. The MBC values for S. aureus decreased with the increase in Pg-AgNP concentration, ranging from 562 to 164 μg/mL.
The results obtained revealed that the green synthesized Pg-AgNPs have only bacteriostatic effect on the Gram-negative bacterial strains when tested at concentrations of 25 to 75 μg/mL. At the highest tested concentration (100 μg/mL), the green Pg-AgNPs showed both bacteriostatic and bactericidal activity on the E. coli and P. aeruginosa bacilli strains. As regards the S. aureus Gram-positive bacterial strain, the green Pg-AgNPs exhibited high MIC and MBC values, which means that to inhibit the growth of this strain, a high amount of Pg-AgNPs is needed. In contrast, for the growth inhibition of the Gram-negative bacilli strains (E. coli and P. aeruginosa), a lesser quantity of green Pg-AgNPs is required.

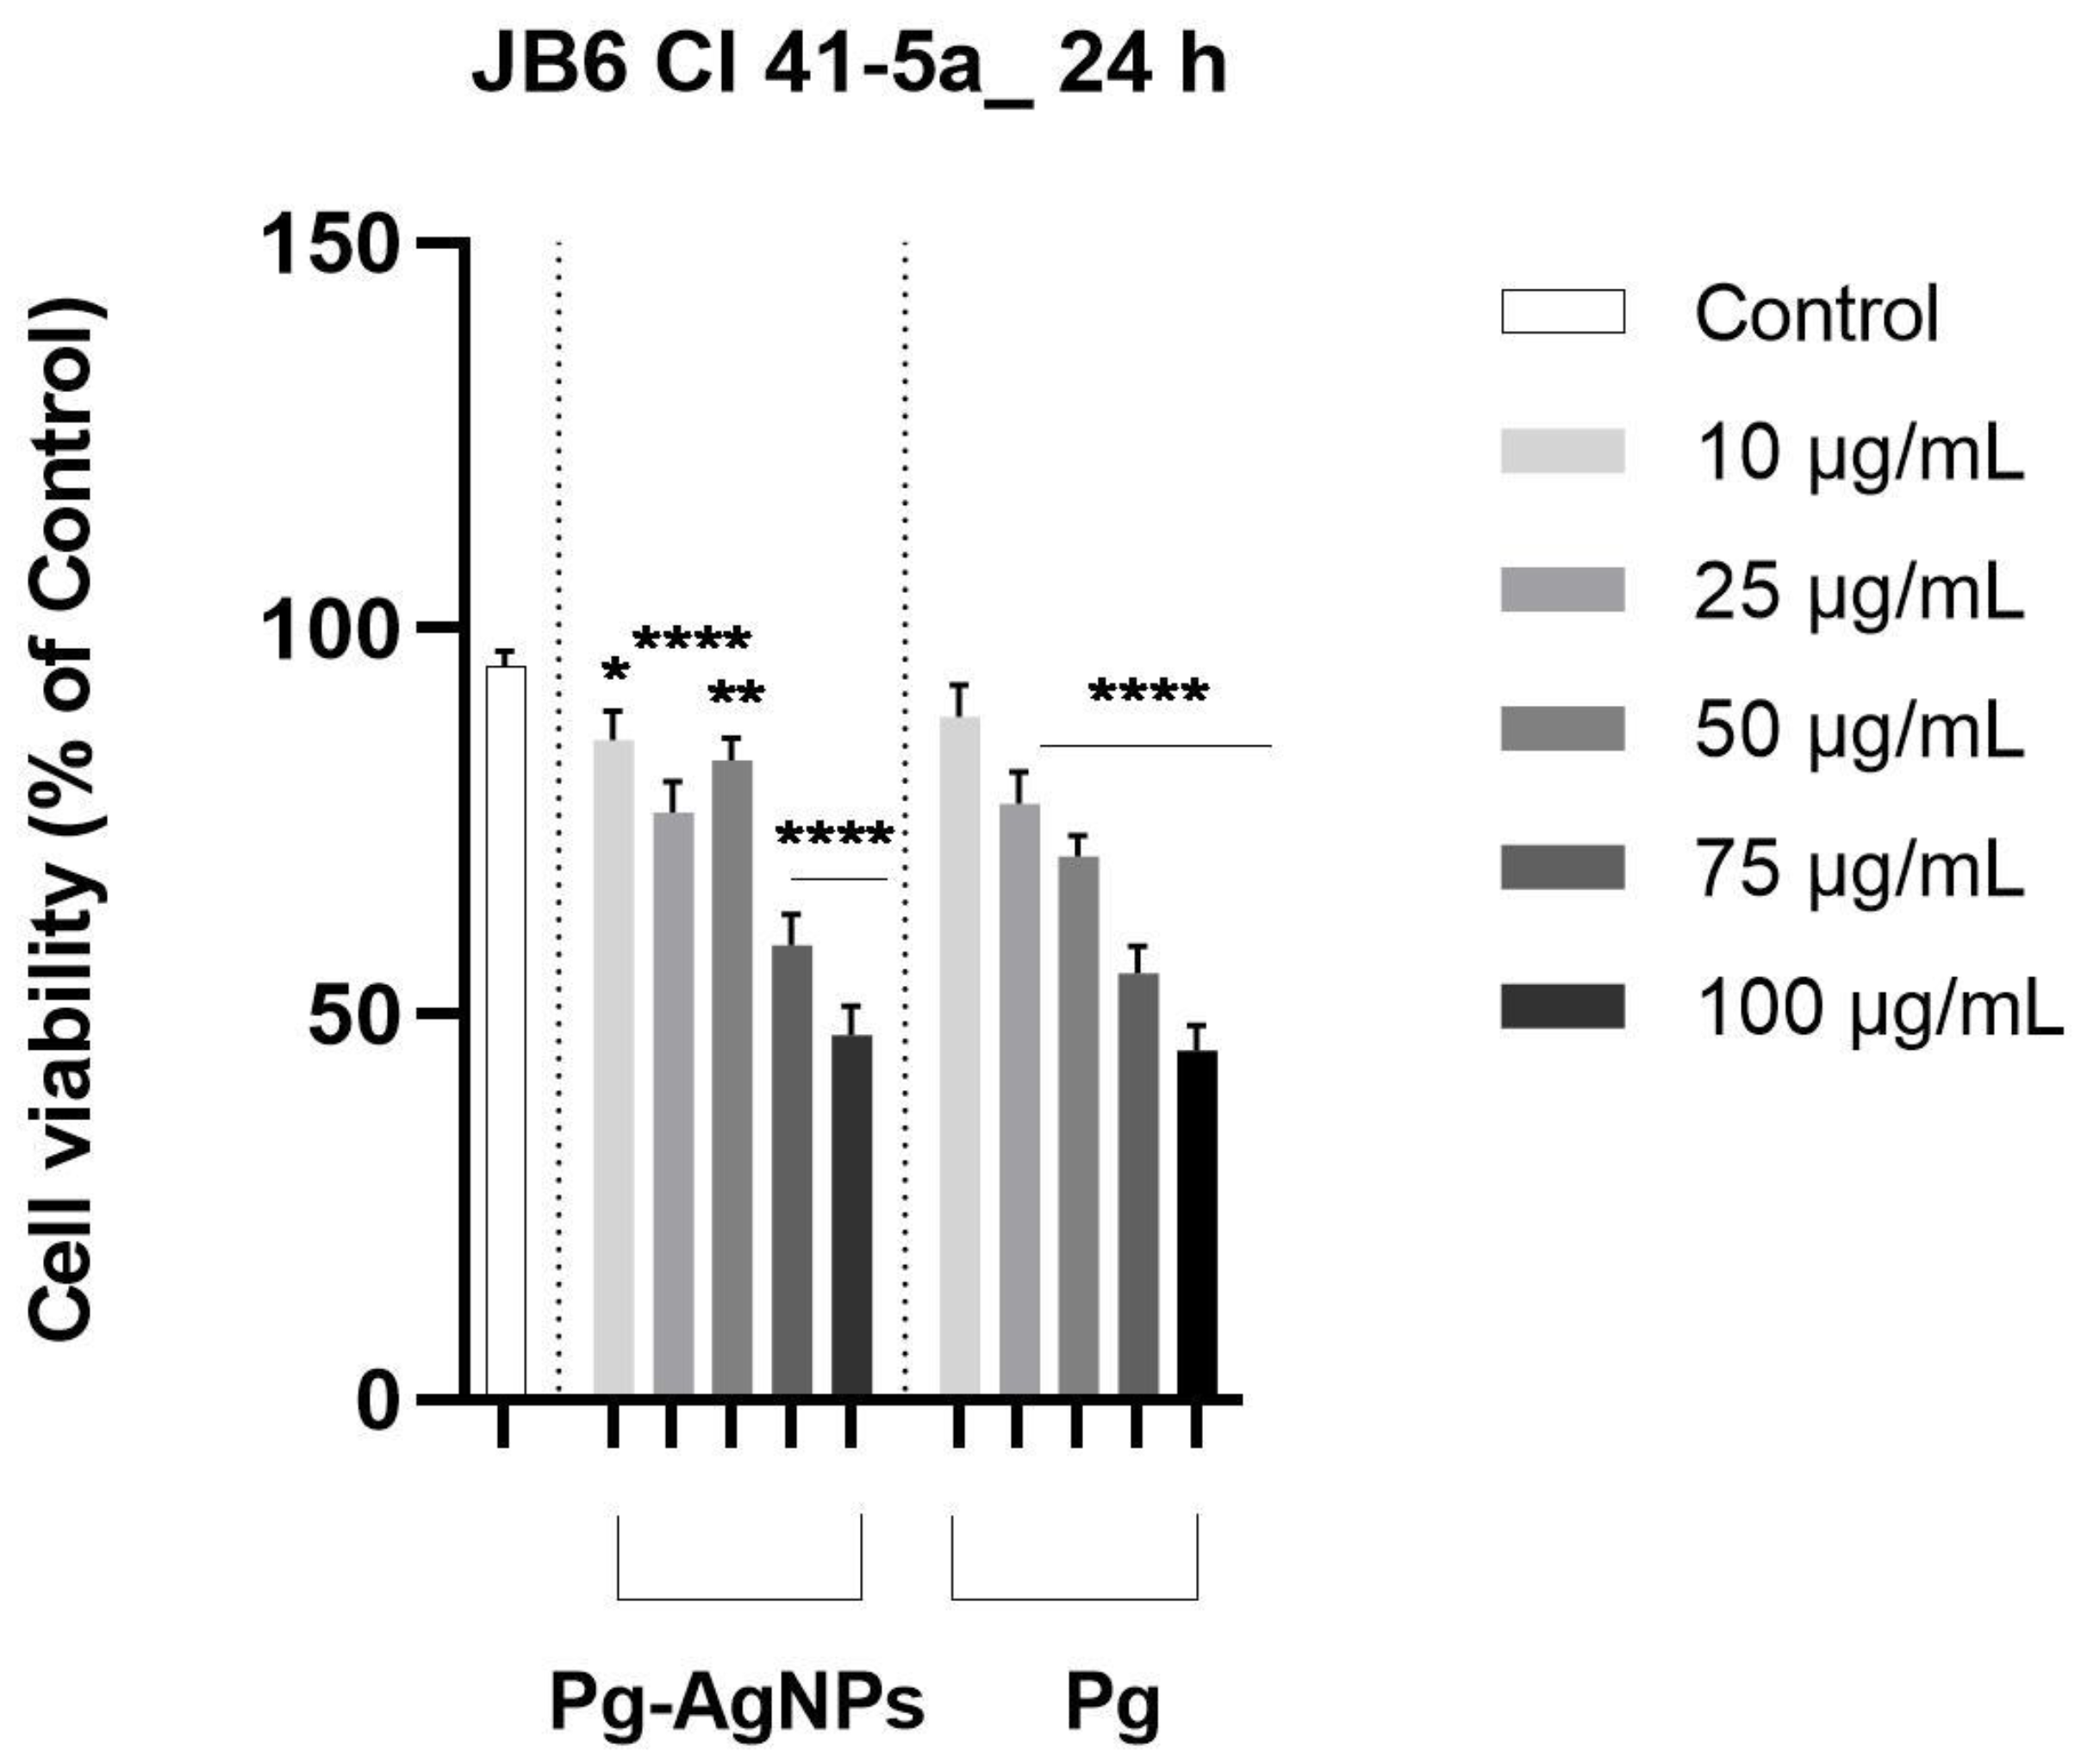
2.2.2. Cellular Viability Assessment

To evaluate the impact on the viability of JB6 Cl 41-5a cells, MTT analysis was carried out after cell treatment with Pg extract and Pg-AgNPs for 24 h. The results regarding the effect of green Pg-AgNPs on JB6 Cl 41-5a cells demonstrated that concentrations of 10 and 50 µg/mL do not significantly affect their viability; moreover, the first three concentrations do not reduce viability in a large percentage. However, at concentrations of 75 µg/mL and 100 µg/mL, the cell viability decreases, reaching percentages of ≈58% and 47%, respectively. In addition, the Pg extract demonstrated a dose-dependent decrease in viability, with slightly lower percentages reaching 45.3% at the highest concentration tested (100 μg/mL). However, at concentrations of 10 and 25 µg/mL, higher cell viability was observed compared to green Pg-AgNPs (Figure 6).

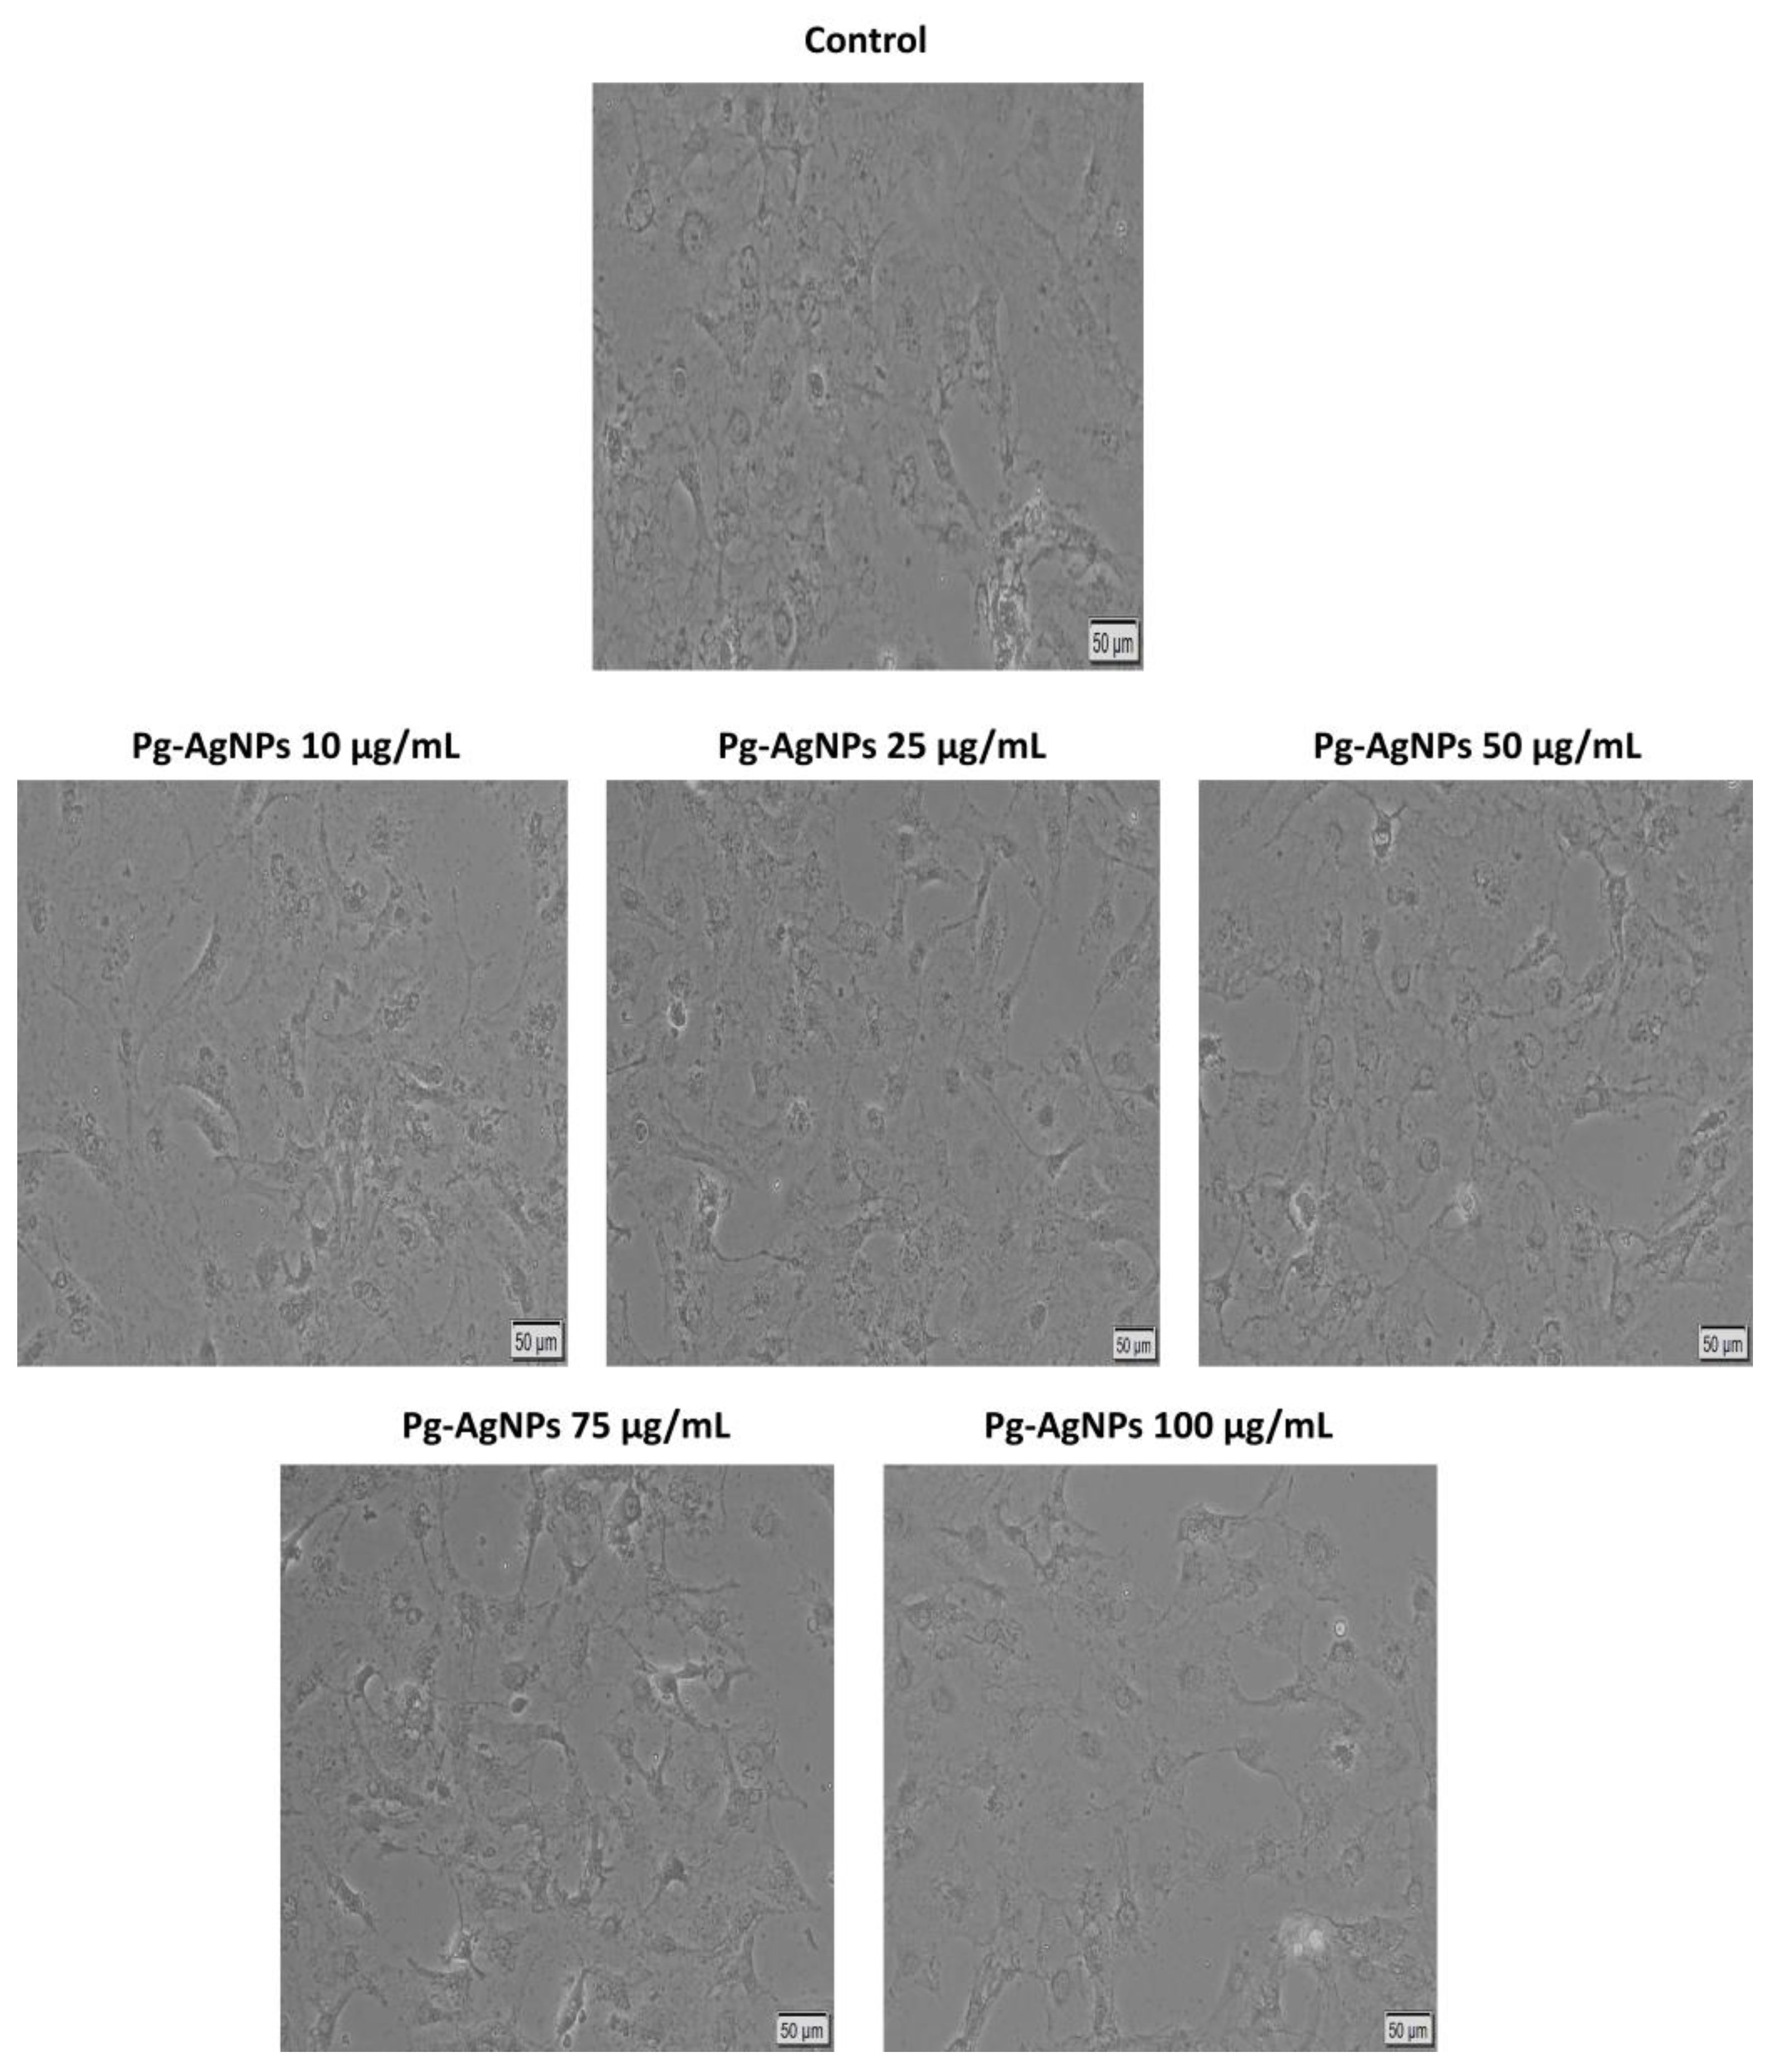
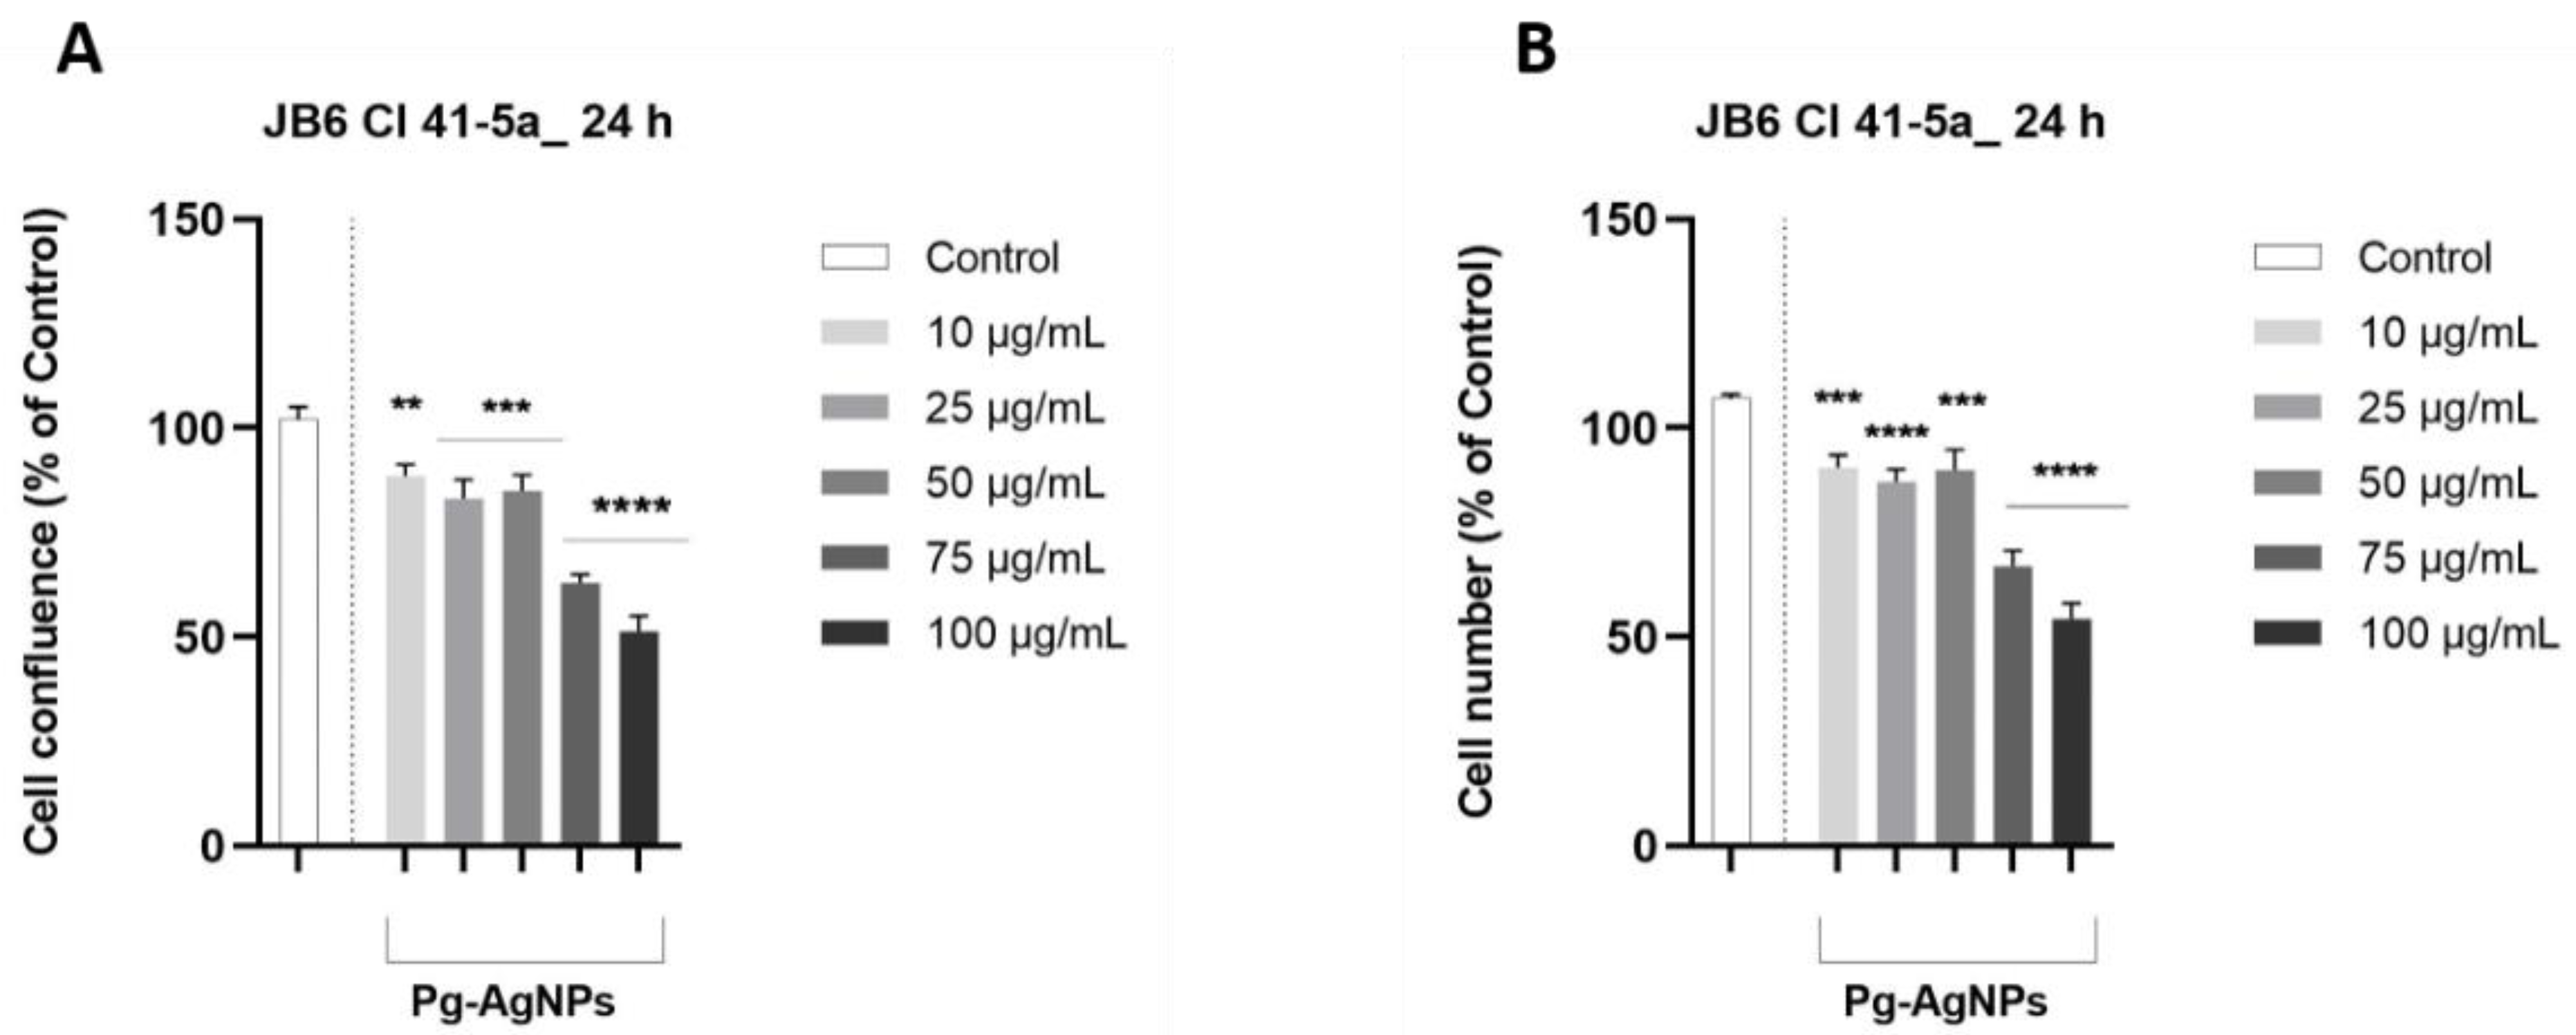
2.2.3. Evaluation of Cellular Morphology, Confluence, and Cell Number

Next, the impact of green synthesized Pg-AgNPs on the morphology, confluence, and number of cells was determined. The results regarding the analysis of the cell morphology claimed that Pg-AgNPs at low concentrations do not produce visible changes in JB6 Cl 41-5a cell morphology, while the application of doses > 50 µg/mL underscored a decrease in confluency along with the appearance of round cells that were detached from the plate (Figure 7).
As can be seen in Figure 8, the decrease in confluence and the number of cells was directly proportional to the increase in concentration of green Pg-AgNPs. Thus, the most considerable decreases were induced at concentrations of 75 µg/mL and 100 µg/mL, respectively, with values under 65% being recorded.

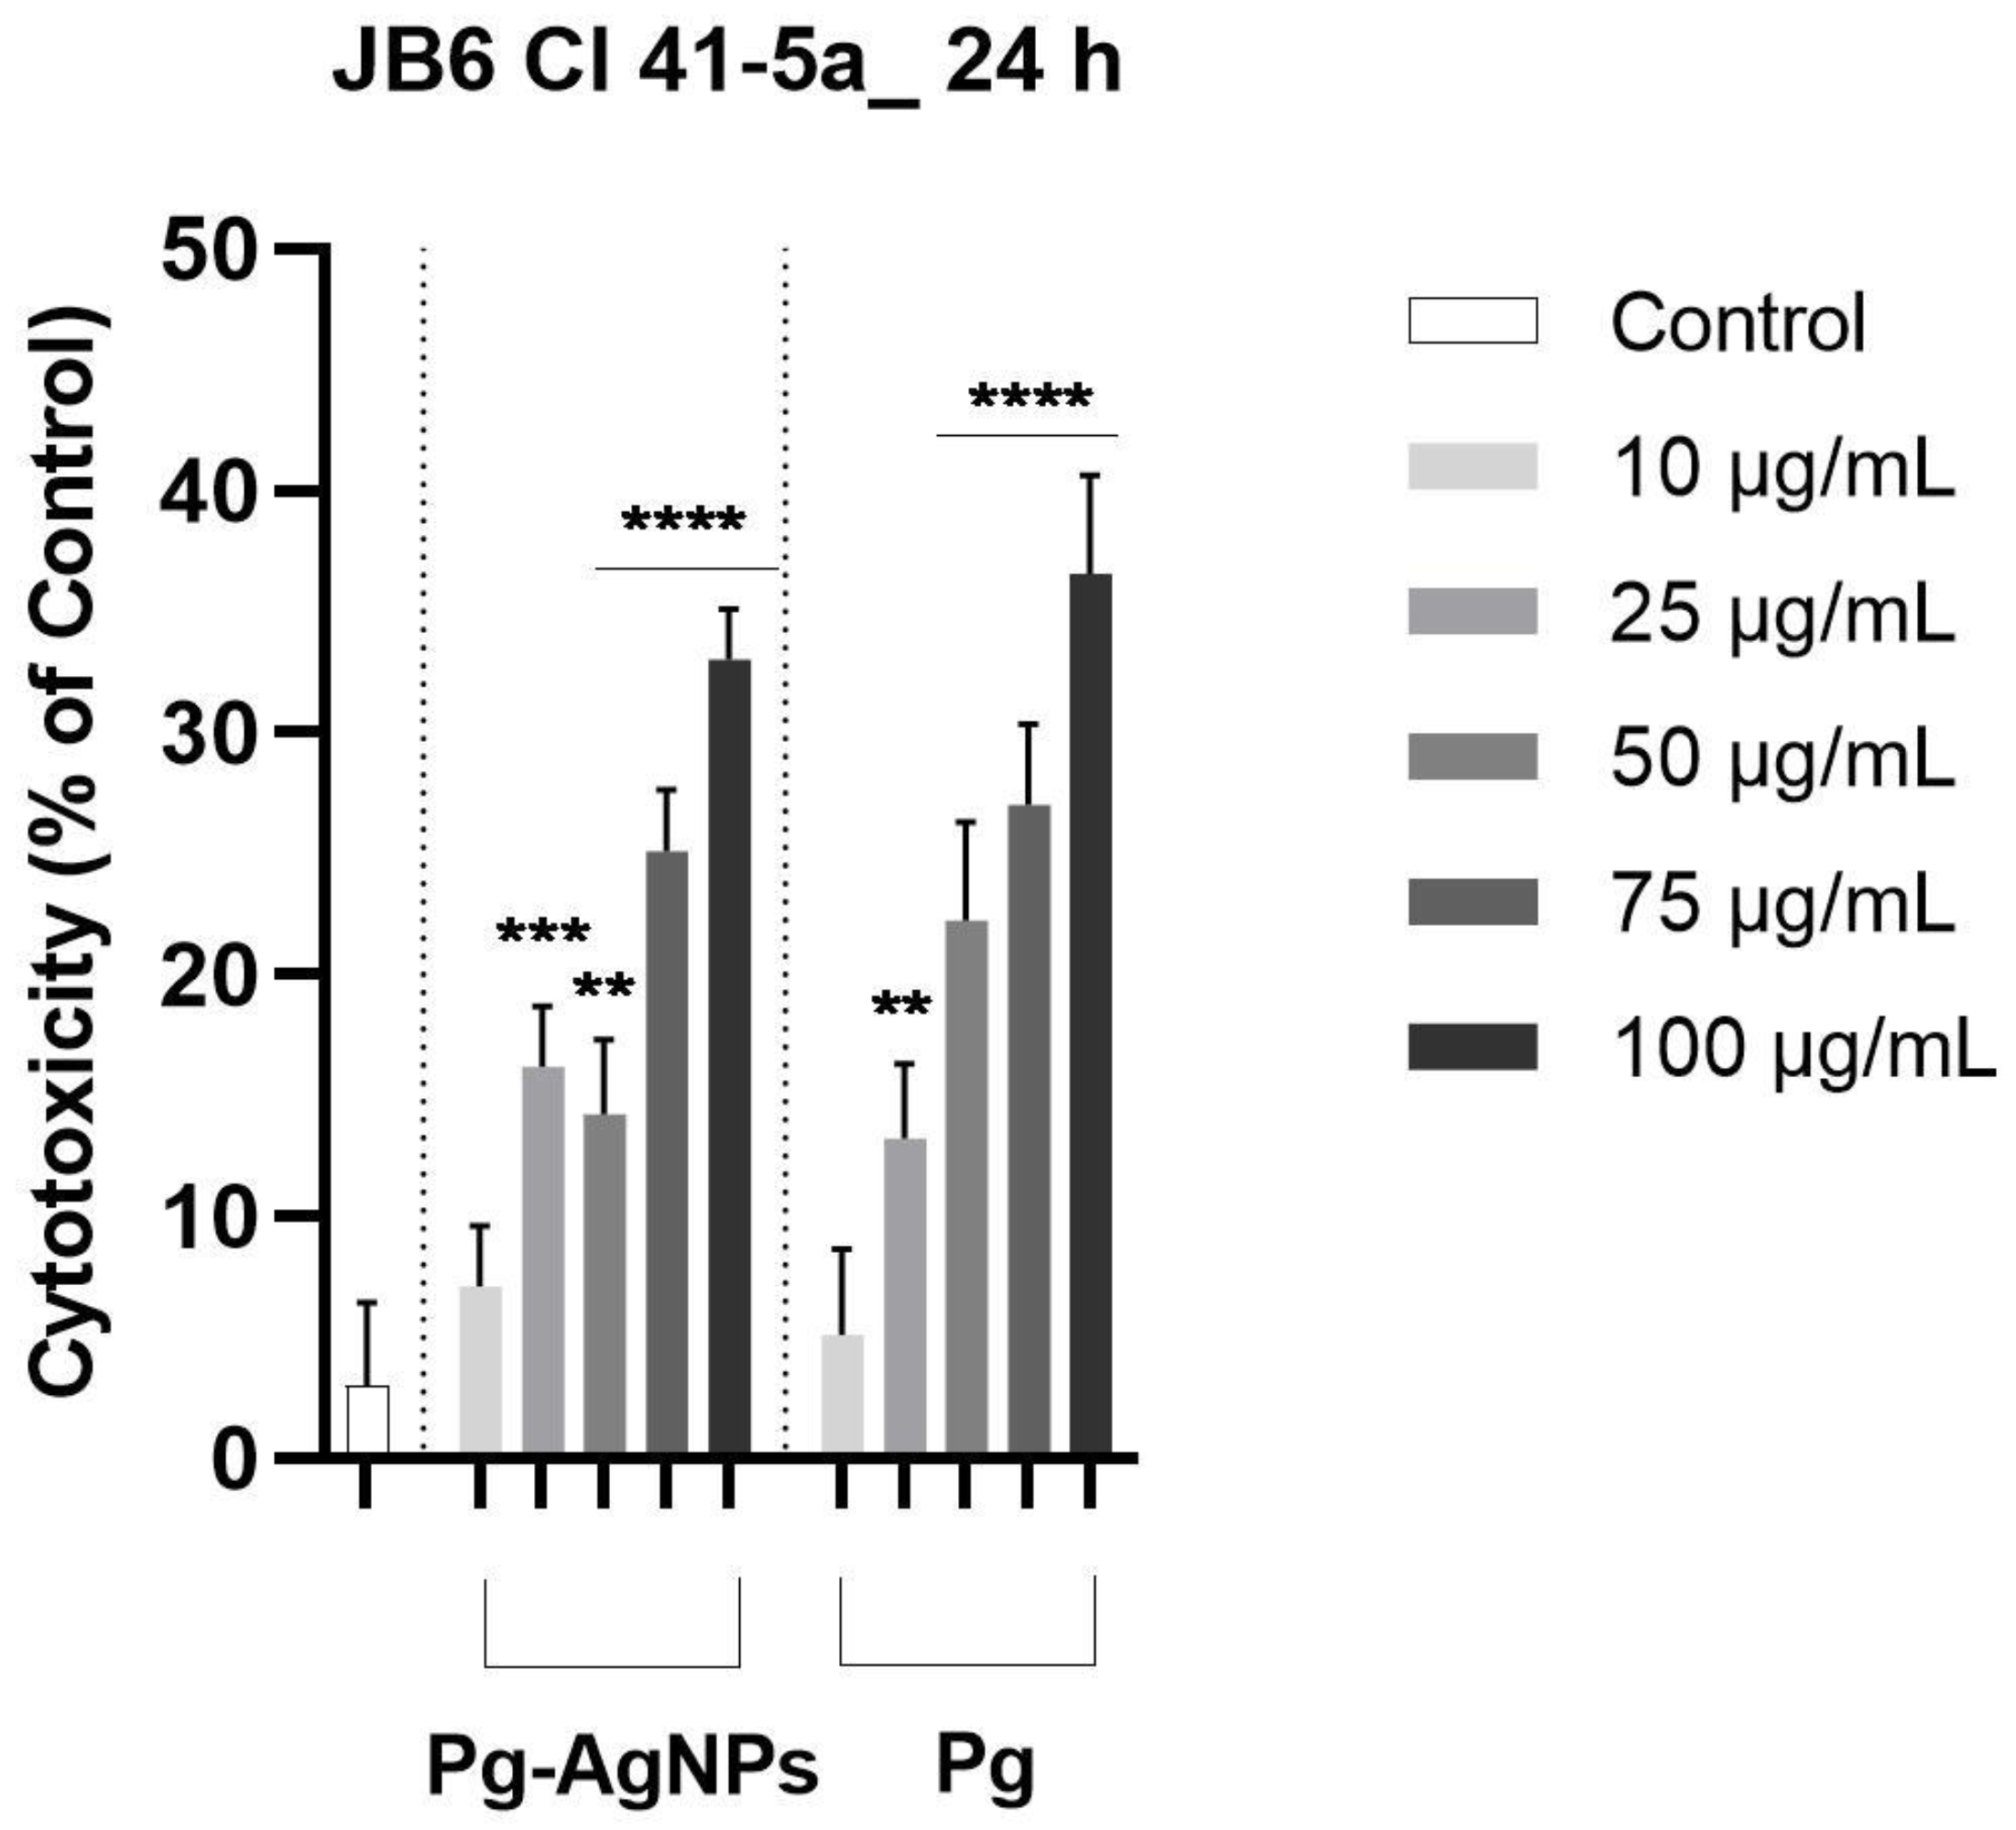
2.2.4. Cytotoxicity Assay

Additionally, the impact of Pg extract and green synthesized Pg-AgNPs on cell membrane integrity was determined by measuring the lactic acid dehydrogenase release (LDH). In the case of green Pg-AgNPs, when the highest concentration was tested (100 μg/mL), the results indicated that significant leaks (>25%) were recorded, suggesting a potential cytotoxic effect from the obtained silver nanoparticles. Furthermore, the evaluation of the Pg extract registered a more pronounced cytotoxic effect than green Pg-AgNPs at the latter two concentrations, agreeing with the data on viability, reaching a percentage of ≈36% at 100 µg/mL (Figure 9).

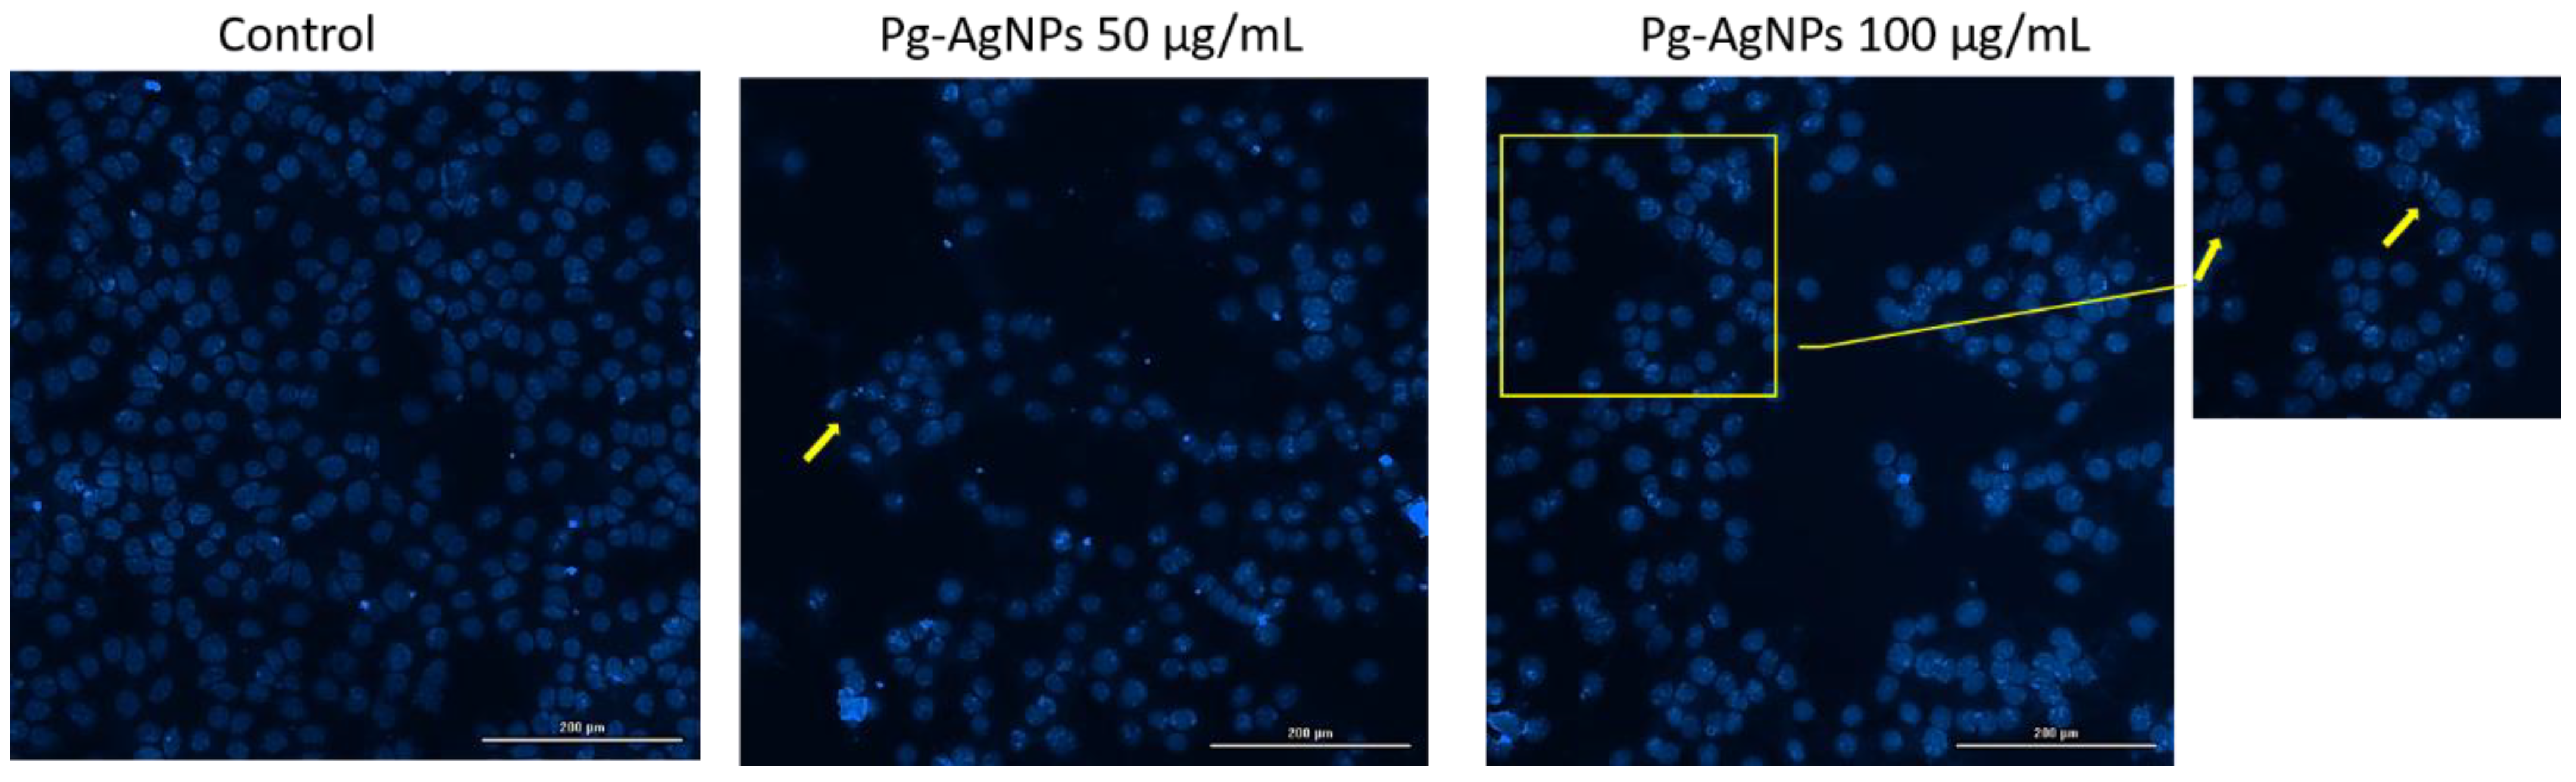
2.2.5. Nuclear Morphology Evaluation

Subsequently, the influence of green synthesized Pg-AgNPs on the nuclear aspect was evaluated. For this assay, only two concentrations of Pg-AgNPs (50 µg/mL and 100 µg/mL) were analyzed. In Figure 10, a reduction in the size of the nuclei is highlighted, accompanied by the appearance of apoptotic bodies, observed in particular at the highest concentration tested.

2.3. In Ovo Toxicological Screening of Green Synthesized Pg-AgNPs

To evaluate the potential irritant effect of green synthesized Pg-AgNPs, two representative concentrations were chosen (10 μg/mL and 50 μg/mL). By employing the HET–CAM method (hen’s egg test–chorioallantoic membrane), we wanted to observe if the green synthesized Pg-AgNPs caused changes in blood vessels (bleeding, clotting, hyperthermia, and/or lysis). Thus, the irritation score (IS) was determined by analyzing the incidence of the processes, and the results are highlighted in Table 4. A positive control, sodium dodecyl sulfate 1% (SDS), was selected and it showed an IS value of 18.5, signifying it was a strong irritant. A negative control, distilled water, was chosen, and it showed an IS value of 0.07, indicating that it was non-irritant. Upon application of 1% SDS to the chorioallantoic membrane, the process of hemorrhage (20 s), lysis (38 s), and coagulation (45 s) were observed. In contrast, none of these processes were observed when distilled water was applied.
Different IS values were obtained for both concentrations of green synthesized Pg-AgNPs tested. The Pg-AgNP biosynthesis, at a concentration of 10 μg/mL, was classified as a moderately irritating compound. Hemorrhage and lysis were observed when applying the concentration of 10 μg/mL to the chorioallantoic membrane. In contrast, the Pg-AgNP biosynthesis at a concentration of 50 μg/mL was classified as a weakly irritating sample (theoretical IS = 1–4.9). Only slight coagulation was observed when applying the concentration of 50 μg/mL of Pg-AgNPs to the chorioallantoic membrane (Figure 11).

3. Discussion

Green synthesis has gained popularity due to its eco-friendly nature. This environmentally friendly approach [33] not only provides safer alternatives to conventional methods but also offers economic benefits and reduced environmental impact, aligning with the principles of sustainable development [3,8]. The utilization of green nanotechnology in medicine extends beyond therapeutic interventions to encompass areas such as drug delivery systems, imaging, and wound healing. The biocompatibility of a green material relies on the use of biological entities as a capping/stabilizer agent, to control the size of the material as well as to prevent particle agglomerations [34]. Plant extracts are the most used biological entities due to the plethora of phytocompounds (phenols, carboxylic acids, proteins, aldehydes, amides, and/or ketones) which participate in the reaction process, reducing and stabilizing the obtained particles [35]. The richer the plant is in active phytocompounds, the more the biological activity of the obtained product increases [36].
The present study reports the synthesis of AgNPs through the green method, starting from the ethanolic extract of P. granatum peel, using a volume ratio of 1:2 AgNO3 to ethanolic extract, at 60 °C. The green synthesized Pg-AgNPs were surface-coated with biologically active phytocompounds transferred to the peel ethanolic extract; a treatment which makes them biocompatible for medical applications. The study aimed to establish a preliminary toxicological profile in vitro and in ovo, regarding the biological effect of the green synthesized Pg-AgNPs on a healthy murine cell line (neonatal BALB/c epidermal cells (JB6 Cl 41-5a)), as well as their irritant effect on the chorioallantoic membrane of a hen’s egg. After the green synthesis of Pg-AgNPs, a complex physicochemical characterization was performed.
UV–Vis spectroscopy was employed to evaluate the bio-reduction of silver nanoparticles in an aqueous solution. This indirect technique confirms the formation of AgNPs (Figure 1), first, through a color change after several minutes (see Section 4.1), due to the interaction of AgNO3 solution with plant phytocompounds, thus causing the reduction of the Ag+ ion to Ag0 metal, and second, by shifting the recorded absorption bands to higher intensities and wavelengths (Table 1). Many researchers revealed the detection of AgNPs at various wavelengths [18,37,38,39], as well as AgNP formation at different time intervals [18,37,38,40,41]. According to the literature data, a typical UV–Vis spectrum of AgNPs with wavelength ranging from 410 to 440 nm corresponds to the surface plasmon resonance (SPR) of this metal nanoparticle [42]. Our results are in agreement and very similar to the literature reports since we detected the AgNPs at λmax = 410 nm [21,42,43,44]. In addition, it was stated that the faster the synthesis of the nanoparticles, the higher their stability, due to the phytocompounds in the biological entity that participates in the reaction customizing the physicochemical features and biological properties of the formed AgNPs [45,46].
The FT-IR investigation was conducted to identify the functional molecules from the P. granatum peel extract. The FT-IR spectrum of Pg peel ethanolic extract (Figure 2—red band) showed a plethora of phytoconstituents responsible for the biological activity of this vegetable product. According to the scientific literature, P. granatum comprises flavonoids, alkaloids, glycosides, terpenoids, and polyphenols [47]. Our study reveals the organic functional molecules of the main phytoconstituents of Pg extract, which participated in the reaction and attached to the Pg-AgNPs’ surface. The main phytocompounds were phenolic compounds, alkaloids, terpenoids, and flavonoids, which are highlighted on the Pg-AgNP spectrum at 3402.43/cm; 2924.09/cm; 1716.65/cm; 1600.92/cm, and 1384.89/cm (Figure 2—black band). In addition, some absorption bands specific to the Pg extract shifted the recorded absorption bands on the Pg-AgNP spectrum at inferior wavenumbers (e.g., the bands recorded at 1444.68/cm—specific for aromatic compounds underscoring the methyl group; 1230.58/cm—specific for amines and ethers; 1045.42/cm—specific for anhydrides; as well as the band located at 877.61/cm—specific for compounds with substituted arrays) (Table 2). Therefore, our findings agree with those of the scientific literature [21,37,48,49]. Moreover, Zia et al. [50] confirmed that the functional groups of amide, amino, carbonyl, and polyphenolic compounds contained in the P. granatum extract, were involved in the biosynthesis of AgNPs, through their participation in the redox reaction, and NP dispersion, as reducing (phenolic compounds) and capping agents. A specific absorption peak was recorded only on the Pg-AgNP spectrum, at 524.64/cm, and alongside the absorption peak at 1384.89/cm, underscores the formation of AgNPs, because the first one is assigned to the vibration frequency of Ag–O ionic bond groups and the second corresponds to the stretching vibration of N-O functional groups [51,52].
The thermal analysis, performed to assess the thermal stability of AgNPs, confirmed the degradation of the phytocompounds (phenolic compounds, alkaloids, terpenoids, flavonoids, glycosides, and aromatic compounds) up to 600 °C, ensuring that the Pg peel ethanolic extract had encapsulated the pre-formed green AgNPs, preventing them from oxidation and agglomeration (Figure 3). Over 900 °C, no changes on the TG curve occurred, meaning that the release of AgO and NO2 took place, which are the products obtained after the decomposition of AgNO3 (around 440 °C). In addition, around 215 °C, the melting of metallic Ag occurs, thus confirming the formation of AgNPs due to the reduction of the Ag+ metal ion to Ag0 (metal) [53].
Electron microscopy was conducted to establish the size and shape of the Pg-AgNPs. Our results revealed that green synthesized Pg-AgNPs have a semi-spherical shape, with a particle size distribution between 5 and 100 nm, the particles being non-uniformly distributed (Figure 4A). This affirmation was also sustained by the count for the size distribution of Pg-AgNPs (Figure 5), which revealed that the average size of Pg-AgNPs was 42.1 ± 0.9 nm, after a granulometric analysis from TEM of more than 200 nanoparticles. In addition, the energy dispersive spectroscopy for element detection exhibited that the microelements contained in the green synthesized Pg-AgNPs were C, O, and Ag (Figure 4B), a statement confirmed also by the mapping analysis, performed to determine the presence of dispersed and homogeneous elements contained in the green synthesized Pg-AgNPs (Figure 4C). The presence of C is overlapped by the carbon signal, used to sputter coat the nanoparticles for better conductivity. The results of this study agree with those of other researchers [18,21,37,38,54,55].
Silver nanoparticles have gained significant attention due to their diverse applications, including antimicrobial, anticancer, and antiviral properties. In addition, among the phytochemicals of herbal products, polyphenols are known to possess antimicrobial activity, particularly phenolic acids and flavonoids. Thus, the antimicrobial investigation was conducted through the disc-diffusion assay, which was carried out against three microorganisms, namely Staphylococcus aureus—a Gram-positive bacterium, and Escherichia coli and Pseudomonas aeruginosa—two Gram-negative bacteria. These types of bacilli strains were chosen because they are involved in skin pathology, and the green synthesized Pg-AgNPs are designated to be tested in in vitro studies, to establish the safety profile on healthy murine epidermal cell lines. Our findings revealed that the S. aureus bacterium needs quite high Pg-AgNP concentrations to inhibit its growth, since the MIC values recorded ranged from 97 μg/mL to 284 μg/mL and the MBC values ranged from 164 μg/mL to 562 μg/mL, as the concentration of green Pg-AgNPs decreased. Some studies also reported antibacterial activity against Gram-positive (S. aureus) bacterium [37,41,56]. This inhibitory activity is due to the binding affinity of silver for the phospholipid layer of the bacterial cell membrane. Therein, the formation of the pores occurs, followed by destabilization and increasing membrane permeability ending with cell death, as a host response [57,58]. On E. coli and P. aeruginosa strains, the green Pg-AgNPs had no antimicrobial activity, when a concentration of 25 to 70 μg/mL was tested. The MIC values obtained in both cases revealed the fact that the green Pg-AgNPs have only bacteriostatic activity on the aforementioned bacilli strains. MIC values ranging from 62 to 18 μg/mL were obtained for E. coli, and for P. aeruginosa, the MIC values obtained were between 55 and 15 μg/mL; in both cases, this effect was Pg-AgNP concentration-dependent, the higher the concentration of Pg-AgNPs, the stronger the antimicrobial effect; that is, a lower MIC value was obtained. One possible explanation would be related to the bacteria cell envelope, which is surrounded by a peptidoglycan layer, which in the case of Gram-negative bacteria is only a few nanometers, representing one to a few layers, while in the case of Gram-positive bacteria, the peptidoglycan thickness is between 30 and 100 nm and contains many layers. Therefore, the green Pg-AgNPs could easily invade the cell wall of Gram-negative bacilli strains because these show the potential to cause damage to Gram-positive bacteria when high concentrations are used (>100 μg/mL). In addition, the Gram-negative bacilli strains are also composed of an outer membrane containing lipopolysaccharide which surrounds the peptidoglycan layer and is missing in the case of Gram-positive bacteria. Our findings agree with the previously reported findings [37,41,59,60,61,62].
Green synthesis of AgNPs has also been explored extensively due to their antioxidant and anti-inflammatory activities [63,64]. In medicine, the interaction of nanoparticles with skin cells, including neonatal human epidermal keratinocytes, was studied to understand their impact and potential toxicity [65]. Evidence suggests that AgNPs can penetrate deep skin layers, such as the epidermis and dermis, highlighting the importance of studying their effects on skin cells [66]. In the context of neonatal BALB/c epidermal cell experimental models, the use of AgNPs presents a promising avenue for research and development. Therefore, in our study, we aimed to assess the safety profile of green Pg-AgNPs obtained from an ethanolic extract of P. granatum peel, as well as the safety profile of Pg extract, in an in vitro experimental model, based on the neonatal BALB/c epidermal cells (JB6 Cl 41-5a). The results obtained showed that, in the case of Pg-AgNPs, the cell viability significantly decreased (58% and 47%) when the highest concentrations of AgNPs were tested (75 and 100 μg/mL). As regards the Pg extract, the cellular viability demonstrated a dose-dependent decrease, reaching 45.3% at the highest concentration tested (100 μg/mL). In addition, doses over 50 µg/mL of green Pg-AgNPs led to a decrease in the confluency of cell morphology along with the appearance of round cells that were detached from the plate. The cytotoxicity studies exhibited significant leaks (>25%) of cytosolic enzyme LDH released into the environment when the highest concentration of Pg-AgNPs was tested (100 μg/mL), thus suggesting a potential cytotoxic effect. In contrast, the Pg extract registered a more pronounced cytotoxic effect than green Pg-AgNPs at the latter two concentrations, reaching about 36% at 100 μg/mL.
It was stated that the size of the AgNPs can impact their cytotoxicity and antimicrobial efficacy [67,68]. The cytotoxicity of silver complexes was investigated using Balb/c cell lines, indicating the potential clinical application of such compounds [69,70]. The cytotoxic effect of AgNPs (green and conventional route) on L929 fibroblasts was also investigated. It was demonstrated that green AgNPs decreased cell viability to a lesser extent than conventional ones. At the concentration of 50 µg/mL, no cytotoxic effect was observed for green nanoparticles, with a viability of approximately 80%, while conventional AgNPs were toxic even at 6.25 µg/mL, with a viability < 20% [71]. In other research, AgNPs from P. granatum leaves induced a dose-dependent decrease in the viability of HeLa cells; at a concentration of 100 µg/mL, the viability rate was <50%, decreasing to approximately 25% at a concentration of 200 µg/mL. Also, with increasing doses, a greater release of lactate dehydrogenase (LDH) into the environment was identified, causing a cytotoxic effect. Moreover, an apoptotic effect was observed following DNA fragmentation assay [72]. The effect of Pg-AgNPs on HeLa, MCF-2, PC-3, A549, and HepG2 cell lines showed that the hatching of cancer cells reduced the suitability of PC-3 and A549 cells with IC50 of 108.7 and 88.42 µg/mL [73]. Following the brine shrimp lethality assay, it was reported that AgNPs from the peel of Punica granatum are very cytotoxic, causing 100% mortality [74]. The study carried out by Saratale and co-workers [24] evaluated the in vitro cytotoxicity of AgNPs from fresh leaves of P. granatum on the HepG2 cell line in the concentration range of 5–200 μg/mL. The results demonstrated that AgNPs possess considerable anticancer activity. From a concentration of 60 μg/mL, a decrease in cell viability below 60% was observed, and at 200 μg/mL, it inhibited cell growth by more than 90%.
Some studies are reporting the in vitro biological activity of Pg extracts. For instance, the Pg flower methanolic extract showed anticancer activity on MCF-7, HepG2, and HeLa cell lines. Differences were observed depending on the treatment period, so for HeLa cells, after 48 h of stimulation, an increase in cell viability was observed compared to 24 h. It can be stated that after one day of treatment, the Pg extract more strongly inhibited cell viability [75]. The study conducted by Li et al. [76] evaluated Pg leaf extract on three lung cancer lines A549, H1299, and LL/2. After the analyses, it was demonstrated that the extract had significant biological activity; the apoptosis occurred through the inhibition of cell proliferation, affecting cell invasion and migration. Among the Pg extracts, the fruit and peel extracts are known to have important therapeutic uses. It was reported that these extracts induced significant effects in vitro on different cancer lines, from breast cancer, colorectal cancer, bladder cancer, and prostate cancer, to leukemia [77,78,79,80,81]. Even the green synthesized AgNps demonstrated effectiveness in inhibiting cancer cell growth [63,82] and in inducing apoptosis in leukemia cells [83], and that the size and shape of AgNPs play a crucial role in exerting their biological activities on cancer cells.
Several types of nanoparticles using P. granatum extract have demonstrated their biological effectiveness. For example, the ZnO-AgNPs synthesized from P. granatum fruit peel extract presented a more pronounced cytotoxic action against several types of cancer cell lines (colorectal carcinoma—HCT116, cervical cancer—Hela, and lung cancer—A549) compared to ZnO-NPs [84]. Also, green Ag and Au NPs from Pg peel extract were evaluated on A549 (lung cancer) and HCT 116 (colon cancer) cell lines. An important cytotoxic effect of both nanoparticles was presented, recording low viabilities of approximately 40–42% at a concentration of 125 µM on both cell lines [85].
The use of green synthesized AgNPs in in ovo assays offers a promising avenue for research and application. In the context of in ovo assays, the application of green synthesized AgNPs can be explored for their anti-angiogenic properties, as evidenced in studies focusing on the inhibition of neovascularization using rat aortic ring models [86]. The establishment of in ovo models, such as the chorioallantoic membrane (CAM) assay, provides a platform to investigate the effects of nanoparticles on angiogenesis and potentially other biological processes [87,88]. The hen’s egg test–chorioallantoic membrane (HET–CAM) is a widely used method in translational research that serves as an alternative to traditional in vitro and in vivo testing methods. This test determines if a substance can cause changes in blood vessels, such as bleeding, clotting, hyperemia, or lysis [89]. Our results reveal the fact that the green synthesized Pg-AgNPs tested at a concentration of 10 μg/mL turned out to be moderately irritating on the chorioallantoic membrane. In addition, when applying a lower concentration of green synthesized Pg-AgNPs on the chorioallantoic membrane, changes in blood vessels, like hemorrhage and lysis, were observed. Apparently, at a higher concentration (50 μg/mL) of Pg-AgNPs, only slight coagulation was observed against the chorioallantoic membrane, classifying the green nanoparticles as weakly irritating.
Therefore, the biocompatibility and unique properties of green synthesized AgNPs make them promising candidates for further research in in ovo assays, offering insights into their impact on various biological mechanisms.
By corroborating all the outcomes obtained in the present study, one can affirm that the green synthesis of AgNPs from Punica granatum offers a sustainable and cost-effective method with diverse applications, including in the biomedical domain. Utilizing plant extracts like Punica granatum not only provides a green alternative to traditional nanoparticle-synthesis methods but also leverages the bioactive compounds present in these plants to enhance nanoparticle functionalities.

4. Materials and Methods

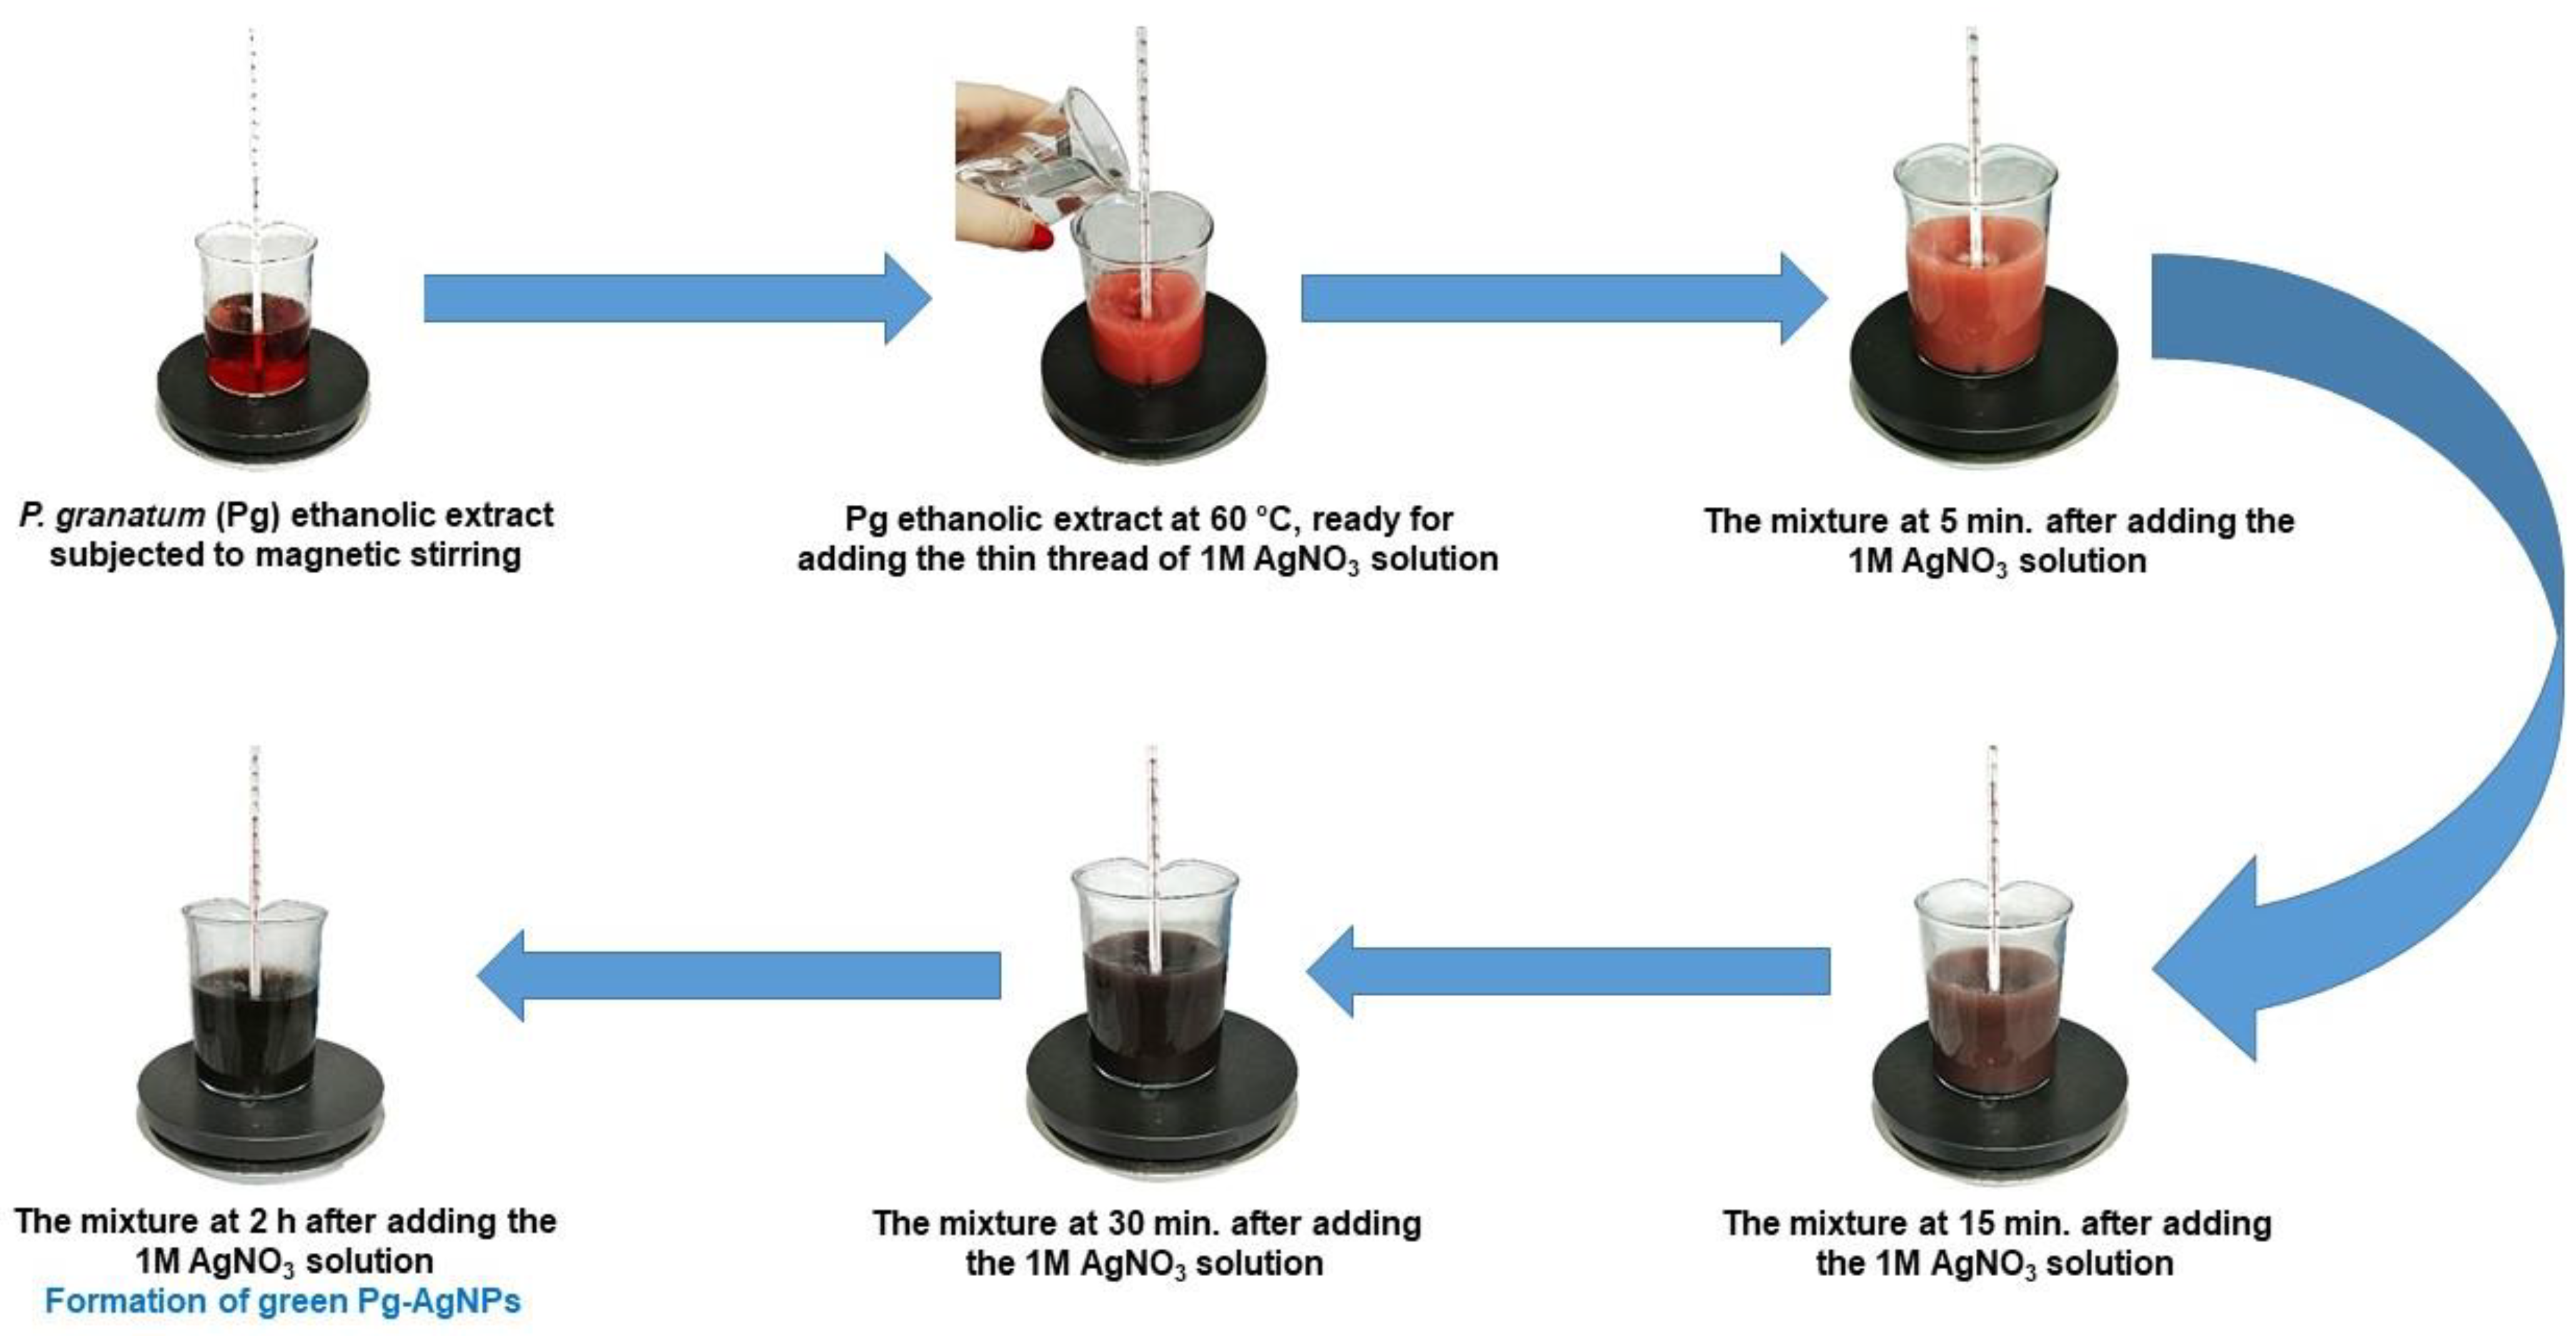
4.1. Biosynthesis of the Pg-AgNPs

For the biosynthesis of the Pg-AgNPs, an ethanolic extract was prepared from P. granatum peel. The pomegranate fruits were purchased from a supermarket in Timisoara, Romania. First, the pomegranate fruits were washed several times with tap water and then with ultra-pure water (Milli-Q® Integral Water Purification System (Merck Millipore, Darmstadt, Germany)), to avoid contamination. After washing and complete drying, the peel was carefully removed, dried in an oven, at 23 ± 1 °C (POL-EKO Aparatura, Wodzisław Slaski, Poland) for 5 days, and then crushed until a fine powder was obtained. Fifty grams of the fine powder was soaked in 250 mL of 95% ethanol (from Chemical Company SA, Iasi, Romania), and the mixture was left to macerate for 2 weeks. After maceration, the mixture was subjected to the sonication process (50% amplitude) for 1 h, using a QSonica Ultrasonic Liquid Processor 700W, Q700 Sonicator (Newtown, CT, USA). After that, the ethanolic extract was filtered through a Whatman filter No. 1. For the synthesis of Pg-AgNPs by the green method, the slightly modified protocol of Ruiz-Baltazar et al. [90] was employed. Further, 100 mL of freshly obtained P. granatum peel ethanolic extract was subjected to a magnetic stirrer, using a magnetic bar. When the temperature of the ethanolic extract reached 60 °C, under vigorous stirring (500 rpm), a freshly prepared aqueous solution of 1 M AgNO3 (50 mL) was added, in a thin thread, and the whole mixture was left for 2 h with magnetic stirring. The volume ratio of AgNO3:Pg peel ethanolic extract was 1:2. Fifteen min after adding the 1 M aqueous solution of AgNO3, the clear red-orange color of the ethanolic extract became reddish-brown, and after 30 min—reddish-black (Figure 12). After 2 h, the color of the mixture changed to black-brown, which confirmed the reduction of AgNO3 to AgNPs. Thus, the green synthesized Pg-AgNPs were obtained.
Finally, the green synthesized Pg-AgNPs were centrifuged at 6000 rpm for 30 min, and dried at 40 °C, in the oven.

4.2. Physicochemical Characterization of Green Synthesized Pg-AgNPs

The formation of green synthesized Pg-AgNPs was confirmed through UV–Vis and FT-IR spectroscopy, thermal analysis, transmission electron microscopy (TEM), and energy dispersive spectroscopy for element mapping, as well as by the color change of the ethanolic extract from the clear red-orange color to black-brown.
The reduction of silver ions by the Pg peel ethanolic extract was monitored using an UviLine 9400 Spectrophotometer from SI Analytics (Deutschland, Germany) at various time intervals, for 2 h after the initiation of the reaction from 190 to 1100 nm for maximum absorption, at a resolution of 2 nm at room temperature.
The functional molecules from P. granatum ethanolic extract, which were involved in the biosynthesis of AgNPs, were recorded through Fourier transform infrared spectroscopy (FT-IR). The FT-IR investigation used the Prestige-21 spectrometer from Shimadzu Corporation (Duisburg, Germany). KBr pellets were obtained in a mixture with green synthesized Pg-AgNPs and analyzed at room temperature (22 ± 2 °C), in the spectral region ranging from 4000 to 400/cm with a resolution of 4/cm. The results were interpreted according to the perfect match between the absorption bands recorded by the green synthesized Pg-AgNPs sample and the absorption band frequency from the library [91].
After biosynthesis, the green nanoparticles were subjected to thermal analysis, to assess the stability of phytocompounds from the surface of AgNPs, coming from P. granatum ethanolic extract. The thermogravimetric (TG) readings and the derivative of the thermogravimetric (DTG) curves for green synthesized Pg-AgNPs were obtained using a NETZSCH TG 209F1 Libra instrument (Netzsch-Gerätebau GmbH, Selb, Germany), in the range of 25–950 °C, at a heating rate of 10 K/min and a flow rate of 20 mL/min of nitrogen atmosphere. To record the TG and DTG curves, aluminum crucibles were used.
The particle size of the green synthesized Pg-AgNPs was evaluated by transmission electron microscopy (TEM), using a Hitachi HD2700 cold field emission gun STEM microscope (Chiyoda, Tokyo, Japan), equipped with two windowless EDX detectors X-MaxN 100 from Oxford Instruments (Abingdon, UK). To prepare the TEM sample, a drop of green synthesized Pg-AgNP aqueous suspension (7 μL) was placed on a carbon-coated copper grid and dried at room temperature (24 °C), and the micrographs were obtained at 200 kV acceleration voltage. The green synthesized Pg-AgNPs were sputter coated with 6 nm of copper (Agar Automatic Sputter Coater, Essex, UK) for better conductivity and high-resolution imaging. In addition, the EDX profile of the sample was determined, and the identified chemical species were expressed in atomic relative percent (At%). By using ImageJ (https://imagej.nih.gov/ij/, accessed on 24 May 2024), the green Pg-AgNPs’ size and aspect ratio statistics were determined from TEM images.

4.3. In Vitro Toxicological Screening of Green Synthesized Pg-AgNPs

4.3.1. Specific Reagents and Equipment

A series of reagents were used for the in vitro testing of green synthesized Pg-AgNPs. Eagle’s Minimum Essential Medium (EMEM), fetal bovine serum (FBS), trypsin-EDTA solution, and MTT (3-(4,5-dimethylthiazol2-yl)-2,5-diphenyltetrazolium bromide) kit were purchased from Sigma Aldrich, Steinheim, Germany. Phosphate-buffered saline (PBS), a mixture of penicillin/streptomycin (pen/strep), and dimethyl sulfoxide (DMSO) were provided by PAN-Biotech GmbH, Aidenbach, Germany. The lactate dehydrogenase (LDH) kit and the Hoechst 33342 dye were furnished from ThermoFisher Scientific (Waltham, MA, USA). The equipment used for the in vitro assays were: Cytation 5 (plate reader), and Lionheart FX (automated microscope), procured from BioTek Instruments Inc. (Winooski, VT, USA); and for imaging and analysis, the Olympus IX73 (Tokyo, Japan) inverted microscope was used with cellSens Dimensions v.1.8. software.

4.3.2. Antimicrobial Activity

The antimicrobial assay of Pg-AgNPs was performed by determining minimum inhibitory concentration (MIC) and minimum bactericidal concentration (MBC). The European Committee on Antimicrobial Susceptibility Testing (EUCAST) and the Clinical Laboratory and Standard Institute (CLSI) indicated how the broth dilution assay must be performed. Previous studies extensively describe the indications regarding the broth dilution assay [92,93,94]. NaCl 0.85% (bioMérieux, Marcy-l’Étoile, France) was used to dilute the standardized bacterial inoculum of 0.5 McFarland, to obtain approximately 5 × 10⁵ colony forming units/mL (CFU). Then, the bacterial suspension and the Pg-AgNPs at the tested concentrations were added to Mueller–Hinton broth (Thermo Scientific, Waltham, MA, USA). After 24 h of incubation at 35 °C, the lowest concentration without visible growth was interpreted as the MIC value. The MBC was established by sub-cultivating 1 μL of suspension from the test tube, without visible growth, on Columbia agar with 5% sheep blood. The MBC was considered the lowest concentration to kill 99.9% of the bacteria. Determinations were performed in triplicate for each tested strain and each tested concentration of green Pg-AgNPs, obtained from Pg peel ethanolic extract.
The American Type Culture Collection (ATCC) (Manassas, VA, USA) provided the microorganism strains used in the present study, namely Gram-positive Staphylococcus aureus (ATCC 25923), and two Gram-negative strains, Escherichia coli (ATCC 25922) and Pseudomonas aeruginosa (ATCC 27853). Initially, all tested bacteria were isolated on Columbia agar supplemented with 5% sheep blood (Thermo Scientific, Waltham, MA, USA).

4.3.3. Cell Culture

The neonatal BALB/c epidermal cells (JB6 Cl 41-5a) were purchased from American Type Culture Collection (Manassas, VA, USA), and cultured in the specific medium—EMEM supplemented with 5% FBS and 1% antibiotic mixture. JB6 Cl 41-5a cells were maintained under specific conditions (5% CO2 and 37 °C).

4.3.4. Treatment Protocol

The green synthesized Pg-AgNPs were dissolved in the ultrapure deionized water until a 1 mg/mL stock solution was achieved. Stock solution was further used to prepare five concentrations: 10, 25, 50, 75, and 100 µg/mL, which were further tested on cells.

4.3.5. Cell Viability Test

The first in vitro analysis performed was the MTT colorimetric test through which we analyzed the action of green synthesized Pg-AgNPs on cell viability. Initially, JB6 Cl 41-5a cells were cultured in a 96-well experimental plate (1 × 10⁴/well) and stimulated with the synthesized Pg-AgNPs (10, 25, 50, 75, 100 μg/mL) for 24 h. After treatment, the medium was removed, MTT reagent (10 μL) was added, and the cells were incubated for 3 h. In the last step, solubilization buffer (100 μL) was added and left in contact for 30 min at room temperature. Absorbances were measured at 570 nm using a Cytation 5 device from BioTek Instruments Inc., Winooski, VT, USA.

4.3.6. Cellular Morphology Analysis

The cellular morphology of JB6 CCl 41-5a cells was examined after 24 h of treatment with green synthesized Pg-AgNPs (10, 25, 50, 75, 100 μg/mL) to highlight the changes produced. To analyze the impact created on the morphology, photos were taken under bright field lighting conditions (20×) using Olympus IX73 inverted microscope and the cellSens Dimensions v.1.8. Software.

4.3.7. Evaluation of Cell Confluence and Cell Number

The confluence and cell number were determined to evaluate the influence of green synthesized Pg-AgNPs treatment on JB6 Cl 41-5a cells. The cells were imaged after 24 h at magnification 4× using the Lionheart FX automated microscope. The images were analyzed using Gen5 Microplate Data Collection and Analysis Software, Version 3.14 (BioTek Instruments Inc., Winooski, VT, USA).

4.3.8. Assessment of Lactate Dehydrogenase (LDH) Leakage

A cytotoxicity analysis that measures the amount of the cytosolic enzyme—LDH—released into the media was carried out following the same principle as the MTT test, to evaluate the ability of green synthesized Pg-AgNPs (10, 25, 50, 75, 100 μg/mL) to damage the cell membrane. After incubating the cells for 24 h with the green synthesized Pg-AgNPs, 50 µL of medium/well with released LDH was transferred to a new 96-well plate, over which 50 µL of the reaction mixture was added to each well and incubated in the dark, at room temperature, for 30 min. Finally, 50 µL of stop solution was added to each well. Absorbances were read at 490 and 680 nm using Cytation 5 (BioTek Instruments Inc., Winooski, VT, USA).

4.3.9. Hoechst Nuclear Staining

Nuclei were marked using the Hoechst 33342 staining test. The protocol consisted of the following steps: (1) treating JB6 cells (105 cells/well) with green synthesized Pg-AgNPs (50, and 100 μg/mL) for 24 h; (2) removing the medium and adding the Hoechst solution—500 µL/well (1:2000 in PBS); (3) incubating the cells with the staining solution for 10–15 min in the dark and at room temperature and (4) washing the wells with PBS (3×). The images were taken using Lionheart FX automated microscope and processed using Gen5 Microplate Data Collection and Analysis Software.

4.4. In Ovo Toxicological Screening of Green Synthesized Pg-AgNPs

The hen’s egg test–chorioallantoic membrane (HET-CAM) method was chosen to evaluate the irritant potential of green synthesized Pg-AgNPs. The irritability test was carried out by following several steps that involved modifying a protocol established by ICCVAM (Interagency Coordinating Committee on the Validation of Alternative Methods (ICCVAM), ICCVAM Recommended Test Method Protocol: Hen’s Egg Test–Chorioallantoic Membrane 2010. Available online: http://iccvam.niehs.nih.gov/, accessed on 1 April 2024). Fertile hen eggs, weighing between 50 and 60 g, were selected and incubated at a temperature of 37.5 °C with a humidity level of 60%. On the fourth day of incubation, a syringe was used to extract around 5–7 mL of egg white to detach the developing chorioallantoic membrane from the inner shell. On the fifth day of incubation, a window was cut on top of the egg to observe the chorioallantoic membrane, which was then covered with medical adhesive tape to prevent dehydration. The eggs were then returned to the incubator until day 8 when the HET-CAM assay was conducted. As part of the test, distilled water was used as the negative control, while 1% sodium dodecyl sulfate (SDS) was used as the positive control. Test concentrations for the green synthesized Pg-AgNPs were selected—10 μg/mL and 50 μg/mL. A volume of 600 mL of the negative control, positive control, and samples were applied to the chorioallantoic membrane. The vascular plexus changes were observed under a stereomicroscope for 300 s. The objective was to identify any signs of vascular lysis (L = disintegration of the blood vessel), coagulation (C = protein denaturation), or hemorrhage (H = bleeding occurring from the vessels). The Zeiss SteREO Discovery.V8 stereomicroscope (Jena, Germany) coupled with a Zeiss Axiocam 105 color digital camera was used for imaging and analysis. All images were processed using ImageJ v 1.50e software (U.S. National Institutes of Health, Bethesda, MD, USA, https://imagej.nih.gov/ij/index.html, accessed on 1 April 2024).
An irritation score (IS) is determined by analyzing the incidence of the processes listed above, which helps to place the tested samples into one of the following classifications: non-irritant (0–0.9), weak irritant (1–4.9), moderately irritant (5–8.9), strongly irritant (9–21), according to Luepke [95]. The irritability score (IS) was calculated according to the following formula [96]:
IS = 5 × [ 301 Sec H 300 ] + 7 × [ 301 Sec L 300 ] + 9 × [ 301 Sec C 300 ]

5. Conclusions

The present study undertook a preliminary safety profile investigation regarding the in vitro and in ovo screening of green synthesized AgNPs from P. granatum ethanolic peel extract. The outcomes reveal that, at higher doses (75 and 100 μg/mL), these nanoparticles show promising cytotoxic effects on healthy murine epidermal cell viability, as well as on cell morphology, leading to a decrease in cell confluency until these became round and detached from the plate. In addition, the cell membrane revealed significant leaks of cytosolic enzyme LDH released into the environment, at the same higher concentration. A potential cytotoxic effect was also shown against the Gram-positive and Gram-negative bacilli strains used, depending on the Pg-AgNP concentration used. As regards the in ovo toxicological screening, the irritation score indicated that the green synthesized Pg-AgNPs at 50 μg/mL exhibited a better safety profile compared to the concentration of 10 μg/mL. Therefore, further research would be needed to fully understand the safety and efficacy of the green AgNPs obtained from P. granatum ethanolic peel extracts at different concentrations. Overall, the use of AgNPs in neonatal BALB/c epidermal cell experimental models holds great potential for advancing our understanding of nanoparticle–cell interactions, cytotoxicity, and immune responses. This study provides a starting point for further investigation regarding the effects of Pg-AgNPs on angiogenesis and potentially other biological processes, thus underscoring their utility in cancer therapy.

Author Contributions

Conceptualization, O.S.S. and E.-A.M.; methodology, O.S.S., E.-A.M., A.-D.S., R.D. and A.-R.J.; software, E.-A.M. and A.-D.S.; validation, M.P., C.-A.D., and A.C.; formal analysis, O.S.S., E.-A.M., A.-D.S., R.D. and A.-R.J.; investigation, E.-A.M., A.-D.S., R.D. and A.-R.J.; resources, M.P. and C.-A.D.; data curation, E.-A.M., and A.-D.S.; writing—original draft preparation, O.S.S., E.-A.M., A.-D.S. and A.-R.J.; writing—review and editing, E.-A.M. and R.D.; visualization, M.P., C.-A.D. and A.C.; supervision, M.P., C.-A.D. and A.C.; project administration, O.S.S. and C.-A.D.; All authors have read and agreed to the published version of the manuscript.

Funding

This research received no external funding.

Data Availability Statement

The data are available on request from the corresponding author.

Acknowledgments

The authors would like to acknowledge “Victor Babes” University of Medicine and Pharmacy Timisoara for their support in covering the costs of publication for this research paper.

Conflicts of Interest

The authors declare no conflicts of interest.

References

  1. Das, P.; Ghosh, S.; Nayak, B. Phyto-fabricated Nanoparticles and Their Anti-biofilm Activity: Progress and Current Status. Front. Nanotechnol. 2021, 3, 739286. [Google Scholar] [CrossRef]
  2. Yuan, L.; Ozcan, S. Green nanomaterials: On track for a sustainable future. Nano Today 2015, 10, 417–420. [Google Scholar]
  3. Ullah, A.; Lim, S.I. Plant extract-based synthesis of metallic nanomaterials, their applications, and safety concerns. Biotechnol. Bioeng. 2022, 119, 2273–2304. [Google Scholar] [CrossRef]
  4. Kumar, S.; Lather, V.; Pandita, D. Green synthesis of therapeutic nanoparticles: An expanding horizon. Nanomedicine 2015, 10, 2451–2471. [Google Scholar] [CrossRef]
  5. Hamrayev, H.; Shameli, K.; Korpayev, S. Green synthesis of zinc oxide nanoparticles and its biomedical applications: A review. J. Res. Nanosci. Nanotechnol. 2021, 1, 62–74. [Google Scholar] [CrossRef]
  6. Park, S.Y.; Lu, G.; Kim, B.; Song, W.C.; Park, G.; Choi, Y.W. A Comparative Study on Physicochemical, Photocatalytic, and Biological Properties of Silver Nanoparticles Formed Using Extracts of Different Parts of Cudrania tricuspidata. Nanomaterials 2020, 10, 1350. [Google Scholar] [CrossRef] [PubMed]
  7. Ranjani, S.; Shariq Ahmed, M.; Ruckmani, K.; Hemalatha, S. Green Nanocolloids Control Multi-Drug Resistant Pathogenic Bacteria. J. Clust. Sci. 2020, 31, 861–866. [Google Scholar] [CrossRef]
  8. Karimi, S.; Mahdavi Shahri, M. Medical and cytotoxicity effects of green synthesized silver nanoparticles using Achillea millefolium extract on MOLT-4 lymphoblastic leukemia cell line. J. Med. Virol. 2021, 93, 3899–3906. [Google Scholar] [CrossRef]
  9. Sani, S.; Nair, S. Studies on in vitro evaluation of antidiabetic potentials of watermelon and pomegranate peels. Bayero J. Pure Appl. Sci. 2017, 10, 32–35. [Google Scholar] [CrossRef]
  10. Jain, V.; Viswanatha, G.L.; Manohar, D.; Shivaprasad, H.N. Isolation of Antidiabetic Principle from Fruit Rinds of Punica granatum. Evid. Based Complement. Alternat. Med. 2012, 2012, 147202. [Google Scholar] [CrossRef]
  11. Vini, R.; Sreeja, S. Punica granatum and its therapeutic implications on breast carcinogenesis: A review. Biofactors 2015, 41, 78–89. [Google Scholar] [CrossRef] [PubMed]
  12. Muharrami, L.; Munawaroh, F.; Ersam, T.; Santoso, M. Phytochemical screening of ethanolic extract: A preliminary test on five medicinal plants on bangkalan. J. Pena Sains 2020, 7, 96–102. [Google Scholar] [CrossRef]
  13. Dioguardi, M.; Ballini, A.; Sovereto, D.; Spirito, F.; Cazzolla, A.P.; Aiuto, R.; Crincoli, V.; Caloro, G.A.; Lo Muzio, L. Application of the Extracts of Punica granatum in Oral Cancer: Scoping Review. Dent. J. 2022, 10, 234. [Google Scholar] [CrossRef] [PubMed]
  14. Awasthi, A.; Juyal, D.; Singh, M.; Sharma, S. In vivo and in vitro study to evaluate the anti-osteoporotic activity of Punica granatum seed, Bambusa arundinaceae leaves, and trichosanthes diocio fruit ethanolic extract. Indian J. Anim. Res. 2024, 58, 107–114. [Google Scholar] [CrossRef]
  15. Ajaikumar, K.B.; Asheef, M.; Babu, B.H.; Padikkala, J. The inhibition of gastric mucosal injury by Punica granatum L. (pomegranate) methanolic extract. J. Ethnopharmacol. 2005, 96, 171–176. [Google Scholar] [CrossRef] [PubMed]
  16. Willian, N. Silver Nanoparticles (AgNPs) as Effective Disinfectants with Natural Source: A New Inspiration. IOP Conf. Ser. Earth Environ. Sci. 2023, 1148, 012002. [Google Scholar] [CrossRef]
  17. Celebioglu, H.U.; Imamoglu, R.; Tas, R. Biogenic synthesis of silver nanoparticles using trachystemon orientalis l. and their antibacterial activities. In Proceedings of the 13th International Conference on Nanomaterials—Research & Application, Brno, Czech Republic, 20–22 October 2021; pp. 329–336. [Google Scholar]
  18. Annu Ahmed, S.; Kaur, G.; Sharma, P.; Singh, S.; Ikram, S. Evaluation of the antioxidant, antibacterial and anticancer (lung cancer cell line A549) activity of Punica granatum mediated silver nanoparticles. Toxicol. Res. 2018, 7, 923–930. [Google Scholar] [CrossRef]
  19. Periakaruppan, R.; Manju, P.; Priya, C.; Ranjitha, P.; Gokul Raj, S.; Danaraj, J. Biosynthesis of Silica Nanoparticles Using the Leaf Extract of Punica granatum and Assessment of Its Antibacterial Activities Against Human Pathogens. Appl. Biochem. Biotechnol. 2022, 194, 5594–5605. [Google Scholar] [CrossRef] [PubMed]
  20. Roy, A.; Bulut, O.; Some, S.; Mandal, A.K.; Yilmaz, M.D. Green synthesis of silver nanoparticles: Biomolecule-nanoparticle organizations targeting antimicrobial activity. RSC Adv. 2019, 9, 2673–2702. [Google Scholar] [CrossRef]
  21. Singhal, M.; Chatterjee, S.; Kumar, A.; Syed, A.; Bahkali, A.H.; Gupta, N.; Nimesh, S. Exploring the Antibacterial and Antibiofilm Efficacy of Silver Nanoparticles Biosynthesized Using Punica granatum Leaves. Molecules 2021, 26, 5762. [Google Scholar] [CrossRef]
  22. Franzolin, M.R.; Courrol, D.D.S.; Silva, F.R.O.; Courrol, L.C. Antimicrobial Activity of Silver and Gold Nanoparticles Prepared by Photoreduction Process with Leaves and Fruit Extracts of Plinia cauliflora and Punica granatum. Molecules 2022, 27, 6860. [Google Scholar] [CrossRef] [PubMed]
  23. Saratale, G.D.; Saratale, R.G.; Kim, D.S.; Kim, D.Y.; Shin, H.S. Exploiting Fruit Waste Grape Pomace for Silver Nanoparticles Synthesis, Assessing Their Antioxidant, Antidiabetic Potential and Antibacterial Activity Against Human Pathogens: A Novel Approach. Nanomaterials 2020, 10, 1457. [Google Scholar] [CrossRef] [PubMed]
  24. Saratale, R.G.; Shin, H.S.; Kumar, G.; Benelli, G.; Kim, D.S.; Saratale, G.D. Exploiting antidiabetic activity of silver nanoparticles synthesized using Punica granatum leaves and anticancer potential against human liver cancer cells (HepG2). Artif. Cells Nanomed. Biotechnol. 2018, 46, 211–222. [Google Scholar] [CrossRef] [PubMed]
  25. Emima Jeronsia, J.; Ragu, R.; Jerline Mary, A.; Jerome Das, S. Elucidating the structural, anticancer, and antibacterial traits of Punica granatum peel extracts-mediated Ag and Ag/GO nanocomposites. Microsc. Res. Tech. 2022, 85, 44–55. [Google Scholar]
  26. Saeidnia, S.; Manayi, A.; Abdollahi, M. From in vitro experiments to in vivo and clinical studies; Pros and cons. Curr. Drug Discov. Technol. 2015, 12, 218–224. [Google Scholar] [CrossRef] [PubMed]
  27. Ruedinger, F.; Lavrentieva, A.; Blume, C.; Pepelanova, I.; Scheper, T. Hydrogels for 3D mammalian cell culture: A starting guide for laboratory practice. Appl. Microbiol. Biotechnol. 2015, 99, 623–636. [Google Scholar] [CrossRef] [PubMed]
  28. Moacă, E.A.; Watz, C.; Faur, A.C.; Lazăr, D.; Socoliuc, V.; Păcurariu, C.; Ianoș, R.; Rus, C.I.; Minda, D.; Barbu-Tudoran, L.; et al. Biologic Impact of Green Synthetized Magnetic Iron Oxide Nanoparticles on Two Different Lung Tumorigenic Monolayers and a 3D Normal Bronchial Model—EpiAirwayTM Microtissue. Pharmaceutics 2023, 15, 2. [Google Scholar] [CrossRef] [PubMed]
  29. Prodan-Bărbulescu, C.; Watz, C.G.; Moacă, E.A.; Faur, A.C.; Dehelean, C.A.; Faur, F.I.; Grigoriţă, L.O.; Maghiari, A.L.; Tuţac, P.; Duţă, C.; et al. A Preliminary Report Regarding the Morphological Changes of Nano-Enabled Pharmaceutical Formulation on Human Lung Carcinoma Monolayer and 3D Bronchial Microtissue. Medicina 2024, 60, 208. [Google Scholar] [CrossRef] [PubMed]
  30. Leighton, J.; Nassauer, J.; Tchao, R. The chick embryo in toxicology: An alternative to the rabbit eye. Food Chem. Toxicol. 1985, 23, 293–298. [Google Scholar] [CrossRef]
  31. Buhr, C.; Wiesmann, N.; Tanner, R.; Brieger, J.; Eckrich, J. The chorioallantoic membrane assay in nanotoxicological research—An alternative for in vivo experimentation. Nanomaterials 2020, 10, 2328. [Google Scholar] [CrossRef]
  32. Mangır, N.; Dikici, S.; Claeyssens, F.; MacNeil, S. Using ex ovo chick chorioallantoic membrane (cam) assay to evaluate the biocompatibility and angiogenic response to biomaterials. ACS Biomater. Sci. Eng. 2019, 5, 3190–3200. [Google Scholar] [CrossRef] [PubMed]
  33. Ahmed, S.; Ahmad, M.; Swami, B.L.; Ikram, S. A review on plants extract mediated synthesis of silver nanoparticles for antimicrobial applications: A green expertise. J. Adv. Res. 2016, 7, 17–28. [Google Scholar] [CrossRef] [PubMed]
  34. Raveendran, P.; Fu, J.; Wallen, S.L. Completely “green” synthesis and stabilization of metal nanoparticles. J. Am. Chem. Soc. 2003, 125, 13940–13941. [Google Scholar] [CrossRef] [PubMed]
  35. Mousavi, S.M.; Hashemi, S.A.; Ghasemi, Y.; Atapour, A.; Amani, A.M.; Dashtaki, A.S.; Babapoor, A.; Arjmand, O. Green synthesis of silver nanoparticles toward bio and medical applications: Review study. Artif. Cells Nanomed. Biotechnol. 2018, 46, S855–S872. [Google Scholar] [CrossRef] [PubMed]
  36. Moradi, F.; Sedaghat, S.; Moradi, O.; Salmanabadi, S.A. Review on green nano-biosynthesis of silver nanoparticles and their biological activities: With an emphasis on medicinal plants. Inorg. Nano Met. Chem. 2020, 51, 133–142. [Google Scholar] [CrossRef]
  37. Farouk, S.M.; Abu-Hussien, S.H.; Abd-Elhalim, B.T.; Mohamed, R.M.; Arabe, N.M.; Hussain, A.A.T.; Mostafa, M.E.; Hemdan, B.; El-Sayed, S.M.; Bakry, A.; et al. Biosynthesis and characterization of silver nanoparticles from Punica granatum (pomegranate) peel waste and its application to inhibit foodborne pathogens. Sci. Rep. 2023, 13, 19469. [Google Scholar] [CrossRef] [PubMed]
  38. Devanesan, S.; AlSalhi, M.S.; Balaji, R.V.; Ranjitsingh, A.J.A.; Ahamed, A.; Alfuraydi, A.A.; AlQahtani, F.Y.; Aleanizy, F.S.; Othman, A.H. Antimicrobial and Cytotoxicity Effects of Synthesized Silver Nanoparticles from Punica granatum Peel Extract. Nanoscale Res. Lett. 2018, 13, 315. [Google Scholar] [CrossRef] [PubMed]
  39. Rouhollah, H.; Marzieh, R. Green synthesis of silver nanoparticles using extract of oak fruit hull (Jaft): Synthesis and in vitro cytotoxic effect on MCF-7 cells. Int. J. Breast Cancer 2015, 2015, 846743. [Google Scholar]
  40. Arya, G.; Kumari, R.M.; Sharma, N.; Gupta, N.; Kumar, A.; Chatterjee, S.; Nimesh, S. Catalytic, antibacterial and antibiofilm efficacy of biosynthesised silver nanoparticles using Prosopis juliflora leaf extract along with their wound healing potential. J. Photochem. Photobiol. B Biol. 2019, 190, 50–58. [Google Scholar] [CrossRef]
  41. Khorrami, S.; Kamali, F.; Zarrabi, A. Bacteriostatic activity of aquatic extract of black peel pomegranate and silver nanoparticles biosynthesized by using the extract. Biocatal. Agric. Biotechnol. 2020, 25, 101620. [Google Scholar] [CrossRef]
  42. Khorrami, S.; Abdollahi, Z.; Eshaghi, G.; Khosravi, A.; Bidram, E.; Zarrabi, A. An improved method for fabrication of Ag-GO nanocomposite with controlled anticancer and anti-bacterial behavior; A comparative study. Sci. Rep. 2019, 9, 9167. [Google Scholar] [CrossRef]
  43. Allafchian, A.R.; Mirahmadi-Zare, S.Z.; Jalali, S.A.H.; Hashemi, S.S.; Vahabi, M.R. Green synthesis of silver nanoparticles using phlomis leaf extract and investigation of their antibacterial activity. J. Nanostructure Chem. 2016, 6, 129–135. [Google Scholar] [CrossRef]
  44. Khaleghi, M.; Khorrami, S.; Ravan, H. Identification of Bacillus thuringiensis bacterial strain isolated from the mine soil as a robust agent in the biosynthesis of silver nanoparticles with strong antibacterial and anti-biofilm activities. Biocatal. Agric. Biotechnol. 2019, 18, 101047. [Google Scholar] [CrossRef]
  45. MubarakAli, D.; Thajuddin, N.; Jeganathan, K.; Gunasekaran, M. Plant extract mediated synthesis of silver and gold nanoparticles and its antibacterial activity against clinically isolated pathogens. Colloids Surf. B Biointerfaces 2011, 85, 360–365. [Google Scholar] [CrossRef]
  46. Raja, S.; Ramesh, V.; Thivaharan, V. Green biosynthesis of silver nanoparticles using Calliandra haematocephala leaf extract, their antibacterial activity and hydrogen peroxide sensing capability. Arab. J. Chem. 2017, 10, 253–261. [Google Scholar] [CrossRef]
  47. Ritu-Verma, K.K.; Das, A.; Chandra, P. Phytochemical-based synthesis of silver nanoparticle: Mechanism and potential applications. BioNanoScience 2023, 13, 1359–1380. [Google Scholar] [CrossRef]
  48. Patra, S.; Mukherjee, S.; Barui, A.K.; Ganguly, A.; Sreedhar, B.; Patra, C.R. Green synthesis, characterization of gold and silver nanoparticles and their potential application for cancer therapeutics. Mater. Sci. Eng. C Mater. Biol. Appl. 2015, 53, 298–309. [Google Scholar] [CrossRef]
  49. Das, B.; De, A.; Das, M.; Das, S.; Samanta, A. A new exploration of Dregea volubilis flowers: Focusing on antioxidant and antidiabetic properties. S. Afr. J. Bot. 2017, 109, 16–24. [Google Scholar] [CrossRef]
  50. Zia, M.; Gul, S.; Akhtar, J.; Haq, I.U.; Abbasi, B.H.; Hussain, A.; Naz, S.; Chaudhary, M.F. Green synthesis of silver nanoparticles from grape and tomato juices and evaluation of biological activities. IET Nanobiotechnol. 2017, 11, 193–199. [Google Scholar] [CrossRef] [PubMed]
  51. Giri, N.; Natarajan, R.; Gunasekaran, S.; Shreemathi, S. 13C NMR and FTIR spectroscopic study of blend behavior of PVP and nano silver particles. Arch. Appl. Sci. Res. 2011, 3, 624–630. [Google Scholar]
  52. Yong, N.L.; Ahmad, A.; Mohammad, A.W. Synthesis and characterization of silver oxide nanoparticles by a novel method. Int. J. Sci. Eng. Res. 2013, 4, 155–158. [Google Scholar]
  53. Perry, H.R.; Green, W.D.; Maloney, O.J. Perry’s Chemical Engineers’ Handbook, 7th ed.; McGraw Hill: New York, NY, USA, 1999. [Google Scholar]
  54. Fadel, Q.J.; Al-Mashhedy, L.A.M. Biosynthesis of silver nanoparticles using peel extract of Raphanus sativus L. Biotechnol. Ind. J. 2017, 13, 120. [Google Scholar]
  55. Mojgan, G.; Noshin, M.; Mehdi, M.K.; Samira, B.; Masoud, S.N. Biosynthesis and characterization of silver nanoparticles prepared from two novel natural precursors by facile thermal decomposition methods. Sci. Rep. 2016, 6, 32539. [Google Scholar]
  56. Chand, K.; Abro, M.I.; Aftab, U.; Shah, A.H.; Lakhan, M.N.; Cao, D.; Mehdi, G.; Mohamed, A.M.A. Green synthesis characterization and antimicrobial activity against: Staphylococcus aureus of silver nanoparticles using extracts of neem, onion and tomato. RSC Adv. 2019, 9, 17002–17015. [Google Scholar] [CrossRef]
  57. Mostafa, Y.S.; Alamri, S.A.; Alrumman, S.A.; Hashem, M.; Baka, Z.A. Green synthesis of silver nanoparticles using pomegranate and orange peel extracts and their antifungal activity against alternaria solani, the causal agent of early blight disease of tomato. Plants 2021, 10, 2363. [Google Scholar] [CrossRef]
  58. Mansoor, S.; Zahoor, I.; Baba, T.R.; Padder, S.A.; Bhat, Z.A.; Koul, A.M.; Jiang, L. Fabrication of silver nanoparticles against fungal pathogens. Front. Nanotechnol. 2021, 3, 859. [Google Scholar] [CrossRef]
  59. Javan Bakht Dalir, S.; Djahaniani, H.; Nabati, F.; Hekmati, M. Characterization and the evaluation of antimicrobial activities of silver nanoparticles biosynthesized from Carya illinoinensis leaf extract. Heliyon 2020, 6, e03624. [Google Scholar] [CrossRef]
  60. Raheem, H.Q.; Al-Thahab, A.; Abd, F.G. Antibacterial activity of silver nanoparticles extracted from Proteus mirabilis and healing the wound in rabbit. Biochem. Cell. Arch. 2018, 18, 97–104. [Google Scholar]
  61. Parvekar, P.; Palaskar, J.; Metgud, S.; Maria, R.; Dutta, S. The minimum inhibitory concentration (MIC) and minimum bactericidal concentration (MBC) of silver nanoparticles against Staphylococcus aureus. Biomater. Investig. Dent. 2020, 7, 105–109. [Google Scholar] [CrossRef]
  62. Wypij, M.; Czarnecka, J.; Swiecimska, M.; Dahm, H.; Rai, M.; Golinska, P. Synthesis, characterization and evaluation of antimicrobial and cytotoxic activities of biogenic silver nanoparticles synthesized from Streptomyces xinghaiensis OF1 strain. World J. Microbiol. Biotechnol. 2018, 34, 23. [Google Scholar] [CrossRef]
  63. Manjunatha, D.; Megha, G.T.; Nagaraju, S.; Akarsh, S.; Nandish, G.; Sowmya, H.V.; Thippeswamy, B. Eco-friendly synthesized silver nanoparticles from endophytic fungus Phyllosticta owaniana: KUMBMDBT-32 and evaluation of biomedical properties. Arch. Microbiol. 2023, 205, 217. [Google Scholar] [CrossRef]
  64. Erdoğan, Ö.; Paşa, S.; Çevik, Ö. Green synthesis and characterization of anticancer effected silver nanoparticles with silverberry (Elaeagnus angustifolia) fruit aqueous extract. Int. J. Pure Appl. Sci. 2021, 7, 391–400. [Google Scholar] [CrossRef]
  65. Ryman-Rasmussen, J.P.; Riviere, J.E.; Monteiro-Riviere, N.A. Variables influencing interactions of untargeted quantum dot nanoparticles with skin cells and identification of biochemical modulators. Nano Lett. 2007, 7, 1344–1348. [Google Scholar] [CrossRef]
  66. Bolzinger, M.; Briançon, S.; Chevalier, Y. Nanoparticles through the skin: Managing conflicting results of inorganic and organic particles in cosmetics and pharmaceutics. Wiley Interdiscip. Rev. Nanomed. Nanobiotechnol. 2011, 3, 463–478. [Google Scholar] [CrossRef]
  67. Hamdy, M.; Elbehairi, S.; Shati, A.; Abd-Rabboh, H.; Alfaifi, M.; Fawy, K.; Ibrahium, H.A.; Alamri, S.; Awwad, N.S. Cytotoxic potential of bio-silica conjugate with different sizes of silver nanoparticles for cancer cell death. Materials 2022, 15, 4074. [Google Scholar] [CrossRef] [PubMed]
  68. Anish, S.; Mahesh Kumar, D. Evaluation of the In Vitro Cytotoxicity of Silver Nanoparticles on PBMC Cells Using MTT Assay. Ann. Int. Med. Dent. Res. 2022, 8, 185–191. [Google Scholar]
  69. Radko, L.; Stypuła-Trębas, S.; Posyniak, A.; Żyro, D.; Ochocki, J. Silver(I) Complexes of the Pharmaceutical Agents Metronidazole and 4-Hydroxymethylpyridine: Comparison of Cytotoxic Profile for Potential Clinical Application. Molecules 2019, 24, 1949. [Google Scholar] [CrossRef]
  70. Stryjska, K.; Radko, L.; Chęcińska, L.; Kusz, J.; Posyniak, A.; Ochocki, J. Synthesis, Spectroscopy, Light Stability, Single-Crystal Analysis, and In Vitro Cytotoxic Activity on HepG2 Liver Cancer of Two Novel Silver(I) Complexes of Miconazole. Int. J. Mol. Sci. 2020, 21, 3629. [Google Scholar] [CrossRef] [PubMed]
  71. Fernandes, R.A.; Berretta, A.A.; Torres, E.C.; Buszinski, A.F.M.; Fernandes, G.L.; Mendes-Gouvêa, C.C.; De Souza-Neto, F.N.; Gorup, L.F.; De Camargo, E.R.; Barbosa, D.B. Antimicrobial Potential and Cytotoxicity of Silver Nanoparticles Phytosynthesized by Pomegranate Peel Extract. Antibiotics 2018, 7, 51. [Google Scholar] [CrossRef]
  72. Sarkar, S.; Kotteeswaran, V. Green synthesis of silver nanoparticles from aqueous leaf extract of Pomegranate (Punica granatum) and their anticancer activity on human cervical cancer cells. Adv. Nat. Sci. Nanosci. Nanotechnol. 2018, 9, 025014. [Google Scholar] [CrossRef]
  73. Padmaa Paarakh, M.; Ani Jose, P. In vitro, anticancer activity of silver nanoparticle synthesized from Punica granatum dried peel against cancer cell lines. Indian J. Nat. Prod. Resour. 2020, 11, 224–238. [Google Scholar]
  74. Saad, P.G.; Castelino, R.D.; Ravi, V.; Al-Amri, I.S.; Khan, S.A. Green synthesis of silver nanoparticles using Omani pomegranate peel extract and two polyphenolic natural products: Characterization and comparison of their antioxidant, antibacterial, and cytotoxic activities. Beni-Suef Univ. J. Basic. Appl. Sci. 2021, 10, 29. [Google Scholar] [CrossRef]
  75. Durgawale, P.P.; Datkhile, K.D. Study of in-vitro anti-cancer and anti-oxidative properties of methanolic extract of Punica granatum flowers. Der Pharm. Lett. 2016, 8, 197–201. [Google Scholar]
  76. Li, Y.; Yang, F.; Zheng, W.; Hu, M.; Wang, J.; Ma, S.; Deng, Y.; Luo, Y.; Ye, T.; Yin, W. Punica granatum (pomegranate) leaves extract induces apoptosis through mitochondrial intrinsic pathway and inhibits migration and invasion in non-small cell lung cancer in vitro. Biomed. Pharmacother. 2016, 80, 227–235. [Google Scholar] [CrossRef] [PubMed]
  77. Shirode, A.B.; Kovvuru, P.; Chittur, S.V.; Henning, S.M.; Heber, D.; Reliene, R. Antipro-liferative effects of pomegranate extract in MCF7 breast cancer cells is associated with reduced DNA repair gene expression and induction of double strand breaks. Mol. Carcinog. 2014, 53, 458–470. [Google Scholar] [CrossRef] [PubMed]
  78. Nunez-Sanchez, M.A.; Davalos, A.; Gonzalez-Sarrias, A.; Casas-Agustench, P.; Visioli, F.; Monedero-Saiz, T.; García-Talavera, N.V.; Gómez-Sánchez, M.B.; Sánchez-Álvarez, C.; García-Albert, A.M.; et al. MicroRNAs expression in normal and malignant colon tissues as biomarkers of colorectal cancer and in response to pomegranate extracts consumption: Critical issues to discern between modulatory effects and potential artifacts. Mol. Nutr. Food Res. 2015, 59, 1973–1986. [Google Scholar] [CrossRef]
  79. Zhou, B.; Yi, H.; Tan, J.; Wu, Y.; Liu, G.; Qiu, Z. Anti-proliferative effects of polyphenols from pomegranate rind (Punica granatum L.) on EJ bladder cancer cells via regulation of p53/miR-34a axis. Phytother. Res. 2015, 29, 415–422. [Google Scholar] [CrossRef] [PubMed]
  80. Rettig, M.B.; Heber, D.; An, J.; Seeram, N.P.; Rao, J.Y.; Liu, H.; Klatte, T.; Belldegrun, A.; Moro, A.; Henning, S.M.; et al. Pomegranate extract inhibits androgen-independent prostate cancer growth through a nuclear factor-κB-dependent mechanism. Mol. Cancer Ther. 2008, 7, 2662–2671. [Google Scholar] [CrossRef] [PubMed]
  81. Joseph, M.M.; Aravind, S.R.; Varghese, S.; Mini, S.; Sreelekha, T.T. Evaluation of antioxidant, antitumor and immunomodulatory properties of polysaccharide isolated from fruit rind of Punica granatum. Mol. Med. Rep. 2012, 5, 489–496. [Google Scholar]
  82. Veeragoni, D.; Deshpande, S.; Rachamalla, H.; Ande, A.; Puvvada, N.; Mutheneni, S. In vitro and in vivo anticancer and genotoxicity profiles of green synthesized and chemically synthesized silver nanoparticles. ACS Appl. Bio Mater. 2022, 5, 2324–2339. [Google Scholar] [CrossRef]
  83. Santhanam, N.; Arivazhagan, A.; Kennedy, K.; Swaminathan, S. Silver nanoparticles synthesized from aloe barbadensis leaf extract induces g0/g1 cell cycle arrest in thp-1 acute monocytic leukemia cells. Asian J. Pharm. Pharmacol. 2019, 5, 701–713. [Google Scholar] [CrossRef]
  84. Mohamad Sukri, S.N.A.; Shameli, K.; Teow, S.Y.; Chew, J.; Ooi, L.T.; Lee-Kiun Soon, M.; Ismail, N.A.; Moeini, H. Enhanced antibacterial and anticancer activities of plant extract mediated green synthesized zinc oxide-silver nanoparticles. Front. Microbiol. 2023, 14, 1194292. [Google Scholar] [CrossRef] [PubMed]
  85. Ramya, E.; Narayana Rao, D. Cytotoxicity Studies of Fruit-Extracted Metal Nanostructures. In Cytotoxicity—Understanding Cellular Damage and Response; IntechOpen: London, UK, 2023. [Google Scholar] [CrossRef]
  86. Baharara, J.; Namvar, F.; Ramezani, T.; Hosseini, N.; Mohamad, R. Green synthesis of silver nanoparticles using achillea biebersteinii flower extract and its anti-angiogenic properties in the rat aortic ring model. Molecules 2014, 19, 4624–4634. [Google Scholar] [CrossRef] [PubMed]
  87. Kuri, P.; Pion, E.; Mahl, L.; Kainz, P.; Schwarz, S.; Brochhausen, C.; Aung, T.; Haerteis, S. Deep learning-based image analysis for the quantification of tumor-induced angiogenesis in the 3d in vivo tumor model—Establishment and addition to laser speckle contrast imaging (lsci). Cells 2022, 11, 2321. [Google Scholar] [CrossRef] [PubMed]
  88. Decker, S.; Arango-Ospina, M.; Rehder, F.; Moghaddam, A.; Simon, R.; Merle, C.; Renkawitz, T.; Boccaccini, A.R.; Westhauser, F. In vitro and in ovo impact of the ionic dissolution products of boron-doped bioactive silicate glasses on cell viability, osteogenesis, and angiogenesis. Sci. Rep. 2022, 12, 8510. [Google Scholar] [CrossRef] [PubMed]
  89. Nowak-Sliwinska, P.; Segura, T.; Iruela-Arispe, M.L. The chicken chorioallantoic membrane model in biology, medicine, and bioengineering. Angiogenesis 2014, 17, 779–804. [Google Scholar] [CrossRef] [PubMed]
  90. Ruíz-Baltazar, A.J.; Reyes-López, S.Y.; Larrañaga, D.; Estévez, M.; Pérez, R. Green synthesis of silver nanoparticles using a Melissa officinalis leaf extract with antibacterial properties. Results Phys. 2017, 7, 2639–2643. [Google Scholar] [CrossRef]
  91. Characteristic of IR Absorption Frequencies of Organic Functional Groups. Available online: http://www2.ups.edu/faculty/hanson/Spectroscopy/IR/IRfrequencies.html (accessed on 11 April 2024).
  92. Semenescu, A.D.; Moacă, E.A.; Iftode, A.; Dehelean, C.A.; Tchiakpe-Antal, D.S.; Vlase, L.; Vlase, A.M.; Muntean, D.; Chioibaş, R. Phytochemical and Nutraceutical Screening of Ethanol and Ethyl Acetate Phases of Romanian Galium verum Herba (Rubiaceae). Molecules 2023, 28, 7804. [Google Scholar] [CrossRef] [PubMed]
  93. Arendrup, M.C.; Cuenca-Estrella, M.; Lass-Flörl, C.; Hope, W. EUCAST technical note on the EUCAST definitive document EDef 7.2: Method for the determination of broth dilution minimum inhibitory concentrations of antifungal agents for yeasts EDef 7.2 (EUCAST-AFST). Clin. Microbiol. Infect. 2012, 18, E246–E247. [Google Scholar] [CrossRef]
  94. M07Ed11; Methods for Dilution Antimicrobial Susceptibility Tests for Bacteria That Grow Aerobically. 11th ed. Clinical and Laboratory Standards Institute: Wayne, PA, USA, 2018.
  95. Luepke, N.P. Hen’s Egg Chorioallantoic Membrane Test for Irritation Potential. Food Chem. Toxicol. 1985, 23, 287–291. [Google Scholar] [CrossRef]
  96. Batista-Duharte, A.; Murillo, G.J.; Betancourt, J.E.; Oliver, P.; Damiana, T. The Hen’s Egg Test on Chorioallantoic Membrane: An Alternative Assay for the Assessment of the Irritating Effect of Vaccine Adjuvants. Int. J. Toxicol. 2016, 35, 627–633. [Google Scholar] [CrossRef] [PubMed]
Figure 1. UV–Vis absorbance spectra of Pg peel ethanolic extract and synthesized Pg-AgNPs.
Inorganics 12 00160 g001
Figure 2. The FT-IR spectra of Pg peel ethanolic extract and green synthesized Pg-AgNPs.
Inorganics 12 00160 g002
Figure 3. The TG-DTG curves of green synthesized Pg-AgNPs from P. granatum peel extract.
Inorganics 12 00160 g003
Figure 4. TEM image (A), and EDS by element (B) mapping (C) of the green synthesized Pg-AgNPs.
Inorganics 12 00160 g004
Figure 5. The count distribution for the sizes of Pg-AgNPs.
Inorganics 12 00160 g005
Figure 6. Graphical illustration of cell viability percentages obtained at 24 h after treatment of JB6 Cl 41-5a cells with Pg extract and Pg-AgNPs. All data are expressed as mean values ± SD of three independent experiments conducted in triplicate. For analysis of the statistical differences between the control group and the treatment group, the one-way ANOVA test was performed, followed by Dunnet’s multiple comparison post hoc test (* p < 0.05; ** p < 0.01; **** p < 0.0001).
Inorganics 12 00160 g006
Figure 7. Representative images illustrating the morphology of JB6 Cl 41-5a cells post-treatment with green synthesized Pg-AgNPs. The scale bars indicate 50 µm.
Inorganics 12 00160 g007
Figure 8. Graphical illustration of confluence (A) and cell number (B) obtained 24 h after treatment of JB6 Cl 41-5a cells with green synthesized Pg-AgNPs. All data are expressed as mean values ± SD of three independent experiments conducted in triplicate. For analysis of the statistical differences between the control group and the treatment group, the one-way ANOVA test was performed, followed by Dunnet’s multiple comparison post hoc test (** p < 0.01; *** p < 0.001; **** p < 0.0001).
Inorganics 12 00160 g008
Figure 9. Graphical illustration of cytotoxicity rate obtained at 24 h after treatment of JB6 Cl 41-5a cells with Pg extract and green synthesized Pg-AgNPs. All data are expressed as mean values ± SD of three independent experiments conducted in triplicate. For analysis of the statistical differences between the control group and the treatment group, the one-way ANOVA test was performed, followed by Dunnet’s multiple comparison post hoc test (** p < 0.01; *** p < 0.001; **** p < 0.0001).
Inorganics 12 00160 g009
Figure 10. Representative images illustrating the changes in nuclear morphology of JB6 Cl 41-5a cells post-treatment with green synthesized Pg-AgNPs. The scale bars indicate 200 µm.
Inorganics 12 00160 g010
Figure 11. The anti-irritative HET–CAM assay: stereomicroscopic images of the CAM treated with controls (H2Od used as negative control; SDS 1% used as positive control) and test samples (green synthesized Pg-AgNPs of 10 μg/mL and 50 μg/mL) before treatment (t0) and five minutes post-treatment (t5). Scale bars represent 100 μm.
Inorganics 12 00160 g011
Figure 12. Visual representation of the formation of green synthesized Pg-AgNPs.
Inorganics 12 00160 g012
Table 1. The absorbance values of Pg extract and Pg-AgNPs, recorded in time intervals.
Sample (Band Color in the Spectrum)AbsorbanceWavelength (nm)Time Interval
Pg peel ethanolic extract4.067362before adding 1 M AgNO3 solution
Pg-AgNPs (red band)4.284362after 30 min from adding 1 M AgNO3 solution
Pg-AgNPs (blue band)4.343396after 1 h from adding 1 M AgNO3 solution
Pg-AgNPs (green band)4.500410after 1 h 30 min from adding 1 M AgNO3 solution
Pg-AgNPs (violet band)4.500410after 2 h from adding 1 M AgNO3 solution
Pg-AgNPs (ocher band)4.500410after 3 h from adding 1 M AgNO3 solution
Table 2. The FT-IR analysis of Pg peel ethanolic extract and green synthesized Pg-AgNPs.
Absorption Peak/cm
Pg-AgNPs/Pg Extract
Frequency Range/cmFunctional GroupCompound ClassObservation
3402.43/3377.363550–3200O-H stretchalcoholintermolecular bonded
band appearance—strong, broad
3400–3300N-H stretchingaliphatic primary amineband appearance—medium
2924.09/2937.593300–2500O-H stretchcarboxylic acidsusually centered on 3000/cm
3200–2700O-H stretchalcoholsintramolecular bonded
3000–2800N-H stretchamine saltband appearance—strong, broad
3000–2840C-H stretchalkaneband appearance—medium
1716.65/1730.152000–1650C-H bendingaromatic compoundsband appearance—weak
1740–1720C=O stretchaldehydeband appearance—strong
1730–1715C=O stretchα, β—unsaturated esteror formats
1725–1705C=O stretchaliphatic ketoneor cyclohexanone, cyclopentenone
1720–1706C=O stretchcarboxylic aciddimer
1600.92/1620.211650–1600C=C stretchconjugated alkeneband appearance—medium
1650–1580N-H bendingamineband appearance—medium
1650–1566C=C stretchcyclic alkeneband appearance—medium
-/1444.681450C-H bendingmethyl groupband appearance—medium
1400–1600C=C stretcharomatic compoundsband appearance—medium weak, multiple bands
1384.89/-1345–1385N-O stretchnitro compoundsband appearance—strong, two bands
1390–1380C-H bendingaldehydeband appearance—medium
1385–1380C-H bendingalkanegem dimethyl
1420–1330O-H bendingalcoholband appearance—medium
1400–1000C-F stretchfluoro compoundband appearance—strong
1390–1310O-H bendingphenolband appearance—medium
-/1230.581250–1020C-N stretchamineband appearance—medium
1275–1200C-O stretchalkyl aryl etherband appearance—strong
1400–1000C-F stretchfluoro compoundband appearance—strong
1068.56/-1250–1020C-N stretchamineband appearance—medium
1085–1050C-O stretchprimary alcoholband appearance—strong
1035.77/1045.421250–1020C-N stretchamineband appearance—medium
1050–1040CO-O-CO stretchanhydrideband appearance—strong, broad
-/877.61880 ± 20C-H bending1,2,4-trisubstituted
1,3-disubstituted
band appearance—strong
831.32/817.82850–550C-Cl stretchhalo compoundband appearance—strong
840–790C=C bendingalkenetrisubstituted
810 ± 20C-H bending1,4-disubstituted
1,2,3,4-tetrasubstituted
band appearance—strong
773.46/779.24850–550C-Cl stretchhalo compoundband appearance—strong
755 ± 20C-H bending1,2-disubstituted
monosubstituted
band appearance—strong
524.64/-690–515C-Br stretchhalo compoundband appearance—strong
600–500C-I stretchhalo compoundband appearance—strong
Table 3. MIC and MBC of green Pg-AgNPs against S. aureus, E. coli, and P. aeruginosa.
Pg-AgNPs Concentration (μg/mL)S. aureus (+) ATCC 25923E. coli (−) ATCC 25922P. aeruginosa (−) ATCC 27853
MIC (μg/mL)MBC (μg/mL)MIC (μg/mL)MBC (μg/mL)MIC (μg/mL)MBC (μg/mL)
2528456262NA55NA
5019332950NA47NA
7514625634NA31NA
1009716418101510
NA—no antibacterial activity.
Table 4. Comparative analysis regarding the IS induced by distilled water (H2Od), SDS 1%, and green synthesized Pg-AgNPs at concentrations of 10 μg/mL and 50 μg/mL, alongside the onset times of hemorrhage (tH), lysis (tL) and coagulation (tC).
Sample/ConcentrationHemorrhage (tH) (s)Lysis (tL) (s)Coagulation (tC) (s)IS
H2Od3003003000.07
SDS 1%20384518.5
Pg-AgNPs, 10 μg/mL441403008.07
Pg-AgNPs, 50 μg/mL3003002401.87
Disclaimer/Publisher’s Note: The statements, opinions and data contained in all publications are solely those of the individual author(s) and contributor(s) and not of MDPI and/or the editor(s). MDPI and/or the editor(s) disclaim responsibility for any injury to people or property resulting from any ideas, methods, instructions or products referred to in the content.

