

Cell Metabolomics to Guide the Design of Metal-Based Compounds


Abstract

1. NMR-Based Cell Metabolomics
2. NMR Metabolomics and Metal-Based Compounds: State-of-the-Art
3. Conclusions
Funding
Acknowledgments
Conflicts of Interest
References
- Mjos, K.D.; Orvig, C. Metallodrugs in Medicinal Inorganic Chemistry. Chem. Rev. 2014, 114, 4540–4563. [Google Scholar] [CrossRef] [PubMed]
- Hanif, M.; Hartinger, C.G. Anticancer Metallodrugs: Where Is the next Cisplatin? Future Med. Chem. 2018, 10, 615–617. [Google Scholar] [CrossRef] [PubMed]
- Ghini, V.; Meoni, G.; Vignoli, A.; Di Cesare, F.; Tenori, L.; Turano, P.; Luchinat, C. Fingerprinting and Profiling in Metabolomics of Biosamples. Prog. Nucl. Magn. Reson. Spectrosc. 2023, 138–139, 105–135. [Google Scholar] [CrossRef] [PubMed]
- De Castro, F.; Benedetti, M.; Del Coco, L.; Fanizzi, F.P. NMR-Based Metabolomics in Metal-Based Drug Research. Molecules 2019, 24, 2240. [Google Scholar] [CrossRef] [PubMed]
- Wishart, D.S.; Feunang, Y.D.; Marcu, A.; Guo, A.C.; Liang, K.; Vázquez-Fresno, R.; Sajed, T.; Johnson, D.; Li, C.; Karu, N.; et al. HMDB 4.0: The Human Metabolome Database for 2018. Nucleic Acids Res. 2018, 46, D608–D617. [Google Scholar] [CrossRef] [PubMed]
- Cuperlović-Culf, M.; Barnett, D.A.; Culf, A.S.; Chute, I. Cell Culture Metabolomics: Applications and Future Directions. Drug. Discov. Today 2010, 15, 610–621. [Google Scholar] [CrossRef] [PubMed]
- Eraslan, Z.; Cascante, M.; Günther, U.L. Metabolomics in Cell Biology. Handb. Exp. Pharmacol. 2023, 277, 181–207. [Google Scholar] [CrossRef] [PubMed]
- Johnson, C.H.; Ivanisevic, J.; Siuzdak, G. Metabolomics: Beyond Biomarkers and towards Mechanisms. Nat. Rev. Mol. Cell Biol. 2016, 17, 451–459. [Google Scholar] [CrossRef] [PubMed]
- Halama, A. Metabolomics in Cell Culture—A Strategy to Study Crucial Metabolic Pathways in Cancer Development and the Response to Treatment. Arch. Biochem. Biophys. 2014, 564, 100–109. [Google Scholar] [CrossRef]
- Wang, Z.; Pisano, S.; Ghini, V.; Kadeřávek, P.; Zachrdla, M.; Pelupessy, P.; Kazmierczak, M.; Marquardsen, T.; Tyburn, J.-M.; Bouvignies, G.; et al. Detection of Metabolite-Protein Interactions in Complex Biological Samples by High-Resolution Relaxometry: Toward Interactomics by NMR. J. Am. Chem. Soc. 2021, 143, 9393–9404. [Google Scholar] [CrossRef]
- Barrilero, R.; Ramírez, N.; Vallvé, J.C.; Taverner, D.; Fuertes, R.; Amigó, N.; Correig, X. Unravelling and Quantifying the “NMR-Invisible” Metabolites Interacting with Human Serum Albumin by Binding Competition and T2 Relaxation-Based Decomposition Analysis. J. Proteome Res. 2017, 16, 1847–1856. [Google Scholar] [CrossRef] [PubMed]
- Bhinderwala, F.; Evans, P.; Jones, K.; Laws, B.R.; Smith, T.G.; Morton, M.; Powers, R. Phosphorus NMR and Its Application to Metabolomics. Anal. Chem. 2020, 92, 9536–9545. [Google Scholar] [CrossRef] [PubMed]
- Filippov, A.V.; Khakimov, A.M.; Munavirov, B.V. Chapter Two—31P NMR Studies of Phospholipids. In Annual Reports on NMR Spectroscopy; Webb, G.A., Ed.; Academic Press: Cambridge, MA, USA, 2015; Volume 85, pp. 27–92. [Google Scholar]
- Kostidis, S.; Addie, R.D.; Morreau, H.; Mayboroda, O.A.; Giera, M. Quantitative NMR Analysis of Intra- and Extracellular Metabolism of Mammalian Cells: A Tutorial. Anal. Chim. Acta 2017, 980, 1–24. [Google Scholar] [CrossRef]
- Ghini, V.; Sorbi, F.; Fambrini, M.; Magherini, F. NMR Metabolomics of Primary Ovarian Cancer Cells in Comparison to Established Cisplatin-Resistant and -Sensitive Cell Lines. Cells 2024, 13, 661. [Google Scholar] [CrossRef] [PubMed]
- Moestue, S.; Sitter, B.; Bathen, T.F.; Tessem, M.-B.; Gribbestad, I.S. HR MAS MR Spectroscopy in Metabolic Characterization of Cancer. Curr. Top. Med. Chem. 2011, 11, 2–26. [Google Scholar] [CrossRef] [PubMed]
- Vermathen, M.; Paul, L.E.H.; Diserens, G.; Vermathen, P.; Furrer, J. 1H HR-MAS NMR Based Metabolic Profiling of Cells in Response to Treatment with a Hexacationic Ruthenium Metallaprism as Potential Anticancer Drug. PLoS ONE 2015, 10, e0128478. [Google Scholar] [CrossRef] [PubMed]
- Diserens, G.; Vermathen, M.; Zurich, M.-G.; Vermathen, P. Longitudinal Investigation of the Metabolome of 3D Aggregating Brain Cell Cultures at Different Maturation Stages by 1H HR-MAS NMR. Anal. Bioanal. Chem. 2018, 410, 6733–6749. [Google Scholar] [CrossRef] [PubMed]
- Liu, S.; Wang, W.; Zhou, X.; Gu, R.; Ding, Z. Dose Responsive Effects of Cisplatin in L02 Cells Using NMR-Based Metabolomics. Env. Toxicol. Pharmacol. 2014, 37, 150–157. [Google Scholar] [CrossRef] [PubMed]
- Duarte, I.F.; Ladeirinha, A.F.; Lamego, I.; Gil, A.M.; Carvalho, L.; Carreira, I.M.; Melo, J.B. Potential Markers of Cisplatin Treatment Response Unveiled by NMR Metabolomics of Human Lung Cells. Mol. Pharm. 2013, 10, 4242–4251. [Google Scholar] [CrossRef]
- Pan, X.; Wilson, M.; McConville, C.; Arvanitis, T.N.; Griffin, J.L.; Kauppinen, R.A.; Peet, A.C. Increased Unsaturation of Lipids in Cytoplasmic Lipid Droplets in DAOY Cancer Cells in Response to Cisplatin Treatment. Metabolomics 2013, 9, 722–729. [Google Scholar] [CrossRef]
- Duarte, I.F.; Lamego, I.; Marques, J.; Marques, M.P.M.; Blaise, B.J.; Gil, A.M. Nuclear Magnetic Resonance (NMR) Study of the Effect of Cisplatin on the Metabolic Profile of MG-63 Osteosarcoma Cells. J. Proteome Res. 2010, 9, 5877–5886. [Google Scholar] [CrossRef] [PubMed]
- Pan, X.; Wilson, M.; Mirbahai, L.; McConville, C.; Arvanitis, T.N.; Griffin, J.L.; Kauppinen, R.A.; Peet, A.C. In Vitro Metabonomic Study Detects Increases in UDP-GlcNAc and UDP-GalNAc, as Early Phase Markers of Cisplatin Treatment Response in Brain Tumor Cells. J. Proteome Res. 2011, 10, 3493–3500. [Google Scholar] [CrossRef] [PubMed]
- Ghini, V.; Magherini, F.; Massai, L.; Messori, L.; Turano, P. Comparative NMR Metabolomics of the Responses of A2780 Human Ovarian Cancer Cells to Clinically Established Pt-Based Drugs. Dalton Trans. 2022, 51, 12512–12523. [Google Scholar] [CrossRef] [PubMed]
- Del Coco, L.; Majellaro, M.; Boccarelli, A.; Cellamare, S.; Altomare, C.D.; Fanizzi, F.P. Novel Antiproliferative Biphenyl Nicotinamide: NMR Metabolomic Study of Its Effect on the MCF-7 Cell in Comparison with Cisplatin and Vinblastine. Molecules 2020, 25, 3502. [Google Scholar] [CrossRef] [PubMed]
- Lamego, I.; Duarte, I.F.; Marques, M.P.M.; Gil, A.M. Metabolic Markers of MG-63 Osteosarcoma Cell Line Response to Doxorubicin and Methotrexate Treatment: Comparison to Cisplatin. J. Proteome Res. 2014, 13, 6033–6045. [Google Scholar] [CrossRef] [PubMed]
- Maria, R.M.; Altei, W.F.; Selistre-de-Araujo, H.S.; Colnago, L.A. Impact of Chemotherapy on Metabolic Reprogramming: Characterization of the Metabolic Profile of Breast Cancer MDA-MB-231 Cells Using 1H HR-MAS NMR Spectroscopy. J. Pharm. Biomed Anal. 2017, 146, 324–328. [Google Scholar] [CrossRef] [PubMed]
- Lin, C.; Dong, J.; Wei, Z.; Cheng, K.-K.; Li, J.; You, S.; Liu, Y.; Wang, X.; Chen, Z. 1H NMR-Based Metabolic Profiles Delineate the Anticancer Effect of Vitamin C and Oxaliplatin on Hepatocellular Carcinoma Cells. J. Proteome Res. 2020, 19, 781–793. [Google Scholar] [CrossRef]
- De Castro, F.; Benedetti, M.; Antonaci, G.; Del Coco, L.; De Pascali, S.A.; Muscella, A.; Marsigliante, S.; Fanizzi, F.P. Response of Cisplatin Resistant Skov-3 Cells to [Pt(O,O′-Acac)(γ-Acac)(DMS)] Treatment Revealed by a Metabolomic 1H-NMR Study. Molecules 2018, 23, 2301. [Google Scholar] [CrossRef]
- De Castro, F.; Stefàno, E.; De Luca, E.; Muscella, A.; Marsigliante, S.; Benedetti, M.; Fanizzi, F.P. A NMR-Based Metabolomic Approach to Investigate the Antitumor Effects of the Novel [Pt(η 1-C2H4OMe)(DMSO)(Phen)]+ (Phen = 1,10-Phenanthroline) Compound on Neuroblastoma Cancer Cells. Bioinorg. Chem. Appl. 2022, 2022, 8932137. [Google Scholar] [CrossRef]
- Ghini, V.; Senzacqua, T.; Massai, L.; Gamberi, T.; Messori, L.; Turano, P. NMR Reveals the Metabolic Changes Induced by Auranofin in A2780 Cancer Cells: Evidence for Glutathione Dysregulation. Dalton Trans. 2021, 50, 6349–6355. [Google Scholar] [CrossRef]
- Cosottini, L.; Massai, L.; Ghini, V.; Zineddu, S.; Geri, A.; Mannelli, M.; Ciambellotti, S.; Severi, M.; Gamberi, T.; Messori, L.; et al. Bioconjugation of the Gold Drug Auranofin to Human Ferritin Yields a Potent Cytotoxin. J. Drug Deliv. Sci. Technol. 2023, 87, 104822. [Google Scholar] [CrossRef]
- Ghini, V.; Mannelli, M.; Massai, L.; Geri, A.; Zineddu, S.; Gamberi, T.; Messori, L.; Turano, P. The Effects of Two Cytotoxic Gold(i) Carbene Compounds on the Metabolism of A2780 Ovarian Cancer Cells: Mechanistic Inferences through NMR Analysis. RSC Adv. 2023, 13, 21629–21632. [Google Scholar] [CrossRef] [PubMed]
- Primasová, H.; Paul, L.E.H.; Diserens, G.; Primasová, E.; Vermathen, P.; Vermathen, M.; Furrer, J. 1H HR-MAS NMR-Based Metabolomics of Cancer Cells in Response to Treatment with the Diruthenium Trithiolato Complex [(p-MeC6H4iPr)2Ru2(SC6H4-p-But)3]+ (DiRu-1). Metabolites 2019, 9, 146. [Google Scholar] [CrossRef] [PubMed]
- Hussan, A.; Moyo, B.; Amenuvor, G.; Meyer, D.; Sitole, L. Investigating the Antitumor Effects of a Novel Ruthenium (II) Complex on Malignant Melanoma Cells: An NMR-Based Metabolomic Approach. Biochem. Biophys. Res. Commun. 2023, 686, 149169. [Google Scholar] [CrossRef] [PubMed]
- Resendiz-Acevedo, K.; García-Aguilera, M.E.; Esturau-Escofet, N.; Ruiz-Azuara, L. 1H -NMR Metabolomics Study of the Effect of Cisplatin and Casiopeina IIgly on MDA-MB-231 Breast Tumor Cells. Front. Mol. Biosci. 2021, 8, 1135. [Google Scholar] [CrossRef]
- Lamego, I.; Marques, M.P.M.; Duarte, I.F.; Martins, A.S.; Oliveira, H.; Gil, A.M. Impact of the Pd2Spermine Chelate on Osteosarcoma Metabolism: An NMR Metabolomics Study. J. Proteome Res. 2017, 16, 1773–1783. [Google Scholar] [CrossRef]
- Martins, A.S.; Batista de Carvalho, A.L.M.; Marques, M.P.M.; Gil, A.M. Response of Osteosarcoma Cell Metabolism to Platinum and Palladium Chelates as Potential New Drugs. Molecules 2021, 26, 4805. [Google Scholar] [CrossRef]
- Bispo, D.S.C.; Correia, M.; Carneiro, T.J.; Martins, A.S.; Reis, A.A.N.; de Carvalho, A.L.M.B.; Marques, M.P.M.; Gil, A.M. Impact of Conventional and Potential New Metal-Based Drugs on Lipid Metabolism in Osteosarcoma MG-63 Cells. Int. J. Mol. Sci. 2023, 24, 17556. [Google Scholar] [CrossRef] [PubMed]
- Carneiro, T.J.; Araújo, R.; Vojtek, M.; Gonçalves-Monteiro, S.; de Carvalho, A.L.M.B.; Marques, M.P.M.; Diniz, C.; Gil, A.M. Impact of the Pd2Spm (Spermine) Complex on the Metabolism of Triple-Negative Breast Cancer Tumors of a Xenograft Mouse Model. Int. J. Mol. Sci. 2021, 22, 10775. [Google Scholar] [CrossRef]
- Carneiro, T.J.; Vojtek, M.; Gonçalves-Monteiro, S.; Neves, J.R.; de Carvalho, A.L.M.B.; Marques, M.P.M.; Diniz, C.; Gil, A.M. Metabolic Impact of Anticancer Drugs Pd2Spermine and Cisplatin on the Brain of Healthy Mice. Pharmaceutics 2022, 14, 259. [Google Scholar] [CrossRef]
- Chong, J.; Soufan, O.; Li, C.; Caraus, I.; Li, S.; Bourque, G.; Wishart, D.S.; Xia, J. MetaboAnalyst 4.0: Towards More Transparent and Integrative Metabolomics Analysis. Nucleic. Acids Res. 2018, 46, W486–W494. [Google Scholar] [CrossRef] [PubMed]
- Tsouka, S.; Masoodi, M. Metabolic Pathway Analysis: Advantages and Pitfalls for the Functional Interpretation of Metabolomics and Lipidomics Data. Biomolecules 2023, 13, 244. [Google Scholar] [CrossRef]
- Kanehisa, M.; Goto, S. KEGG: Kyoto Encyclopedia of Genes and Genomes. Nucleic Acids Res. 2000, 28, 27–30. [Google Scholar] [CrossRef] [PubMed]
- Jewison, T.; Su, Y.; Disfany, F.M.; Liang, Y.; Knox, C.; Maciejewski, A.; Poelzer, J.; Huynh, J.; Zhou, Y.; Arndt, D.; et al. SMPDB 2.0: Big Improvements to the Small Molecule Pathway Database. Nucleic Acids Res. 2014, 42, D478–D484. [Google Scholar] [CrossRef] [PubMed]
- Ramachandran, G.K.; Yeow, C.H. Proton NMR Characterization of Intact Primary and Metastatic Melanoma Cells in 2D & 3D Cultures. Biol. Res. 2017, 50, 12. [Google Scholar] [CrossRef] [PubMed]
- Nobili, S.; Mini, E.; Landini, I.; Gabbiani, C.; Casini, A.; Messori, L. Gold Compounds as Anticancer Agents: Chemistry, Cellular Pharmacology, and Preclinical Studies. Med. Res. Rev. 2010, 30, 550–580. [Google Scholar] [CrossRef]
- Carneiro, T.J.; Carvalho, A.L.M.B.; Vojtek, M.; Carmo, I.F.; Marques, M.P.M.; Diniz, C.; Gil, A.M. Disclosing a Metabolic Signature of Cisplatin Resistance in MDA-MB-231 Triple-Negative Breast Cancer Cells by NMR Metabolomics. Cancer Cell Int. 2023, 23, 310. [Google Scholar] [CrossRef] [PubMed]
- Vermathen, M.; von Tengg-Kobligk, H.; Hungerbühler, M.N.; Vermathen, P.; Ruprecht, N. 1H HR-MAS NMR Based Metabolic Profiling of Lung Cancer Cells with Induced and De-Induced Cisplatin Resistance to Reveal Metabolic Resistance Adaptations. Molecules 2021, 26, 6766. [Google Scholar] [CrossRef]
- Huang, Z.; Tong, Y.; Wang, J.; Huang, Y. NMR Studies of the Relationship between the Changes of Membrane Lipids and the Cisplatin-Resistance of A549/DDP Cells. Cancer Cell Int. 2003, 3, 5. [Google Scholar] [CrossRef]

| Ref | Compound(s) | Structure(s) | Cell Line(s) | Type of Experiments | Sample Type(s) | Drug Treatment (Concentration) | Exposure Time |
|---|---|---|---|---|---|---|---|
| Platinum | |||||||
| [19] | Cisplatin |  | Human liver L02 cells | 1H NMR | Cell extracts (m/c/w) | 1 nM, 1 µM and 1 mM | 24 h |
| [20] | Cisplatin |  | Human lung cancer A549 cells | 1H HR-MAS | Cell lysates | IC50 at 24 h | 12, 18, 24, 36, 48 h |
| [21] | Cisplatin |  |
|
|
| 10 µM | 12, 24, 48 h |
| [22] | Cisplatin |  | Human osteosarcoma MG-63 cells | 1H HR-MAS | Cell lysates | IC50 at 24 h (30 µM) and 50 µM | 12, 18, 24, 48 h |
| [23] | Cisplatin |  |
|
|
| 10 µM | 12, 24, 48 h |
| [24] |
|  |
| 1H NMR |
| IC50 at 72 h | 24, 48 h |
|  | ||||||
|  | ||||||
| [25] |
|  | Human breast cancer MCF-7 cells | 1H NMR | Cell lysates | IC50 time not specified | 72 h |
| [26] |
|  | Human osteosarcoma MG-63 cells | 1H HR-MAS | Cell lysates | IC50 at 24 h | 12, 24, 36, 48 h |
| [27] |
|  | Human breast cancer MDA-MB-231 cells | 1H HR-MAS | Intact cells | Not specified | 24 h |
| [28] |
|  | Human hepatocellular carcinoma HCC SMMC-7721 cells | 1H NMR | Cell extracts (m/c/w) | 50 µM oxaliplatin | 48 h |
| [29] |
|  | Human cisplatin-resistant ovarian cancer Skov-3 cells | 1H NMR |
| IC50 at 24 h | 6, 12, 24 h |
|  | ||||||
| [30] |
|  | Human neuroblastoma cancer SH-SY5Y cells | 1H NMR |
| IC50 at 24 h | 6, 12, 24 h |
|  | ||||||
| Gold | |||||||
| [31] | Auranofin |  | Human ovarian cancer A2780 cells | 1H NMR |
| IC50 at 72 h | 3, 6, 12, 24 h |
| [32] | Auranofin conjugated with the nanocarrier ferritin |  | Human ovarian cancer A2780 cells | 1H NMR |
| IC50 at 72 h | 24 h |
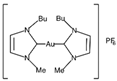
| [33] |
|  | Human ovarian cancer A2780 cells | 1H NMR |
| IC50 at 72 h | 6, 12, 24 h |
|  | ||||||
| Ruthenium | |||||||
| [34] | [(η6-p-MeC6H4iPr)2Ru2(μ-S-p-C6H4tBu)3] Cl(DiRu-1) | 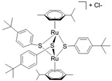 |
| 1H HR-MAS | Cell lysates | IC50 time not specified | 24 h |
| [35] | (ŋ6-p-cymene) Ru(Cl2) (PPh2(p-MeBenzoate) NCH2CH2N (pMeBenzoate) (PPh2)(Cl2)Ru(ŋ6-p-cymene) (GA113) | 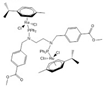 | Human melanoma A375 cells | 1H NMR | Cell extracts (m/c) | IC50 at 24 h | 24 h |
| [17] | [(p-cymene)6Ru6 (tpt)2(dhnq)3]6+ | 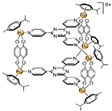 |
| 1H HR-MAS | Intact cells | IC50 at 96 h | 24, 72 h |
| Other metal-based compounds in comparison to cisplatin | |||||||
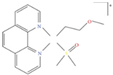
| [36] |
|  | Human breast cancer MDA-MB-231 cells | 1H NMR | Cell extracts (acetonitrile/water) | IC50 at 24 h | 20 min and 40 min |
|  | ||||||
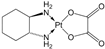
| [37] |
|  |
| 1H HR-MAS | Cell lysates | IC50 at 24 h | 12, 24, 36, 48, 72 h |
|  | ||||||
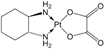
| [38] |
|  | Human osteosarcoma MG-63 cells | 1H NMR | Cell extracts (m/c/w) | IC50 at 24 h | 24, 48, 72 h |
|  | ||||||
|  | ||||||
|  | ||||||
| [39] |
|  | Human osteosarcoma MG-63 cells | 1H NMR | Lipidic extracts (m/c/w) | IC50 at 24 h | 48 h |
|  | ||||||
|  | ||||||
|  | ||||||
| [40] |
|  | Breast cancer MDA-MB-231 cell-derived xenograft mouse model | 1H NMR | Cell extracts (m/c/w) |
| 5 days post-injection |
|  | ||||||
| [41] |
|  | Six-week-old female BALB/cByJ mice | 1H NMR | Brain tissue extracts (m/c/w) |
| 1, 12, 48 h post-injection |
|  | ||||||
Disclaimer/Publisher’s Note: The statements, opinions and data contained in all publications are solely those of the individual author(s) and contributor(s) and not of MDPI and/or the editor(s). MDPI and/or the editor(s) disclaim responsibility for any injury to people or property resulting from any ideas, methods, instructions or products referred to in the content. |
© 2024 by the author. Licensee MDPI, Basel, Switzerland. This article is an open access article distributed under the terms and conditions of the Creative Commons Attribution (CC BY) license (https://creativecommons.org/licenses/by/4.0/).
Share and Cite
Ghini, V. Cell Metabolomics to Guide the Design of Metal-Based Compounds. Inorganics 2024, 12, 168. https://doi.org/10.3390/inorganics12060168
Ghini V. Cell Metabolomics to Guide the Design of Metal-Based Compounds. Inorganics. 2024; 12(6):168. https://doi.org/10.3390/inorganics12060168
Chicago/Turabian StyleGhini, Veronica. 2024. "Cell Metabolomics to Guide the Design of Metal-Based Compounds" Inorganics 12, no. 6: 168. https://doi.org/10.3390/inorganics12060168
APA StyleGhini, V. (2024). Cell Metabolomics to Guide the Design of Metal-Based Compounds. Inorganics, 12(6), 168. https://doi.org/10.3390/inorganics12060168