

Low-Temperature Fast Firing Preparation of Zn2TiO4 Crystalline Photovoltaic Glass Ink and Its Properties
Abstract
:1. Introduction
2. Experimentation
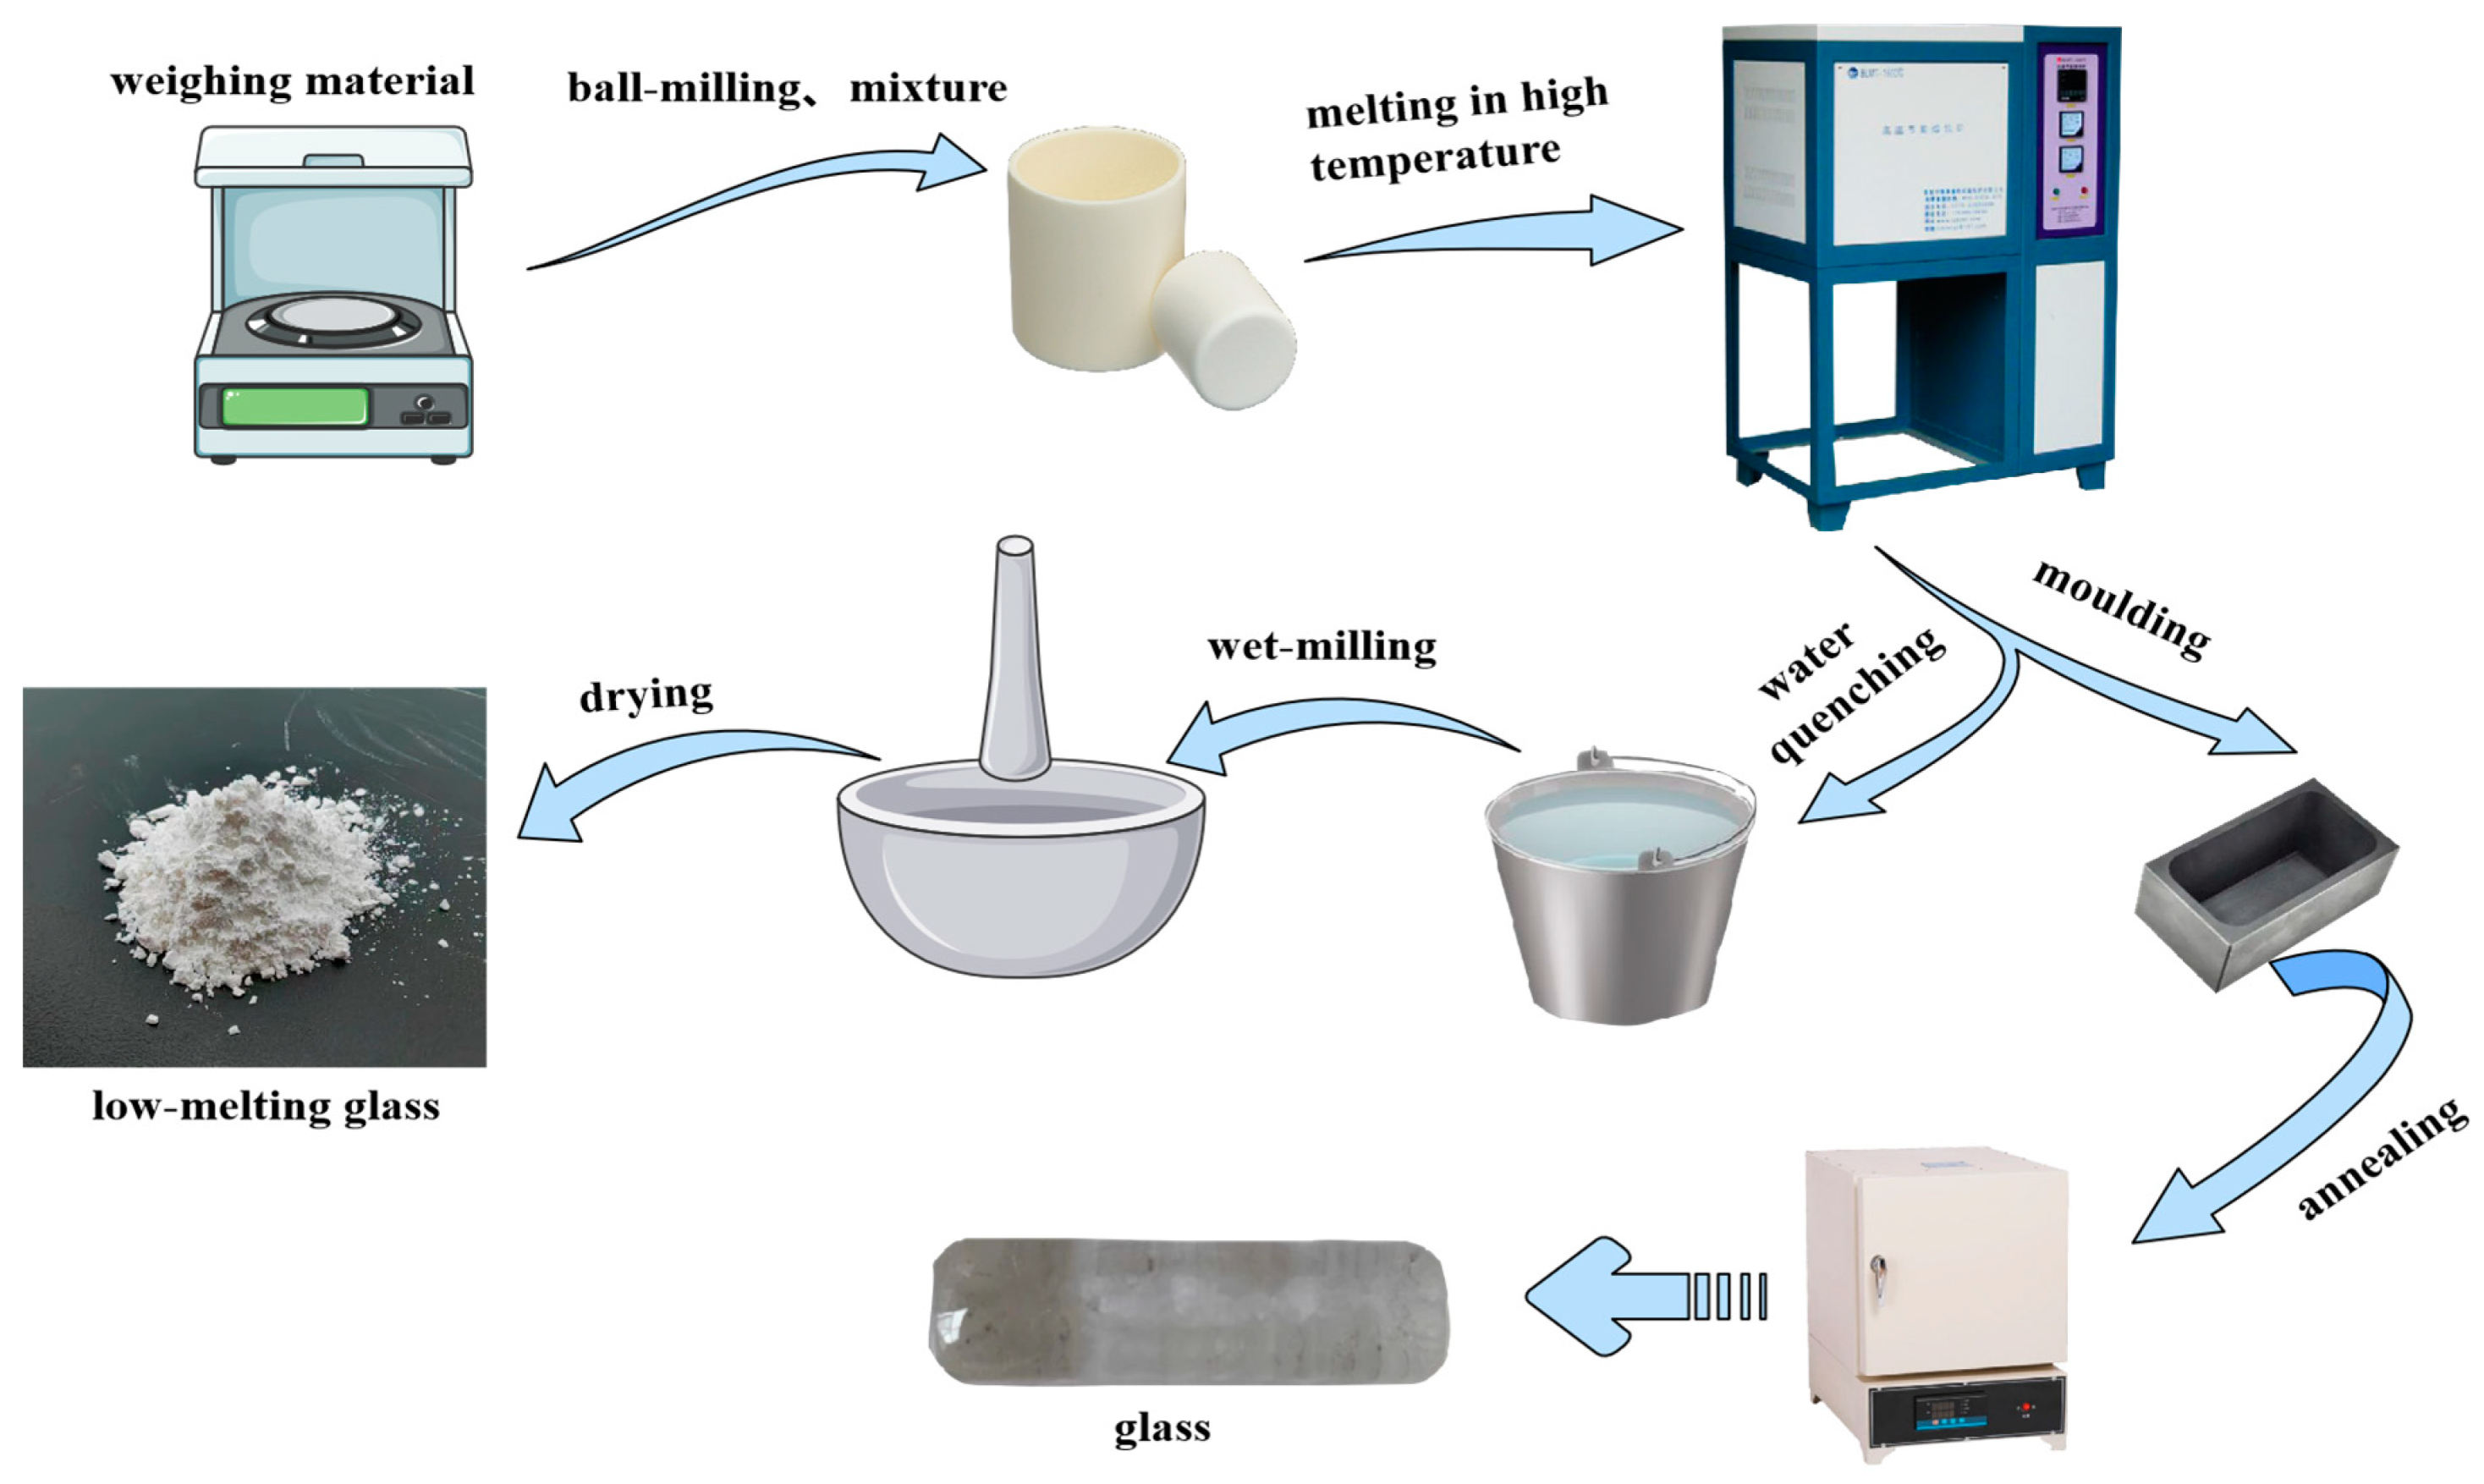
2.1. Preparation of ZnO-B2O3-SiO2 Low-Melting Glass
2.2. Preparation of the Photovoltaic Glass Ink
2.3. Characterisation
3. Results and Discussion
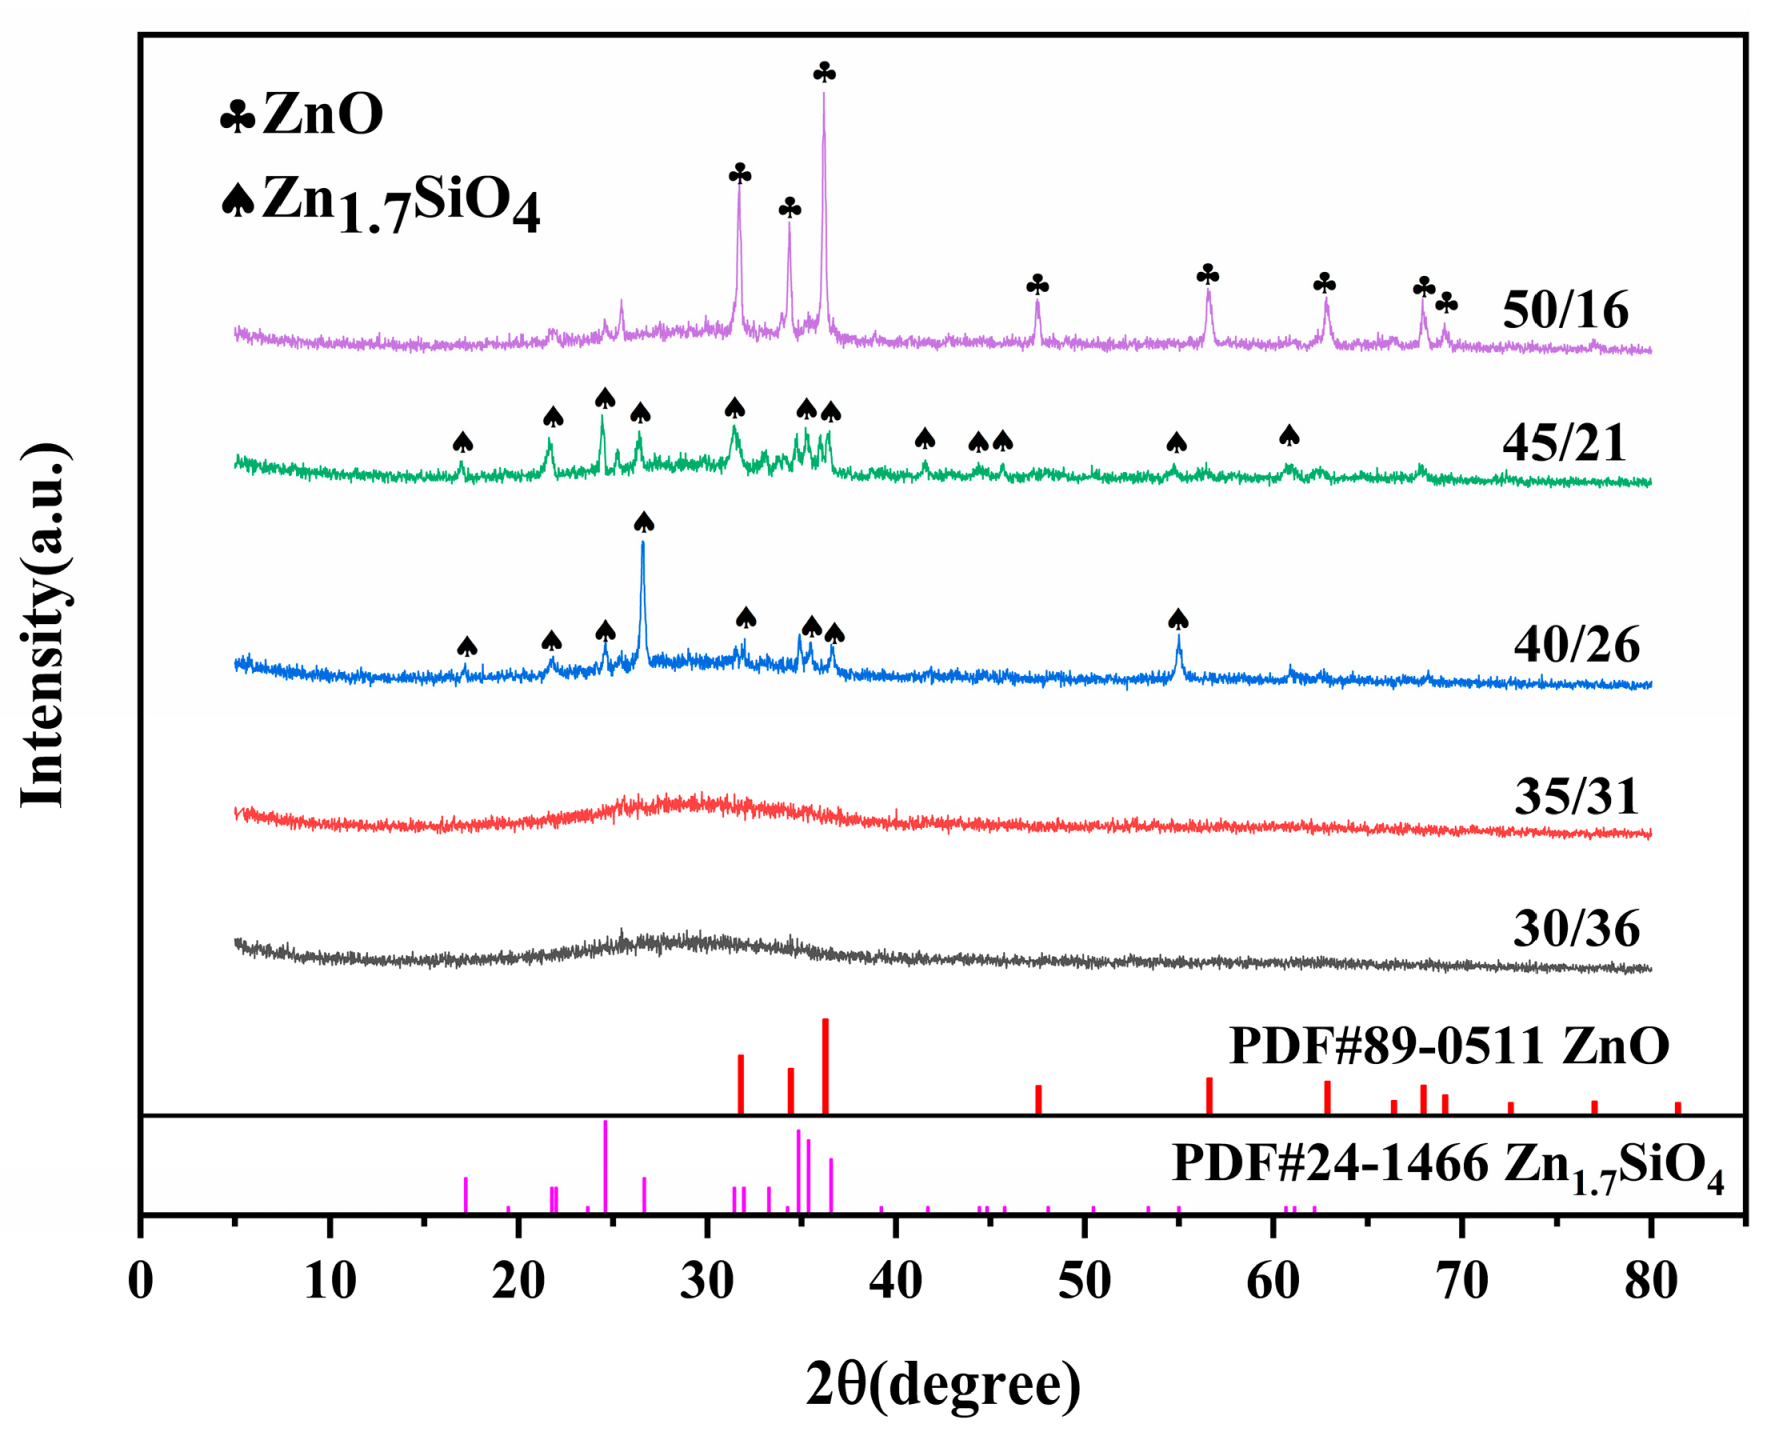
3.1. XRD Patterns of Low-Melting Glass
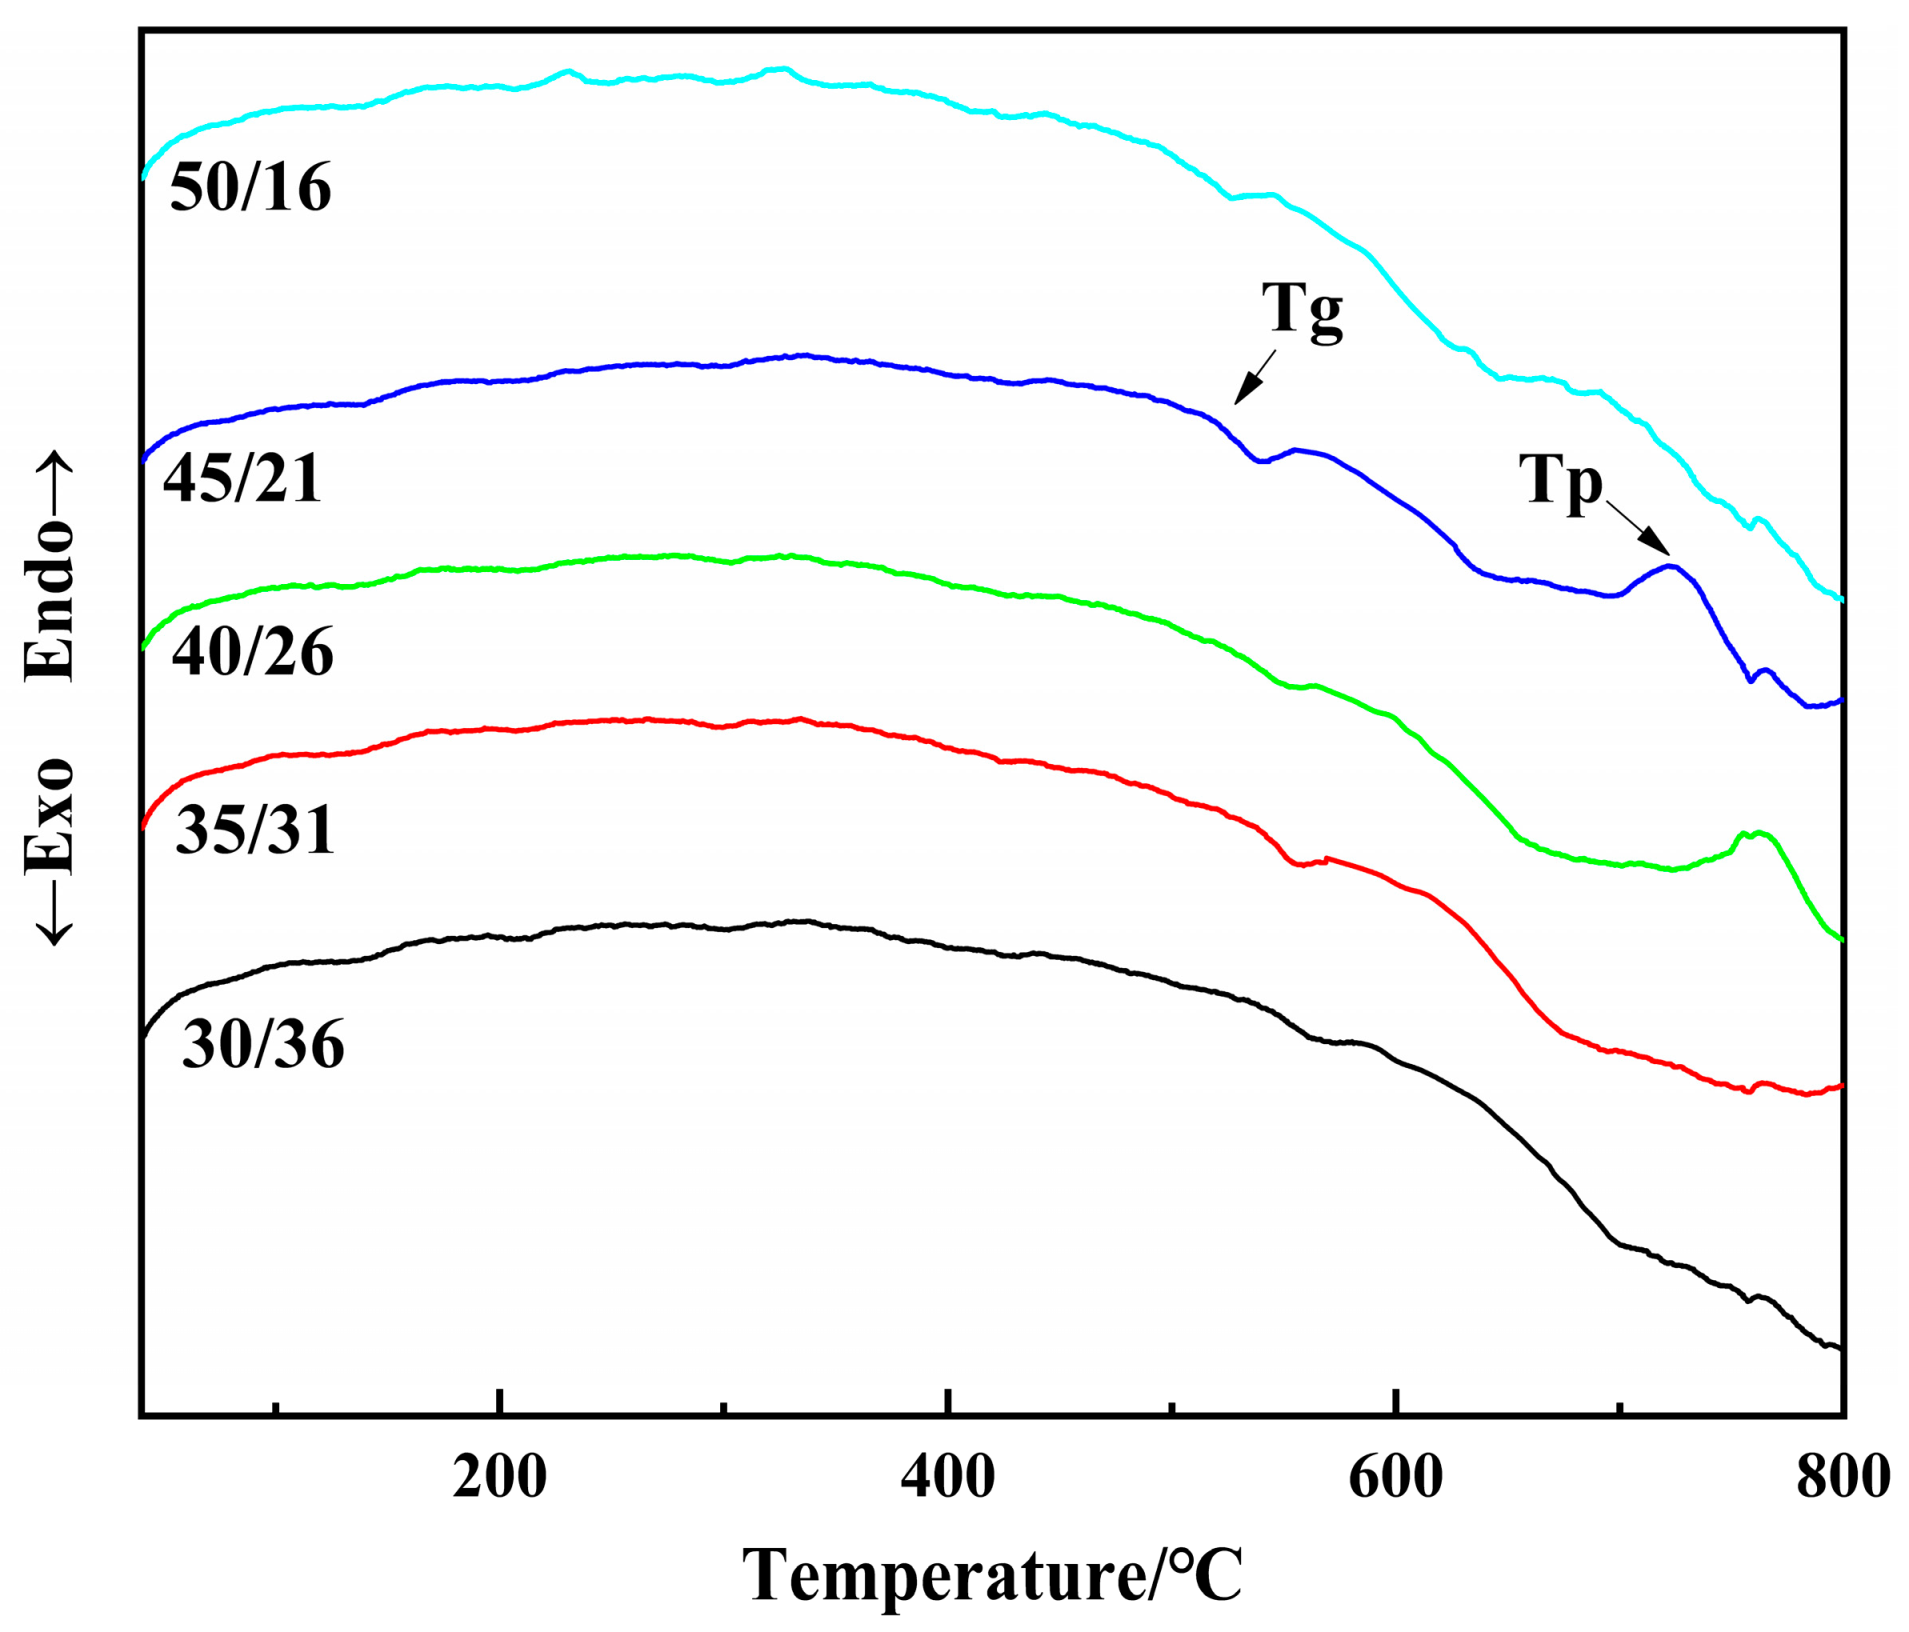
3.2. DTA Curves of the Glass Melt
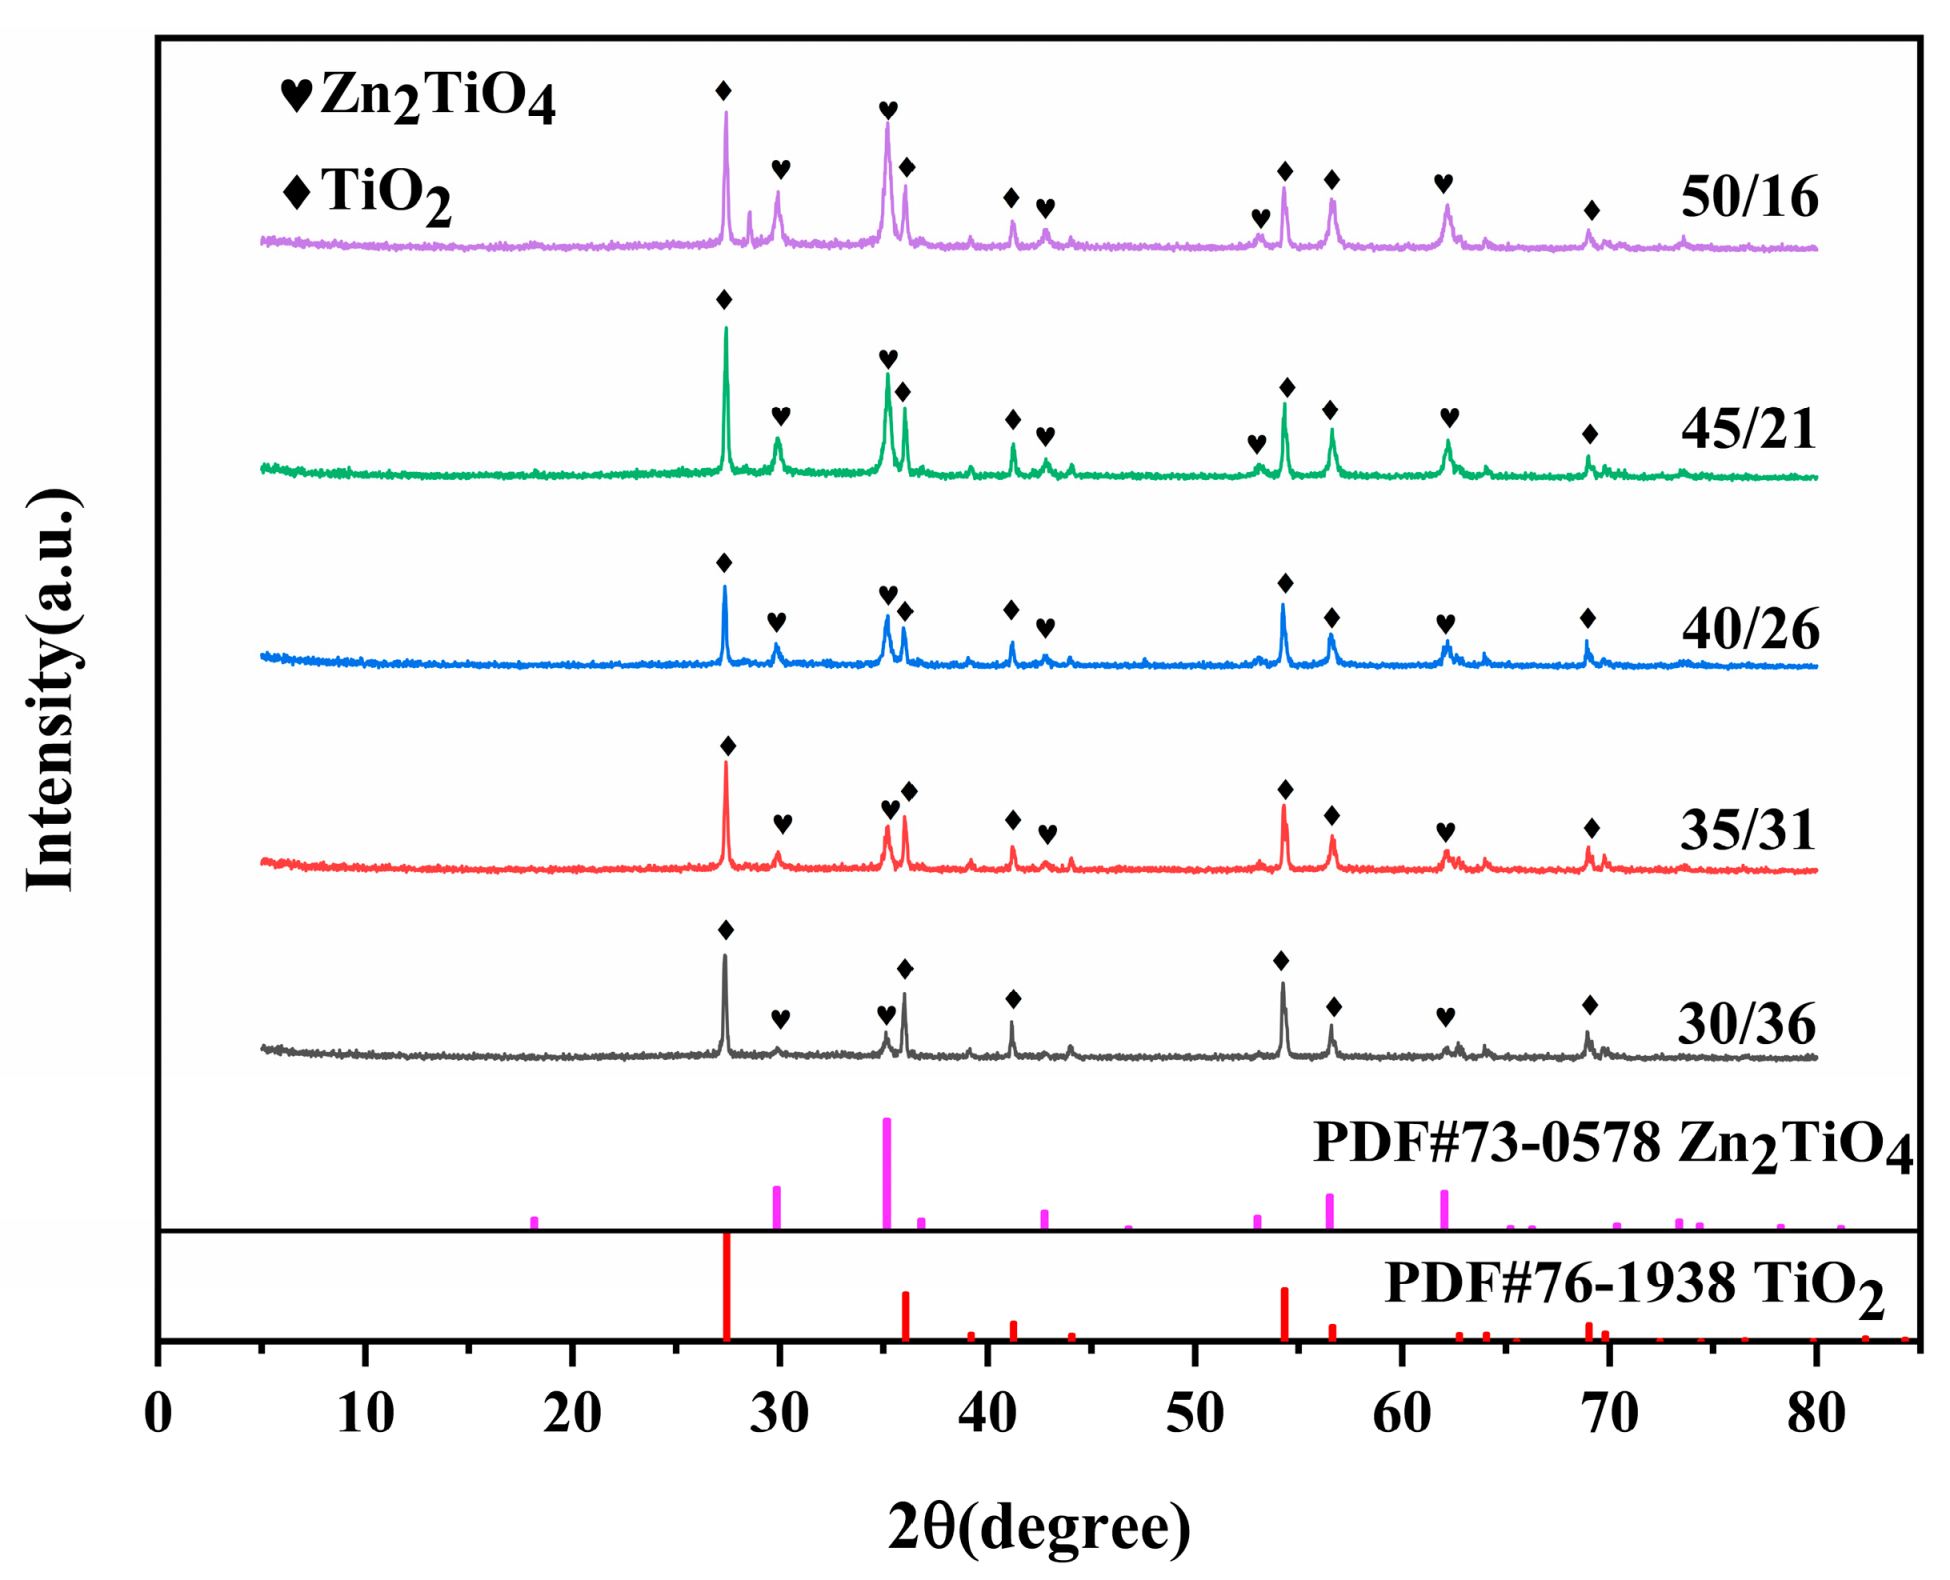
3.3. XRD Patterns
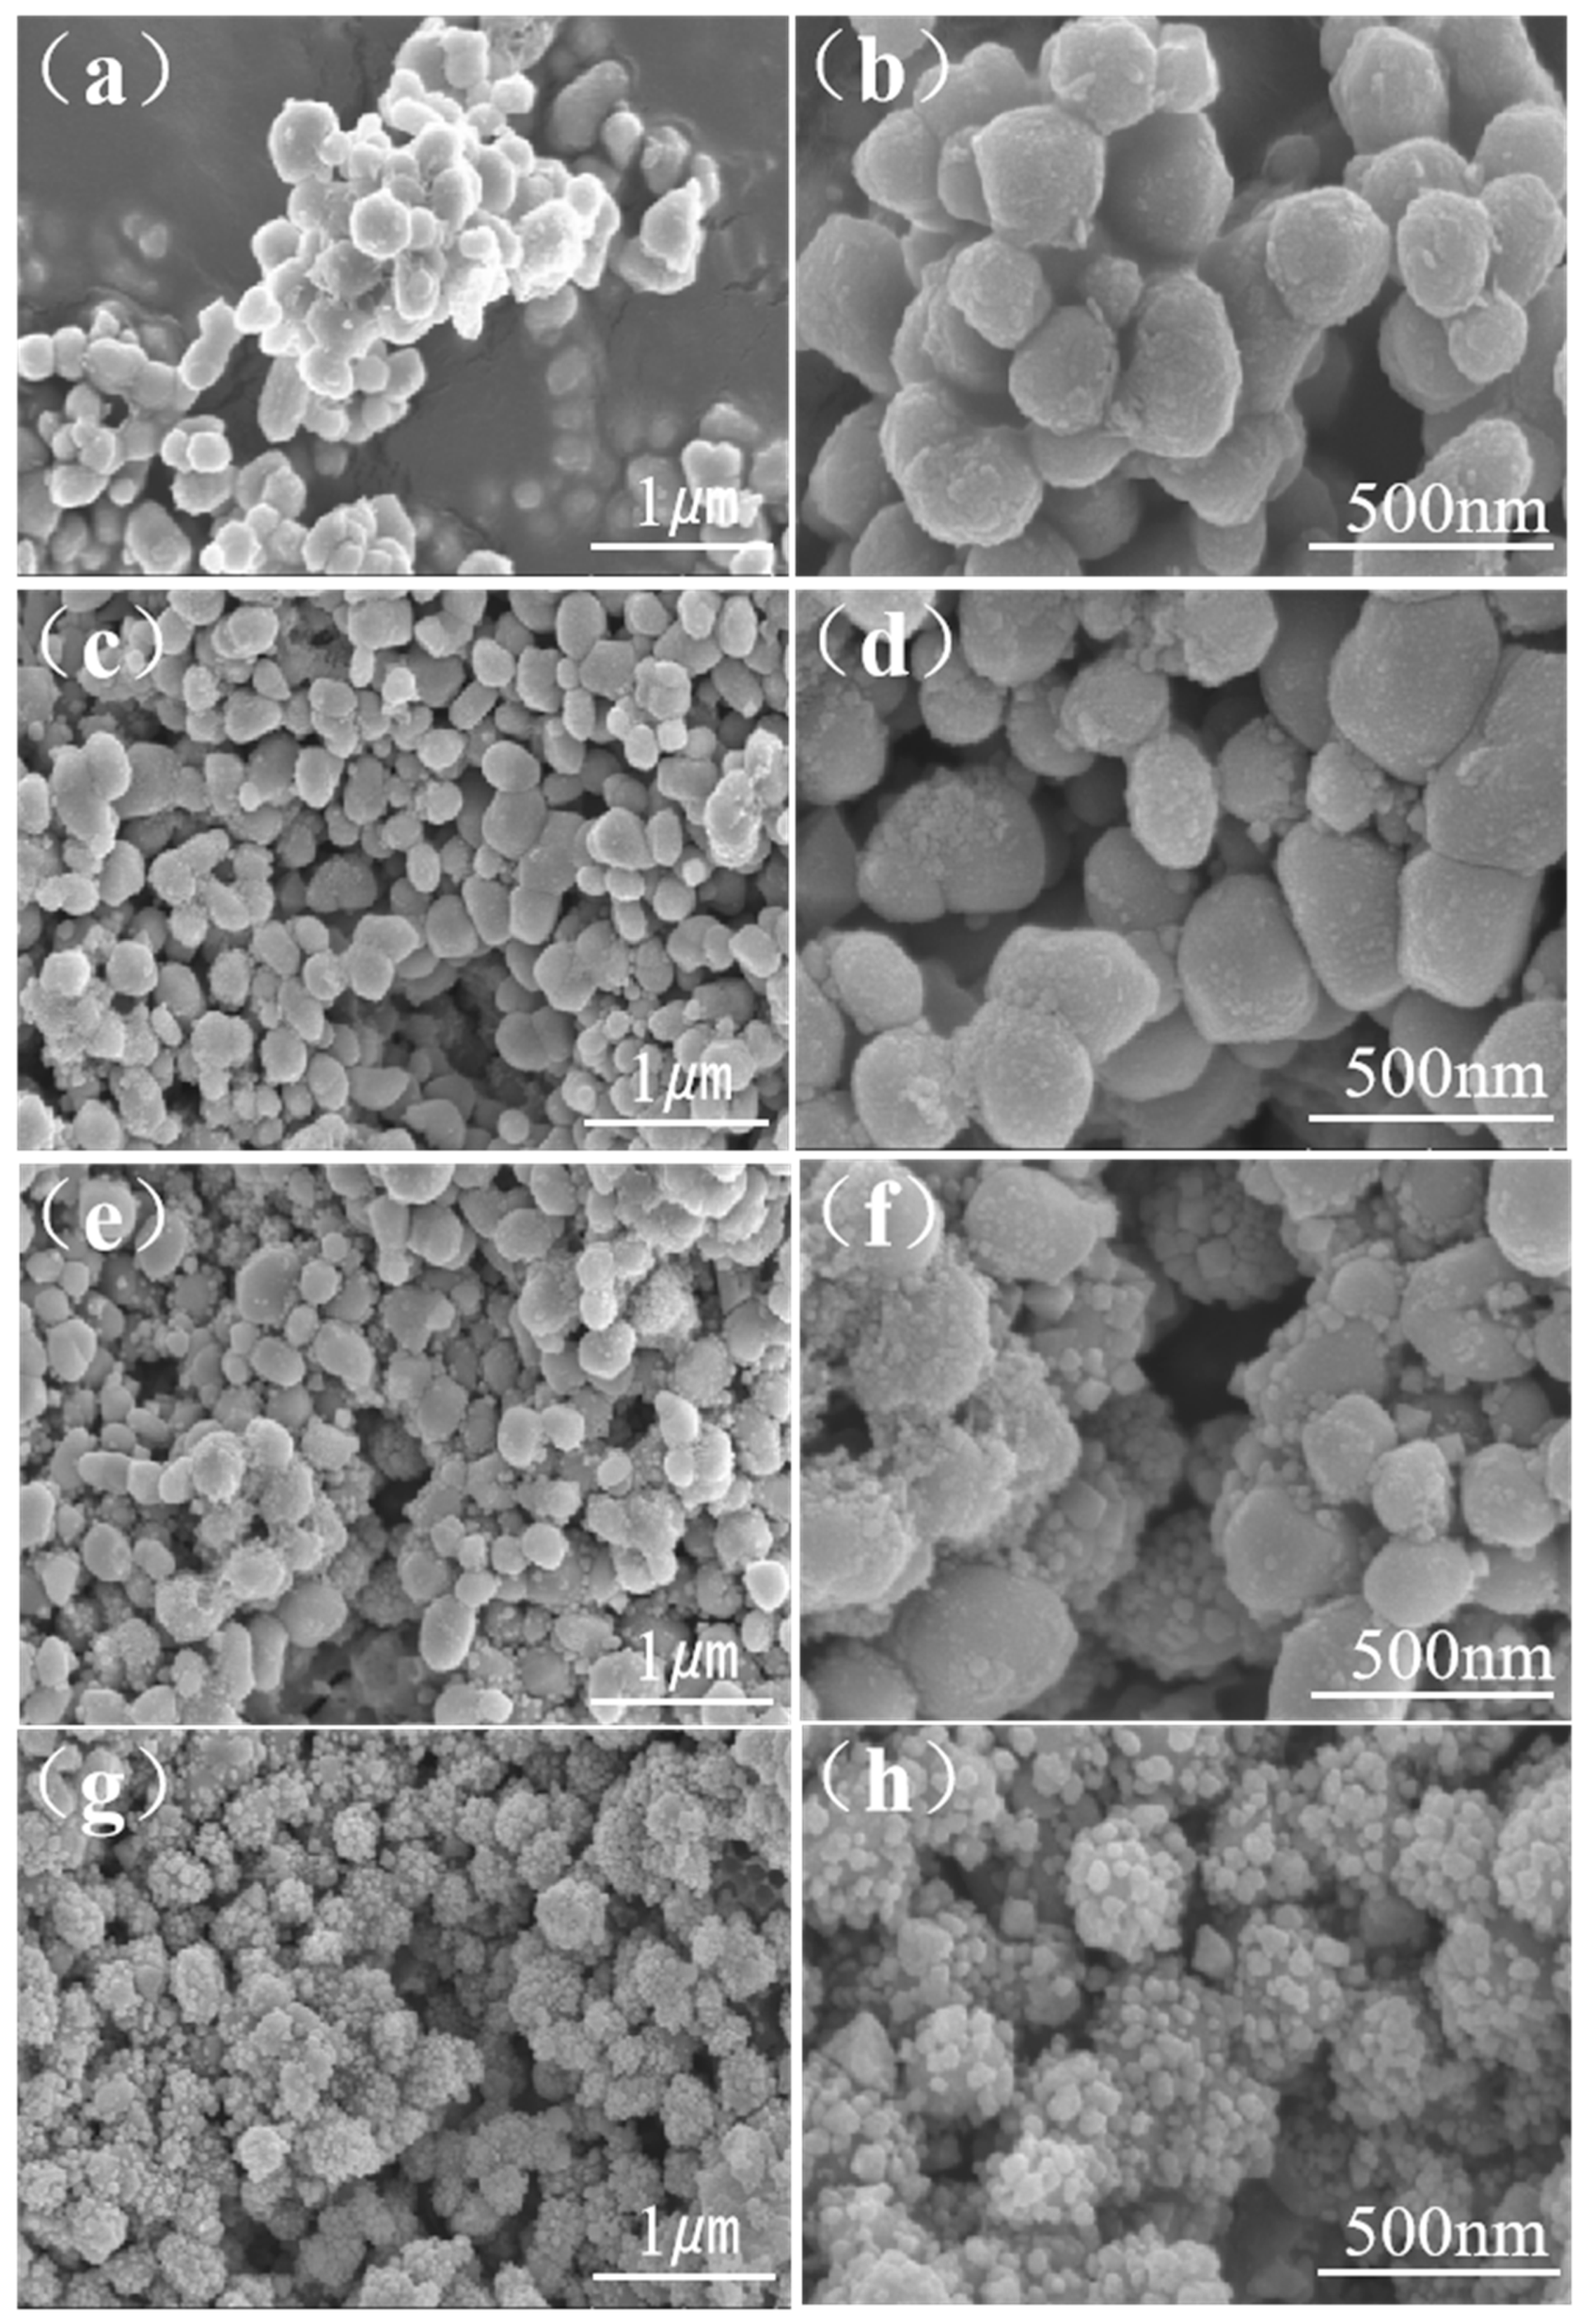
3.4. SEM Analysis
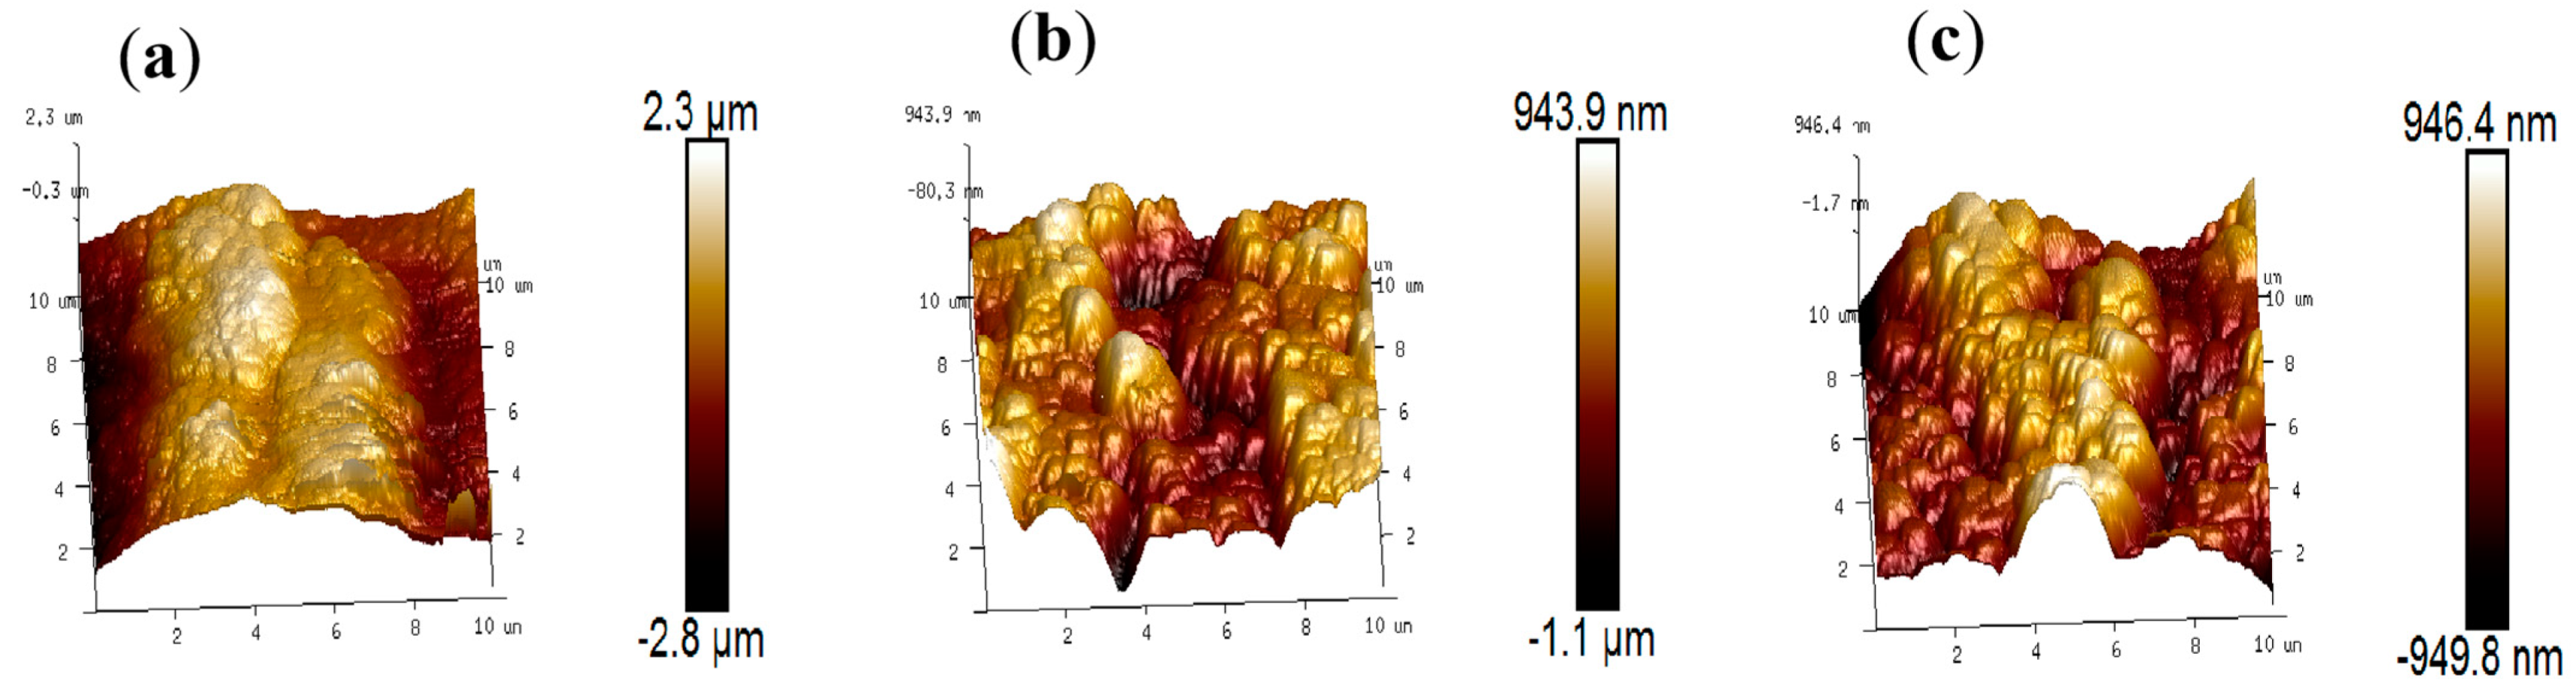
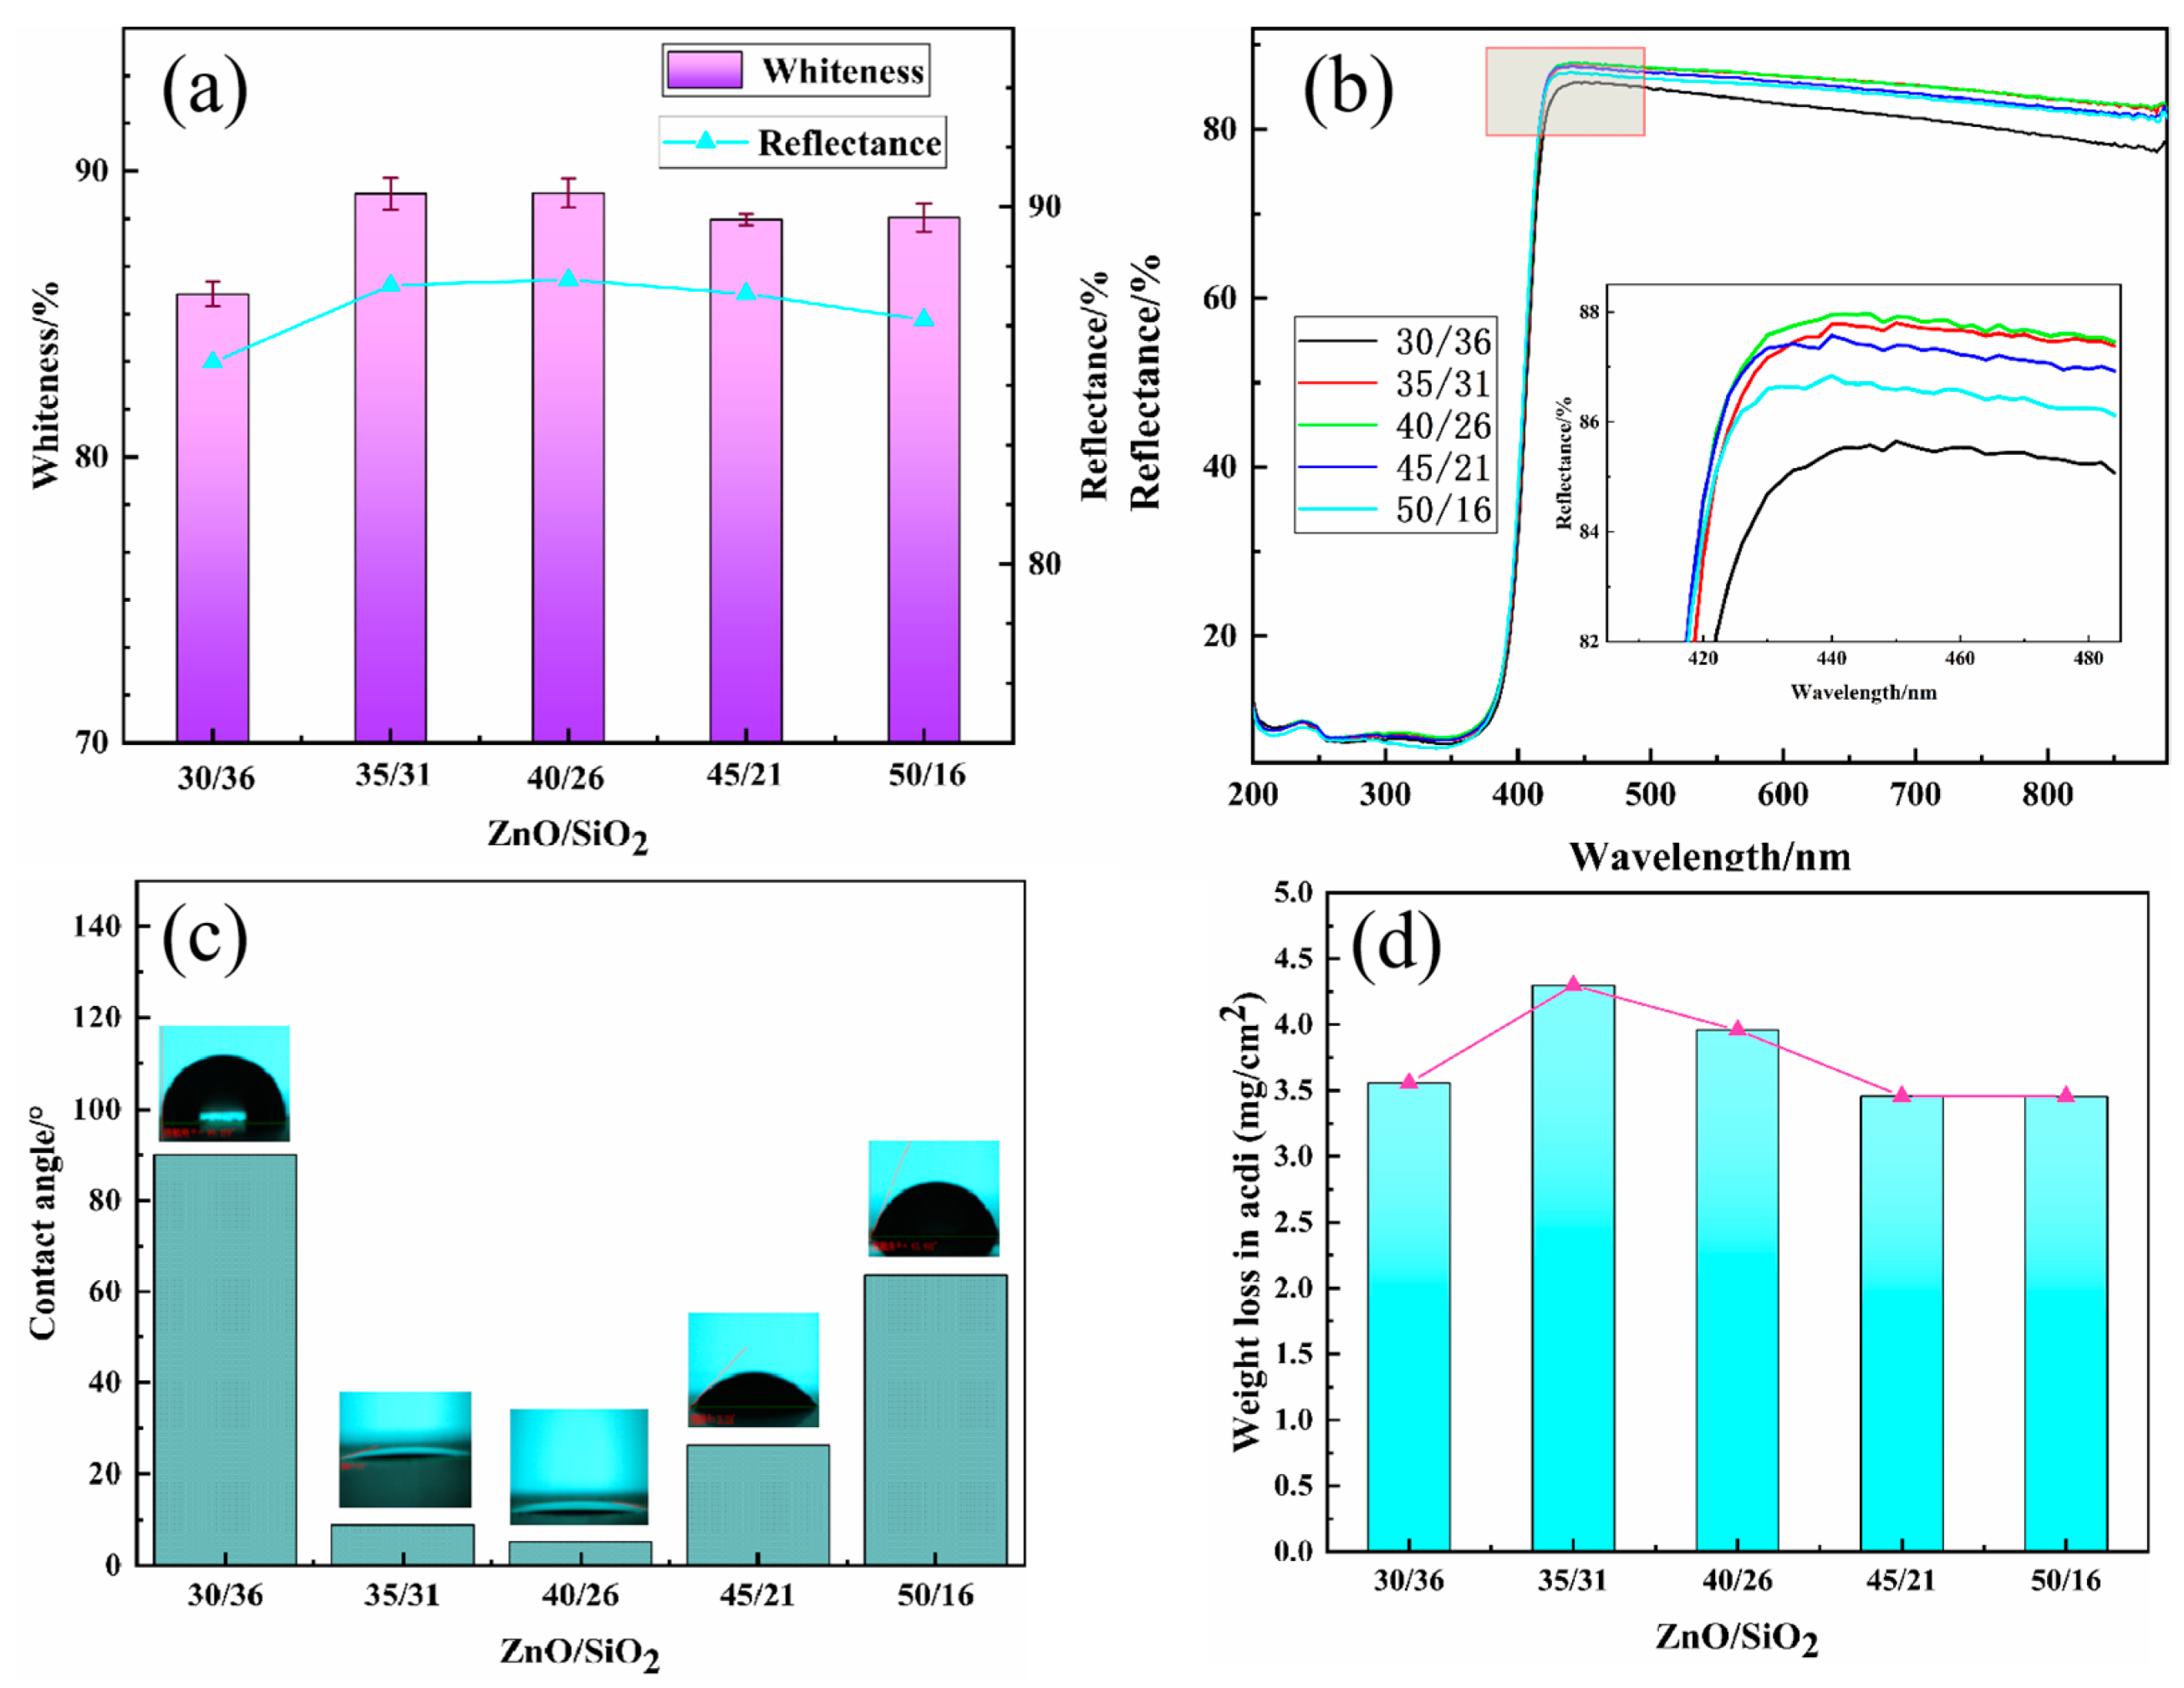
3.5. Properties
4. Conclusions
Supplementary Materials
Author Contributions
Funding
Data Availability Statement
Conflicts of Interest
References
- Liu, J.; Mooney, H.; Hull, V.; Davis, S.J.; Gaskell, J.; Hertel, T.; Lubchenco, J.; Seto, K.C.; Gleick, P.; Kremen, C.; et al. Systems integration for global sustainability. Science 2015, 347, 1258832. [Google Scholar] [CrossRef] [PubMed]
- Maleki, A.; Pourfayaz, F.; Hafeznia, H.; Rosen, M.A. A novel framework for optimal photovoltaic size and location in remote areas using a hybrid method: A case study of eastern Iran. Energy Convers. Manag. 2017, 153, 129–143. [Google Scholar] [CrossRef]
- Fritts, C.E. On the fritts selenium cells and batteries. J. Frankl. Inst. 1885, 119, 221–232. [Google Scholar] [CrossRef]
- Ramiro, I.; Marti, A. Intermediate band solar cells: Present and future. Prog. Photovolt. Res. Appl. 2021, 29, 705–713. [Google Scholar] [CrossRef]
- Shang, A.; Li, X. Photovoltaic Devices: Opto-Electro-Thermal Physics and Modeling. Adv. Mater. 2017, 29, 1603492. [Google Scholar] [CrossRef] [PubMed]
- Kim, N.; Lee, S.; Zhao, X.G.; Kim, D.; Oh, C.; Kang, H. Reflection and durability study of different types of backsheets and their impact on c-Si PV module performance. Sol. Energy Mater. Sol. Cells 2016, 146, 91–98. [Google Scholar] [CrossRef]
- Zhou, J.; Jiao, J.; Luo, D.; Yang, J.; Zhan, L.; Xiong, D.; Li, H. B2O3-ZnO-SiO2 low-melting glass and its application in high reflective white glass ink. J. Non-Cryst. Solids 2023, 617, 122511. [Google Scholar] [CrossRef]
- Ponce-Alcántara, S.; Arangú, A.V.; Plaza, G.S. The importance of optical characterization of PV backsheets in improving solar module power. In Proceedings of the 8th International Photovoltaic Power Generation Conference Exhibition, Shanghai, China, 20–22 May 2014; Volume 20. [Google Scholar]
- Jiao, J.; Yang, M.; Li, J.; Xiong, D.; Li, H. A novel high reflective glass-ceramic ink with Bi2Ti2O7 nanocrystals used for the photovoltaic glass backplane. J. Eur. Ceram. Soc. 2023, 43, 3630–3636. [Google Scholar] [CrossRef]
- Moghtada, A.; Shahrouzianfar, A.; Ashiri, R. Facile synthesis of NiTiO3 yellow nano-pigments with enhanced solar radiation reflection efficiency by an innovative one-step method at low temperature. Dye. Pigment. 2017, 139, 388–396. [Google Scholar] [CrossRef]
- Kang, J.; Wang, J.; Zhou, X.; Yuan, J.; Hou, Y.; Qian, S.; Li, S.; Yue, Y. Effects of alkali metal oxides on crystallization behavior and acid corrosion resistance of cordi-erite-based glass-ceramics. J. Non-Cryst. Solids 2018, 481, 184–190. [Google Scholar] [CrossRef]
- Annapurna, K.; Dwivedi, R.N.; Kundu, P.; Buddhudu, S. Blue emission spectrum of Ce3+: ZnO-B2O3-SiO2 optical glass. Mater. Lett. 2004, 58, 787–789. [Google Scholar] [CrossRef]
- Shen, Y.; Hou, L.; Zuo, G.; Li, F.; Meng, Y. Preparation of ZnO–B2O3–SiO2: Mn2+ optical-storage glass–ceramics with different ZnF2 dopant by sol–gel method. J. Sol-Gel Sci. Technol. 2015, 73, 192–198. [Google Scholar] [CrossRef]
- Sridharan, S.; Blonski, R.P.; Emlemdi, H.B.; Roberts, G.J.; Joyce, I.H. Glass Enamel for Automotive Applications. U.S. Patent US6105394A, 22 August 2000. [Google Scholar]
- Wang, M.; Fang, L.; Li, M.; Liu, Z.; Hu, Y.; Zhang, X.; Deng, W.; Dongol, R. Phase separation and crystallization of La2O3 doped ZnO-B2O3-SiO2 glass. J. Rare Earths 2019, 37, 767–772. [Google Scholar] [CrossRef]
- Gad-Allah, T.A.; Margha, F.H. Photoactive transparent nano-crystalline glass-ceramic for remazole red dye degradation. Mater. Res. Bull. 2012, 47, 4096–4100. [Google Scholar] [CrossRef]
- Liu, L.; Chan, K.C.; Pang, G.K.H. High-resolution TEM study of the microstructure of Zr65Ni10Cu7. 5Al7. 5Ag10 bulk metallic glass. J. Cryst. Growth 2004, 265, 642–649. [Google Scholar] [CrossRef]
- Pelino, M.; Cantalini, C.; Veglio’, F.; Plescia, P.P. Crystallization of glasses obtained by recycling goethite industrial wastes to produce glass-ceramic materials. J. Mater. Sci. 1994, 29, 2087–2094. [Google Scholar] [CrossRef]
- Zhou, W.; Li, X.; Yao, F.; Zhang, H.; Sun, K.; Chen, F.; Xu, P.; Li, X. Chip-Based MEMS Platform for Thermogravimetric/Differential Thermal Analysis (TG/DTA) Joint Characterization of Materials. Micromachines 2022, 13, 445. [Google Scholar] [CrossRef] [PubMed]
- Holand, W.; Beall, G.H. Glass-Ceramic Technology; John Wiley & Sons: Hoboken, NJ, USA, 2019. [Google Scholar]
- Xing, J.; Song, S.; Xu, X. Preparation of gold tailings glass-ceramics. Chin. J. Nonferrous Met. 2001, 11, 1004-0609. [Google Scholar]
- Yimam, D.; Ahmadi, M.; Kooi, B. Van der Waals epitaxy of pulsed laser deposited antimony thin films on lattice-matched and amorphous substrates. Mater. Today Nano 2023, 23, 100365. [Google Scholar] [CrossRef]
- Tian, Y.; Ding, J.; Huang, X.; Song, K.; Lu, S.-Q.; Zheng, H.-R. Development of novel interatomic potentials for simulation of rutile TiO2. Phys. B Condens. Matter 2019, 574, 311657. [Google Scholar] [CrossRef]
- Colak, H.; Karaköse, E. Synthesis and structural, electrical, optical properties of Lu3+-doped ZnO nanorods. Mater. Sci. Semicond. Process. 2019, 101, 230–237. [Google Scholar] [CrossRef]
- Meyer, A.; Toma, F.-L.; Kunze, O.; Böhme, A.; Matthey, B.; Potthoff, A.; Kaiser, A.; Gestrich, T.; Leyens, C. Development of Suspension Feedstocks for Thermally Sprayed Zn2TiO4 Coatings. J. Therm. Spray Technol. 2023, 32, 502–513. [Google Scholar] [CrossRef]
- Castellan, G.W. Photophysical Processes: Fluorescence and Phosphorescence. In Physical Chemistry, 3rd ed.; Addison-Wesley Publishing Company, Inc.: Reading, MA, USA, 1983; pp. 891–896. [Google Scholar]
- Peng, X.L.; Jiang, R.; Jia, C.S.; Zhang, L.H.; Zhao, Y.L. Gibbs free energy of gaseous phosphorus dimer. Chem. Eng. Sci. 2018, 190, 122–125. [Google Scholar] [CrossRef]
- Lee, C.S.; Matori, K.A.; Ab Aziz, S.H.; Kamari, H.M.; Ismail, I.; Zaid, M.H.M. Influence of zinc oxide on the physical, structural and optical band gap of zinc silicate glass system from waste rice husk ash. Optik 2017, 136, 129–135. [Google Scholar] [CrossRef]
- Gao, L.; Ma, Z.; Wang, F.; Li, W. Reflectivity and laser irradiation of plasma sprayed Al coating. In Proceedings of the Third International Symposium on Laser Interaction with Matter, Nanjing, China, 2–5 November 2014; SPIE: Bellingham, DC, USA, 2015; Volume 9543, pp. 143–147. [Google Scholar]
- Luo, X.-T.; Li, S.-P.; Li, G.-C.; Xie, Y.-C.; Zhang, H.; Huang, R.-Z.; Li, C.-J. Cold spray (CS) deposition of a durable silver coating with high infrared reflectivity for radiation energy saving in the polysilicon CVD reactor. Surf. Coatings Technol. 2021, 409, 126841. [Google Scholar] [CrossRef]
- Jeon, J.; Lee, J.; Hwang, S.; Ahn, J.; Kim, H. Influence of refractive indices of glass matrix on the reflectance of glass composites. Met. Mater. Int. 2011, 17, 593–598. [Google Scholar] [CrossRef]
- Möls, K.; Aarik, L.; Mändar, H.; Kasikov, A.; Niilisk, A.; Rammula, R.; Aarik, J. Influence of phase composition on optical properties of TiO2: Dependence of refractive index and band gap on formation of TiO2-II phase in thin films. Opt. Mater. 2019, 96, 109335. [Google Scholar] [CrossRef]
- Li, L.; Fan, Y.; Wang, D.; Feng, G.; Xu, D. Refractive index dispersion of spinel Zn2TiO4 single crystal. Cryst. Res. Technol. 2011, 46, 475–479. [Google Scholar] [CrossRef]
- Shukla, G.; Angappane, S. Highly transparent, superhydrophilic and high-temperature stable anatase phase TiO2. Mater. Chem. Phys. 2023, 301, 127589. [Google Scholar] [CrossRef]
- Ramachandran, B.E.; Pai, B.C.; Balasubramanian, N. Studies on the Acid Resistance of E Glass. J. Am. Ceram. Soc. 1980, 63, 1–3. [Google Scholar] [CrossRef]
- Zhao, T.G.; Wang, W.; Liu, K.; Liu, L.; Dong, W.; Bao, Q.; Xu, H.; Zhou, J. Preparation of glass-ceramics in the R2O-Bi2O3-B2O3-SiO2 system applied in automobile glass ename. Inorganics 2023, 11, 166. [Google Scholar] [CrossRef]


| Type of Low-Melting Glass | Scope of Application | Filler | Firing Process | Crystal | Max Reflectance | Acid Resistance | Ref. |
|---|---|---|---|---|---|---|---|
| ZnO-B2O3-SiO2 | Photovoltaic back glass | TiO2 | 700 °C 5 min | Zn2TiO4 | 88.00% | 3.9 mg/cm2 | This work |
| Bi2O3-ZnO-B2O3-SiO2 | Photovoltaic back glass | TiO2 | 720 °C 6 min | Bi2Ti2O7 | 86.18% | - | [9] |
| ZnO-B2O3-SiO2 | Photovoltaic back glass | TiO2 | 600–760 °C 6 min | ZnTiO3 | 85.89% | - | [7] |
| R2O-Bi2O3-B2O3-SiO2 | Automobile glass | CuCr2O4 | 720 °C 210 s | Bi4Si3O12 | - | 2.9 × 10⁻⁶ g·cm−2·min−1 | [36] |
Disclaimer/Publisher’s Note: The statements, opinions and data contained in all publications are solely those of the individual author(s) and contributor(s) and not of MDPI and/or the editor(s). MDPI and/or the editor(s) disclaim responsibility for any injury to people or property resulting from any ideas, methods, instructions or products referred to in the content. |
© 2024 by the authors. Licensee MDPI, Basel, Switzerland. This article is an open access article distributed under the terms and conditions of the Creative Commons Attribution (CC BY) license (https://creativecommons.org/licenses/by/4.0/).
Share and Cite
Chen, Y.; Dong, W.; Bao, Q.; Zhao, T.; Cheng, Z.; Xu, Y. Low-Temperature Fast Firing Preparation of Zn2TiO4 Crystalline Photovoltaic Glass Ink and Its Properties. Inorganics 2024, 12, 169. https://doi.org/10.3390/inorganics12060169
Chen Y, Dong W, Bao Q, Zhao T, Cheng Z, Xu Y. Low-Temperature Fast Firing Preparation of Zn2TiO4 Crystalline Photovoltaic Glass Ink and Its Properties. Inorganics. 2024; 12(6):169. https://doi.org/10.3390/inorganics12060169
Chicago/Turabian StyleChen, Yongjian, Weixia Dong, Qifu Bao, Tiangui Zhao, Zhipeng Cheng, and Yan Xu. 2024. "Low-Temperature Fast Firing Preparation of Zn2TiO4 Crystalline Photovoltaic Glass Ink and Its Properties" Inorganics 12, no. 6: 169. https://doi.org/10.3390/inorganics12060169