Article

New Iron(III)-Containing Composite of Salinomycinic Acid with Antitumor Activity—Synthesis and Characterization

1
Faculty of Medicine, Sofia University “St. Kliment Ohridski”, Kozjak Str., 1, 1407 Sofia, Bulgaria
2
Institute of General and Inorganic Chemistry, Bulgarian Academy of Sciences, Acad. Georgi Bonchev Str., Bl. 11, 1113 Sofia, Bulgaria
3
Institute of Experimental Morphology, Pathology and Anthropology with Museum, Bulgarian Academy of Sciences, Acad. Georgi Bonchev Str., Bl. 25, 1113 Sofia, Bulgaria
4
Institute of Neurobiology, Bulgarian Academy of Sciences, Acad. Georgi Bonchev Str., Bl. 23, 1113 Sofia, Bulgaria
5
Department of Biomedical Imaging and Image-Guided Therapy, Division of Molecular and Structural Preclinical Imaging, Preclinical Imaging Laboratory, Medical University of Vienna, General Hospital of Vienna, Waehringer Guertel 18-20, 1090 Vienna, Austria
6
Institute of Inorganic Chemistry, Faculty of Chemistry, University of Vienna, Waehringer Strasse 42, 1090 Vienna, Austria
7
Microanalytical Laboratory, Faculty of Chemistry, University of Vienna, Waehringer Strasse 42, 1090 Vienna, Austria
8
Chemistry Department, R&D, BIOVET JSC, 39 Peter Rakov Str., 4550 Peshtera, Bulgaria
*
Authors to whom correspondence should be addressed.
Inorganics 2024, 12(8), 206; https://doi.org/10.3390/inorganics12080206
Submission received: 10 June 2024 / Revised: 12 July 2024 / Accepted: 25 July 2024 / Published: 29 July 2024
(This article belongs to the Section Coordination Chemistry)

Abstract

:
In this study we demonstrated for the first time synthetic procedures for composites of salinomycin (SalH) and two-line ferrihydrite. The products were characterized by various methods such as elemental analysis, attenuated total reflectance–Fourier-transform spectroscopy (ATR-FTIR), electron paramagnetic resonance spectroscopy (EPR), powder X-ray diffraction analysis (XRD), electrospray-ionization mass spectrometry (ESI-MS), thermogravimetric analysis with differential thermal analysis (DTA) and mass spectrometry (TG-DTA/MS). The EPR spectra of the isolated compounds consisted of signals associated with both isolated Fe3+ ions and magnetically coupled Fe3+ ions. Powder XRD analyses of the isolated products showed two intense and broad peaks at 9° and 15° 2Θ, corresponding to salinomycinic acid. Broad peaks with very low intensity around 35°, assigned to two-line ferrihydrite, were also registered. Based on the experimental results, we concluded that salinomycin sodium reacted with Fe(III) chloride to form composites consisting of two-line ferrihydrite and salinomycinic acid. One of the composites exerted pronounced antitumor activity in the sub-micromolar concentration range against human cervical cancer (HeLa), non-small-cell lung cancer (A549), colon cancer (SW480), and ovarian teratocarcinoma (CH1/PA1) cells.

Graphical Abstract

1. Introduction

Salinomycin (Figure 1) is a monocarboxylic polyether ionophorous antibiotic with intriguing biological activity—antitumor, antiviral and antibacterial [1,2,3,4,5,6,7,8,9,10,11,12,13]. The antitumor activity of salinomycin strongly depends on the cancer type [3,4]. Published data have revealed that, in leukemia cells, salinomycin decreased the activity of ATP-binding cassette transporters (ABC transporters) [4]. In human breast cancer cells, salinomycin induced proliferation of T-cells by suppressing the expression and enzymatic activity of indoleamine-2,3-dioxygenase [5]. In other cancer types, such as colon carcinoma, the antibiotic exerted its antitumor activity by inhibiting the Wnt-signaling cascade [4]. Pre-clinical studies have demonstrated that salinomycin, when administered alone or with 5-fluorouracil or oxaliplatin, showed pronounced antitumor activity compared to conventional therapy [10]. Pilot clinical trials proved that IV administration of salinomycin inhibited the progression of disease in patients, diagnosed with invasive breast carcinoma and vulva carcinoma, respectively, and only minor side effects were observed [13]. These studies demonstrate the enormous potential of salinomycin as an antitumor agent.
The combination of a paramagnetic metal center and ligand with antitumor activity is a modern approach for the synthesis of new theranostic agents [14]. Published data have demonstrated that the metal complexes of salinomycin with the paramagnetic metal ions Mn(II) and Gd(III) exerted higher antitumor activity compared to the non-coordinated antibiotic and salinomycin sodium, accompanied by an excellent contrast in magnetic resonance imaging [14]. It has also been observed that the cytotoxic activity of metal salinomycinates depended both on the metal ion and tested tumor cell line [15,16].
Iron (III) (Fe(III)) has been used as an alternative to gadolinium (III) (Gd(III)) for the design of new contrast agents with improved biological characteristics [17,18,19,20,21,22,23,24,25,26]. Similar to Gd(III) and manganese (II) (Mn(II)), Fe(III) is suitable for the synthesis of T1 contrast agents. Because of its small ionic radius and high charge, Fe(III) is a strong Lewis acid [21]. It forms stable mononuclear and polynuclear metal complexes both with low-molecular and high-molecular ligands [17,18,19,20,21,22,23,24,25,26]. To the best of our knowledge, there are no available data for the effect of Fe(III) on the antitumor activity of salinomycin.
In this study, we have investigated, for the first time, the interaction of Fe(III) chloride with salinomycin sodium at different experimental conditions. The isolated products were characterized by elemental analysis, attenuated total reflectance–Fourier-transform spectroscopy (ATR-FTIR), electron paramagnetic resonance spectroscopy (EPR), powder X-ray diffraction analysis (XRD), electrospray-ionization mass spectrometry (ESI-MS), thermogravimetric analysis with differential thermal analysis (DTA), and mass spectrometry (TG-DTA/MS). The antitumor activity of the isolated product was also evaluated.

2. Results and Discussion

2.1. Elemental Analysis

We performed the chemical reaction between salinomycin sodium and Fe(III) chloride solution at four different experimental conditions. Procedure 1 involved mixing aqueous solution of Fe(III) chloride with a solution of salinomycin sodium (in acetonitrile ((CH3CN) and methanol (CH3OH)) at a molar ratio of 1:1. Procedure 2 was conducted in methanolic solution at the same molar ratio of the reactants as described for procedure 1. The interaction of Fe(III) chloride (dissolved in water) with salinomycin sodium (solution in CH3CN and CH3OH) was also studied at a molar ratio of 1:3 (procedure 3). This molar ratio was also used to study the interaction between Fe(III) chloride and salinomycin sodium in methanolic solution (procedure 4). The molar ratio of the reactants 1: 1 was selected according to our previous experience with the synthesis of a complex compound of salinomycine with a trivalent metal ion [14]. The selected molar ratio of 1:3 corresponds to the stoichiometric coefficients in the chemical equation, presented in the Supplementary Materials (see Supplementary Materials, Scheme S1). The isolated products in procedures 1–4 are presented as product 1, product 2, product 3, and product 4, respectively. The results from the elemental analysis of the isolated products are given in Table 1. All isolated precipitates were sparingly soluble in water and soluble in CH3OH, DMSO, and C2H5OH. We found that the mass percent carbon content in the isolated products varied from 60.95% to 64.65% and the mass percent composition of hydrogen was in the range from 8.76% to 9.28%. The lowest mass percent oxygen content was established for product 1 and the highest for product 3. The lowest experimental yield was achieved by procedure 1, probably because of the colloidal character of the precipitate and difficulties in its isolation. All synthetic procedures were tested for reproducibility as the first procedure was performed in triplicate and the others three procedures were carried out in duplicate.

2.2. ATR-FTIR Spectroscopy

The structure of the obtained compounds was studied at solid state by ATR-FTIR spectroscopy. Compared to the ATR-FTIR spectrum of salinomycin sodium, significant alterations in the spectra of the products were found (Figure 2).
The spectrum of salinomycin sodium consisted of bands at 1562 cm−1 and 1404 cm−1, assigned to asymmetric and symmetric, respectively, the stretching vibrations of the carboxylate anion. Neither band was observed in the spectra of the isolated products. Moreover, the bands at 3225 cm−1 and 1716 cm−1 associated with the stretching vibrations of the hydroxyl group and the carbonyl group, respectively, in the spectrum of salinomycin sodium were shifted in the spectra of the products. These differences in the spectrum of salinomycin sodium compared to the ATR-FTIR spectra of the products confirmed that the reactant salinomycin sodium had undergone chemical transformation as a result of mixing with the Fe(III) chloride solution.
Figure 3 indicates that the ATR-FTIR spectra of the products, synthesized according to procedures 1 and 2, are identical. It should be noted that the band at 2366 cm−1 in the ATR-FTIR spectrum in the product 1 is a digital/visualization artifact and it was not reproducible. The observed change in the intensity of the bands in the spectrum of product 1 compared to the spectrum of product 2 are not relevant because we performed qualitative ATR-FTIR analysis only. The ATR-FTIR spectra of product 3 and product 4, obtained by procedures 3 and 4 (Figure 4), were also identical.
The strong and broad band observed at 3483 cm−1 in the IR spectra of the products was assigned to the stretching vibration of the water hydroxyl group, as well as to the stretching vibrations of the secondary and tertiary hydroxyl groups. Compared to the ATR-FTIR spectrum of salinomycinic acid, a slight broadening of this band was observed. This effect might be attributed to the participation of hydroxyl groups in hydrogen bonding. These results are in contrast to the results reported previously for FTIR spectral data of metal salinomycinates, where a shift to the lower frequencies of the stretching vibration of OH groups was found, and confirm a different binding mode of salinomycin to Fe(III) compared to Gd(III) and divalent metal ions [14,27,28]. The intense band at 1704 cm−1 observed in the spectrum of salinomycinic acid corresponds to the stretching vibration of the C=O bond. A mild shift in this band to a lower frequency in the spectra of the products was observed. Bands associated with the asymmetric and symmetric stretching vibrations of carboxylate ion were not observed in the spectra of products 1, 2, 3, and 4 (Figure S1, Supplementary Materials). The results confirmed that the carboxylate group remained protonated in the structure of the isolated products.
Several differences in the ATR-FTIR spectra of the compounds for the fingerprint region from 1100 to 1000 cm−1 compared to the spectrum of salinomycinic acid were registered (Figure 3b and Figure 4b). The intensity of the broad doublet at 1107 cm−1 and 1087 cm−1 decreased significantly in the spectra of all compounds. Furthermore, a shift in the intense band at 1036 cm−1 to 1052 cm−1 was found. The band at 1069 cm−1 in the spectrum of salinomycinic acid disappeared in the spectra of the products. These alterations are most probably related to a change in the stretching vibrations of the C-O bond from secondary hydroxyl groups or the ether C-O bond.
Published data have demonstrated that Fe(III) can form polynuclear complexes with μ-oxo-bridged ligands [29]. According to the literature results, the stretch for the bridged Fe-O-Fe bond appeared from 880 cm−1 to 744 cm−1 and depended on the length of the bond [29]. The very weak band detected with a maximum of around 814 cm−1 in the spectra of products 1 and 2 could be assigned to the stretching vibration of the bridged Fe-O-Fe bond. The band with a maximum of around 894 cm−1 in the spectra of the isolated compounds could be assigned to the bending vibration of the Fe-OH bond [30]. Most likely, the band registered at 1087 cm−1 is a result of the stretch of Fe-OH [30]. These results are very similar to the literature values for the bending and stretching vibrations of the Fe-OH bond—1100 cm−1 and 880 cm−1, respectively [30].

2.3. Electron Paramagnetic Resonance Spectroscopy (EPR)

Fe3+ ions are Kramers’ ions with a d5 configuration and a 6S ground state. At zero magnetic field, the 6S state splits into three Kramers’ doublets with values of the magnetic spin number: ms = ±1/2, ms = ±3/2 and ms = ±5/2. Applying the magnetic field leads to further lifting of degeneracy and splitting of each Kramers’ doublet. Following the selection rule, ∆ms = 1, various transitions between the six energy states can occur, their probability depending on the coordination and crystal symmetry of Fe3+ ions. According to Muralidhara et al. [31] and Vercamer et al. [32], the transition in the |±1/2> doublet leads to an appearance in the EPR spectrum of a signal with g~2.0, which arises from Fe3+ ions in octahedral symmetry. Ardelean et al. [33] and Castner et al. [34] attributed the signal with g~4.3 to isolated Fe3+ ions in distorted octahedral or rhombic coordination, assuming that this signal originates due to a transition in the middle |±3/2> Kramers’ doublet. The broad signal in the center of the magnetic field is assigned to magnetically coupled Fe3+ ions [33].
To elucidate the structure of the isolated products, we have applied solid state EPR. The obtained EPR spectra of the isolated compounds are presented in Figure 5.
The room-temperature spectrum of product 1 (Figure 5a) consisted of two relatively narrow signals with g-factors of 4.25 and 2.010. The positions of registered signals remained unchanged in the low temperature spectrum, while their linewidths decreased from 9 mT at 295 K to about 6 mT at 100 K. Comparing the intensities of the two signals in their room-temperature spectrum revealed that a signal with g~2.01 was four times more intense than a signal with g~4.25. In the central region of the spectrum, a third signal was observed with g-factor close to 2.0 and a linewidth exceeding 100 mT (shown by *). The determination of more precise EPR parameters for the broad signal was hindered due to the narrow signal with g~2.01 that was superimposed on it. The two narrow signals were attributed to isolated Fe3+ ions located in highly distorted (g~4.25) and octahedral symmetry (g~2.01), respectively. The broad signal located in the center of the magnetic field was due to exchange-coupled Fe3+ ions.
The EPR spectrum of product 2 (Figure 5b) showed signals similar to those observed in the spectrum of product 1. The assignment of the signal with g~4.25, as well as the broader signal with a linewidth greater than 100 mT here, was the same as for compound 1 [31,32]. Conversely, the narrower signal in the central magnetic field region with g~2.007 possessed EPR characteristics that were different to those observed for the narrow signal with g~2.010 in product 1. Its linewidth was broader and the temperature dependence was not so prominent—∆Hpp decreased from 15 mT at room temperature to 13.5 mT at 100 K. The substantial broadening allowed this signal to be rather related to not-well-isolated weakly magnetically coupled Fe3+ ions. The conclusion could be made that, in product 2, there were observed two types of magnetically coupled Fe3+ ions as well as isolated Fe3+ ions in distorted symmetry. Nevertheless, it should be emphasized that the spectra of product 2 were dominated by magnetically coupled Fe3+ ions.
The EPR spectrum of product 3 (Figure 5c) was dominated by a broad signal with g~2.04 and a linewidth (∆Hpp) of 130 mT at 295 K. As the temperature decreased, the signal retained its position, yet a broadening was observed, with the linewidth reaching 170 mT at 77K. A low intensive signal with a g-factor about 4.25 was determined on the shoulder of the broader signal. The prevailing broad signal in the spectrum of product 3 was assigned to magnetically coupled Fe3+ ions. The concentration of isolated Fe3+ ions, the presence of which was associated with the g~4.25 signal, was extremely low.
The EPR spectrum of product 4 (Figure 5d) resembled the above-mentioned spectrum of product 3. At room temperature, the broad signal dominating the spectrum was characterized by the following EPR parameters: g~2.0 and ∆Hpp~112 mT. The temperature dependence revealed that it retained its position in the range of 100–295 K, undergoing a slight broadening with a decrease in the temperature. The signals related to isolated ions in distorted (g~4.25) and octahedral symmetry (g~2.007) were hardly visible here. As a conclusion, it could be said that a signal from exchange-coupled Fe3+ ions was observed almost exclusively in the spectrum of product 4.
Based on the results of the EPR spectra, it was concluded that all isolated products contained exchange-coupled Fe3+ ions, and their amount significantly exceeded the amount of isolated ions. However, the spectra of products 1 and 2 showed greater contributions from isolated ions and not-well-isolated (weakly exchanged-coupled) ions, compared to products 3 and 4, whose spectra mainly showed a signal from exchange-coupled Fe3+ ions.

2.4. Thermogravimetric Studies

The results from TG/DTA-MS analyses are presented in Figures S2 and S3 (See Supplementary Materials). The release of absorbed/hydrogen-bonded water at a temperature of 100 °C was observed for salinomycinic acid (Figure S2b). The decomposition of the antibiotic started at 210 °C. The total mass loss at a temperature of 670 °C was 72.5%. The decomposition of salinomycin sodium (Figure S2a, Supplementary Materials) was registered at T = 190 °C. The mass loss below this temperature can be attributed to the release of absorbed and coordinated water molecules. The total mass loss at temperature 670 °C was 75%. All isolated products showed lower thermal stability compared to salinomycinic acid and salinomycin sodium (Figures S2 and S3, Supplementary Materials). The decomposition of all compounds was accompanied by endothermic events. The DTA curve of salinomycinic acid consisted of two endothermic peaks at temperatures of 250 °C and 450 °C, respectively. The mass loss of salinomycin sodium as a function of the temperature was associated with endothermic peaks at 257 °C, 400 °C, and 550 °C. The first endothermic effect in the DTA curves of products 1, 2, 3, and 4 was observed at a temperature of 150 °C. Endothermic peaks at higher temperatures in the range from 340 to 350 °C, and from 500 to 600 °C, respectively, were also established. The results from the TG-MS analyses confirmed the conclusion that the thermal stability of the composites is lower compared to the thermal stability of salinomycin sodium and salinomycinic acid. Figure S3 demonstrates that the release of carbon dioxide (CO2) during the thermal degradation of the tested products started at a lower temperature (150 °C) compared to that of salinomycinic acid and salinomycin sodium. Maximum dehydration of the composites was observed at a temperature range from 200 to 500 °C. Release of water at a temperature below 100 °C was also detected during the thermal decomposition of the composites. The mass loss of the products occurred at a lower temperature compared to that of salinomycinic acid, most likely because of the association of the compound with 2-line ferrihydrite in the composites.

2.5. Electrospray-Ionization Mass Spectrometry

The ESI-MS spectra of the products are presented in Figure S4, Supplementary Materials. The results indicate that the isolated products demonstrate a similar pattern of fragmentation. Formation of the following species was detected in the ESI-MS spectra of the products, m/z: 773.78 [Na(C42H70O11)]+, calcd.: 773.48 (100%), 774.48 (45.4%) and 750.78 [(C42H71O11)]+, calcd.: 751.49 (100%), 752.50 (45.4%). It should be pointed out that the peak at 750.78 m/z was not observed in the ESI-MS spectrum of salinomycin sodium (Figure S4a). The peak assigned to [C42H70O11Na]+ was also found in the spectra of Mn(II) salinomycinate and Gd(III) salinomycinate [14]. The formation of this molecular ion was a result of fragmentation of the complexes and further association of the C42H69O11 fragment with proton and sodium ion. Compared to the complex of salinomycin with Gd(III) [14], formation of the molecular ion [M(C42H69O11)2]+, where M is a trivalent metal ion, was not observed. These result further confirmed a different binding mode for salinomycin in the products compared to Gd(III) salinomycinate [14].

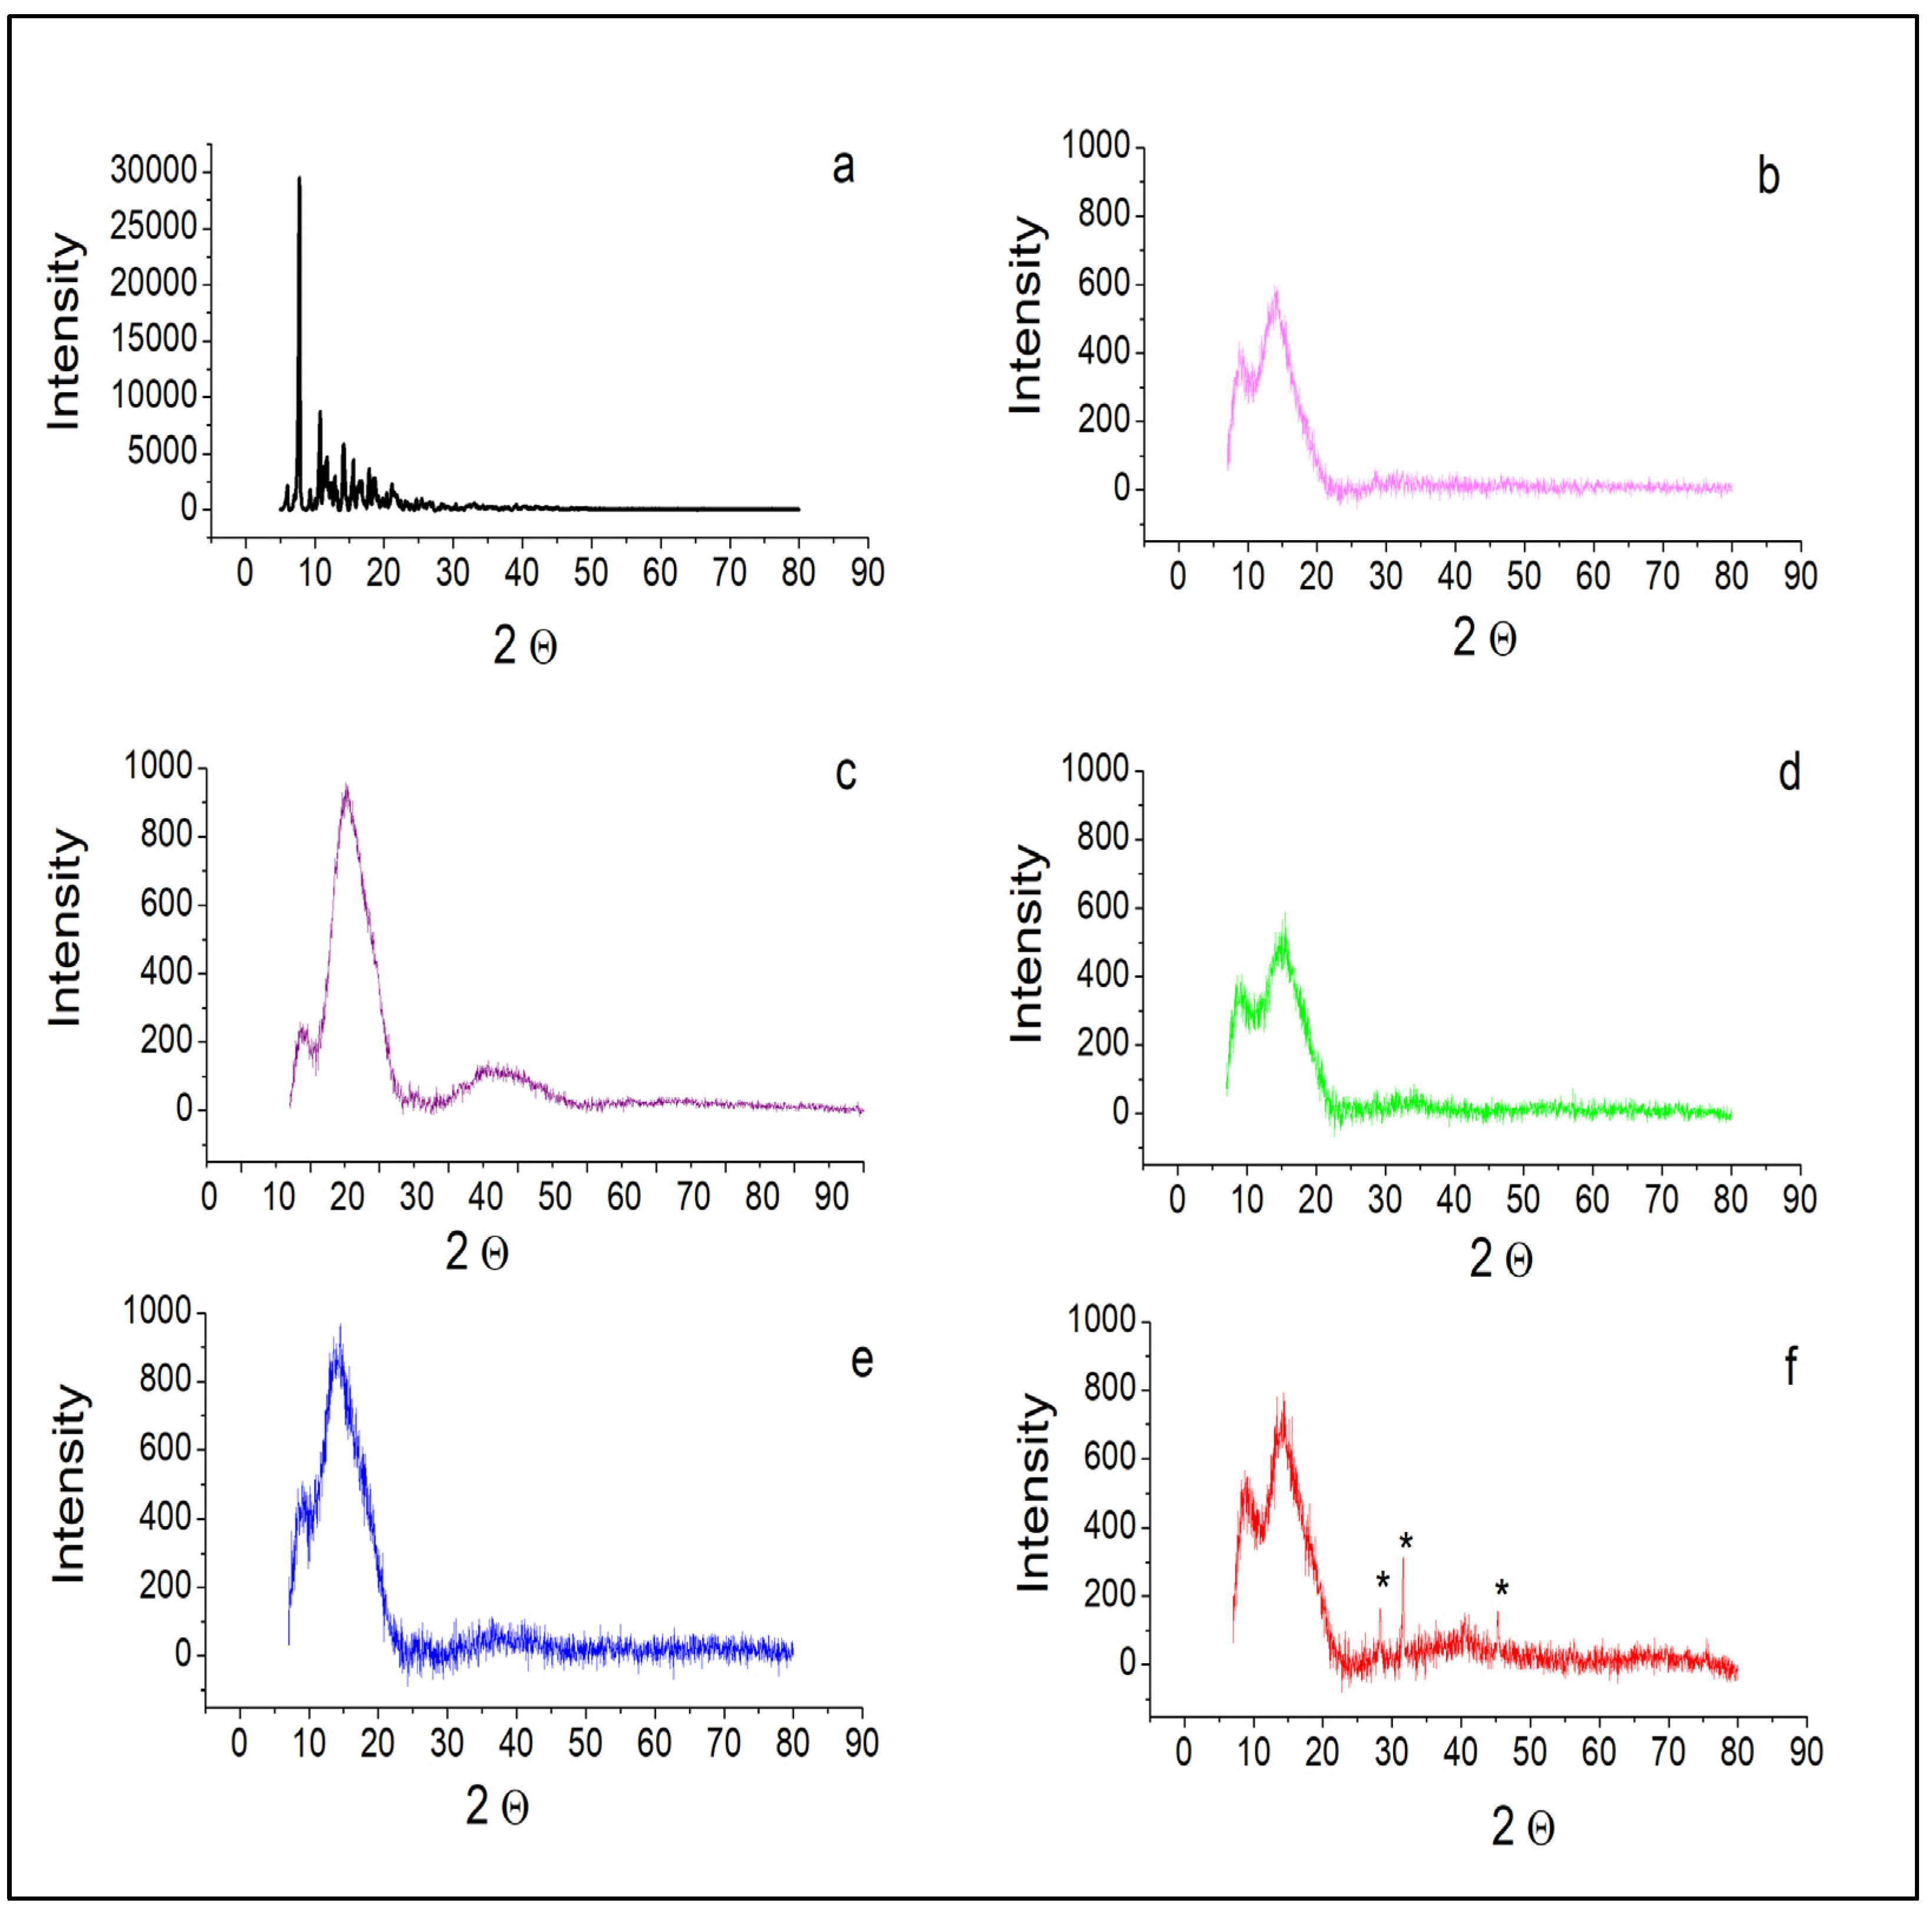
2.6. Powder XRD Analysis

The structure of the isolated products was further studied by powder X-ray diffraction analysis (Figure 6). Significant differences in the diffractograms of product 1, product 2, product 3, and product 4, compared to the diffractogram of salinomycin sodium, were found (Figure 6). The intense and sharp peaks in the diffractogram of salinomycin sodium (Figure 6a) disappeared in the diffractograms of all isolated products. The diffractogram of salinomycinic acid consisted of two broad and intense peaks at 8.8° and 14.2° 2Θ, demonstrating the amorphous nature of the organic compound. The results in Figure 6 reveal that the isolated products were amorphous, similar to salinomycinic acid. The diffractograms of the products contained peaks, assigned to salinomycinic acid and a broad peak with very low intensity and a maximum around 35° 2Θ, attributed to the presence of two-line ferrihydrite. Dzieniszewska, A et al. assigned this peak to the (110) plane of two-line ferrihydrite [35]. It should be pointed out that the other crystalline forms of iron, such as hematite and goethite, have very specific diffraction patterns with multiple sharp and intense peaks [36]. The results presented in Figure 6 reveal that products 1–4 did not contain hematite and goethite.

2.7. Proposed Compositions of the Isolated Products

To identify the structure and composition of Fe(III) compounds of salinomycin, we considered different hypotheses.
By mixing Fe(III) chloride solution with salinomycin sodium, the following possible reactions could occur. Salinomycin could replace water molecules either from [Fe(H2O)6]3+ or from [Fe(OH)(H2O)5]2+ to form complexes of composition [Fe(C42H69O11)3(H2O)3], or [Fe(OH)(C42H69O11)2(H2O)3]. However, the ATR-FTIR spectra of all isolated products indicated that the carboxyl group was protonated. The insolubility of the compounds in water excluded the probability of the generation of charged species of the composition [Fe(C42H70O11)3(H2O)3]Cl3 or [Fe(C42H70O11)3(H2O)3](OH)3. Moreover, FTIR data in the far IR region did not support the hypothesis of formation of [Fe(C42H70O11)3Cl3], since no band assigned to the Fe-Cl bond was observed. The composition of [Fe(C42H70O11)3(OH)3] was also not confirmed, due to acidic pH of the reaction mixture. Furthermore, such a structure was not supported by the results from the EPR analyses.
It has been reported that the hydrolysis of Fe(III) salts can affect the coordination of Fe(III) to organic ligands [37]. According to the literature studies, the hydrolysis of Fe(III) chloride is a complicated chemical process and involves the formation of hydrated ion [Fe(H2O)6]3+ with its subsequent transformation to the [Fe(OH)h(H2O)(6−h)](zh) + hH+ species [37,38]. The next stage of condensation of M-OH species might produce [FeaOb(OH)c(H2O)d] complexes [37,38,39]. Hosny [39] demonstrated that the hydrolysis of Fe(III) chloride depended on pH. Nurwahdah et al. [40] studied the effect of the concentration of FeCl3 solution on pH. The authors found that the pH for 0.15 M FeCl3 solution was 1.636 [39]. In our experimental procedures (procedure 1 and procedure 3) we used Fe(III) chloride solution with C = 0.15 M. The pH of this solution was 1.65. This value is in a good agreement with the experimental results reported by Nurwahdah et al. [40]. Jolivet et al. reported that, at this pH, only two species would be formed in Fe(III) chloride solution—[Fe(H2O)6]3+ and [Fe(OH)(H2O)5]2+ [41]. It has been demonstrated that for ferric chloride solution, condensation can occur at a pH higher than 1 and proceeds very rapidly. The condensation of the [Fe(OH)(H2O)5]2+ cation ultimately resulted in the formation of ferrihydrite [42]. Because of its thermodynamic instability, ferrihydrite undergoes transformation either to α-Fe2O3 (hematite) or to α-FeOOH (goethite) [41]. The process depended on the pH of the solution. The formation of goethite was observed at pH < 4 or pH > 8 [42]. However, it has been demonstrated that complexing agents can prevent the conversion of ferrihydrite to its crystalline phases [43]. Most likely, in our study, the in situ formation of salinomycinic acid in the acidic solution of Fe(III) chloride stabilized ferrihydrite by precipitation of the hybrid composite. We used the chemical composition FeOOH for two-line ferrihydrite [44] and C42H70O11 for salinomycin to calculate the molecular formulas of the new composites. The data presented in Table 1 are in a good agreement with the theoretical values for C, H, and O mass percent content and correspond to the established standards for the determination of the composition of new compounds [45]. The experimental data for mass percent content of Fe also agreed well with the theoretical values. Only for product 1 did the experimental mass percent Fe composition deviate from the theoretical value, by 1.99%. This result could be explained by the hygroscopicity of the compound and absorption of moisture during the prolonged storage before the ICP-MS analysis. ATR-FTIR and ESI-MS studies also confirmed that the composites contained salinomycinic acid. The observed changes in the ATR-FTIR spectra of the products, compared to the ATR-FTIR spectrum of salinomycinic acid, probably reflect the association of the organic compound with two-line ferrihydrite. According to the published studies, the structure of ferrihydrite consisted of 20% tetrahedral and 80% octahedral Fe(III) [46,47], as the exact ratio between both Fe(III) ions was found to be dependent on the particle size and surface [46]. Moreover, it has been established that edge-sharing Fe1 octahedrons are held together by two octahedral Fe2 and one tetrahedral Fe3 [46,47]. EPR analyses of Fe(III) oxides revealed that the number of the signals, their positions, and their linewidth in the spectrum depended on the surface, temperature and crystalline phase [48,49,50,51]. Our EPR data are in good agreement with the literature studies and with the hypothesis for formation of a composite between 2-line ferrihydrite and salinomycinic acid in the studied systems. It has been reported that the powder X-ray diffraction pattern of 2-line ferrihydrite consists of two broad peaks with very low intensity around 35° and 63°, with the first peak having higher intensity, compared to the second [43]. Both peaks were assigned to (110) and (115) planes of ferrihydrite [52]. In our study, the second peak of ferrihydrite was not clearly observed. This observation could be explained by the alterations in the (115) plane of the two-line ferrihydrite in the composites.
Unfortunately, due to the complexity of the structure of ferrihydrite [46], a structure of the new composites of ferrihydrite with salinomycinic acid could not be proposed. To the best of our knowledge, the structure of the composites of two-line ferrihydrite with organic ligands has never been reported. However, It has been found that the surface of ferrihydrite consists of hydroxyl groups [53]. Most likely, in our composites, salinomycnic acid and 2-line ferrihydrite are held together by hydrogen bonds and dipole–dipole interactions.

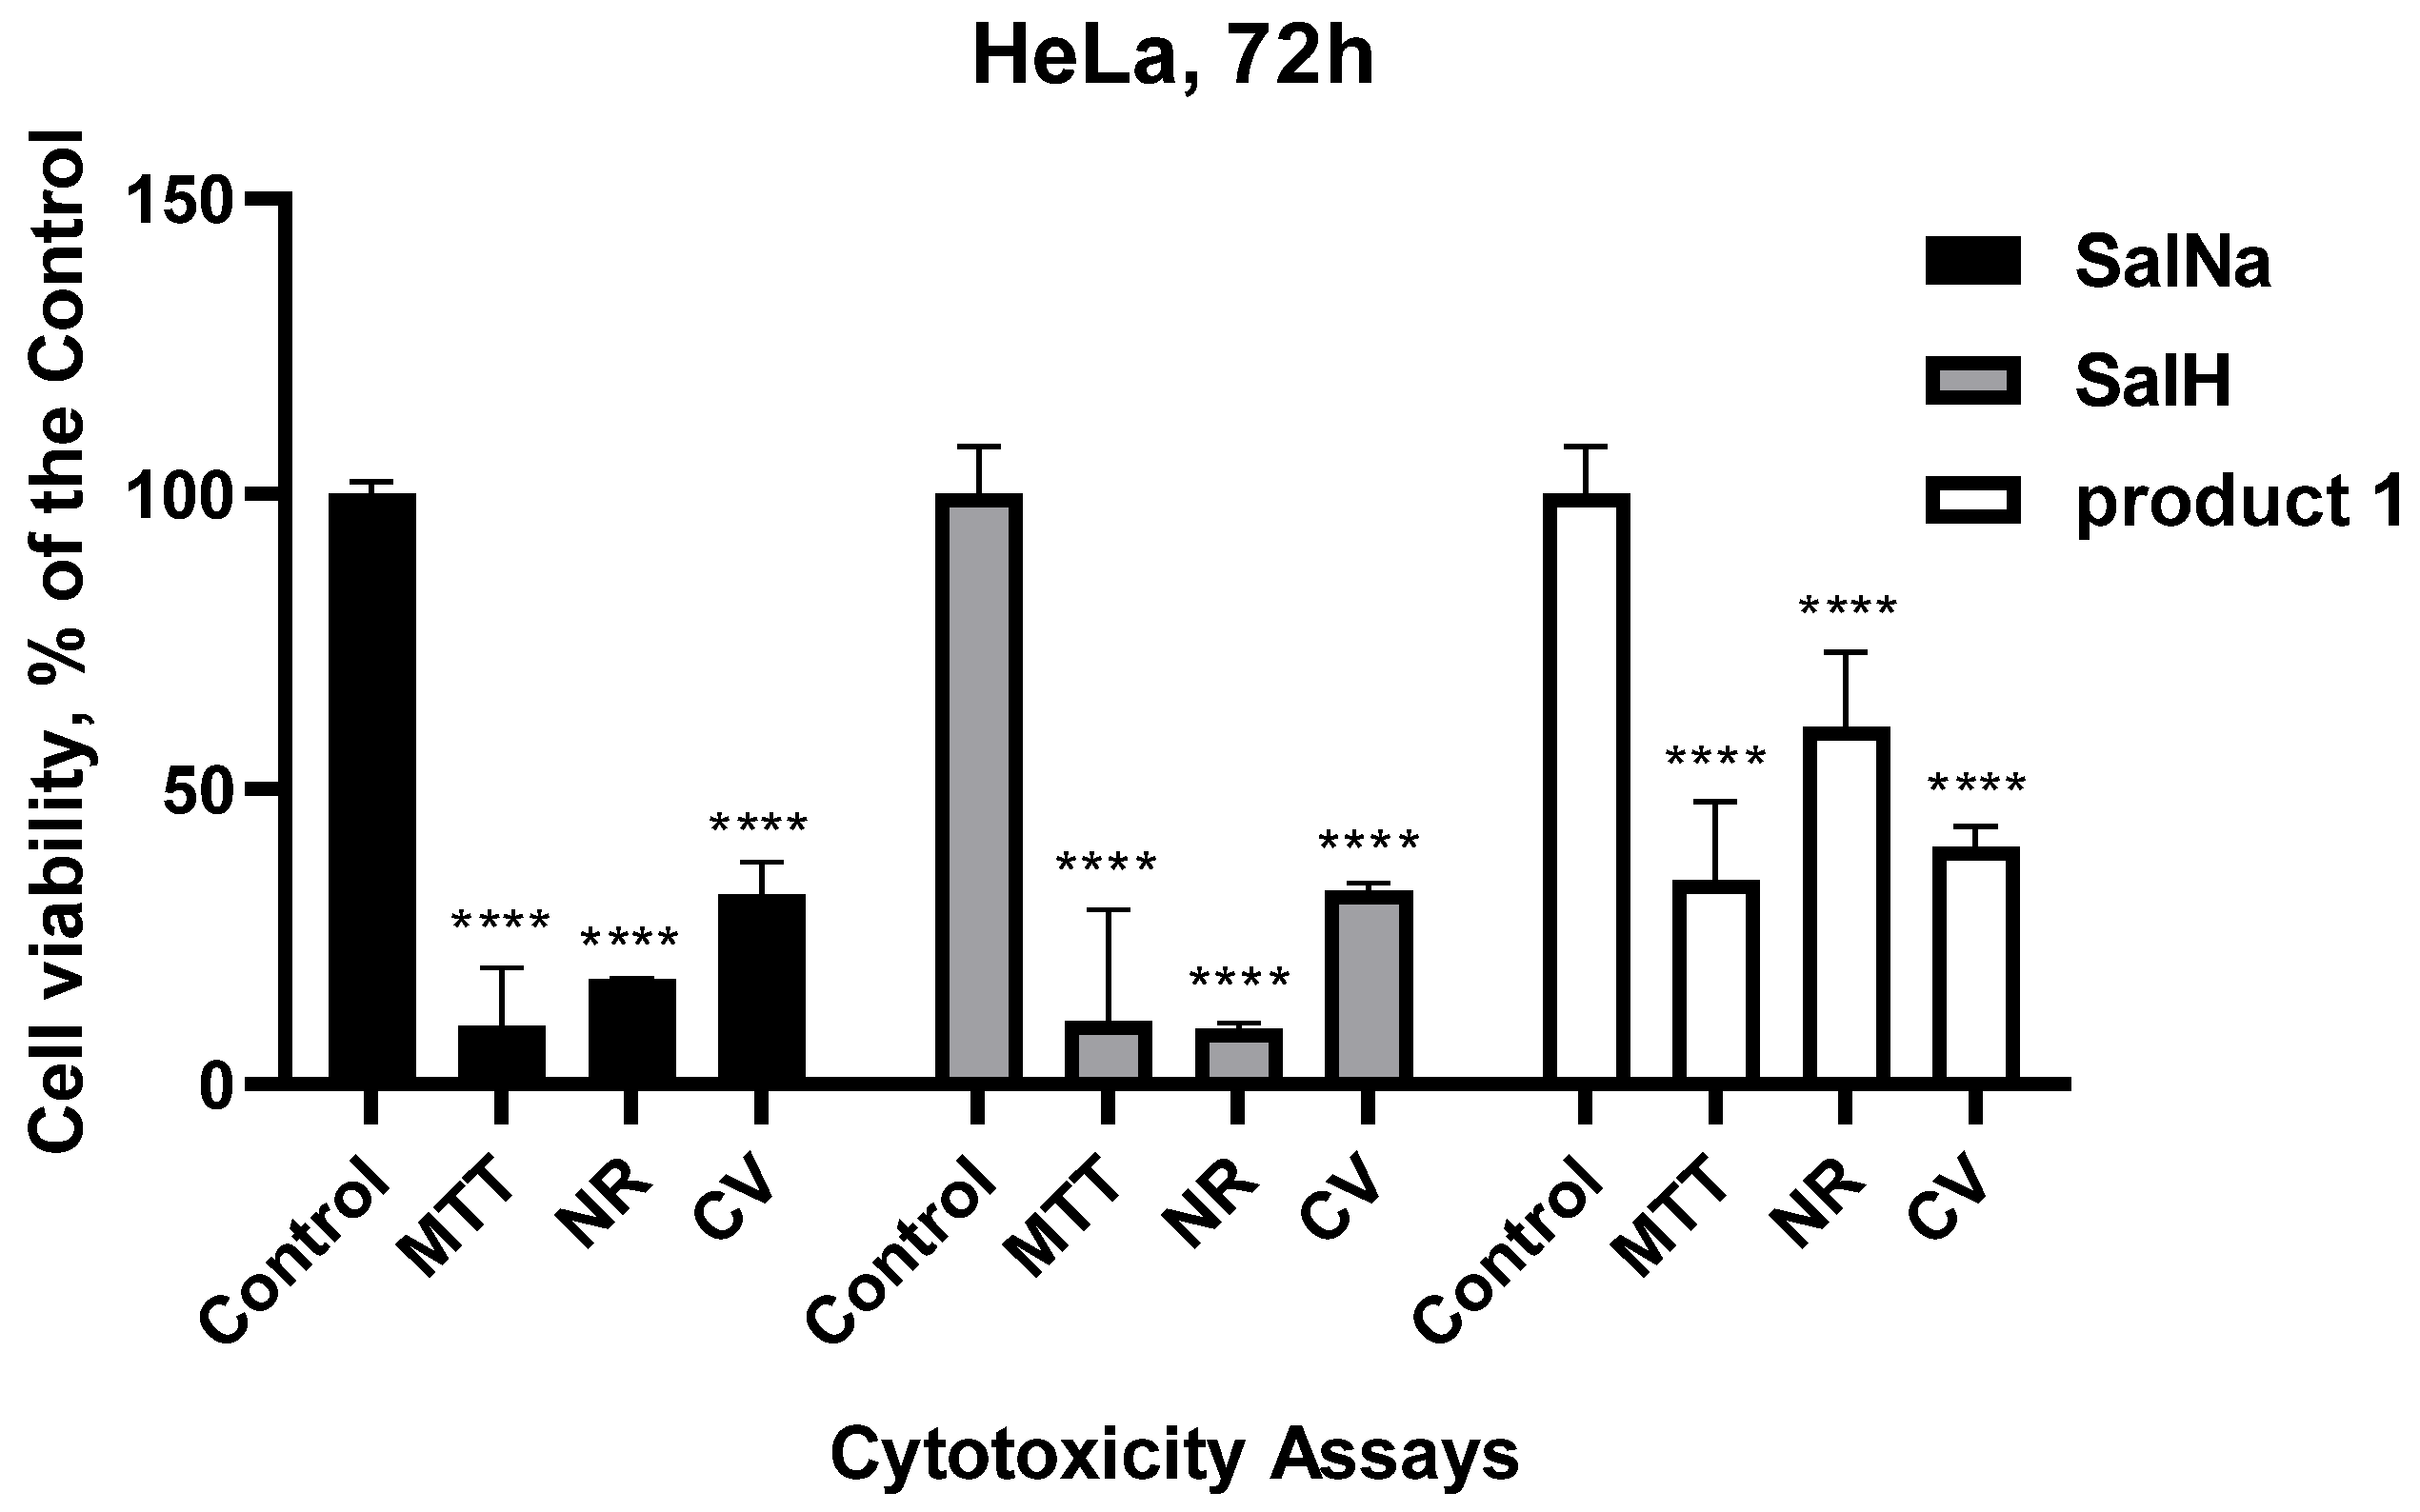
2.8. Biological Evaluation

The cytotoxic activity of product 1 was evaluated in A549, SW480, and CH1/PA1 cells by the MTT assay following the protocol described in [14]. The IC50 values are presented in Table 2 and concentration–effect curves in Figure S5. Product 1 exerted a slightly increased anticancer activity in CH1/PA-1 cells (IC50 = 0.27 µM) compared to SalH and SalNa (IC50 of 0.32 and 0.43 µM, respectively), whereas anticancer potency was lower in A549 and SW480 cells, yielding IC50 values of 0.43 and 3.5 µM, respectively. It should be pointed out that the cytotoxic activity of product 1 in A549 cells was about 15 times higher compared to that of satraplatin [54] and cisplatin [54]. The effect of the product in A549 cells was 200 times more pronounced compared to the effect of carboplatin [55]. Product 1 exerted similar cytotoxic activity compared to cisplatin in SW480 cells [54]. Compared to carboplatin [55], the antiproliferative activity of the composite of salinomycin with two-line ferrihydrite in SW480 cells was 10 times higher.
The antitumor activity of SalH, salinomycin sodium, and product 1 was also tested against the human cervical cancer HeLa cell line by the MTT test, the neutral red uptake test and the CV (crystal violet) test. The investigated compounds were applied at a concentration of 10 µg/mL, which, due to their different molecular weight, equals 12.94 µM (for SalNa), 13.32 µM (for SalH) and 4.27 µM (for Product 1). The data are presented as mean ± standard error of the mean. Statistical differences between the control and treated groups were assessed using one-way analysis of variance (ANOVA) followed by the Dunnett post hoc test. The results are presented in Figure 7.
According to the data obtained by the NR assay (Figure 7), the effect of product 1 on cell viability was much lower compared to the effects of the same compound evaluated by MTT and CV staining methods. The results presented in Figure 7 for SalH, SalNa and product 1 were significantly different compared to the control (p < 0.0001). CV staining revealed higher cytotoxic activity of product 1 compared to salinomycinic acid and salinomycin sodium (Table 3).
The results proved that different methods must be applied for an evaluation of the cytotoxic activity of new chemical compounds or composites. While the MTT assay provides information about the effect of the tested compounds on cellular metabolic activity, CV staining assesses the cell viability by the total DNA content in the culture. The NR test is used to evaluate the tested compounds with regard to lysosomal functionality [56]. Most likely, product 1 affects the lysosomes of the tested tumor cells to a lesser extent compared to salinomycinic acid. We observed that the effects of product 1, SalH and SalNa on the cell viability were concentration- and time-dependent (see also Figure S6, Supplementary Materials). The effect of the compound on the morphology of HeLa cells was also studied. The results are presented in Figure 8.
Figure 8 revealed a full m monolayer of HeLa cells in (a); and reduced monolayer, chromatin condensation, swollen cells, and vacuolization, as well as apoptotic bodies, in (b–d). It was interesting to observe that product 1 induced an effect on the morphology of HeLa cells at a lower concentration (2.1 µM) compared to that of salinomycinic acid (6.6 µM) and salinomycin sodium (6.5 µM). Table 4 presents results for the effective inhibitory concentration of SalH, SalNa and product 1 on the 3D growth of the treated cells. Product 1 induced full inhibition of the 3D growth of the tumor cells at concentrations higher than 0.21 μM. Much higher concentrations of salinomycin and salinomycin sodium (>1.3 μg/mL) were needed to achieve such an effect.

3. Materials and Methods

3.1. Chemicals

Salinomycin sodium (C42H69O11Na; SalNa) was provided by Biovet Ltd. (Peshtera, Bulgaria), purity > 95%. Organic solvents (MeCN, MeOH, DMSO) and FeCl3·6H2O of analytical grade were purchased from Fisher Scientific (Loughborough, UK). The tetrazolium salt 3-(4,5-dimethylthiazol-2-yl)-2,5-diphenyl tetrazolium bromide (MTT) was bought from Sigma-Aldrich (Vienna, Austria). Dulbecco’s modified Eagle’s medium (DMEM) and fetal bovine serum were obtained from Gibco-Invitrogen UK (Paisley, Scotland). Dimethyl sulfoxide (DMSO) and trypsin were purchased from AppliChem (Darmstadt, Germany). Purified agar, thiazolyl blue tetrazolium bromide (MTT), and 3-amino-7-dimethylamino-2-methylphenazine hydrochloride (Neutral red) and Crystal Violet were purchased from Sigma-Aldrich Chemie GmbH (Taufkirchen, Germany). The antibiotic (penicillin and streptomycin) cell cultures were from Lonza (Verviers, Belgium). Ethylenediaminetetraacetic acid (EDTA) and all other chemicals of the highest purity commercially available were purchased from local agents and distributors. All sterile plastic ware was from Orange Scientific (Braine-l’Alleud, Belgium). Ultrapure water (18.2 MΩ cm, ELGA Water purification system, Purelab Ultra MK 2, (Lane End, UK) or 18.2 MΩ cm, Milli-Q Advantage Darmstadt, Germany) and HNO3 (≥69%, Rotipuran Supra, Carl Roth, Karlsruhe, Germany) were used for all dilutions for ICP-MS measurements. The standard solution was purchased from Labkings (Hilversum, The Netherlands).

3.2. Synthesis

The interaction of salinomycin sodium and Fe(III) chloride was studied at different experimental conditions, as described below.
Procedure 1—Fe(III) chloride hexahydrate (0.3 mmol) was dissolved in water (2 mL). The solution (C = 0.15 M, pH = 1.65) was added in drops to 12 mL solution of salinomycin sodium (0.3 mmol in CH3CN:CH3OH = 1:5). The reaction mixture was stirred at room temperature for 30 min. The pH of the mixture after 30 min of stirring was pH = 1.77. The solvents were evaporated at room temperature for seven days and the precipitate (product 1) was isolated by filtration. During the filtration procedure, it was observed that the filtrate had a dark-orange color. The precipitate was washed with water and dried over P2O5. Yield: 135 mg, 58%.
Procedure 2—A mixture of salinomycin sodium solution (0.5 mmol in CH3OH) and methanolic 0.5 mmol Fe(III) chloride hexahydrate solution was stirred for 30 min at room temperature. The solvent was evaporated and the precipitate was filtered and washed thoroughly with water. The isolated product (product 2) was dried in a desiccator over P2O5 for seven days. Similar to procedure 1, the color of the filtrate was dark orange. Yield: 344 mg, 86%.
Procedure 3—Salinomycin sodium (0.9 mmoL) was dissolved in CH3CN:CH3OH = 1:5 (total volume of the mixture—12 mL). Aqueous solution of Fe(III) chloride (0.3 mmol, C = 0.15 M, pH = 1.65) was added to the solution of the ligand. The reactants were mixed for 30 min at room temperature. The formation of a yellow suspension was observed. The solutions were evaporated for seven days at room temperature and the dark-orange residue was filtered and washed with water. The filtrate remained colorless during the filtration procedure. The precipitate was dried over P2O5 for three days. Yield: 557.3 mg, 77%.
Procedure 4Product 4 was synthesized according the procedure for product 3. However, only methanol was used as a solvent of the ligand and the metal salt. Yield: 623, 2 mg, 86%.

3.3. Elemental Analysis

Elemental analysis was performed at Mikroanalytisches Laboratorium using an EA 3000 CHNS-O analyzer (EuroVector Srl, Pavia, Italy). The instrument uses flash combustion at a reaction temperature of 1000 °C. It has been verified that products 1–4 were completely digested.
A high-temperature pyrolysis oven HT 1500 (Fa. Hekatech) was combined with this instrument for the determination of oxygen. Using 1480 °C for the material reduction, with carbon as the reducing agent, can free all the oxygen, even from metal compounds.
The measurement of the weight of the samples was carried out using an ultra-micro balance from Sartorius (Göttingen, Germany), SE 2 (2000 mg range, ±0.0001 mg) with 0.0001 mg (100 ng) accuracy. Tara values of sample vials were compensated. The net weight of the standard or sample was registered prior to and after folding or sealing the vial. The two readings needed at least to comply to ±1 μg.
Duplicate analysis was carried out to ensure the relevance of the analytical results.
The calibration was performed with Sulphanilamide and BBOT standards to cover all measured elements. All reference material was purchased from German retailers and came with certificates proving the elemental composition in relation to NIST certificates.
The limits of quantification (LOQ) have been verified to be 0.05 ± 0.02 w-% for oxygen and 0.05 ± 0.01 w-% for C and H.
The established standard methods were expected to give results that fulfill the established standards for the verification of the expected composition [45].
The Fe content in all products was determined by inductively coupled mass spectrometry (ICP-MS). A total of 5 to 10 mg of products 14 were weighted in PFA-tubes and 5 mL of concentrated HNO3 (≥69%) was added to each sample. The suspensions were then placed on a hot plate and heated up for 10 h using a temperature program with a maximum temperature of 200 °C. After cooling down, the clear solutions were transferred directly into 15 mL tubes, with the remaining liquid being removed from the PFA tubes by washing twice with ultrapure water. Consequently, all probes were diluted stepwise with Milli Q water, to finally result in an end volume of about 10 mL and a final concentration of HNO3 of 3% v/v prior to ICP-MS measurement. By considering the total weight of the resulting sample solution, the dilution factor could be calculated. Iron quantification was performed using an Agilent 7800 ICP-MS (Agilent Technologies, Tokyo, Japan), equipped with an Agilent SPS 4 and an autosampler and a MassHunter® software package (Version C.01.04). Operating conditions included an RF power of 1550 W, a nickel cone, and gas flows of 1.08 L/min (carrier) and 15 L/min (plasma). Isotope 56Fe was monitored with an integration time of 0.1 s. Each sample underwent five replicates with 100 sweeps per replicate to ensure precision.

3.4. Attenuated Total Reflectance–Fourier-Transform Spectroscopy (ATR-FTIR)

ATR-FTIR spectroscopic analyses were recorded on an IRAffinity-1 spectrophotometer (Shimadzu Co., Kyoto, Japan).

3.5. Electron Paramagnetic Resonance Spectroscopy (EPR)

The EPR analysis was conducted on a Bruker BioSpin EMXplus10/12 instrument (Karlsruhe, Germany). All measurements were performed in the X-band at a frequency of electromagnetic radiation of 9.45 GHz.

3.6. Powder X-ray Diffraction (XRD)

The samples were subjected to powder X-ray diffraction analysis by PANalytical Empyrean X-ray diffractometer (Malvern Panalytical, Malvern, UK) with CuKα radiation (λ = 0.15418 nm), functioning at 40 kV, 30 mA.

3.7. Electrospray-Ionization Mass Spectrometry (ESI-MS)

A Waters Micromass ZQ2000 Single Quadrupole mass spectrometer (Waters, Milford, MA, USA), positive mode, in the range of 0–2000 m/z was used for ESI-MS analyses.

3.8. Thermogravimetric Analysis with Differential Thermal Analysis (DTA) and Mass Spectrometry

Thermogravimetric measurements (TG−DTA/MS) were conducted on a Setaram Labsys Evo 1600 (25–600 °C) (Caluire-et-Cuire, France), with a heating rate of 10 K/min in an argon atmosphere. An Omnistar GSD 301 O2 mass spectrometer, Pfeiffer Vacuum (Göttingen, Germany) was used to detect water and CO2.

3.9. Biological Activity Evaluation

We have selected product 1 for initial biological screening. The evaluation of the cytotoxic activity of product 1 was performed on A549 (non-small-cell lung cancer) and SW480 (colon carcinoma) cells, and CH1/PA-1 (ovarian teratocarcinoma) cells, according to the protocol described in [14]. CH1/PA-1 (ovarian teratocarcinoma) cells were supplied by Lloyd R. Kelland (CRC Center for Cancer Therapeutics, Institute of Cancer Research, Sutton, UK), whereas A549 (non-small-cell lung cancer) and SW480 (colon carcinoma) cells were kindly delivered by the Institute of Cancer Research, Department of Medicine I, Medical University of Vienna, Austria, and MCF-7 (mammary carcinoma) cells by the Department of Pharmaceutical Sciences, University of Vienna.
The cytotoxic/cytostatic effects of SalH, SalNa, and product 1 on the human cervical carcinoma cell line (HeLa) were also studied in short-term experiments (up to 72 h treatment periods, with monolayer cultures) using the thiazolyl blue tetrazolium bromide test (MTT test), neutral red uptake cytotoxicity assay (NR) and crystal violet staining (CV) as well as double staining with propidium iodide and acridine orange to visualize their ability to induce cytopathological changes. The 3D colony-forming method was performed to assess the long-term influence of the compounds tested on viability and 3D growth of the tumor cells.

Cytotoxicity Tests

  • Cell culture models
A549 (non-small-cell lung cancer); SW480 (colon carcinoma), and CH1/PA-1 (ovarian teratocarcinoma) cells were processed as described in [14].
Human uterine cervical carcinoma (HeLa) cells were cultivated as monolayer cultures by adding 5–10% fetal bovine serum, 100 U/mL penicillin, and 100 g/mL streptomycin to the DMEM medium. The cell cultures were kept in an incubator (maintaining the necessary humidity and CO2 in the atmosphere) at 37 °C (Thermo Scientific, Hepa class 100, Waltham, MA, USA). A total of 0.05% trypsin and 0.02% ethylenediaminetetraacetic acid were combined to remove adherent cells for routine passages.
  • MTT Assay
The HeLa cells were seeded in 96-well flat-bottomed microplates at a density of 1 × 10⁴ cells/well. The culture medium was removed and replaced with fresh media that had been modified with various concentrations (0.1, 0.5, 1, 5, 10, 25, 50, and 100 µM) of the compounds SalH, SalNa, and product 1 after the cells were grown for 24 h to a subconfluent state (60–70%). In wells 4–8, each concentration was added. As controls, cells that had been grown in an unaltered medium were used. The same procedures were applied for the neutral red uptake cytotoxicity assay (NR), and crystal violet staining (CV).
The antiproliferative activity of SalH, SalNa and product 1 on A549, SW480 and CH1/PA-1 cells was determined by the colorimetric MTT assay, according to the previously published protocol [14].
The procedure for an evaluation of the cytotoxic activity of the compounds on HeLa cells involved incubating the treated cells and controls for three hours at 37 °C with MTT solution (5 mg MTT in 10 mL DMEM) under 5% carbon dioxide and 95% air, followed by extracting the mixture with a solution of 100% ethanol and DMSO (1:1, vol/vol) to dissolve it [57].
  • NR test
The Borenfreund and Puerner method formed the basis for the NR assay [58]. A medium containing NR (1 mL 0.4% solution of neutral red in 80 mL medium) was added to each well that contained the matching cells. For three hours, the plate was placed in the CO2 incubator to allow the essential dye to absorb. After removing the medium containing NR, the cells were washed with phosphate-buffered saline (PBS, 7.2–7.4, 0.2 mL/well), and then the dye was extracted from the cells by adding 0.1 mL of a solution of containing 96% ethanol (50 parts), distilled H2O (49 parts) and acetic acid (1 part) (50:49:1, vol:vol:vol).
  • CV staining
The procedure for crystal violet staining followed the Sotome et al. instructions [59]. The probes (treated cells and controls) were incubated for 72 h at 37 °C in a CO2 incubator. Subsequently, the media was withdrawn, the cells were thoroughly washed with distilled water, and they were stained for 30 min with a 0.4% crystal violet solution in methanol.
A TECAN, SunriseTM, automatic microplate reader (Grödig, Austria) was used to detect optical density at λ = 540/620 nm (MTT and CV) and λ = 540 nm (NR). For each concentration, relative cell viability was computed as the percentage of the untreated control (100 percent viability). Concentration–response curves were developed, and from these curves, the effective cytotoxic concentration (CC50) of the compounds responsible for a 50% decrease in cell viability, was calculated. Each data point represents an average of three separate assays.
  • Double staining with acridine orange (AO) and propidium iodide (PI)
The cells were cultured for 24–72 h while the tested compound was present, after being seeded in 6-well plates at a density of 3–3.5 × 10⁵ cells/well. Non-treated cells served as controls. After the incubation period, the coverslips were taken off and washed in PBS, pH 7.2–7.4, for two minutes. A mixture of fluorescent dyes containing AO (10 g/mL in PBS) and PI (10 g/mL in bi-distilled water) was used to wet-stain the cells [60]. To prevent the fluorescence signal from being diminished, the cells were examined under a fluorescent microscope (LeikaDM 500B, Wetzlar, Germany) no later than 30 min after staining.
  • Three-dimensional colony-forming assay
The 3D colony-forming method was used to determine whether the compounds under investigation could prevent the treated human cervical carcinoma HeLa cells from producing 3D colonies in semi-solid media [61]. In 24-well microplates, tumor cells (around 103 cells/well) were layered and suspended in 0.45% pure agar in 2X DMEM medium containing various doses of the compounds under investigation (range from 1 to 100 g/mL). The cell growth was monitored for 16 days using an inverted microscope (Carl Zeiss, Jena, Germany).
The effective inhibitory concentration (µM) of each compound that completely prevented 3D cancer-cell colony formation in the semisolid medium was determined.

3.10. Statistical Analysis

Experimental data were processed by the method of analysis of variance, calculating the two main statistical parameters: the arithmetic mean (x) and its error (SEM). Further, a one-way analysis of variance (ANOVA) was applied. Individual groups were compared using the Dunnet test, with the difference between groups considered significant at the p < 0.05 level of significance accepted for biological experiments. In the statistical processing of the experimental data, the computer program GraphPad Prizm, Version 8.0.2 (263) was used.

4. Conclusions

In this study we demonstrated, for the first time, that the interaction of salinomycin sodium and Fe(III) chloride at different experimental conditions resulted in the formation of composites of salinomycinic acid and two-line ferrihydrite. The isolated composites were characterized by elemental analysis, ATR-FTIR, ESI-MS, TG-DTA, TG-MS, and EPR. One of the isolated composites was screened for antitumor activity. The composite exerted pronounced cytotoxic activity against four human tumor cell lines: A549; SW480; CH1/PA-1; and HeLa. The results demonstrate that the composites of salinomycinic acid with 2-line ferrihydrite are suitable for further studies to estimate their potential as an antitumor agents and theranostic probes for magnetic resonance imaging (MRI).

Supplementary Materials

The following supporting information can be downloaded at: https://www.mdpi.com/article/10.3390/inorganics12080206/s1, Scheme S1: Chemical equation of the reaction of Fe(III) chloride with salinomycin sodium; Figure S1: ATR-FTIR spectra of SalH, product 3 aand product 4 (carboxylate region); Figure S2: TG curve (black) and DTA curve (blue) of SalNa (a), SalH (b), product 1 (c), product 2 (d), product 3 (e), and product 4 (f); Figure S3: TG-MS curve of a SalNa (a), SalH (b), product 1 (c), product 2 (d), product 3 (e), product 4 (f). H2O—blue (right y axis); CO2—red (left y axis); Figure S4: ESI-MS spectra of SalNa (a), SalH (b), product 1 (c), product 2 (d), product 3 (e), product 4 (f); Figure S5. Cytotoxicity of SalH, SalNa and product 1 in A549, CH1/PA-1 and SW480 cells, MTT test. Figure S6: Concentration–effect curves of SalNa (a), SalH (b) and product 1 (c) on cell viability of HeLa cells, MTT test.

Author Contributions

Conceptualization, J.I.; formal analysis, J.I., R.K., T.Z., A.A., L.D., R.A., I.P.-M., J.T., M.H., M.A.J. and I.G.; investigation, J.I., R.K., T.Z., A.A., L.D., R.A., I.P.-M., J.T., M.H. and M.A.J.; methodology, J.I., R.K., T.Z., A.A., L.D., R.A., J.T., M.H. and M.A.J.; resources, P.D., B.K. and I.G.; project administration, I.G.; funding acquisition, I.G.; validation, J.I., R.K., T.Z., A.A., L.D., R.A., J.T., M.H. and M.A.J.; visualization, J.I., R.K., T.Z., A.A., L.D., R.A., M.H. and M.A.J.; writing—original draft preparation, J.I., R.K., T.Z., A.A., L.D., R.A. and J.T.; writing—review and editing, J.I., R.K., R.S., T.Z., A.A., L.D., R.A., I.P.-M., J.T., M.A.J., B.K. and I.G. All authors have read and agreed to the published version of the manuscript.

Funding

This research was funded by the European Union Next Generation EU, through the National Recovery and Resilience Plan of the Republic of Bulgaria, project № BG-RRP-2.004-0008-C01. I.P.-M. is grateful to the Austrian Science Fund (FWF, T 1145-B) for covering her personneal costs.

Data Availability Statement

Data are contained within the article or in the Supplementary Materials.

Acknowledgments

J.I. thanks Nikolay Petkov, Faculty of Chemistry and Pharmacy, Sofia University “St. Kliment Ohridski” for assistance with the powder X-ray diffraction analyses. J.T. is grateful to Vladimir Gelev and Nikol Georgieva, Faculty of Chemistry and Pharmacy, Sofia University “St. Kliment Ohridski” for the ESI-MS measurements. The authors thank Mary McAllister for her efforts in reading and editing the manuscript. All authors are grateful also to Christoph Baumgartinger from the Koellensperger Lab, Department of Analytical Chemistry, Faculty of Chemistry, University of Vienna, for the ICP-MS measurements.

Conflicts of Interest

The author Peter Dorkov was employed by BIOVET JSC. The remaining authors declare that the research was conducted in the absence of any commercial or financial relationships that could be construed as a potential conflict of interest. BIOVET JSC provided the material salinomycin sodium (SalNa) for this research. However, the company was not involved in the study design, collection, analysis, interpretation of data, the writing of this article, or the decision to submit it for publication.

References

  1. Huczyński, A.; Janczak, J.; Antoszczak, M.; Wietrzyk, J.; Maj, E.; Brzezinski, B. Antiproliferative activity of salinomycin and its derivatives. Bioorganic Med. Chem. Lett. 2012, 22, 7146–7150. [Google Scholar] [CrossRef]
  2. Antoszczak, M.; Huczyński, A. Salinomycin and its derivatives—A new class of multiple-targeted “magic bullets”. Eur. J. Med. Chem. 2019, 176, 208–227. [Google Scholar] [CrossRef]
  3. Mai, T.T.; Hamaï, A.; Hienzsch, A.; Cañeque, T.; Müller, S.; Wicinski, J.; Cabaud, O.; Leroy, C.; David, A.; Acevedo, V.; et al. Salinomycin kills cancer stem cells by sequestering iron in lysosomes. Nat. Chem. 2017, 9, 1025–1033. [Google Scholar] [CrossRef]
  4. Dewangan, J.; Srivastava, S.; Rath, S.K. Salinomycin: A new paradigm in cancer therapy. Tumor Biol. 2017, 39, 1010428317695035. [Google Scholar] [CrossRef]
  5. Ebokaiwe, A.P.; Njoya, E.M.; Sheng, Y.; Zhang, Z.; Li, S.; Zhou, Z.; Qiang, Z.; Peng, T.; Hussein, A.A.; Zhang, G.; et al. Salinomycin promotes T-cell proliferation by inhibiting the expression and enzymatic activity of immunosuppressive indoleamine-2,3-dioxygenase in human breast cancer cells. Toxicol. Appl. Pharmacol. 2020, 404, 115203. [Google Scholar] [CrossRef]
  6. Yuan, C.; Huang, X.; Zhai, R.; Ma, Y.; Xu, A.; Zhang, P.; Yang, Q. In Vitro Antiviral Activities of Salinomycin on Porcine Epidemic Diarrhea Virus. Viruses 2021, 13, 580. [Google Scholar] [CrossRef]
  7. Jang, Y.; Shin, J.S.; Yoon, Y.-S.; Go, Y.Y.; Lee, H.W.; Kwon, O.S.; Park, S.; Park, M.-S.; Kim, M. Salinomycin Inhibits Influenza Virus Infection by Disrupting Endosomal Acidification and Viral Matrix Protein 2 Function. J. Virol. 2018, 92, e01441-18. [Google Scholar] [CrossRef]
  8. Qayed, W.S.; Ferreira, R.S.; Silva, J.R.A. In Silico Study towards Repositioning of FDA-Approved Drug Candidates for Anticoronaviral Therapy: Molecular Docking, Molecular Dynamics and Binding Free Energy Calculations. Molecules 2022, 27, 5988. [Google Scholar] [CrossRef]
  9. Gurukkalot, K.; Rajendran, V. Repurposing Polyether Ionophores as a New-Class of Anti-SARS-CoV-2 Agents as Adjunct Therapy. Curr. Microbiol. 2023, 80, 273. [Google Scholar] [CrossRef]
  10. Wang, Z.; Xiong, Y.; Yu, S.; Li, H.; Fan, J.; Li, F.; Su, Z.; Song, J.; Sun, Q.; Liu, S.; et al. Salinomycin exerts anti-colorectal cancer activity by targeting the β-catenin/T-cell factor complex. Br. J. Pharmacol. 2019, 176, 3390–3406. [Google Scholar] [CrossRef]
  11. Klose, J.; Trefz, S.; Wagner, T.; Steffen, L.; Charrier, A.P.; Radhakrishnan, P.; Volz, C.; Schmidt, T.; Ulrich, A.; Dieter, S.M.; et al. Salinomycin: Anti-tumor activity in a pre-clinical colorectal cancer model. PLoS ONE 2019, 14, e0211916. [Google Scholar] [CrossRef] [PubMed]
  12. Wang, J.; Zhuo, J.; Tao, Y.; Xu, S.; Chen, Z.; Yang, F.; Ke, Q.; Xie, H.; Zheng, S.; Wang, H.; et al. Salinomycin-Loaded Small-Molecule Nanoprodrugs Enhance Anticancer Activity in Hepatocellular Carcinoma. Int. J. Nanomed. 2020, 15, 6839–6854. [Google Scholar] [CrossRef] [PubMed]
  13. Naujokat, C.; Steinhart, R. Salinomycin as a Drug for Targeting Human Cancer Stem Cells. J. Biomed. Biotechnol. 2012, 2012, 950658. [Google Scholar] [CrossRef] [PubMed]
  14. Pashkunova-Martic, I.; Kukeva, R.; Stoyanova, R.; Pantcheva, I.; Dorkov, P.; Friske, J.; Hejl, M.; Jakupec, M.; Hohagen, M.; Legin, A.; et al. Novel Salinomycin-Based Paramagnetic Complexes—First Evaluation of Their Potential Theranostic Properties. Pharmaceutics 2022, 14, 2319. [Google Scholar] [CrossRef] [PubMed]
  15. Momekova, D.; Momekov, G.; Ivanova, J.; Pantcheva, I.; Drakalska, E.; Stoyanov, N.; Guenova, M.; Michova, A.; Balashev, K.; Arpadjan, S.; et al. Sterically stabilized liposomes as a platform for salinomycin metal coordination compounds: Physicochemical characterization and in vitro evaluation. J. Drug Deliv. Sci. Technol. 2013, 23, 215–223. [Google Scholar] [CrossRef]
  16. Ivanova, J.; Pantcheva, I.N.; Zhorova, R.; Momekov, G.; Simova, S.; Stoyanova, R.; Zhecheva, E.; Ivanova, S.; Mitewa, M. Synthesis, spectral properties, antibacterial and antitumor activity of salinomycin complexes with Co(II), Ni(II), Cu(II) and Zn(II) transition metal ions. J. Chem Chem Eng. 2012, 6, 551–562. [Google Scholar]
  17. Vaidya, S.P.; Gadre, S.; Kamisetti, R.T.; Patra, M. Challenges and opportunities in the development of metal-based anticancer theranostic agents. Biosci. Rep. 2022, 42, BSR20212160. [Google Scholar] [CrossRef] [PubMed]
  18. Snyder, E.M.; Asik, D.; Abozeid, S.M.; Burgio, A.; Bateman, G.; Turowski, S.G.; Spernyak, J.A.; Morrow, J.R. A Class of FeIII Macrocyclic Complexes with Alcohol Donor Groups as Effective T1 MRI Contrast Agents. Angew. Chem. Int. Ed. 2020, 59, 2414–2419. [Google Scholar] [CrossRef]
  19. Palagi, L.; Di Gregorio, E.; Costanzo, D.; Stefania, R.; Cavallotti, C.; Capozza, M.; Aime, S.; Gianolio, E. Fe(deferasirox)2: An Iron(III)-Based Magnetic Resonance Imaging T1 Contrast Agent Endowed with Remarkable Molecular and Functional Characteristics. J. Am. Chem. Soc. 2021, 143, 14178–14188. [Google Scholar] [CrossRef]
  20. Baranyai, Z.; Carniato, F.; Nucera, A.; Horváth, D.; Tei, L.; Platas-Iglesias, C.; Botta, M. Defining the conditions for the development of the emerging class of FeIII-based MRI contrast agents. Chem. Sci. 2021, 12, 11138–11145. [Google Scholar] [CrossRef]
  21. Asik, D.; Abozeid, S.M.; Turowski, S.G.; Spernyak, J.A.; Morrow, J.R. Dinuclear Fe(III) Hydroxypropyl-Appended Macrocyclic Complexes as MRI Probes. Inorg. Chem. 2021, 60, 8651–8664. [Google Scholar] [CrossRef] [PubMed]
  22. Chen, S.; An, L.; Yang, S. Low-Molecular-Weight Fe(III) Complexes for MRI Contrast Agents. Molecules 2022, 27, 4573. [Google Scholar] [CrossRef] [PubMed]
  23. Kras, E.A.; Snyder, E.M.; Sokolow, G.E.; Morrow, J.R. Distinct Coordination Chemistry of Fe(III)-Based MRI Probes. Accounts Chem. Res. 2022, 55, 1435–1444. [Google Scholar] [CrossRef] [PubMed]
  24. Sahiner, N.; Umut, E.; Suner, S.S.; Sahiner, M.; Culha, M.; Ayyala, R.S. Hyaluronic acid (HA)-Gd(III) and HA-Fe(III) microgels as MRI contrast enhancing agents. Carbohydr. Polym. 2022, 277, 118873. [Google Scholar] [CrossRef] [PubMed]
  25. Botta, M.; Geraldes, C.F.; Tei, L. High spin Fe(III)-doped nanostructures as T1 MR imaging probes. Wiley Interdiscip. Rev. Nanomed. Nanobiotechnol. 2023, 15, e1858. [Google Scholar] [CrossRef] [PubMed]
  26. Wang, H.; Wong, A.; Lewis, L.C.; Nemeth, G.R.; Jordan, V.C.; Bacon, J.W.; Caravan, P.; Shafaat, H.S.; Gale, E.M. Rational Ligand Design Enables pH Control over Aqueous Iron Magnetostructural Dynamics and Relaxometric Properties. Inorg. Chem. 2020, 59, 17712–17721. [Google Scholar] [CrossRef] [PubMed]
  27. Ivanova, J.; Pantcheva, I.N.; Mitewa, M.; Simova, S.; Tanabe, M.; Osakada, K. Cd(II) and Pb(II) complexes of the polyether ionophorous antibiotic salinomycin. Chem. Central J. 2011, 5, 52. [Google Scholar] [CrossRef] [PubMed]
  28. Pantcheva, I.; Petkov, N.; Simova, S.; Zhorova, R.; Dorkov, P. Alkaline-earth metal(II) complexes of salinomycin—Spectral properties and antibacterial activity. Phys. Sci. Rev. 2022, 8, 3799–3811. [Google Scholar] [CrossRef]
  29. Sorokin, A.B. Recent progress on exploring µ-oxo bridged binuclear porphyrinoid complexes in catalysis and material science. Coord. Chem. Rev. 2019, 389, 141–160. [Google Scholar] [CrossRef]
  30. Wang, H.-L.; Cui, J.-Y.; Jiang, W.-F. Synthesis, characterization and flocculation activity of novel Fe(OH)3–polyacrylamide hybrid polymer. Mater. Chem. Phys. 2011, 130, 993–999. [Google Scholar] [CrossRef]
  31. Muralidhara, R.; Kesavulu, C.; Rao, J.; Anavekar, R.; Chakradhar, R. EPR and optical absorption studies of Fe3+ ions in sodium borophosphate glasses. J. Phys. Chem. Solids 2010, 71, 1651–1655. [Google Scholar] [CrossRef]
  32. Vercamer, V.; Lelong, G.; Hijiya, H.; Kondo, Y.; Galoisy, L.; Calas, G. Diluted Fe3+ in silicate glasses: Structural effects of Fe-redox state and matrix composition. An optical absorption and X-band/Q-band EPR study. J. Non-Crystalline Solids 2015, 428, 138–145. [Google Scholar] [CrossRef]
  33. Ardelean, I.; Peteanu, M.; Simon, V.; Ciorcas, F.; Ioncu, V. Structural investigation of Fe2O3-TeO2-B2O3-SrO glasses by EPR. J. Mater. Sci. Lett. 2001, 20, 947–949. [Google Scholar] [CrossRef]
  34. Castner, T.; Newell, G.S.; Holton, W.C.; Slichter, C.P. Note on the Paramagnetic Resonance of Iron in Glass. J. Chem. Phys. 1960, 32, 668–673. [Google Scholar] [CrossRef]
  35. Dzieniszewska, A.; Kyziol-Komosinska, J.; Pająk, M. Adsorption and bonding strength of chromium species by ferrihydrite from acidic aqueous solutions. PeerJ 2020, 8, e9324. [Google Scholar] [CrossRef] [PubMed]
  36. Pouran, H.M.; Banwart, S.A.; Romero-Gonzalez, M. Coating a polystyrene well-plate surface with synthetic hematite, goethite and aluminium hydroxide for cell mineral adhesion studies in a controlled environment. Appl. Geochem. 2014, 42, 60–68. [Google Scholar] [CrossRef]
  37. Perton, F.; Cotin, G.; Kiefer, C.; Strub, J.-M.; Cianferani, S.; Greneche, J.-M.; Parizel, N.; Heinrich, B.; Pichon, B.; Mertz, D.; et al. Iron Stearate Structures: An Original Tool for Nanoparticles Design. Inorg. Chem. 2021, 60, 12445–12456. [Google Scholar] [CrossRef] [PubMed]
  38. Hellman, H.; Laitinen, R.S.; Kaila, L.; Jalonen, J.; Hietapelto, V.; Jokela, J.; Sarpola, A.; Rämö, J. Identification of hydrolysis products of FeCl3·6H2O by ESI-MS. J. Mass Spectrom. 2006, 41, 1421–1429. [Google Scholar] [CrossRef] [PubMed]
  39. Hosny, W.M. Formation of Fe(III) Ternary Complexes with Related Bio-relevant Ligands. In Descriptive Inorganic Chemistry Researches of Metal Compounds; IntechOpen: Rijeka, Croatia, 2017. [Google Scholar] [CrossRef]
  40. Nurwahdah, N.; Rodiansono, R.; Kamari, A.; Abdullah, R.; Sunardi, S. The effects of FeCl3 concentration on hydrothermal pretreatment of oil palm fronds to enhance reducing sugar production. IOP Conf. Series Earth Environ. Sci. 2020, 591, 012024. [Google Scholar] [CrossRef]
  41. Jolivet, J.P.; Chanéac, C.; Tronc, E. Iron oxide chemistry. From molecular clusters to extended solid networks. Chem Communi-cations 2004, 5, 481–487. [Google Scholar]
  42. Zhu, M.; Frandsen, C.; Wallace, A.F.; Legg, B.; Khalid, S.; Zhang, H.; Mørup, S.; Banfield, J.F.; Waychunas, G.A. Precipitation pathways for ferrihydrite formation in acidic solutions. Geochim. Cosmochim. Acta 2016, 172, 247–264. [Google Scholar] [CrossRef]
  43. Gimsing, A.L.; Borggaard, O.K. Phosphate and glyphosate adsorption by hematite and ferrihydrite and comparison with other variable-charge minerals. Clays Clay Miner. 2007, 55, 108–114. [Google Scholar] [CrossRef]
  44. Hiemstra, T.; Van Riemsdijk, W.H. A surface structural model for ferrihydrite I: Sites related to primary charge, molar mass, and mass density. Geochim. Cosmochim. Acta 2009, 73, 4423–4436. [Google Scholar] [CrossRef]
  45. Kandioller, W.; Theiner, J.; Keppler, B.K.; Kowol, C.R. Elemental analysis: An important purity control but prone to manipulations. Inorg. Chem. Front. 2021, 9, 412–416. [Google Scholar] [CrossRef]
  46. Michel, F.M.; Ehm, L.; Antao, S.M.; Lee, P.L.; Chupas, P.J.; Liu, G.; Strongin, D.R.; Schoonen, M.A.A.; Phillips, B.L.; Parise, J.B. The Structure of Ferrihydrite, a Nanocrystalline Material. Science 2007, 316, 1726–1729. [Google Scholar] [CrossRef] [PubMed]
  47. Hiemstra, T. Surface and mineral structure of ferrihydrite. Geochim. Cosmochim. Acta 2012, 105, 316–325. [Google Scholar] [CrossRef]
  48. Ma, B.; Fernandez-Martinez, A.; Mancini, A.; Lothenbach, B. Spectroscopic investigations on structural incorporation pathways of FeIII into zeolite frameworks in cement-relevant environments. Cem. Concr. Res. 2020, 140, 106304. [Google Scholar] [CrossRef]
  49. Koksharov, Y.A.; Pankratov, D.A.; Gubin, S.P.; Kosobudsky, I.D.; Beltran, M.; Khodorkovsky, Y.; Tishin, A.M. Electron paramagnetic resonance of ferrite nanoparticles. J. Appl. Phys. 2001, 89, 2293–2298. [Google Scholar] [CrossRef]
  50. Jahagirdar, A.; Dhananjaya, N.; Monika, D.; Kesavulu, C.; Nagabhushana, H.; Sharma, S.; Nagabhushana, B.; Shivakumara, C.; Rao, J.; Chakradhar, R. Structural, EPR, optical and magnetic properties of α-Fe2O3 nanoparticles. Spectrochim. Acta Part A Mol. Biomol. Spectrosc. 2012, 104, 512–518. [Google Scholar] [CrossRef]
  51. Naik, R.; Prashantha, S.; Nagabhushana, H.; Girish, K. Electrochemical, photoluminescence and EPR studies of Fe3+ doped nano Forsterite: Effect of doping on tetra and octahedral sites. J. Lumin. 2018, 197, 233–241. [Google Scholar] [CrossRef]
  52. Vallina, B.; Rodriguez-Blanco, J.D.; Brown, A.P.; Benning, L.G.; Blanco, J.A. Enhanced magnetic coercivity of α-Fe2O3 obtained from carbonated 2-line ferrihydrite. J. Nanoparticle Res. 2014, 16, 2322. [Google Scholar] [CrossRef]
  53. Boily, J.-F.; Song, X. Direct identification of reaction sites on ferrihydrite. Commun. Chem. 2020, 3, 79. [Google Scholar] [CrossRef]
  54. Varbanov, H.P.; Göschl, S.; Heffeter, P.; Theiner, S.; Roller, A.; Jensen, F.; Jakupec, M.A.; Berger, W.; Galanski, M.S.; Keppler, B.K. ANovel Class of Bis- and Tris-Chelate Diam(m)inebis(dicarboxylato)platinum(IV) Complexes as Potential Anticancer Prodrugs. J. Med. Chem. 2014, 57, 6751–6764. [Google Scholar] [CrossRef] [PubMed]
  55. Varbanov, H.P.; Valiahdi, S.M.; Kowol, C.R.; Jakupec, M.A.; Galanski, M.S.; Keppler, B.K. Novel tetracarboxylatoplati-num(iv)complexes as carboplatin prodrugs. Dalton Trans. 2012, 41, 14404–14415. [Google Scholar] [CrossRef] [PubMed]
  56. Śliwka, L.; Wiktorska, K.; Suchocki, P.; Milczarek, M.; Mielczarek, S.; Lubelska, K.; Cierpiał, T.; Łyżwa, P.; Kiełbasiński, P.; Jaromin, A.; et al. The Comparison of MTT and CVS Assays for the Assessment of Anticancer Agent Interactions. PLoS ONE 2016, 11, e0155772. [Google Scholar] [CrossRef] [PubMed]
  57. Mosmann, T. Rapid colorimetric assay for cellular growth and survival: Application to proliferation and cytotoxicity assays. J. Immunol. Methods 1983, 65, 55–63. [Google Scholar] [CrossRef] [PubMed]
  58. Borenfreund, E.; Puerner, J. Toxicity determination in vitro by morphological alterations and neural red absorption. Toxicol. Lett. 1985, 24, 119–124. [Google Scholar] [CrossRef] [PubMed]
  59. Saotome, K.; Morita, H.; Umeda, M. Cytotoxicity test with simplified crystal violet staining method using microtitre plates and its application to injection drugs. Toxicol. Vitr. 1989, 3, 317–321. [Google Scholar] [CrossRef]
  60. Abdel Wahab, S.I.; Abdul, A.B.; Alzubairi, A.S.; Mohamed Elhassan, M.; Mohan, S. In Vitro Ultramorphological Assessment of Apoptosis Induced by Zerumbone on (HeLa). J. Biomed. Biotechnol. 2009, 2009, 769568. [Google Scholar] [CrossRef]
  61. Abudalleh, A.M.; Alexandrov, M.; Alexandrova, R. Ammonium vanadate decreases viability and proliferation activity of cul-tured virus-transformed rat sarcoma cells. Compt. Rend Acad. Bulg. Sci. 2013, 66, 61–66. [Google Scholar]
Figure 1. Structure of salinomycinic acid. Hydrogen bond donor atoms (blue), hydrogen bond acceptor atoms (red).
Inorganics 12 00206 g001
Figure 2. ATR-FTIR spectra of salinomycin sodium and product 1.
Inorganics 12 00206 g002
Figure 3. ATR-FTIR spectra of product 1product 2 and SalH (a); ATR-FTIR spectra of product 1product 2 and SalH. Fingerprint region (b).
Inorganics 12 00206 g003
Figure 4. ATR-FTIR spectra of product 3, product 4, and SalH (a); ATR-FTIR spectra of product 3, product 4, and SalH. Fingerprint region (b).
Inorganics 12 00206 g004
Figure 5. EPR spectra of product 1 registered at 100 and 295 K (the broad signal with g~2.0 is marked with asterisks) (a); EPR spectra of product 2 at 100 and 295 K (the broad signal with g~2.0 is marked with asterisks) (b); EPR spectra of product 3 at 77, 100, and 295 K (c); EPR spectra of product 4 at 100 and 295 K (the narrow signal with g~2.007 is circled) (d). Star (*) denotes signal with g-factor close to 2.0 and a linewidth exceeding 100 mT.
Inorganics 12 00206 g005
Figure 6. Powder X-ray diffractograms of SalNa (a), SalH (b), product 1 (c), product 2 (d), product 3 (e) and product 4 (f). Star “*” denotes traces of NaCl.
Inorganics 12 00206 g006
Figure 7. Effects of SalNa for SalH and product 1 on cell viability determined by MTT test, neutral red uptake test and crystal violet staining. ****—p < 0.0001.
Inorganics 12 00206 g007
Figure 8. Cytopathological changes in HeLa cells—control (a); HeLa cells, treated with 6.6 µM (5 μg/mL) SalH (b); 6.5 µM (5 μg/mL) SalNa (c); 2.1 µM (5 μg/mL) product 1 (d). Double staining with Acridine orange and Propidium Iodide (AO/PI) was seen under a fluorescent microscope 72 h after treatment. Bar 50 µm.
Inorganics 12 00206 g008
Table 1. Experimental and theoretical values for C, H, O, and Fe in the isolated compounds, %.
Cexp., %Ctheor., %Hexp., %Htheor., %Oexp., %Otheor., % Feexp., %Fe theor., %
product 1,
[(FeOOH)(C42H70O11)3],
MW = 2341.88 g/mol
64.65 ± 0.7964.629.28 ± 0.099.0824.67 ± 0.5223.910.39 ± 0.012.38
product 2,
[(FeOOH)(C42H70O11)3]·4H2O,
MW = 2413.944 g/mol
60.95 ± 0.1362.698.76 ± 0.039.1425.20 ± 0.9525.852.42 ± 0.062.32
product 3,
[(FeOOH)(C42H70O11)3]·4H2O,
MW = 2413.944 g/mol
62.58 ± 0.1862.699.09 ± 0.099.1427.55 ± 2.7125.852.17 ± 0.042.32
product 4,
[(FeOOH)(C42H70O11)3]·4H2O,
MW = 2413.944 g/mol
61.89 ± 0.0962.698.98 ± 0.039.1425.85 ± 0.8925.852.03 ± 0.272.32
Table 2. Fifty-percent inhibitory concentrations (IC50) of SalH, SalNa, and product 1: mean IC50 values (in µM) ± standard deviations from at least three independent MTT assays in each of the three human cancer cell lines. Exposition time—96 h.
Cell Line
CompoundA549SW480CH1/PA-1
SalH0.23 ± 0.061.1 ± 0.60.32 ± 0.12
SalNa0.27 ± 0.020.88 ± 0.440.43 ± 0.11
Product 10.43 ± 0.083.5 ± 0.10.27 ± 0.05
Table 3. Fifty-percent inhibitory concentrations (IC50) of SalH, SalNa, and product 1. (IC50, μM) of SalH, SalNa, and product 1 in HeLa cells. Exposition time—72 h.
Method
CompoundMTTNRCV
SalH2.55.73.9
SalNa1.210.74.1
Product 10.986.80.47
Table 4. Effects of SalH, SalNa, and product 1 on 3D growth of HeLa cells.
CompoundEffective Inhibitory Concentration, μM
SalH≥1.33
SalNa≥1.29
Product 1≥0.21
Disclaimer/Publisher’s Note: The statements, opinions and data contained in all publications are solely those of the individual author(s) and contributor(s) and not of MDPI and/or the editor(s). MDPI and/or the editor(s) disclaim responsibility for any injury to people or property resulting from any ideas, methods, instructions or products referred to in the content.

