Article

Physical Vapor Deposition of Indium-Doped GeTe: Analyzing the Evaporation Process and Kinetics

1
Institute of Life Science, Technology, and Engineering, Universitas Airlangga, Surabaya 60115, Indonesia
2
Department of Physics, Faculty of Science and Technology, Universitas Airlangga, Surabaya 60115, Indonesia
3
Department of Physics, Thin Film Technology Laboratory, University of Chemical Technology and Metallurgy, 8, Kl. Ohridski Blvd., 1797 Sofia, Bulgaria
*
Author to whom correspondence should be addressed.
Inorganics 2024, 12(8), 209; https://doi.org/10.3390/inorganics12080209 (registering DOI)
Submission received: 18 June 2024 / Revised: 16 July 2024 / Accepted: 27 July 2024 / Published: 30 July 2024
(This article belongs to the Section Inorganic Materials)

Abstract

:
Chalcogenide glasses have broad applications in the mid-infrared optoelectronics field and as phase-change materials (PCMs) due to their unique properties. Chalcogenide glasses can have crystalline and amorphous phases, making them suitable as PCMs for reversible optical or electrical recording. This study provides an in-depth analysis of the evaporation kinetics of indium-doped chalcogenides, GeTe4 and GeTe5, using the physical vapor deposition technique on glass substrates. Our approach involved a detailed examination of the evaporation process under controlled temperature conditions, allowing precise measurement of rate changes and energy dynamics. This study revealed a significant and exponential increase in the evaporation rate of GeTe4 and GeTe5 with the introduction of indium, which was particularly noticeable at higher temperatures. This increase in evaporation rate with indium doping suggests a more complex interplay of materials at the molecular level than previously understood. Furthermore, our findings indicate that the addition of indium affects the evaporation rate and elevates the energy requirements for the evaporation process, providing new insights into the thermal dynamics of these materials. This study’s outcomes contribute significantly to understanding deposition processes, paving the way for optimized manufacturing techniques that could lead to more efficient and higher-performing optoelectronic devices and memory storage solutions.

1. Introduction

Chalcogenide glasses, composed of chalcogen elements like sulfur (S), selenium (Se), or tellurium (Te), stand apart in the realm of materials science due to their unique ability to transmit a broad spectrum of infrared light. Unlike silica-based glasses, these materials have transmission capacities extending up to 20 μm, with S, Se, and Te-based glasses transmitting up to approximately 10, 15, and 20 μm, respectively. This remarkable property positions chalcogenide glasses as integral components in various mid-wavelength infrared applications, including but not limited to sensors [1,2,3,4], thermal imaging systems [5,6], and infrared photodetectors [7,8].
The utility of chalcogenide glasses extends beyond their optical properties. Particularly noteworthy are their phase-change characteristics. Specific chalcogenide glasses exhibit crystalline and amorphous phases, which are stable at ambient temperatures, and are categorized as phase-change materials (PCMs). These PCMs are distinguished by their ability to transition between two phases under specific thermal conditions. Significant differences in physical properties accompany this phase change; for instance, the crystalline phase typically shows higher optical reflectance and electrical conductance than its amorphous counterpart. These contrasting properties are pivotal in applications such as nonvolatile data storage, where data are stored and read based on the differences in these physical properties [9,10,11,12,13,14,15,16,17,18]. The evolving research, including the development and analysis of GeTe nanowires, further underscores these materials’ multifaceted nature and adaptability to various technological needs [19,20,21,22,23,24,25,26,27,28,29,30,31,32].
Despite their broad applications, a comprehensive understanding of the evaporation kinetics of indium-doped GeTe, a critical aspect of material processing and performance, still needs to be achieved. This knowledge gap is particularly significant considering the impact such understanding would have on optimizing deposition processes and enhancing the material’s overall performance. The unique interaction between indium doping and the GeTe matrix necessitates a detailed study to unravel the complexities introduced by such doping and its effect on the material’s behavior during evaporation.
Our study aims to bridge this knowledge gap by focusing on the evaporation rates of (GeTe4)(100−x)Inx and (GeTe5)(100−x)Inx systems, where x ranges from 0 to 20%. This investigation is pivotal for understanding the nuances of chalcogenide Ge-Te-In film preparation, a process integral to the application of these films in optoelectronics and PCMs. We employed Linseis simultaneous thermal analysis, combining differential scanning calorimetry (DSC) and thermogravimetry (TGA). This approach provided a comprehensive analysis of the evaporation process under controlled conditions, offering insights into these materials’ thermal behavior and stability. Such understanding is expected to inform and improve the manufacturing processes of these chalcogenide glasses, thereby enhancing their application in various cutting-edge technologies.

2. Materials and Methods

2.1. Bulk Sample Preparation

This study used the melt-quenching technique to prepare all bulk glass samples. This technique was chosen for its effectiveness in producing homogeneous materials. Our materials of choice were high-purity elements—specifically, germanium and tellurium with a purity of 5 N (99.999%) for preparing GeTe4 and GeTe5.
The preparation began with carefully weighing the starting materials in stoichiometric proportions for GeTe4 and GeTe5. These mixtures were then placed in evacuated quartz ampoules. The heating process was conducted in a microprocessor-controlled programmable furnace, maintaining a consistent heating rate of 3 K/min. The temperature was first raised to 750 K, where the mixtures were held for 2 h. This duration was critical to ensure the complete decomposition of tellurium, whose melting point is 722 K. Subsequently, the temperature was further increased to 1300 K and maintained for 6 h, facilitating the complete decomposition of germanium (with a melting point of 1211 K) and promoting the reaction between germanium and tellurium. To ensure uniformity and homogeneity of the melt, the mixture was shaken several times during the heating process. Finally, the melt was rapidly quenched from the furnace into ice-cooled water to prevent crystallization.
The preparation of the ternary samples, (GeTe4)(100−x)Inx and (GeTe5)(100−x)Inx with indium concentrations of 5, 10, 15, and 20 at%, involved an additional step. High-purity 4 N (99.99%) indium was incorporated into the binary GeTe4 and GeTe5. The process mirrored that of the binary samples, with the mixture being placed in evacuated quartz ampoules and heated at a controlled rate of 3 K/min. The temperature was first brought up to 500 K and maintained for 2 h to ensure the complete decomposition of indium, which has a melting point of 430 K. The temperature was then increased further to 900 K and held for 6 h. This step was crucial for ensuring the complete decomposition of all reagents and their subsequent reaction. Like the binary samples, the mixture was agitated periodically to maintain melt uniformity. Finally, the melt was quenched from the oven into ice-cooled water to avoid crystallization.

2.2. Thin Film Preparation

The preparation of thin films of (GeTe4)(100−x)Inx and (GeTe5)(100−x)Inx, with x ranging from 0 to 20 at%, was meticulously carried out through vacuum thermal evaporation (VTE) using the previously synthesized bulk glasses. This process was executed in a high-precision Leybold LB 370 vacuum set-up (Leybold company, Germany) equipped with a tantalum crucible, under a highly controlled environment with a residual gas pressure maintained at 10−6 Torr.
During evaporation, a uniform distance of 0.12 m was consistently maintained between the source and the substrate. The evaporation temperatures were carefully controlled within the 700–800 K range across all experiments. To ensure the uniformity of the layers, the substrates were methodically rotated throughout the evaporation process. The glass substrate was maintained at an ambient temperature (300 K) during the deposition process.
The vacuum environment crucial for thermal evaporation was established using a B 30.2 Hochvakuum Dresden system (Vakuumtechnik Dresden GmbH, Germany). The vacuum settings are given in Figure 1. This system comprised an oil diffusion pump backed by a rotary mechanical pump, providing a vacuum range from 10−3–10−6Torr. The vacuum levels were meticulously monitored and controlled using precision pressure gauges. The evaporator utilized an electric resistance heater, which melted the material and raised its vapor pressure to the required levels for deposition. This entire process occurred in a high vacuum (10−6), thereby minimizing potential reactions or scattering with other gas-phase atoms in the chamber and significantly reducing impurities from the residual gas.
The integrity of the vacuum thermal evaporation working chamber was ensured using stainless steel and Teflon materials, known for their resistance to aggressive environments and minimal porosity. An electrical power unit was employed to supply the necessary power to the system’s vacuum pumps, evaporators, and other components.
For the deposition, the films with compositions (GeTe4)(100−x)Inx and (GeTe5)(100−x)Inx with x = 0, 5, 10, 15, 20 at% were applied onto optically non-absorbing BK7 glass (float glass) substrates, chosen for their lack of absorption in the spectral region under study. Prior to deposition, these substrates were meticulously cleaned using distilled water and isopropyl alcohol to ensure optimal condensation of the evaporant. Rotating the substrates during deposition addressed potential non-uniformities in film thickness. The thickness of the films, which ranged from 300 nm–650 nm, was determined based on the evaporation time and estimated using the Swanepoel method [33].

2.3. Theoretical Foundations of Evaporation Processes

The transition of solids or liquids to a gaseous state encompasses both macroscopic and atomistic phenomena. From a thermodynamic perspective, the study of evaporation involves understanding evaporation rates, material–container interactions, alloy composition changes, and compound stability. Concurrently, the kinetic theory of gases has fostered an atomistic approach, significantly advancing our understanding of reaction kinetics and solid-state theory.
The foundations of modern evaporation theory were laid by Hertz, Knudsen, and Langmuir in the late 19th and early 20th centuries. In 1882, Hertz’s pioneering work on mercury evaporation in a high vacuum established that the evaporation rate is proportional to the difference between the equilibrium vapor pressure at the evaporant surface and the hydrostatic pressure in the gas phase. This finding formed the basis for applying kinetic theory to evaporation processes.
Building on Hertz’s work, the kinetic theory of gases relates the impingement rate of gas molecules to their partial pressure, p:
d N i A e d t = 2 π m k T 1 2 p ,
where N i is the number of molecules striking a unit area of surface, A e , m is the molecular weight, k is Boltzmann’s constant, and T is the temperature in Kelvin.
Knudsen further refined this concept by introducing the evaporation rate of mercury in a high vacuum and found the coefficient α ν , which accounts for the fact that not all impinging molecules are incorporated into the liquid phase. This led to the formulation of the Hertz–Knudsen equation:
d N e A e d t = α ν 2 π m k T 1 2 p p ,
The value of α ν represents the ratio of the actual evaporation rate in a vacuum to the theoretical maximum, with its value ranging from near zero for contaminated surfaces to unity for clean surfaces.
Langmuir proposed an alternative theory for evaporation from a free surface, deriving the maximum evaporation rate as:
V e = 0.0583 α ν m T p ,
where Ve is the evaporation rate.
The temperature dependence of equilibrium vapor pressure is described by the Clausius–Clapeyron equation:
d P ν P ν = Q d T R T 2 ,
where Q is evaporation energy and R is the molar gas constant. Assuming constant evaporation energy over the temperature range of interest, integration yields:
P ν ( T ) = P 0 e Q R T
This relationship has been experimentally verified for most materials at vapor pressures below 1 Torr. Combining Langmuir’s evaporation rate with the vapor pressure–temperature relationship produces an integrated form:
V e = 0.058 α ν P 0 m T e Q R T
This equation provides a comprehensive description of evaporation rate as a function of material properties and temperature, encapsulating the core principles of evaporation theory developed from Hertz to Langmuir.

3. Results and Discussion

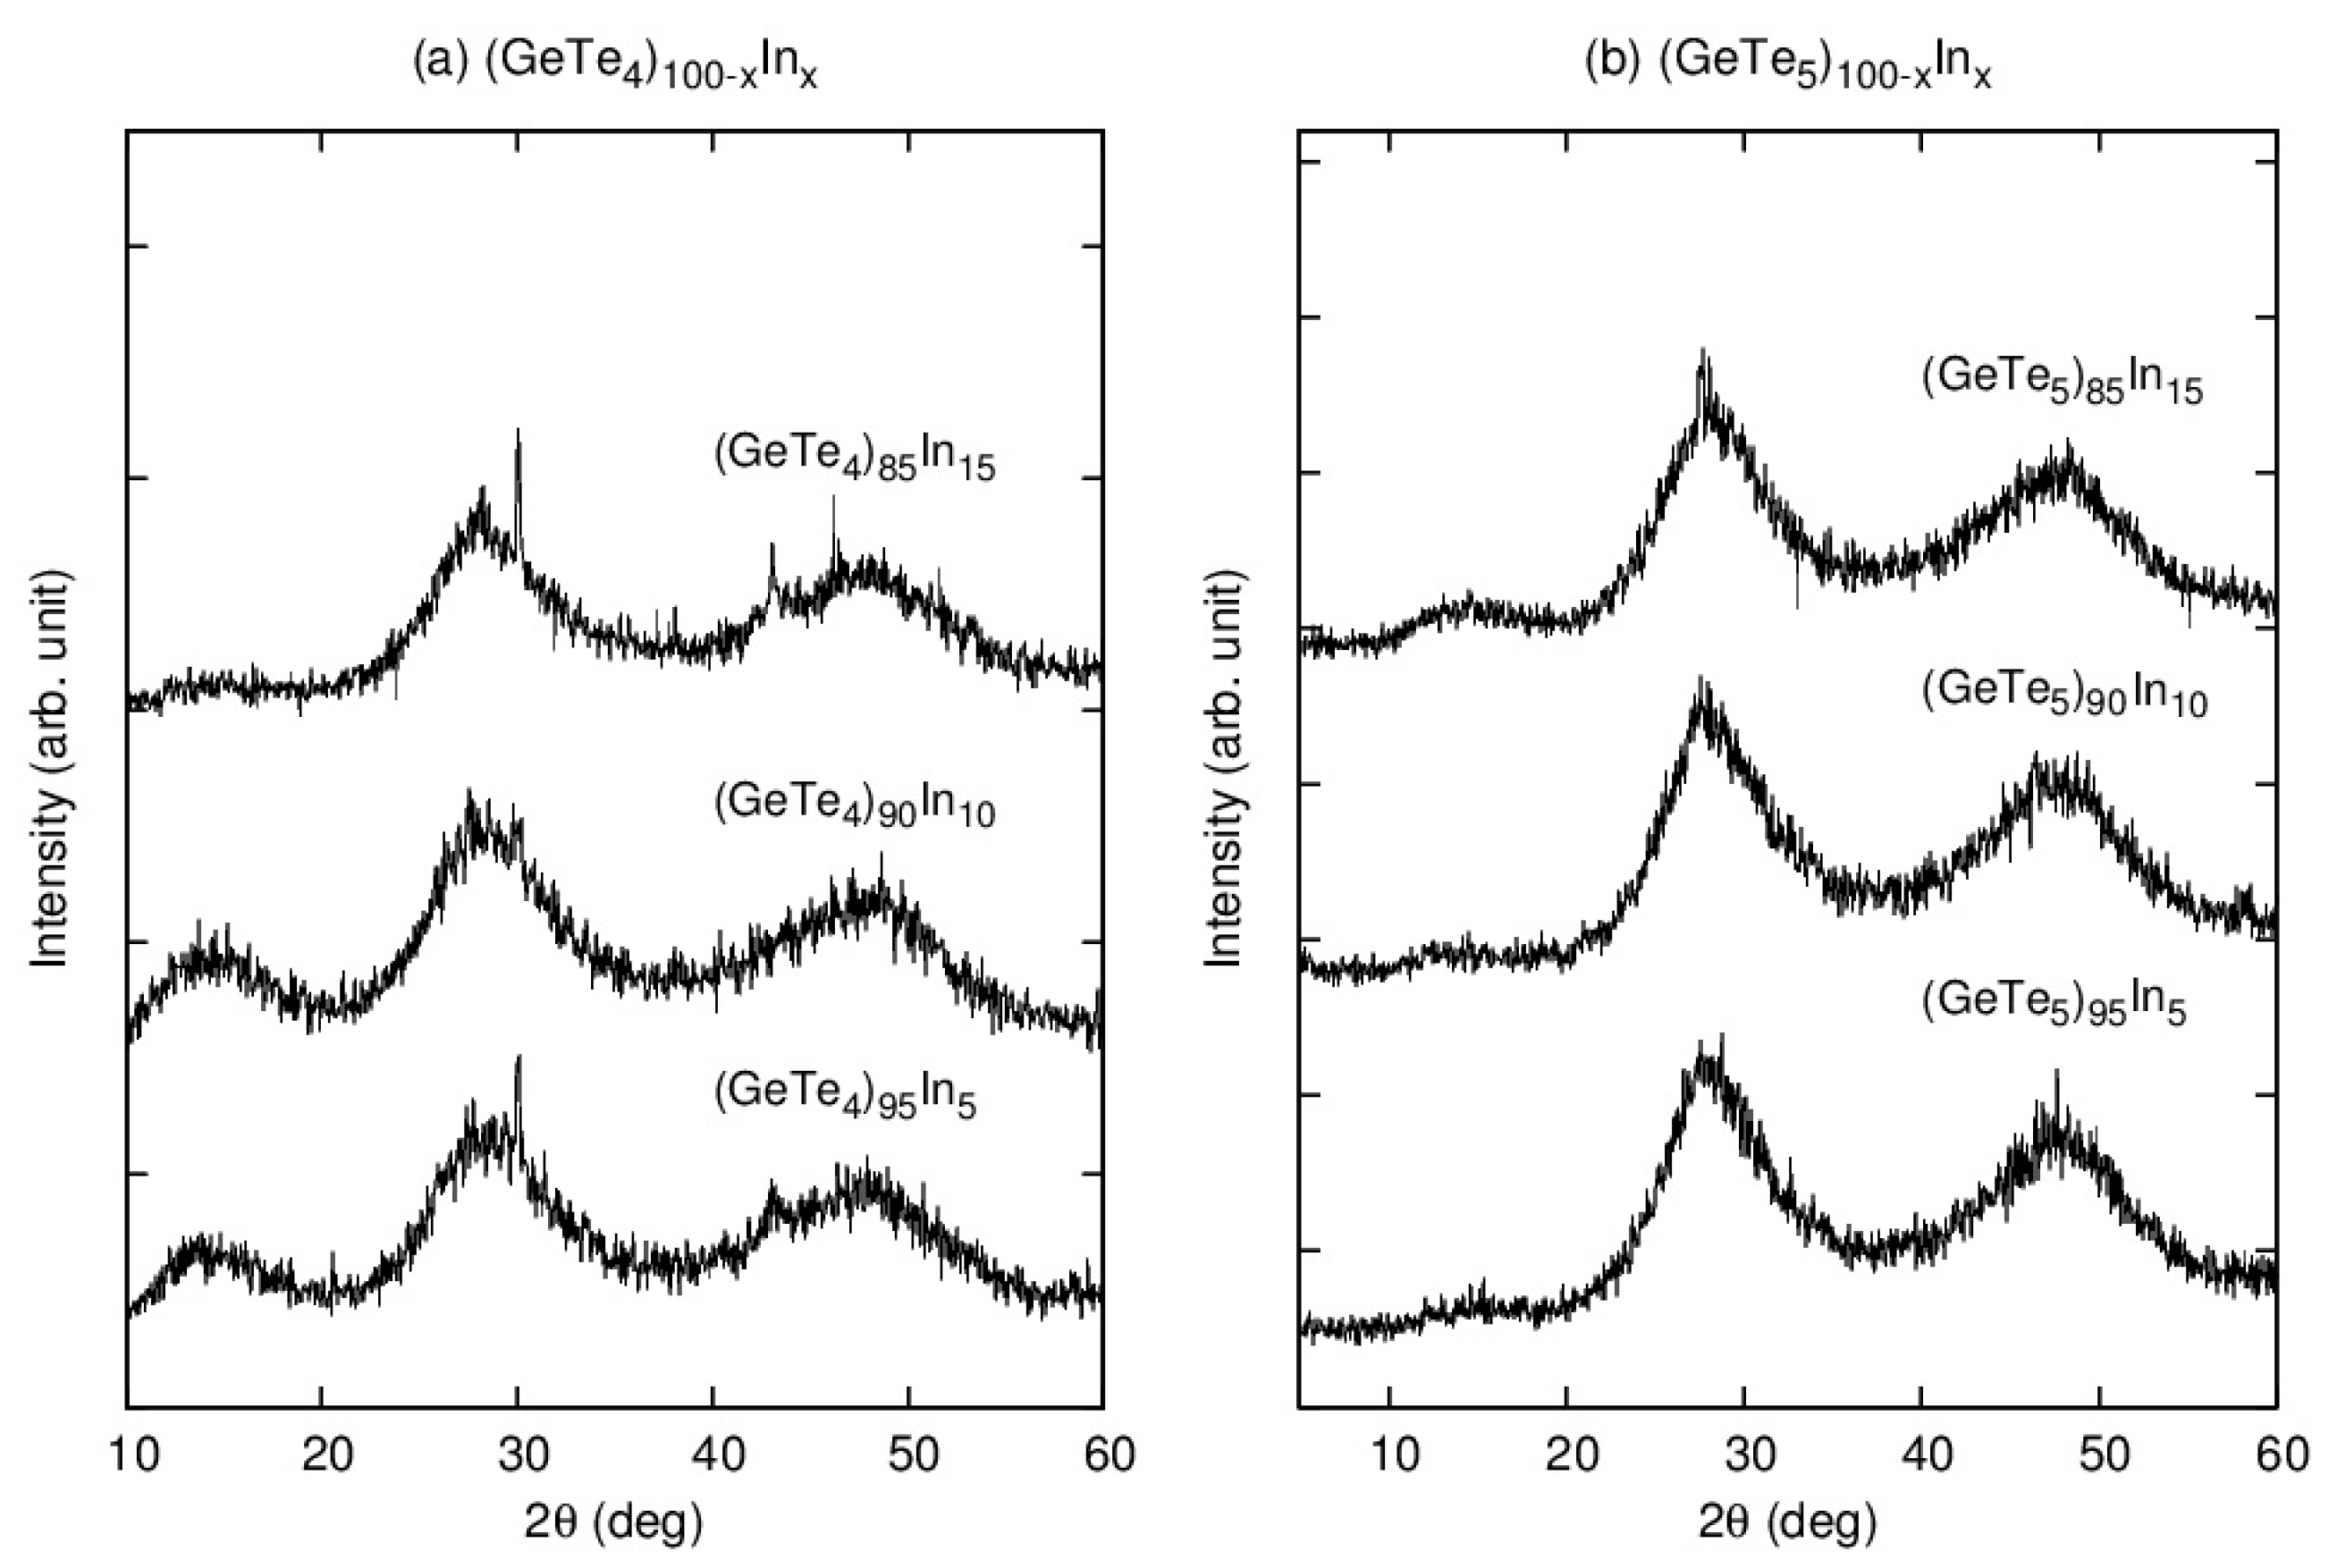
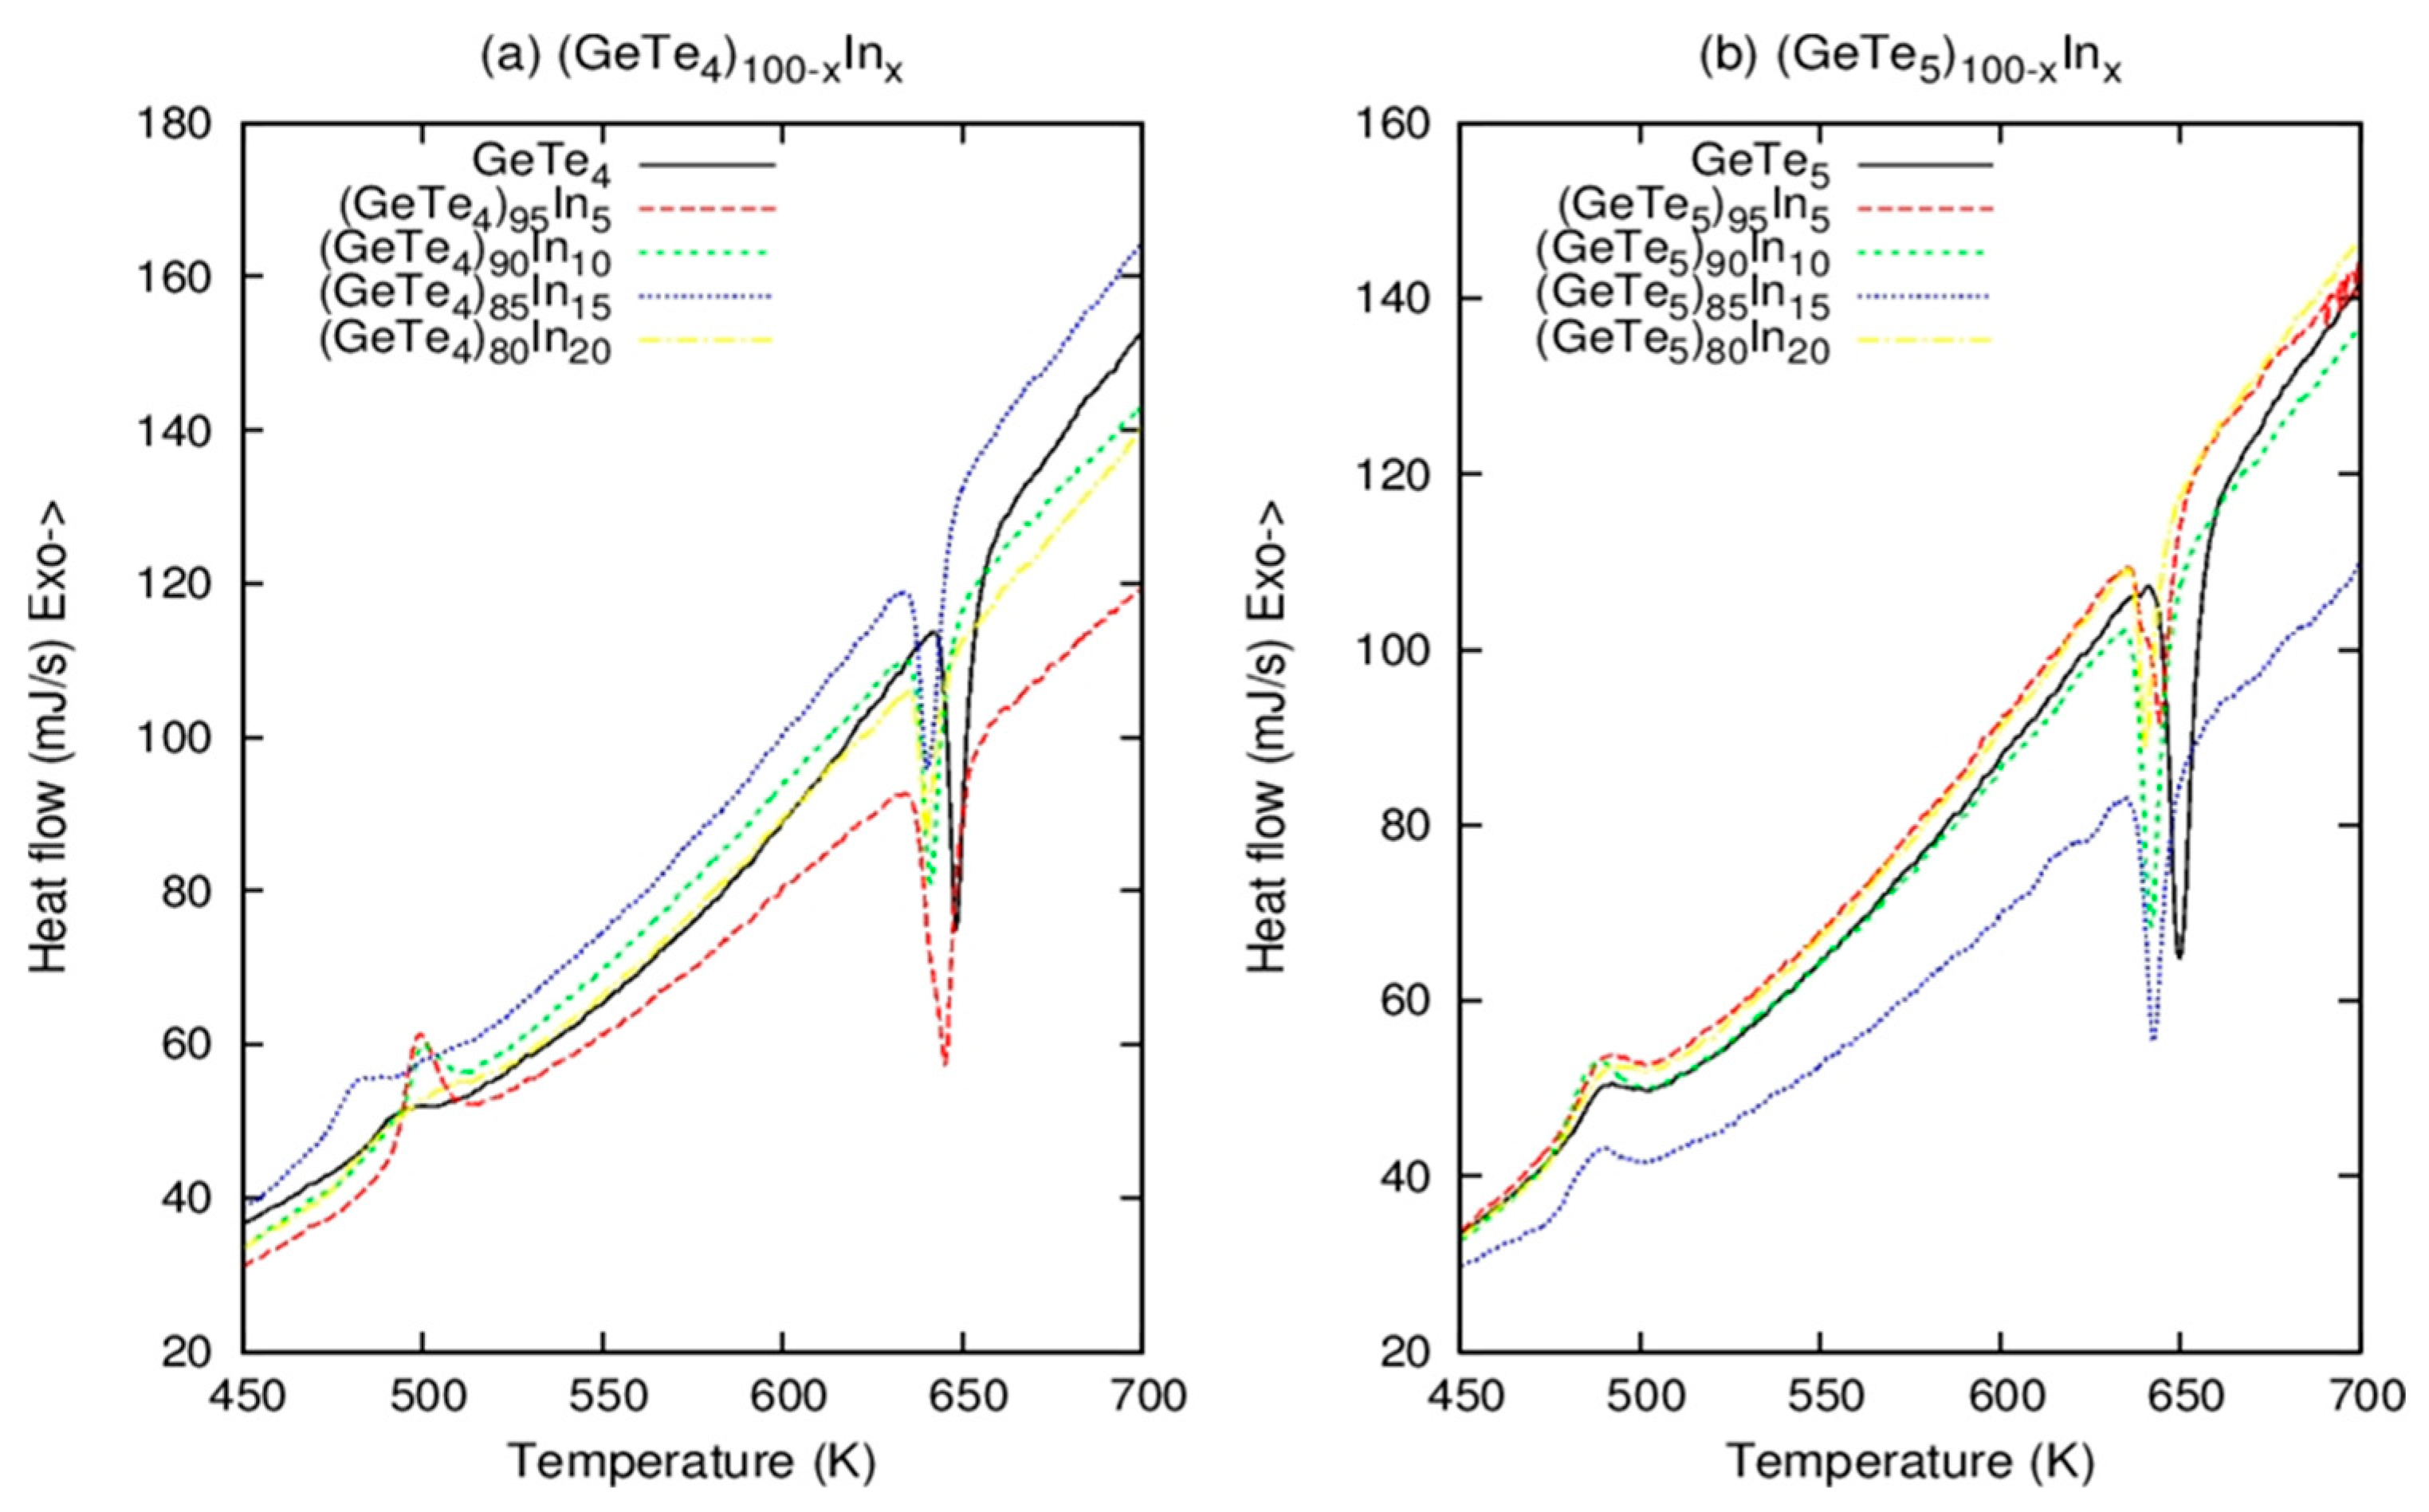
3.1. Structure and Thermal Properties of Bulk Samples

The structures of bulk samples were verified at room temperature by X-ray diffraction (XRD) using a Philips Xpert system (Malvern Panalytical, UK) with a monochromatic Cu Kα radiation source (1.5406 Å). The scattering intensities were measured over an angular range of 5 ≤ 2θ ≤ 60 with 0.02 step size and a count time of 2 s per step. The XRD data for the bulk samples of (GeTe4)100−xInx and (GeTe5)100−xInx (Figure 2) exhibited broad diffraction peaks, indicative of an amorphous structure at room temperature. These broad peaks signified a lack of long-range atomic order, characteristic of amorphous materials. The consistent peak positions across different compositions suggested that the base structure of these chalcogenide glasses remained largely unaffected by varying indium concentrations. As the temperature increased, these amorphous materials underwent a phase transition to a crystalline state. This transition is a fundamental property of phase-change materials, which can switch between amorphous and crystalline phases with temperature changes. The XRD patterns for both (GeTe4)100−xInx and (GeTe5)100−xInx showed that the inclusion of indium modified the local structure of the material but did not significantly change the overall amorphous nature at room temperature. The slight variations in the XRD peak intensities and widths with different indium concentrations suggested that indium affected the atomic-scale interactions within the glass matrix. Upon crystallization, these materials typically formed a tetrahedral structure.
The thermal behavior of the (GeTe4)(100−x)Inx and (GeTe5)(100−x)Inx systems, with x values ranging from 0 to 20 at%, was meticulously studied using Linseis simultaneous thermal analysis (STA, LINSEIS, Germany). The sophisticated equipment allowed the simultaneous measurement of differential scanning calorimetry (DSC) and thermogravimetry (TGA) under identical conditions (atmosphere, heating rate, gases, sample preparation), ensuring consistency and accuracy in our experimental data.
The Linseis STA system boasts a temperature precision of 0.01 K, with an average standard error of approximately ±0.5 K for key thermal measurements such as crystallization temperatures and melting points. For each experiment, the samples were sealed and subjected to a controlled heating rate of 10 K/min, starting from room temperature and extending up to 800 K. Critical thermal parameters, including the glass transition temperature (Tg), onset temperature of crystallization (Tc), peak temperature of crystallization (T(c,p)), and peak melting temperature (Tm), were accurately determined from the resultant thermal curves.
The DSC curves (Figure 3) for both (GeTe4)(100−x)Inx and (GeTe5)(100−x)Inx chalcogenide glasses, observed at a heating rate of 10 K/min, provided insight into the thermal transitions. Notably, the initial exothermic peaks in these curves are indicative of crystallization. Upon further heating, the samples transitioned into a melting phase, characterized by an endothermic peak. The crystallization temperature in these DSC scans was identified at the temperature corresponding to the exothermic peak, reflecting a sudden change in specific heat. The presence of a single exothermic crystallization peak suggests the homogeneity of the samples. The onset temperature of crystallization T(c,p), and the peak melting temperature of Tm are listed in Table 1.
For the (GeTe4)(100−x)Inx system, as depicted in panel Figure 3a, the crystallization peaks shifted towards higher temperatures with increased indium content. This shift indicated a change in the material’s thermal stability, potentially implicating an increase in the energy barrier for crystallization. This could suggest that adding indium may have led to a more complex or disordered structure, requiring more thermal energy to overcome for the crystallization process to initiate.
Furthermore, the endothermic peaks, signifying melting, became broader with higher indium concentrations, suggesting a distribution of melting points. This could have been due to the formation of various indium-related defects or phases within the glass matrix, leading to a range of local environments with different thermal stabilities.
The trends in the (GeTe5)(100−x)Inx system, shown in panel Figure 3b, were similar, albeit less pronounced than in the GeTe4 system. The crystallization temperature increased subtly with indium content, and the endothermic melting peaks also exhibited broadening. The less significant change in the GeTe5 system could point towards a different interaction between indium and the GeTe matrix than in the GeTe4 system, possibly due to the different stoichiometries and resulting structural frameworks.
In both systems, the absence of a discernible glass transition before crystallization could imply that the transition occurred below the studied temperature range or that the rapid crystallization process kinetically hindered the transition. A glass transition is typically represented by an endothermic step due to increased heat capacity. A lack of this feature suggests that the glass transition may be challenging to detect under experimental conditions or may overlap with the crystallization event. A glass transition, marked by an increase in heat capacity upon heating, is generally expected to manifest as an endothermic step in the heat flow at Tg. However, due to differing kinetics between the glass transition and crystallization, increasing the heating rate may sometimes reveal the Tg.
The uniformity of the exothermic crystallization peak across all samples suggested a homogeneity within the bulk samples, reinforcing that the melt-quenching process used to prepare these samples was effective. The crystallization peaks noted were broad, with the onset temperature of crystallization (Tc) ranging between 469.7 K and 492.7 K for (GeTe4)(100−x)Inx and between 476.6 K and 480.7 K for (GeTe5)(100−x)Inx. The DSC patterns showed an exothermic crystallization peak and an endothermic melting peak (Figure 3). An increase in the indium content in the (GeTe4)(100−x)Inx system led to a noticeable broadening of the crystallization peak, as shown in Figure 3a. It was also observed that the peak of the sharp crystallization exotherm was more sensitive to the heating rate than the broader crystallization peak. The broadening of these peaks, especially in the (GeTe4)(100−x)Inx system, could have been correlated with the varying nucleation rates and growth of crystalline phases influenced by the indium concentration.
Interestingly, the onset temperature of crystallization and the peak crystallization temperature were found to be at their maximum at Z = 2.43 for the ternary (GeTe4)(100−x)Inx composition and at Z = 2.37 for the ternary (GeTe5)(100−x)Inx composition, which may be attributed to percolation phenomena. The results, detailed in Table 1, clearly showed that the peak crystallization temperature (T(c,p)) of the binary samples increased with the addition of indium. This change can be explained by considering the structural modifications induced by incorporating In atoms into the Ge-Te matrix. It is well known that the crystallization temperature is associated with the nucleation and growth process dominating the devitrification of most glassy solids. Also, in chalcogenide glasses, the heteropolar bond is more favorable than the homopolar bond, resulting from the homopolar bond’s smaller binding energy, especially for Ge-Ge, compared with heteropolar bonds such as Ge-Te and Te-In. Adding an indium atom to the Ge-Te system led to the cross-linking of the chains and affected the nucleation and growth rate. This was the reason for the change in the crystallization temperature of the binary samples when the indium atom was introduced.

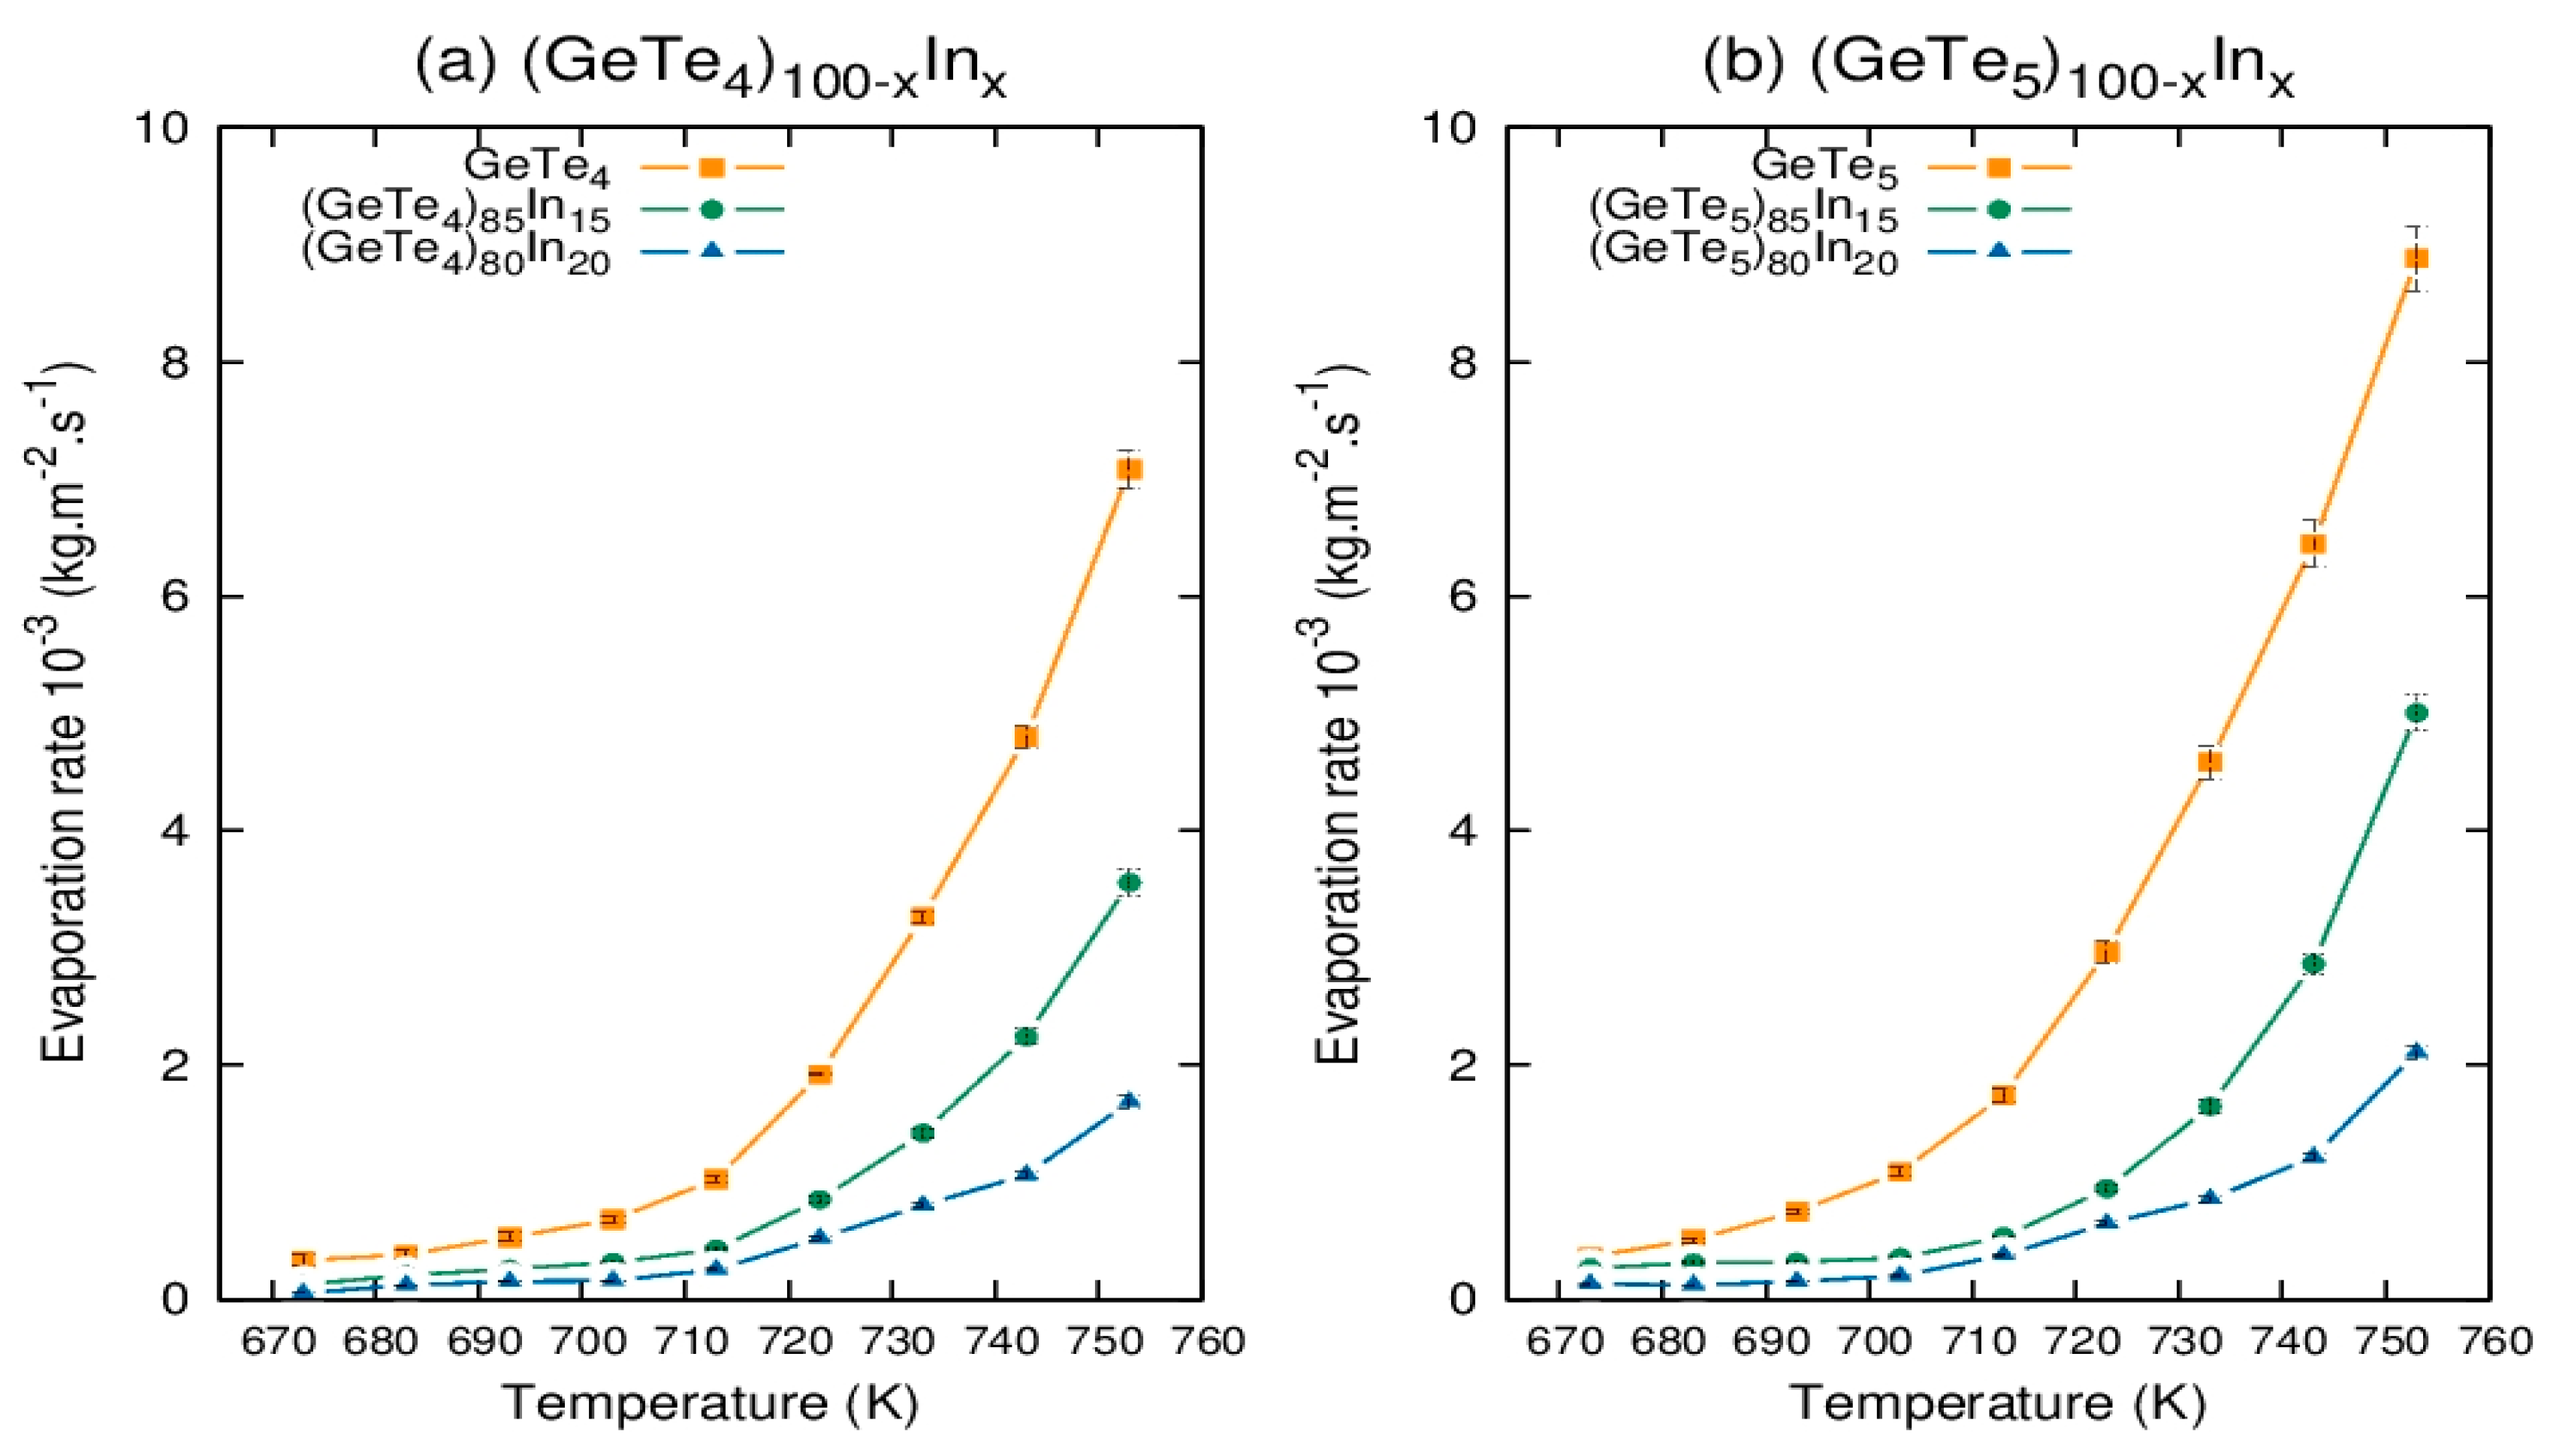
3.2. Evaporation Rate of Chalcogenide Ge-Te-In Glasses

In all the experiments, samples were sealed in a crucible with a surface area of 4.42 × 10⁻⁵ m2 and scanned at a 10 K/min heating rate from room temperature to 800 K. The Linseis L81 thermobalances (LINSEIS, Germany) were used in a horizontal mode of operation for measurement. The balance had a mass accuracy ± 10 μg and was able to provide a high vacuum up to 10−5 bar.
Several factors needed to be controlled to obtain meaningful Δm data from the thermogravimetry measurements, as follows:
The evaporation rate was independent of the amount of material used but may had some dependence on the flow rate;
The surface area of the solid in each experiment had to remain constant, or the evaporation rate (mass/time) at different temperatures could not be compared;
The analyzed samples did not decompose significantly, or the mass changes due to decomposition would have produced incorrect results.
The evaporation rate Ve at a definite temperature was calculated from the weight loss Δm of the sample:
V e = Δ m A t ,
where A is the surface area of the coated test substances, usually the surface area of the crucible, and t is the time for weight loss Δm. Results of the Ve calculations for selected (GeTe4)(100−x)Inx and (GeTe5)(100−x)Inx chalcogenide glasses at a heating rate of 10 K/min are displayed in Figure 4. Table 1 shows that the melting temperature for all samples was below 650 K. Figure 4 shows that the evaporation rates for all samples displayed exponential curves, which were expected as predicted by Equation (6). Figure 4a,b each plot the evaporation rate against temperature for the respective systems, offering valuable insights into the thermal behavior of these materials as a function of indium doping.
In both graphs, the evaporation rate is denoted in 10−3 kg·m−2·s−1 units. The temperature range spanned from approximately 670 K to 760 K. This specific measure of the evaporation rate indicated the mass of the material that evaporated per unit area per second, providing a quantifiable metric for assessing the volatility of the samples at elevated temperatures.
Figure 4a displays a clear trend in the (GeTe4)(100−x)Inx system whereby the evaporation rate increased with temperature. Notably, as the indium content increased, there was a significant decrease in the evaporation rate at corresponding temperatures. The pristine GeTe4 sample showed the highest evaporation rate across the measured temperature spectrum. In contrast, the indium-doped samples exhibited progressively lower rates, suggesting that indium incorporation enhanced the material’s thermal stability or increased the energy barrier for evaporation. Such a trend suggests that indium atoms may have created stronger bonds within the glass matrix or possibly increased the density or structural complexity of the material, which in turn could have inhibited the rate at which atoms or molecules were able to escape the surface and transition to the gas phase.
Similarly, Figure 4b shows that the (GeTe5)(100−x)Inx system followed the same trend, with the evaporation rate rising as the temperature increased. The effect of indium doping was analogous to that observed in the GeTe4 system, where adding indium decreases the evaporation rate. This trend also suggested that indium doping may have reinforced the glass network, potentially leading to stronger interatomic bonds or reducing the number of defects that would otherwise facilitate higher evaporation rates.
The reduction in evaporation rates upon indium incorporation implies that the doped glasses exhibited enhanced thermal stability. This would make them more suitable for applications where materials are exposed to high temperatures or where a lower material loss rate is critical. This revised interpretation aligns with the graphical evidence and accurately represents the materials’ behavior in response to indium doping. Indium addition increased the thermal stability of the binary Ge-Te system.
For both systems, the curves were nonlinear, with a steeper slope observed at higher temperatures. This implies that the evaporation process was likely to have been accelerated due to a decrease in the activation energy for evaporation or the onset of a phase transition in the material. A nonlinear relationship between temperature and evaporation rate is typical for such materials and reflects the complexity of the physical processes occurring during heating.
The observed differences in evaporation behavior between the two systems upon indium doping may be attributable to variations in their respective compositional structures, which impacted how the indium atoms integrated into the matrix and affected the overall material properties. The data suggest that for both GeTe4 and GeTe5 systems, indium doping significantly impacted the thermal properties, with potential implications for applications that rely on controlled evaporation or thermal stability.

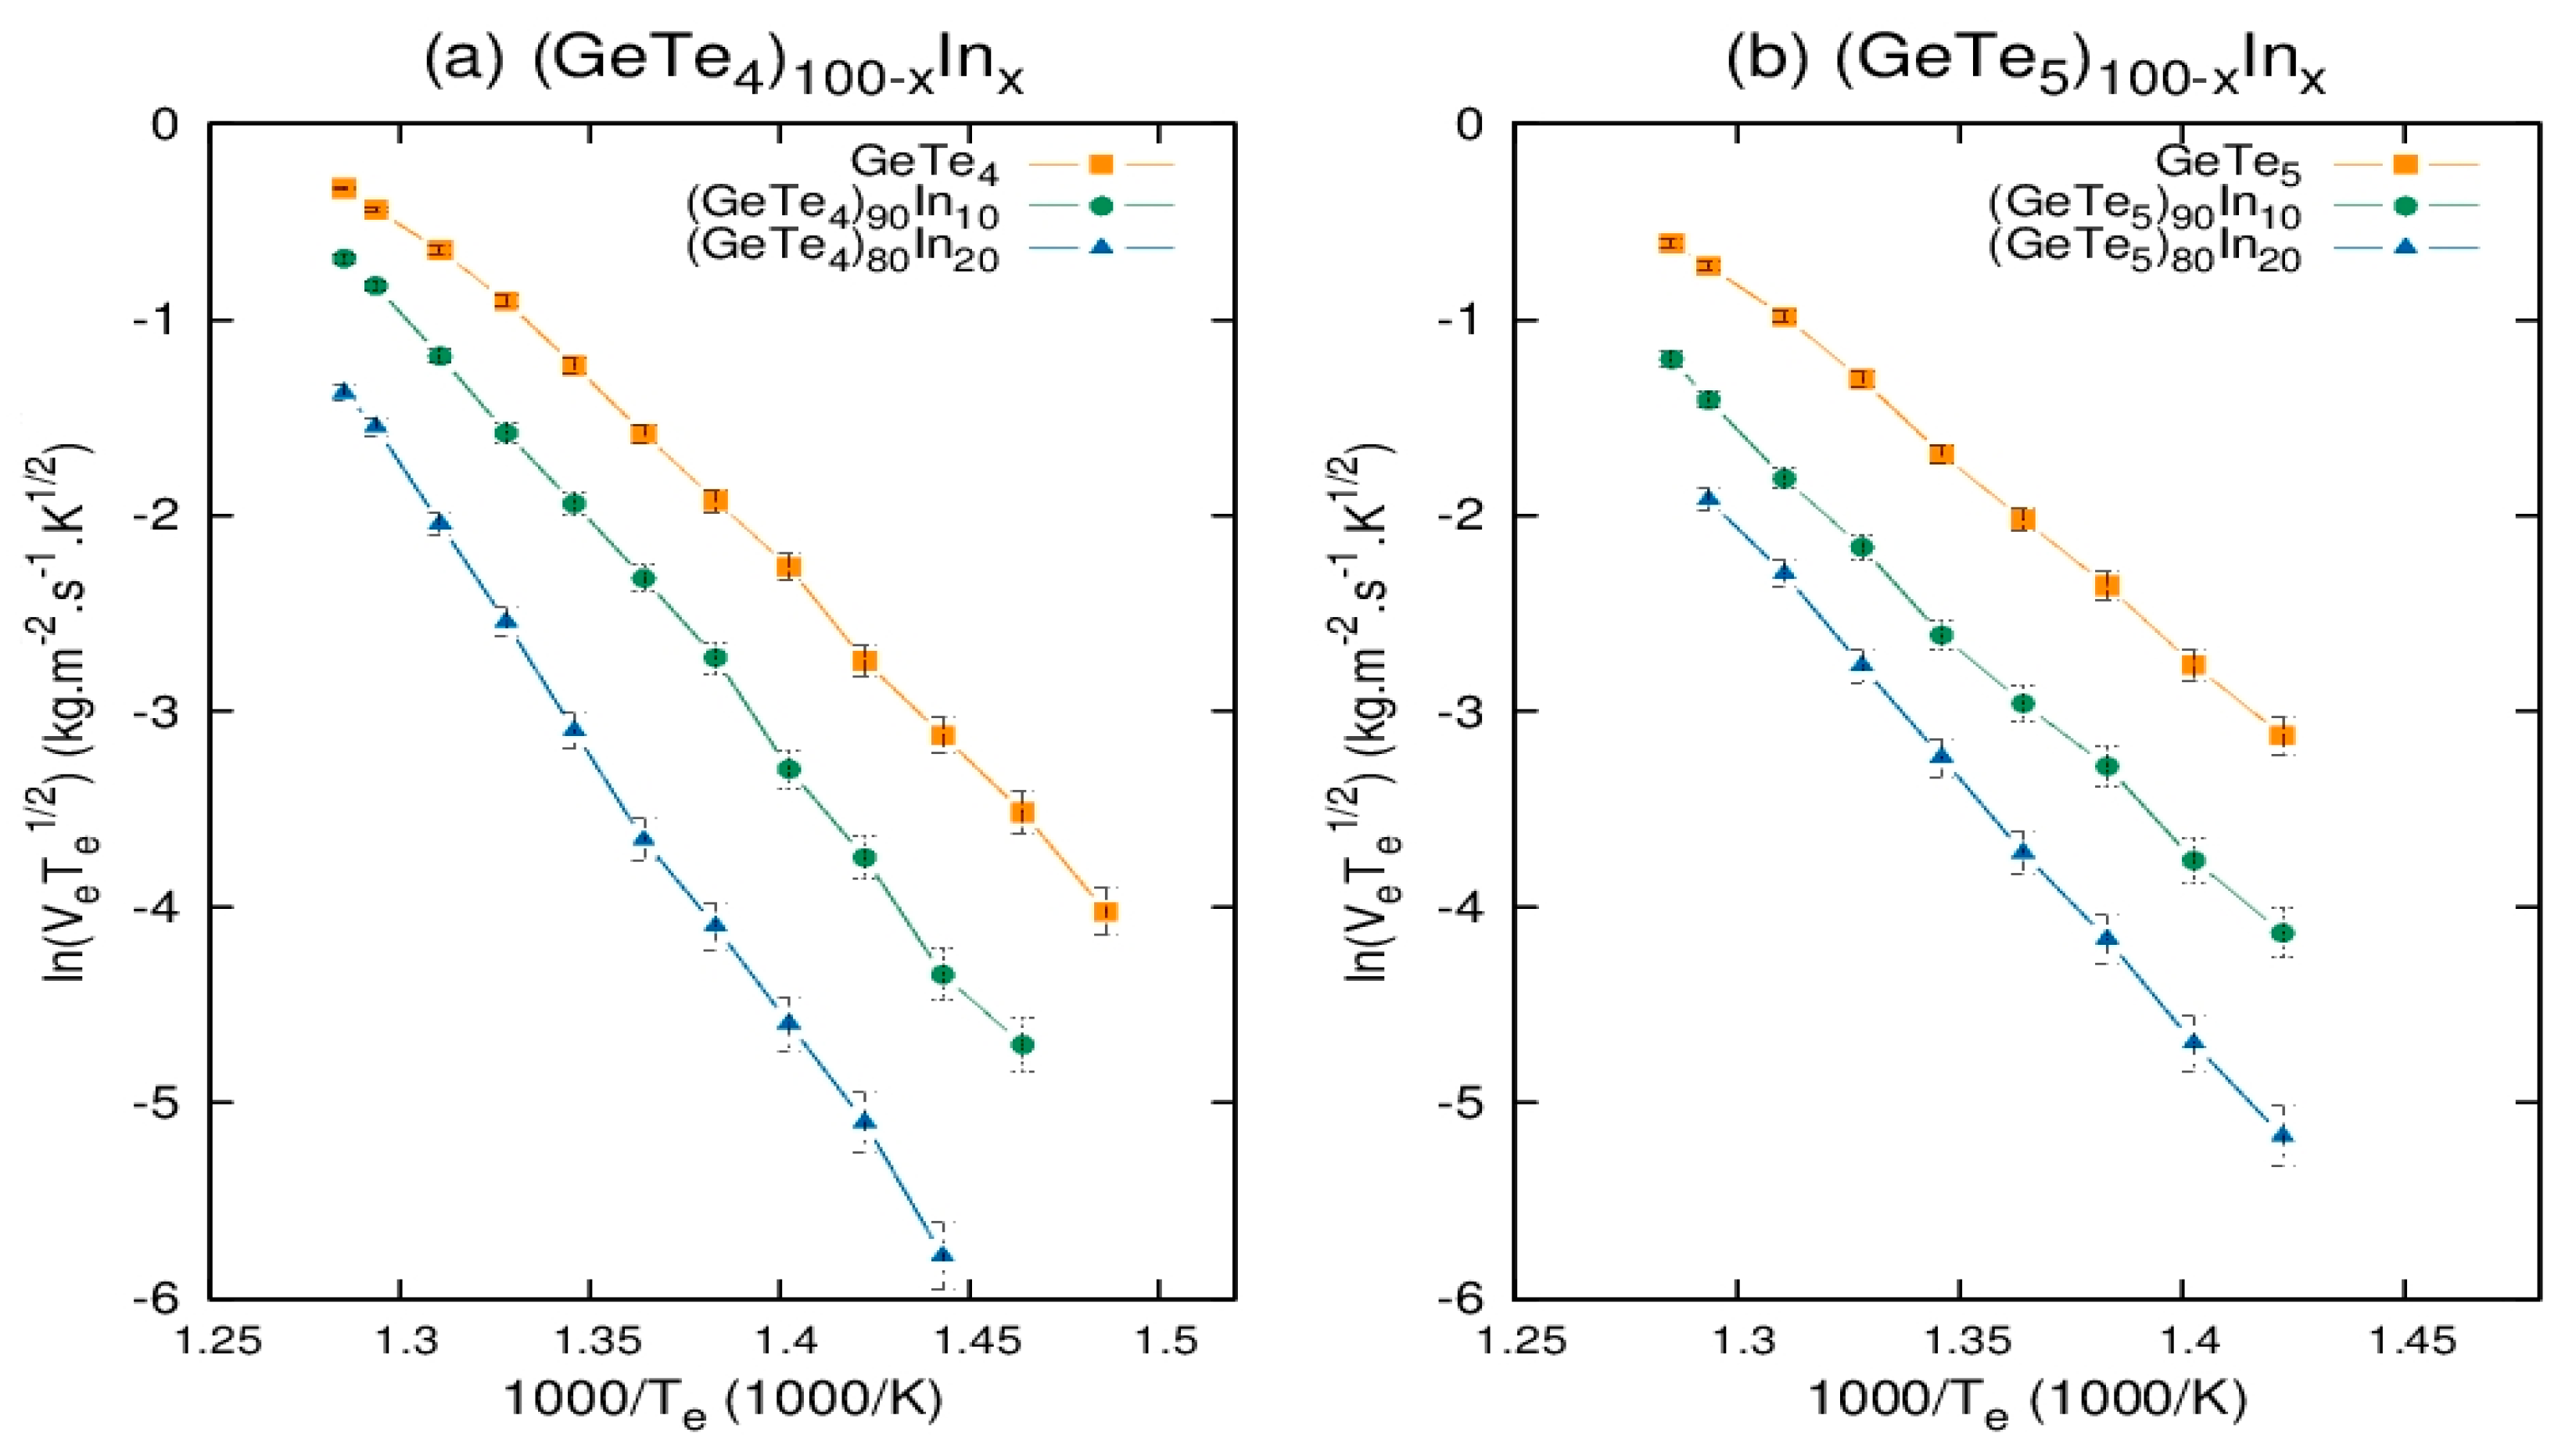
3.3. Evaporation Energy of Chalcogenide Ge-Te-In Glasses

In this section, to better understand the thermal stability and evaporation kinetics of chalcogenide Ge-Te-In glasses, the evaporation energies of the systems under study are discussed. The evaporation energy of a material depends on the material type and evaporation conditions. The evaporation energy can be calculated straightforwardly from the evaporation rate using graphical method. From Equation (6), if the ln function is applied for both sides and the linear plot of l n ( V e T e 1 / 2 ) = f ( 1 / T e ) is constructed, the evaporation energy can then be calculated from the slope of the plot. Linear plots of l n V e T e 1 2 as a function of 1/Te from selected samples are displayed in Figure 5. Values of slope and evaporation energy are presented in Table 2.
Figure 5 shows two Arrhenius plots that relate the evaporation rates of GeTe4 and GeTe5 compounds to temperature. Arrhenius plots are a classic method to represent the temperature dependence of a reaction rate, in this case, evaporation, which is often activated thermally.
The vertical axes of the graphs represent the natural logarithm of the evaporation rate, adjusted for temperature l n ( V e T e 1 / 2 ) , suggesting that the rate constants have been modified to consider the influence of temperature in order to identify the temperature-independent pre-exponential factor. The horizontal axes represent the inverse of temperature (1000/Te), a common representation to linearize the exponential temperature dependence described by the Arrhenius equation.
In exploring the thermal properties of binary chalcogenide systems, the analysis of evaporation rate as a function of temperature plays a pivotal role. The temperature-dependent evaporation rates of GeTe4 and GeTe5, as observed in Figure 5, provide valuable insights into their relative thermal stabilities. Both systems exhibited an exponential increase in evaporation rate with rising temperatures within the studied range of 670 K to 760 K. However, it was discerned that GeTe5 had a higher evaporation rate than GeTe4, suggesting that a higher Ge/Te ratio correlated with an increased evaporation rate.
This observation implies that GeTe4, with a lower Ge/Te ratio, possesses a higher thermal stability than GeTe5. This phenomenon suggests that the eutectic composition within the Ge-Te system may not represent the optimal configuration for glass stability, as evidenced by the lower evaporation energy observed for GeTe5. This aligns with the bond energy perspective, where GeTe4, with a mean bond energy of 2.33 eV, demonstrates stronger atomic bonds than GeTe5, which has a mean bond energy of 2.27 eV—consequently, the stronger atomic bonds in GeTe4 result in a requirement for higher energy to induce evaporation.
Introducing indium atoms into the Ge-Te matrix introduced additional complexity to the evaporation process. The impact of indium was reflected in the altered bond networks within the system, where the inclusion of Te-In bonds—possessing higher bond energies—displaced less favorable homopolar bonds like Te-Te. This substitution led to an increase in the average bond energy of the system, thereby enhancing the material’s stability. As such, with the progressive increase in indium content, the energy necessary for bond cleavage and, by extension, for evaporation escalated.

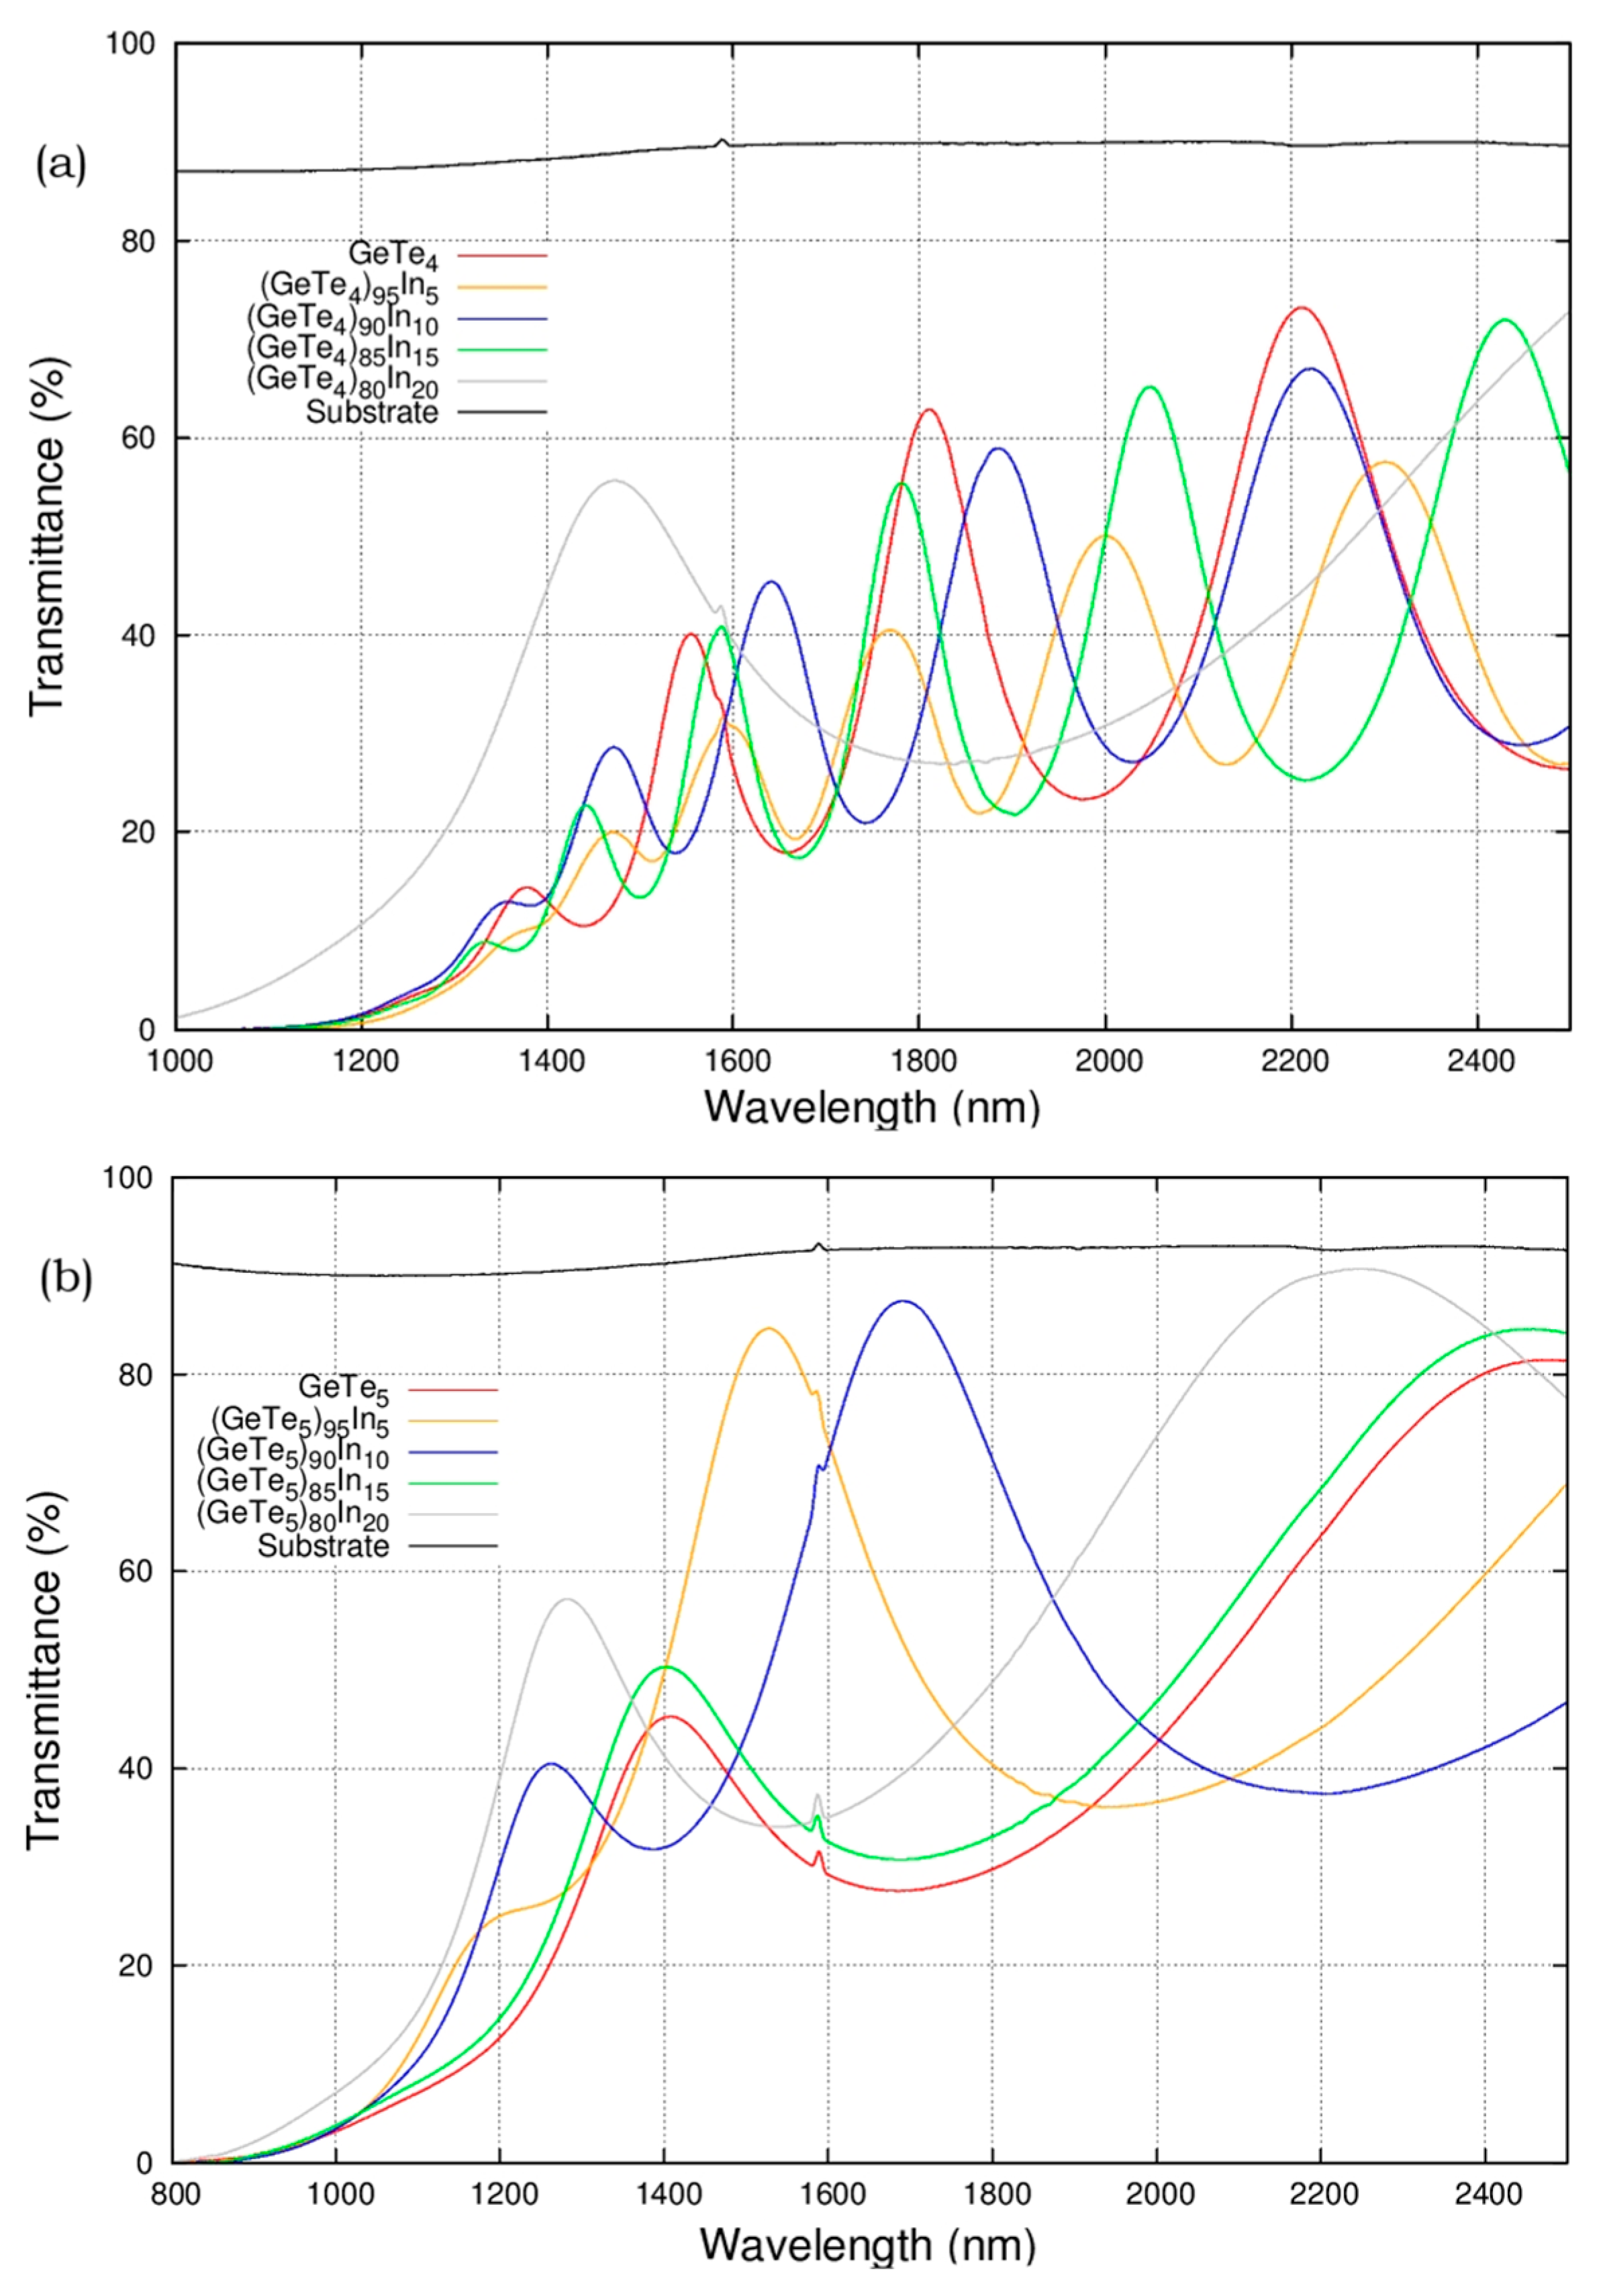
3.4. Thickness and Non-Equilibrium Nature of Deposition

Transmission spectra were used to calculate the film thicknesses using Swanepoel’s method. The spectra were measured at normal incidence and room temperature using a double-beam Jasco UV-VIS-NIR spectrophotometer (Model V-670, Jasco, Japan) over a wavelength range of 400–2700 nm.
Figure 6a presents the transmission spectra of the (GeTe4)100−xInx system, where x = 0, 5, 10, 15, and 20 at%, in the wavelength range of 1000–2600 nm. The substrate exhibited a transmission intensity of approximately 91%, while the maximum transmission intensity of the thin films reached 85%. Figure 6b displays the transmission spectra of the (GeTe5)100−xInx system, with x = 0, 5, 10, 15, and 20 at%, in the wavelength range of 800–2600 nm. The thicknesses of the prepared films ranged from 314 nm to 653 nm.
The surface morphology of the prepared thin films was investigated using field emission scanning electron microscopy (FE-SEM, Hitachi, Japan). Figure 7 presents a representative FE-SEM micrograph of the thin film surface at 60,000× magnification, with a scale bar of 500 nm. The micrograph revealed a highly granular surface texture characterized by uniformly distributed, nanoscale features. These features were consistent with the presence of grains, indicative of a polycrystalline structure. The observed grains exhibited a relatively uniform size distribution, suggesting a high nucleation rate during the deposition process.
The observed microstructure can be attributed to the non-equilibrium conditions typical of physical vapor deposition (PVD) processes. In such processes, the rapid arrival of atoms at the substrate surface promotes the formation of numerous nucleation sites before significant grain growth can occur. This results in the formation of a fine-grained, polycrystalline structure, as evidenced in the micrograph. The uniformity in grain size and distribution indicated consistent deposition conditions, crucial for achieving predictable and uniform material properties across the thin film. This microstructure stands in contrast to amorphous materials, which typically present smooth, featureless surfaces at comparable magnifications.
The observed polycrystalline structure has several implications for the material properties. The high density of grain boundaries is expected to enhance the mechanical hardness of the film through grain boundary strengthening mechanisms. However, these grain boundaries can also act as electron scattering centers, potentially influencing the film’s electrical conductivity. Moreover, the rapid deposition and limited surface diffusion characteristic of non-equilibrium PVD processes often result in films with high intrinsic stress. This stress can lead to the formation of microstructural defects such as dislocations and vacancies, further modifying the film’s properties.
The microstructure provides insights into the deposition process. The fine grain size suggests a high supersaturation of adatoms during deposition, promoting nucleation overgrowth. The uniformity of the grains indicates careful control of deposition parameters, including substrate temperature, deposition rate, and potential substrate bias. The absence of columnar structures or significant texture suggests limited adatom mobility during film growth, consistent with low-temperature or high-rate deposition conditions.
The observed microstructure suggests potential applications in various fields. The enhanced mechanical properties associated with fine-grained structures make these films suitable for protective coatings. In electronic devices, the ability to tailor electrical properties through microstructural control is advantageous. For optical coatings, the nanoscale grain structure may offer unique light-scattering properties.

4. Conclusions

This study’s conclusion underscores the thermal behavior of GeTe4 and GeTe5 chalcogenide glasses in binary and ternary compositions with indium across a temperature range of 670 K to 760 K. The analysis of evaporation rates, which displayed an exponential increase with temperature, adhered to the expected behavior predicted by kinetic theory. The observed melting temperatures of all samples were below 650 K, suggesting that the materials transitioned from a solid to a liquid state before reaching the higher temperatures in the examined range.
Compared with the ternary Ge-Te-In system, the binary Ge-Te system demonstrated a higher evaporation rate at a given temperature. This indicates that adding indium enhanced the binary system’s thermal stability. Notably, this study reveals that the GeTe4-based system with indium doping, represented by ( G e T e 4 ) 100 x I n x , exhibited superior thermal stability compared with its GeTe5-based counterpart, ( G e T e 5 ) 100 x I n x .
Analysis of the binary systems alone, without indium doping, showed that the GeTe4 composition was more thermally stable than GeTe5. This was reflected in the lower evaporation rates and is consistent with the concept that a lower Ge/Te ratio results in enhanced stability. This study suggests that the eutectic composition in the Ge-Te system may not be the most stable phase, as demonstrated by the lower evaporation energy required for GeTe5 compared with GeTe4. The difference in stability between the two compositions is supported by bond energy considerations; GeTe4 is composed of stronger atomic bonds than GeTe5, necessitating higher energy for evaporation.
The introduction of indium added complexity to the evaporation process due to changes in the compositional and structural aspects of the samples. Including indium atoms altered the bond networks, favoring the formation of Te-In bonds over less stable homopolar Te-Te bonds. This substitution led to an increase in the average bond energy and, consequently, the overall stability of the material. As a result, the energy required for evaporation increased with the indium content, further contributing to the thermal robustness of the material.

Author Contributions

Conceptualization, A.Z. and V.I.; Methodology, A.Z.; Formal analysis, A.Z.; Investigation, A.Z., V.I. and P.P.; Resources, A.Z. and V.I.; Writing—original draft, A.Z.; Writing—review & editing, V.I.; Visualization, V.I.; Supervision, P.P.; Funding acquisition, P.P. All authors have read and agreed to the published version of the manuscript.

Funding

This research was funded by European Union–Next Generation EU, through the National Recovery and Resilience Plan of the Republic of Bulgaria, project № BG-RRP-2.004-0002, “BiOrgaMCT”.

Data Availability Statement

All the data underlying the results are available as part of this article, and no additional source data are required.

Conflicts of Interest

The authors declare no conflict of interest.

References

  1. Wang, Y.; Chen, W.; Wang, P.; Dai, S.; Li, J.; Li, Y.; Fu, Q.; Dai, T.; Yu, H.; Yang, J. Ultra-high-power-confinement-factor integrated mid-infrared gas sensor based on the suspended slot chalcogenide glass waveguide. Sens. Actuators B Chem. 2021, 347, 130466. [Google Scholar] [CrossRef]
  2. Oke, J.A.; Olotu, O.O.; Jen, T.-C. Atomic layer deposition of chalcogenide thin films: Processes film properties, applications, and bibliometric prospect. J. Mater. Res. Technol. 2022, 20, 991–1019. [Google Scholar] [CrossRef]
  3. Halenkovič, T.; Baillieul, M.; Gutwirth, J.; Němec, P.; Nazabal, V. Amorphous Ge-Sb-Se-Te chalcogenide films fabrication for potential environmental sensing and nonlinear photonics. J. Mater. 2022, 8, 1009–1019. [Google Scholar] [CrossRef]
  4. Yang, Y.; Ge, K.; Tao, P.; Dai, S.; Wang, X.; Zhang, W.; Xu, T.; Wang, Y.; Lin, T.-J.; Zhang, P. Mid-infrared evanescent wave sensor based on side-polished chalcogenide fiber. Ceram. Int. 2023, 49, 1291–1297. [Google Scholar] [CrossRef]
  5. Zhang, B.; Zhai, C.; Qi, S.; Guo, W.; Yang, Z.; Yang, A.; Gai, X.; Yu, Y.; Wang, R.; Tang, D.; et al. High-resolution chalcogenide fiber bundles for infrared imaging. Opt. Lett. 2015, 40, 4384. [Google Scholar] [CrossRef] [PubMed]
  6. Anderson, L.E.; Kleine, T.S.; Zhang, Y.; Phan, D.D.; Namnabat, S.; LaVilla, E.A.; Konopka, K.M.; Diaz, L.R.; Manchester, M.S.; Schwiegerling, J.; et al. Chalcogenide Hybrid Inorganic/Organic Polymers: Ultrahigh Refractive Index Polymers for Infrared Imaging. ACS Macro Lett. 2017, 6, 500–504. [Google Scholar] [CrossRef] [PubMed]
  7. Yang, C.; Feng, S.; Yu, Y.; Shen, J.; Wei, X.; Shi, H. Electrochemical epitaxial (200) PbSe submicron-plates on single-layer graphene for an ultrafast infrared response. J. Mater. Chem. C 2021, 9, 6536–6543. [Google Scholar] [CrossRef]
  8. Nakotte, T.; Luo, H.; Pietryga, J. PbE (E = S Se) Colloidal Quantum Dot-Layered 2D Material Hybrid Photodetectors. Nanomaterials 2020, 10, 172. [Google Scholar] [CrossRef] [PubMed]
  9. Cao, T.; Cen, M. Fundamentals and Applications of Chalcogenide Phase-Change Material Photonics. Adv. Theory Simul. 2019, 2, 1900094. [Google Scholar] [CrossRef]
  10. Wuttig, M.; Bhaskaran, H.; Taubner, T. Phase-change materials for nonvolatile photonic applications. Nat. Photonics 2017, 11, 465–476. [Google Scholar] [CrossRef]
  11. Abdollahramezani, S.; Hemmatyar, O.; Taghinejad, H.; Krasnok, A.; Kiarashinejad, Y.; Zandehshahvar, M.; Alù, A.; Adibi, A. Tunable nanophotonics enabled by chalcogenide phase-change materials. Nanophotonics 2020, 9, 1189–1241. [Google Scholar] [CrossRef]
  12. Ríos, C.; Stegmaier, M.; Hosseini, P.; Wang, D.; Scherer, T.; Wright, C.D.; Bhaskaran, H.; Pernice, W.H.P. Integrated all-photonic nonvolatile multi-level memory. Nat. Photonic 2015, 9, 725–732. [Google Scholar] [CrossRef]
  13. Farmakidis, N.; Youngblood, N.; Li, X.; Tan, J.; Swett, J.L.; Cheng, Z.; Wright, C.D.; Pernice, W.H.P.; Bhaskaran, H. Plasmonic nanogap enhanced phase-change devices with dual electrical-optical functionality. Sci. Adv. 2019, 5, eaaw2687. [Google Scholar] [CrossRef] [PubMed]
  14. Gemo, E.; Faneca, J.; Carrillo, S.G.-C.; Baldycheva, A.; Pernice, W.H.P.; Bhaskaran, H.; Wright, C.D. A plasmonically enhanced route to faster and more energy-efficient phase-change integrated photonic memory and computing devices. J. Appl. Phys. 2021, 129, 110902. [Google Scholar] [CrossRef]
  15. Wong, P.H.-S.; Raoux, S.; Kim, S.; Liang, J.; Reifenberg, J.P.; Rajendran, B.; Asheghi, M.; Goodson, K.E. Phase change memory. Proc. IEEE 2010, 98, 2201–2227. [Google Scholar] [CrossRef]
  16. Rudé, M.; Pello, J.; Simpson, R.E.; Osmond, J.; Roelkens, G.; van der Tol, J.J.G.M.; Pruneri, V. Optical switching at 1.55 µm in silicon racetrack resonators using phase change materials. Appl. Phys. Lett. 2013, 103, 141119. [Google Scholar] [CrossRef]
  17. Rios, C.; Stegmaier, M.; Cheng, Z.; Youngblood, N.; Wright, C.D.; Pernice, W.H.P.; Bhaskaran, H. Controlled switching of phase-change materials by evanescent-field coupling in integrated photonics [Invited]. Opt. Mater. Express 2018, 8, 2455. [Google Scholar] [CrossRef]
  18. Stegmaier, M.; Ríos, C.; Bhaskaran, H.; Wright, C.D.; Pernice, W.H.P. Nonvolatile, All-Optical 1 2 Switch for Chipscale Photonic Networks. Adv. Opt. Mater. 2016, 5, 1600346. [Google Scholar] [CrossRef]
  19. Bendiab, A.T.; Bathily, M.; Vigreux, C.; Escalier, R.; Pradel, A.; Kribich, R.K.; Bendoula, R. Chalcogenide rib waveguides for the characterization of spray deposits. Opt. Mater. 2018, 86, 298–303. [Google Scholar] [CrossRef]
  20. Tewari, A.; Kumar, A.; Saini, T.S.; Sinha, R.K. Design of As2Se3 based chalcogenide ridge waveguide for generation of slow light. Optik 2016, 127, 11816–11822. [Google Scholar] [CrossRef]
  21. Shi, Y.; Xu, P.; Yu, Z.; Shen, X.; Nie, Q. Rib chalcogenide glass waveguide with simultaneous dispersion flatting for both transverse electric and magnetic modes. Optik 2017, 138, 433–439. [Google Scholar] [CrossRef]
  22. Byrnes, A.; Pant, R.; Li, E.; Choi, D.-Y.; Poulton, C.G.; Fan, S.; Madden, S.; Luther-Davies, B.; Eggleton, B.J. Photonic chip based tunable and reconfigurable narrowband microwave photonic filter using stimulated Brillouin scattering. Opt. Express 2012, 20, 18836. [Google Scholar] [CrossRef] [PubMed]
  23. Eggleton, B.J.; Vo, T.D.; Pant, R.; Schr, J.; Pelusi, M.D.; Choi, D.Y.; Madden, S.J.; Luther-Davies, B. Photonic chip based ultrafast optical processing based on high nonlinearity dispersion engineered chalcogenide waveguides. Laser Photonics Rev. 2011, 6, 97–114. [Google Scholar] [CrossRef]
  24. Hu, L.; Huang, S.; Patterson, R.; Halpert, J.E. Enhanced mobility in PbS quantum dot films via PbSe quantum dot mixing for optoelectronic applications. J. Mater. Chem. C 2019, 7, 4497–4502. [Google Scholar] [CrossRef]
  25. Heenkenda, R.; Sarangan, A. Design principles of tunable optical filters using phase change materials. In Proceedings of the International Workshop on Thin Films for Electronics, Electro-Optics, Energy and Sensors, Boston, MA, USA, 10–12 August 2022; SPIE: Bellingham, DC, USA, 2023; Volume 12477. [Google Scholar] [CrossRef]
  26. Tripathi, D.; Vyas, H.; Kumar, S.; Panda, S.; Hegde, R. Recent developments in Chalcogenide phase change material-based nanophotonics. Nanotechnology 2023, 34, 502001. [Google Scholar] [CrossRef] [PubMed]
  27. Burrow, J.; Toussaint, K.; Sarangan, A.; Agha, I. Reconfigurable opto-chirality enabled by chalcogenide phase change nanomaterials. In Proceedings of the International Workshop on Thin Films for Electronics, Electro-Optics, Energy and Sensors, Boston, MA, USA, 10–12 August 2022; SPIE: Bellingham, DC, USA, 2023; Volume 12477. [Google Scholar] [CrossRef]
  28. Joshi, S. Peculiarities of electrical switching and phase transition dynamics in bismuth-infused Se–Te chalcogenide glasses: From bulk to thin film devices. Acs Appl. Electron. Mater. 2024, 6, 3574–3588. [Google Scholar] [CrossRef]
  29. Kim, H.J.; Julian, M.; Williams, C.; Bombara, D.; Hu, J.; Gu, T.; Aryana, K.; Sauti, G.; Humphreys, W. Versatile spaceborne photonics with chalcogenide phase-change materials. NPJ Microgravity 2024, 10, 20. [Google Scholar] [CrossRef] [PubMed]
  30. Attar, R.; Sawant, R.; Pandey, S.; Joglekar, P.; Mondal, S.; Kulkarni, S.; Behera, J. Design of tunable far-infrared plasmonic absorber based on chalcogenide phase change materials. J. Phys. Conf. Ser. 2023, 2426, 012068. [Google Scholar] [CrossRef]
  31. Prabhathan, P.; Sreekanth, K.; Teng, J.; Ko, J.; Yoo, Y.; Jeong, H.; Zhang, S.; Cao, T.; Popescu, C.; Mills, B.; et al. Roadmap for phase change materials in photonics and beyond. iScience 2023, 26, 107946. [Google Scholar] [CrossRef]
  32. Yan, A.; Wang, C.; Yan, J.; Wang, Z.; Zhang, E.; Dong, Y.; Yan, Z.-Y.; Lu, T.; Cui, T.; Li, D.; et al. Thin-film transistors for integrated circuits: Fundamentals and recent progress. Adv. Funct. Mater. 2024, 34, 2304409. [Google Scholar] [CrossRef]
  33. Swanepoel, R. Determination of the thickness and optical constants of amorphous silicon. J. Phys. E Sci. Instrum. 1983, 16, 1214–1222. [Google Scholar] [CrossRef]
Figure 1. Simplified schema of apparatus for vacuum thermal evaporation.
Inorganics 12 00209 g001
Figure 2. Typical XRD pattern of selected (a) (GeTe4)100−xInx and (b) (GeTe5)100−xInx. X-ray diffraction patterns show no peaks and have broad halos, which confirms the amorphous nature of the prepared samples.
Inorganics 12 00209 g002
Figure 3. Heat flow as a function of temperature (DSC patterns) of (a) ( G e T e 4 ) 100 x I n x and (b) ( G e T e 5 ) 100 x I n x chalcogenide glasses at a heating rate of 10 K/min.
Inorganics 12 00209 g003
Figure 4. Evaporation rate of selected (a) ( G e T e 4 ) 100 x I n x and (b) ( G e T e 5 ) 100 x I n x chalcogenide glasses at a heating rate of 10 K/min.
Inorganics 12 00209 g004
Figure 5. Linear plot of l n ( V e T e 1 / 2 ) = f ( 1 / T e ) for (a) ( G e T e 4 ) 100 x   I n x and (b) ( G e T e 5 ) 100 x   I n x chalcogenide glasses at a heating rate of 10 K/min.
Inorganics 12 00209 g005
Figure 6. Transmission spectra of chalcogenides (a) (GeTe4)100−xInx with x = 0, 5, 10, 15, 20 at% and (b) (GeTe5)100−xInx with x = 0, 5, 10, 15, 20 at% (opaque in the visible region) in the range from 1000 nm to 2600 nm.
Inorganics 12 00209 g006
Figure 7. Top-view field emission–scanning electron microscopy micrographs of prepared thin film.
Inorganics 12 00209 g007
Table 1. Onset temperature of crystallization T c , the peak temperature of crystallization T c , p , and peak temperature in the melting signal T m of chalcogenide of ( G e T e 4 ) 100 x I n x and ( G e T e 5 ) 100 x I n x with x = 0, 5, 10, 15, and 20 at% (heating rate: 10 K/min).
Composition Z T c ± 0.5 (K) T c , p ± 0.5 (K) T m ± 0.5 (K)
G e T e 4 2.40481.8487.7648.7
( G e T e 4 ) 95   I n 5 2.43492.7499.7645.6
( G e T e 4 ) 90   I n 10 2.46476.6500.7641.6
( G e T e 4 ) 85   I n 15 2.49469.7483.6640.7
( G e T e 4 ) 80   I n 20 2.52477.5500.4640.6
G e T e 5 2.34478.6497.7649.6
( G e T e 5 ) 95   I n 5 2.37480.7498.6644.7
( G e T e 5 ) 90   I n 10 2.40478.7488.6642.7
( G e T e 5 ) 85   I n 15 2.43476.6490.7642.6
( G e T e 5 ) 80   I n 20 2.47478.7497.6640.7
Table 2. Evaporation energy values of chalcogenide glasses of ( G e T e 4 ) 100 x I n x and ( G e T e 5 ) 100 x I n x with x = 0, 5, 10, 15, and 20 at%.
CompositionSlope Q e
G e T e 4 20.184167.819 ± 0.622
( G e T e 4 ) 95 I n 5 21.749180.831 ± 0.816
( G e T e 4 ) 90 I n 10 22.627188.131 ± 0.709
( G e T e 4 ) 85 I n 15 23.615196.346 ± 0.708
( G e T e 4 ) 80 I n 20 24.291201.967 ± 0.735
G e T e 5 18.634154.932 ± 0.683
( G e T e 5 ) 95 I n 5 19.682163.645 ± 0.659
( G e T e 5 ) 90 I n 10 20.935174.063 ± 0.640
( G e T e 5 ) 85 I n 15 22.102183.733 ± 0.733
( G e T e 5 ) 80 I n 20 23.581196.063 ± 0.769
Disclaimer/Publisher’s Note: The statements, opinions and data contained in all publications are solely those of the individual author(s) and contributor(s) and not of MDPI and/or the editor(s). MDPI and/or the editor(s) disclaim responsibility for any injury to people or property resulting from any ideas, methods, instructions or products referred to in the content.

