

Nickel Ions Activated PbO–GeO2 Glasses for the Application of Electrolytes and Photonic Devices

 , and
, and
Abstract
1. Introduction
2. Results
3. Discussion
4. Experimental Procedure
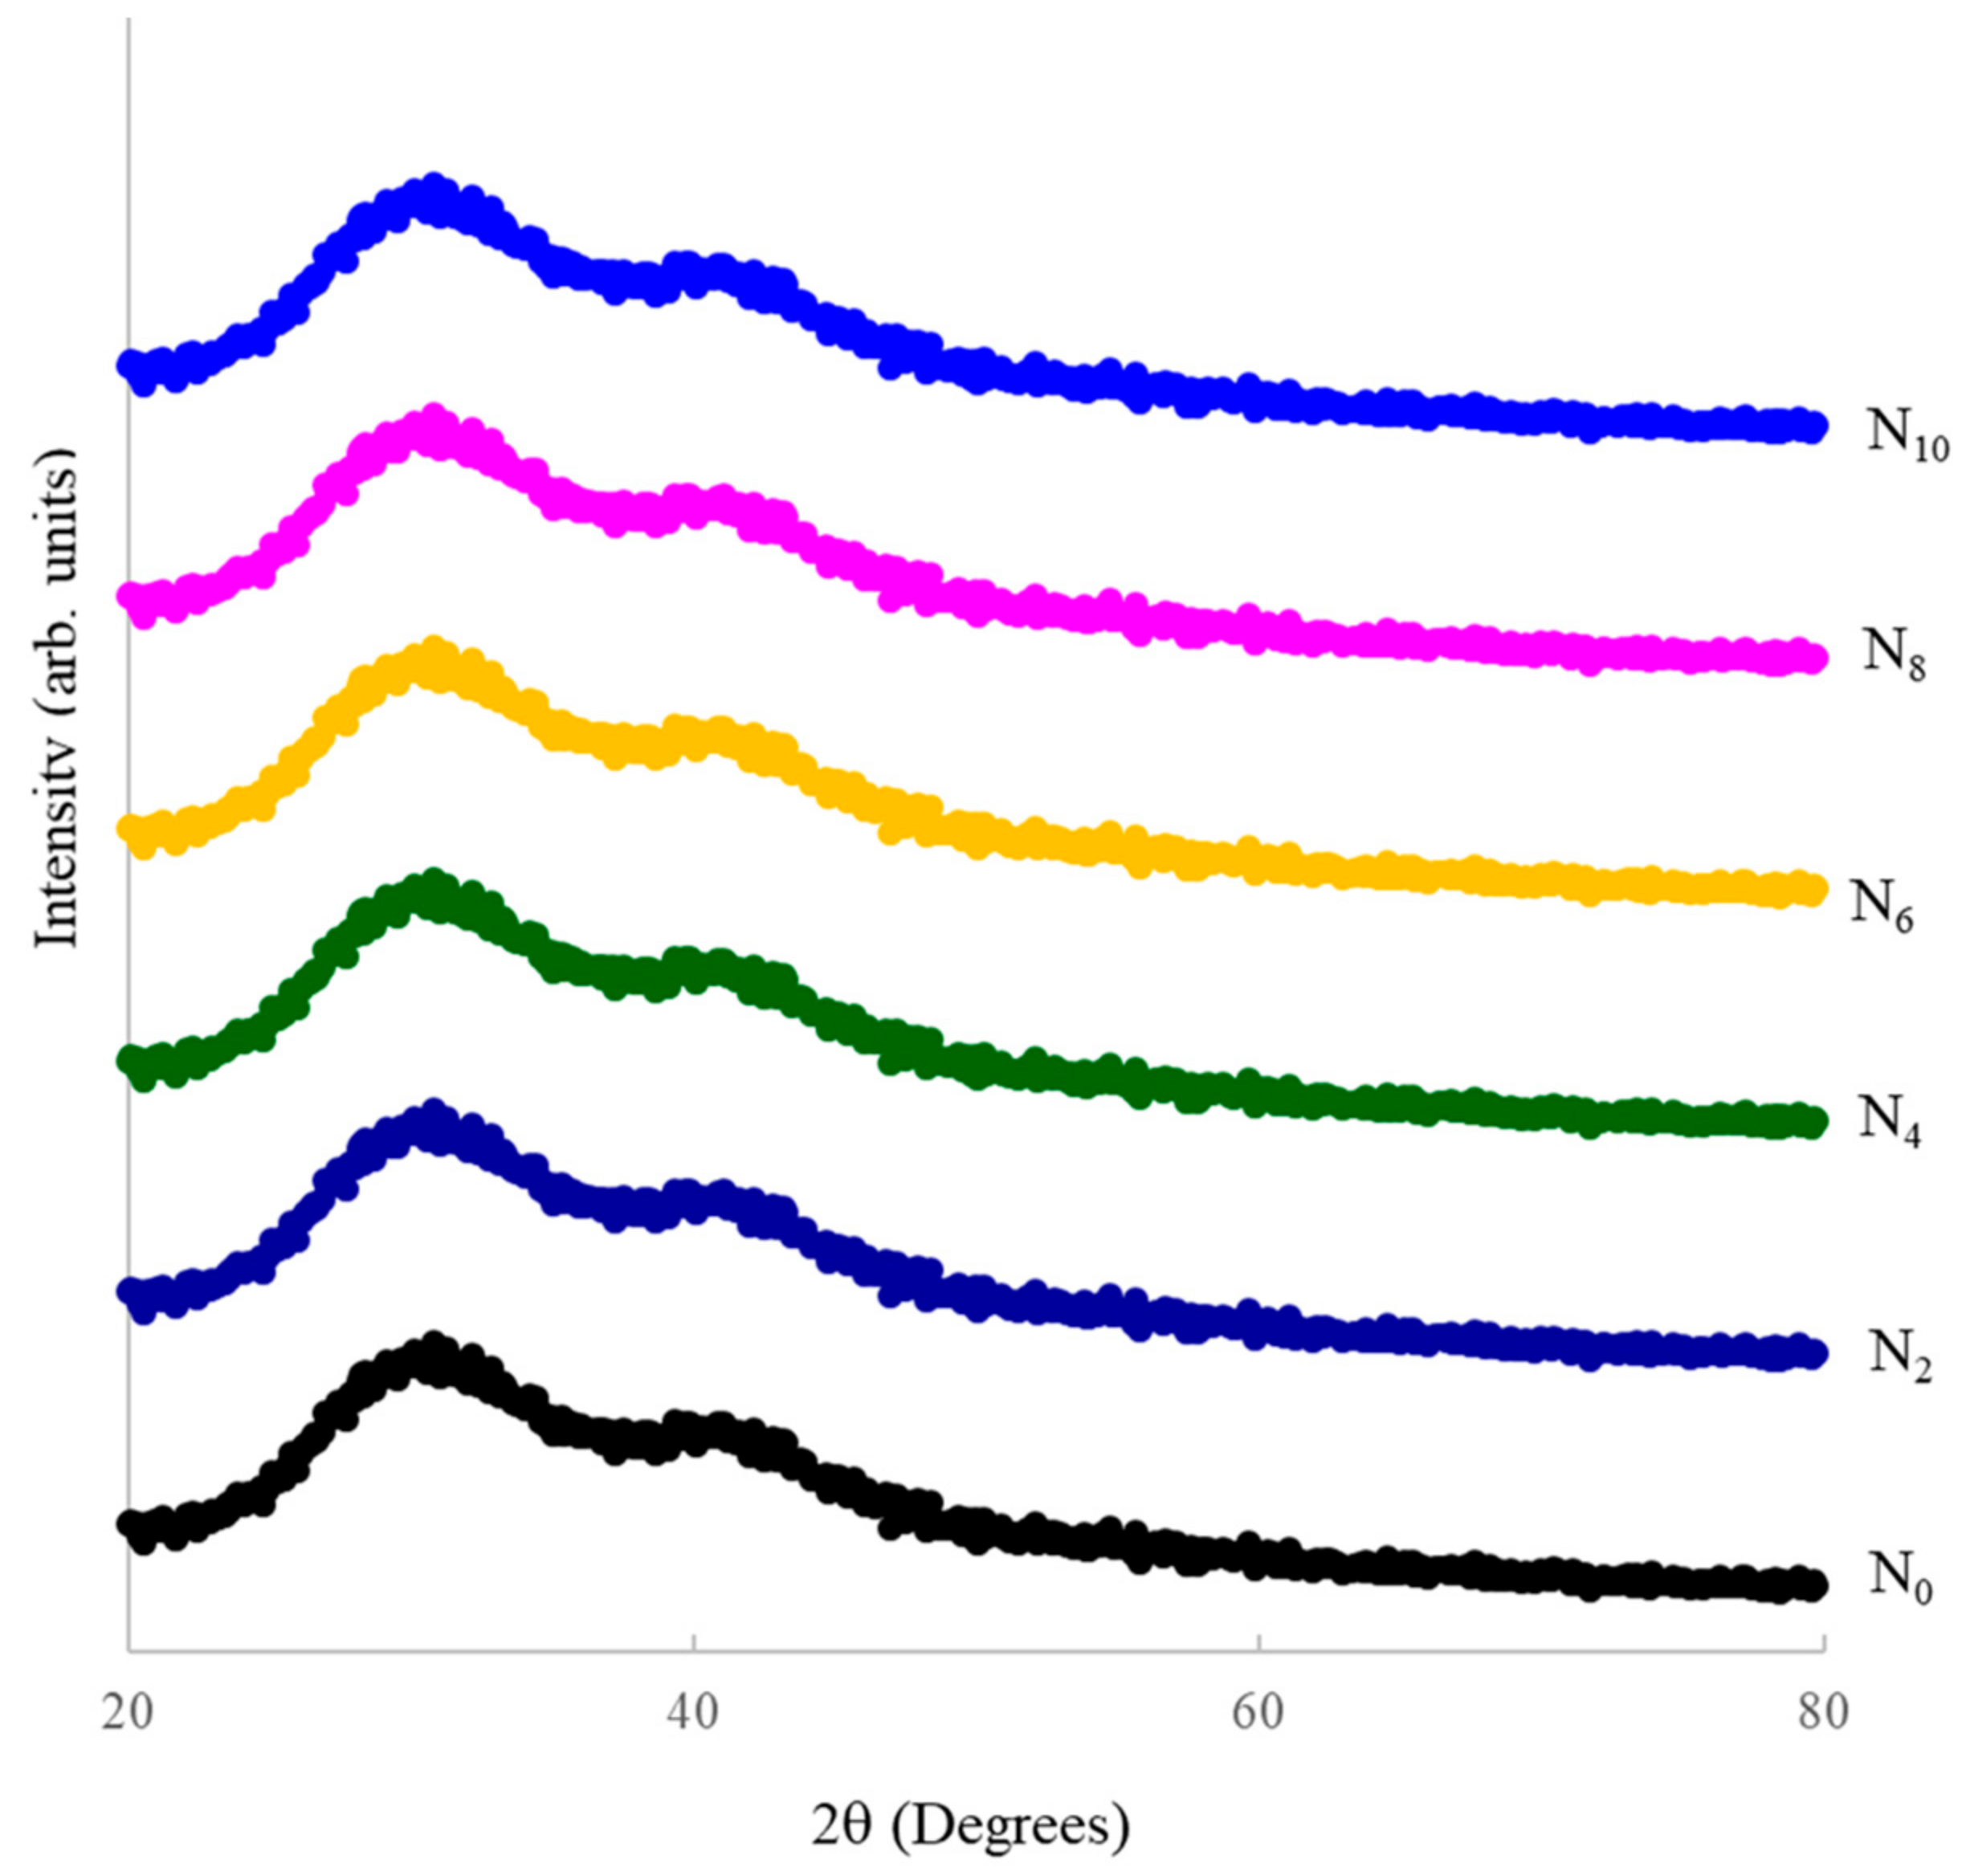
- N0: 40PbO-60GeO2
- N2: 40PbO-59.8GeO2: 0.2NiO
- N4: 40PbO-59.6GeO2: 0.4NiO
- N6: 40PbO-59.4GeO2: 0.6NiO
- N8: 40PbO-59.2GeO2: 0.8NiO
- N10: 40PbO-59.0GeO2: 1.0NiO
5. Conclusions
Author Contributions
Funding
Data Availability Statement
Conflicts of Interest
References
- Rada, S.; Culea, M.; Neumann, M.; Culea, E. Structural role of europium ions in lead–borate glasses inferred from spectroscopic and DFT studies. Chem. Phys. Lett. 2008, 460, 196. [Google Scholar] [CrossRef]
- Pisarski, W.; Goryczka, T.; Wodecka-Dus, B.; Plonska, M.; Pisarska, J. Structure and properties of rare earth-doped lead borate glasses. Mater. Sci. Eng. B 2005, 122, 94. [Google Scholar] [CrossRef]
- El-Egili, K.; Doweidar, H.; Moustafa, Y.M.; Abbas, I. Structure and Some Physical Properties of PbO–P2O5 Glasses. Phys. B 2003, 339, 237. [Google Scholar] [CrossRef]
- Marcel, P. Advanced glasses. Ann. Chim. Sci. Matter 2003, 28, 87. [Google Scholar]
- Alderman, O.L.; Hannon, A.C.; Holland, D.; Umesaki, N. On the germanium–oxygen coordination number in lead germanate glasses. J. Non-Cryst. Solids 2014, 386, 56. [Google Scholar] [CrossRef]
- Nouadji, M.; Ivanova, Z.G.; Poulain, M.; Zavadil, J.; Attaf, A. Glass formation, physicochemical characterization and photoluminescence properties of new Sb2O3–PbO–ZnO and Sb2O3–PbO–ZnS systems. J. Alloy Compd. 2013, 549, 158. [Google Scholar] [CrossRef]
- Kashyap, R. Photosensitive Optical Fibers: Devices and Applications. Opt. Fiber Technol. 1994, 1, 17. [Google Scholar] [CrossRef]
- Zmojda, J.; Kochanowicz, M.; Miluski, P.; Golonko, P.; Baranowska, A.; Ragi, T.; Dorosz, J.; Kuwik, M.; Pisarski, W.; Pisarska, J.; et al. Luminescent Studies on Germanate Glasses Doped with Europium Ions for Photonic Applications. Materials 2020, 13, 2817. [Google Scholar] [CrossRef] [PubMed]
- Kuwik, M.; Kowalska, K.; Pisarska, J.; Pisarki, W.A. Spectroscopic properties of Pr3+, Tm3+, and Ho3+ in Germenate based Glass Systems modified by TiO2. Materials 2023, 16, 61. [Google Scholar] [CrossRef]
- Zelniok, D.; Cramer, C.; Eckert, H. Structure/Property Correlations in Ion-Conducting Mixed-Network Former Glasses: Solid-State NMR Studies of the System Na2O−B2O3−P2O5. Chem. Mater. 2007, 19, 3162. [Google Scholar] [CrossRef]
- Iezid, M.; Legouera, M.; Goumeidane, F.; Poulain, M.; Nazabal, V.; Lebullenger, R. Glass formation in the Sb2O3–CdCl2–SrCl2 ternary system. J. Non-Cryst. Solids 2011, 357, 2984. [Google Scholar] [CrossRef]
- Loiko, P.; Dymshits, O.; Zhilin, A.; Alekseeva, I.; Yumashev, K. Influence of NiO on phase transformations and optical properties of ZnO–Al2O3–SiO2 glass–ceramics nucleated by TiO2 and ZrO2. Part II. Optical absorption and luminescence. J. Non. Cryst. Solids 2013, 376, 99. [Google Scholar] [CrossRef]
- Greaves, G.N.; Sen, S. Inorganic glasses, glass-forming liquids and amorphizing solids. Adv. Phys. 2007, 56, 1. [Google Scholar] [CrossRef]
- Mysen, B.O.; Richet, P. Silicate Glasses and Melts: Properties and Structure; Elsevier: Amsterdam, The Netherlands, 2005. [Google Scholar]
- Keppler, H.; Bagdassarov, N. The speciation of Ni and Co in silicate melts from optical absorption spectra to 1500 C. Chem. Geol. 1999, 158, 105. [Google Scholar] [CrossRef]
- Reddy, M.S.; Krishna, G.M.; Veeraiah, N. Spectroscopic and magnetic studies of manganese ions in ZnO–Sb2O3–B2O3 glass system. J. Phys. Chem. Solids 2006, 67, 789. [Google Scholar] [CrossRef]
- Nassau, K. The material dispersion zero in infrared optical waveguide materials. Bell Syst. Technol. J. 1981, 60, 327. [Google Scholar] [CrossRef]
- Mc Cubbin, T.K., Jr.; Atmosoekarto, S.; Withstandley, V. Infrared Spectroscopy with a Copper-Doped Germanium Detector. Appl. Opt. 1967, 6, 1131. [Google Scholar] [CrossRef]
- SrinivasaReddy, M.; Prasad, S.V.G.V.A.; Veeraiah, N. Valence and coordination of chromium ions in ZnO–Sb2O3–B2O3 glass system by means of spectroscopic and dielectric relaxation studies. Phys. Status Solidi A 2007, 204, 816. [Google Scholar] [CrossRef]
- Tagiara, N.S.; Chatzipanagis, K.I.; Bradtmuller, H.; Rodrigues, A.C.M.; Moncke, D.; Kamitos, E.I. Network former mixing effects in alkali germanotellurite glasses: A vibrational spectroscopic study. J. Alloys Compd. 2021, 882, 160782. [Google Scholar] [CrossRef]
- Rada, S.; Erhan, R.V.; Bodnarchuk, V.; Barbu-Tudoran, L.; Culea, E. SANS, RAMAN and SEM studies of lead-germanate glasses doped with the manganese oxide. J. Alloys Compd. 2021, 882, 160721. [Google Scholar] [CrossRef]
- Mattos, G.R.S.; Bordon, C.D.S.; Kassab, L.R.P.; Issa, S.A.; ALMisned, G.; Tekin, H.O. Towards obtaining the optimum physical, optical, and nuclear radiation attenuation behaviours of tellurite-germanate glasses through Eu2O3 reinforcement: Glass synthesis, experimental and theoretical characterization study. Ceram. Int. 2023, 49, 986. [Google Scholar] [CrossRef]
- Pipes, R.S.; Shelby, J.E. Formation and properties of soda lime germanate glasses. J. Non-Cryst. Solids 2021, 553, 120506. [Google Scholar] [CrossRef]
- Falci, R.F.; Guerineau, T.; Delarosbil, J.L.; Messaddeq, Y. Spectroscopic properties of gallium-rich germane gallate glasses doped with Tm3+. J. Lumin. 2022, 249, 119014. [Google Scholar] [CrossRef]
- Jianga, X.P.; Yang, Z.M.; Liu, S.H. Energy transfer between Yb3+ and Er3+ in barium gallogermanate glass. J. Appl. Phys. 2009, 105, 103113. [Google Scholar] [CrossRef]
- Pisarska, J.; Sołtys, M.; Górny, A.; Kochanowicz, M.; Zmojda, J.; Dorosz, J.; Dorosz, D.; Sitarz, M.; Pisarski, W.A. Rare earthdoped barium gallo-germanate glasses and their near-infrared luminescence properties. Spectrochim. Acta A 2018, 201, 362–366. [Google Scholar] [CrossRef] [PubMed]
- Saffarini, G.; Saiter, J.M.; Matthiesen, J. Thaermal stability and percolation threshold of Ge-Se-Fe glasses. Mater. Lett. 2007, 61, 432–436. [Google Scholar] [CrossRef]
- Gandhi, Y.; Mohan, N.K.; Veeraiah, N. Role of nickel ion coordination on spectroscopic and dielectric properties of ZnF2–As2O3–TeO2: NiO glass system. J. Non-Cryst. Solids 2011, 357, 1193. [Google Scholar] [CrossRef]
- Kumar, G.R.; Rao, M.K.; Srikumar, T.; Rao, M.C.; Kumar, V.R.; Veeraiah, N.; Rao, C.S. Spectroscopic, dielectric dispersion and dc conductivity studies of Sb2O3 doped lithium fluoroborophosphate glasses mixed with small concentrations of NiO. J. Alloys Compd. 2018, 752, 179. [Google Scholar] [CrossRef]
- Teja, P.V.; Rajyasree, C.; Krishna, S.M.; Tirupataiah, C.; Rao, D.K. Effect of some VA group modifiers on R2O3 (R = Sb, Bi)–ZnF2–GeO2 glasses doped with CuO by means of spectroscopic and dielectric investigations. Mater. Chem. Phys. 2012, 133, 239. [Google Scholar] [CrossRef]
- Beattie, I.R.; Livingston, K.M.S.; Ozin, G.A.; Renolds, D.J. Single-crystal Raman spectra of arsenolite (As4O6) and senarmonite (Sb4O6). The gas-phase Raman spectra of P4O6, P4O10, and As4O6. J. Chem. Soc. A 1970, 449–451. [Google Scholar] [CrossRef]
- Galeener, F.L.; Geissberger, A.E.; Ogar, G.W.; Loehman, R.E. Vibrational dynamics in isotopically substituted vitreous GeO2. Phys. Rev. B 1983, 28, 4768. [Google Scholar] [CrossRef]
- Lee, J.D. Concise Inorganic Chemistry, 5th ed.; Blackwell Science Ltd.: Hoboken, NJ, USA, 1996. [Google Scholar]
- Brown, A.; Gupta, V. Coordination environments of Ni2+ in germinate glass matrices. Opt. Mater. 2018, 36, 1262–1266. [Google Scholar]
- Suresh, B.; Reddy, M.S.; Reddy, A.S.S.; Gandhi, Y.; Kumar, V.R.; Veeraiah, N. Spectroscopic features of Ni2+ ion in PbO–Bi2O3–SiO2 glass system. Spectrochim. Acta Part A Mol. Biomol. Spectrosc. 2015, 141, 263. [Google Scholar] [CrossRef] [PubMed]
- Gao, G.; Reibstein, S.; Spiecker, E.; Peng, M.; Wondraczek, L. Broadband NIR photoluminescence from Ni2+-doped nanocrystalline Ba–Al titanate glass ceramics. J. Mater. Chem. 2012, 22, 2582. [Google Scholar] [CrossRef]
- Austin, I.G.; Mott, N.F. Polarons in crystalline and non-crystalline materials. Adv. Phys. 1969, 18, 657. [Google Scholar] [CrossRef]


| Glass Sample | Density d (g/cm3) | Molar Volume Vm (cm3) | Nickel Ion Conc. Ni (×1021/cm3) | Inter-Ionic Distance of Nickel Ions Ri (Å) | Polaron Radius Rp (Å) |
|---|---|---|---|---|---|
| N0 | 5.56 | 0.520 | -- | -- | -- |
| N2 | 6.035 | 0.886 | 4.78 | 5.93 | 2.39 |
| N4 | 6.054 | 0.586 | 9.60 | 4.70 | 1.89 |
| N6 | 6.072 | 0.953 | 14.44 | 4.10 | 1.654 |
| N8 | 6.08 | 1.008 | 19.29 | 3.72 | 1.50 |
| N10 | 6.15 | 0.908 | 24.41 | 3.44 | 1.38 |
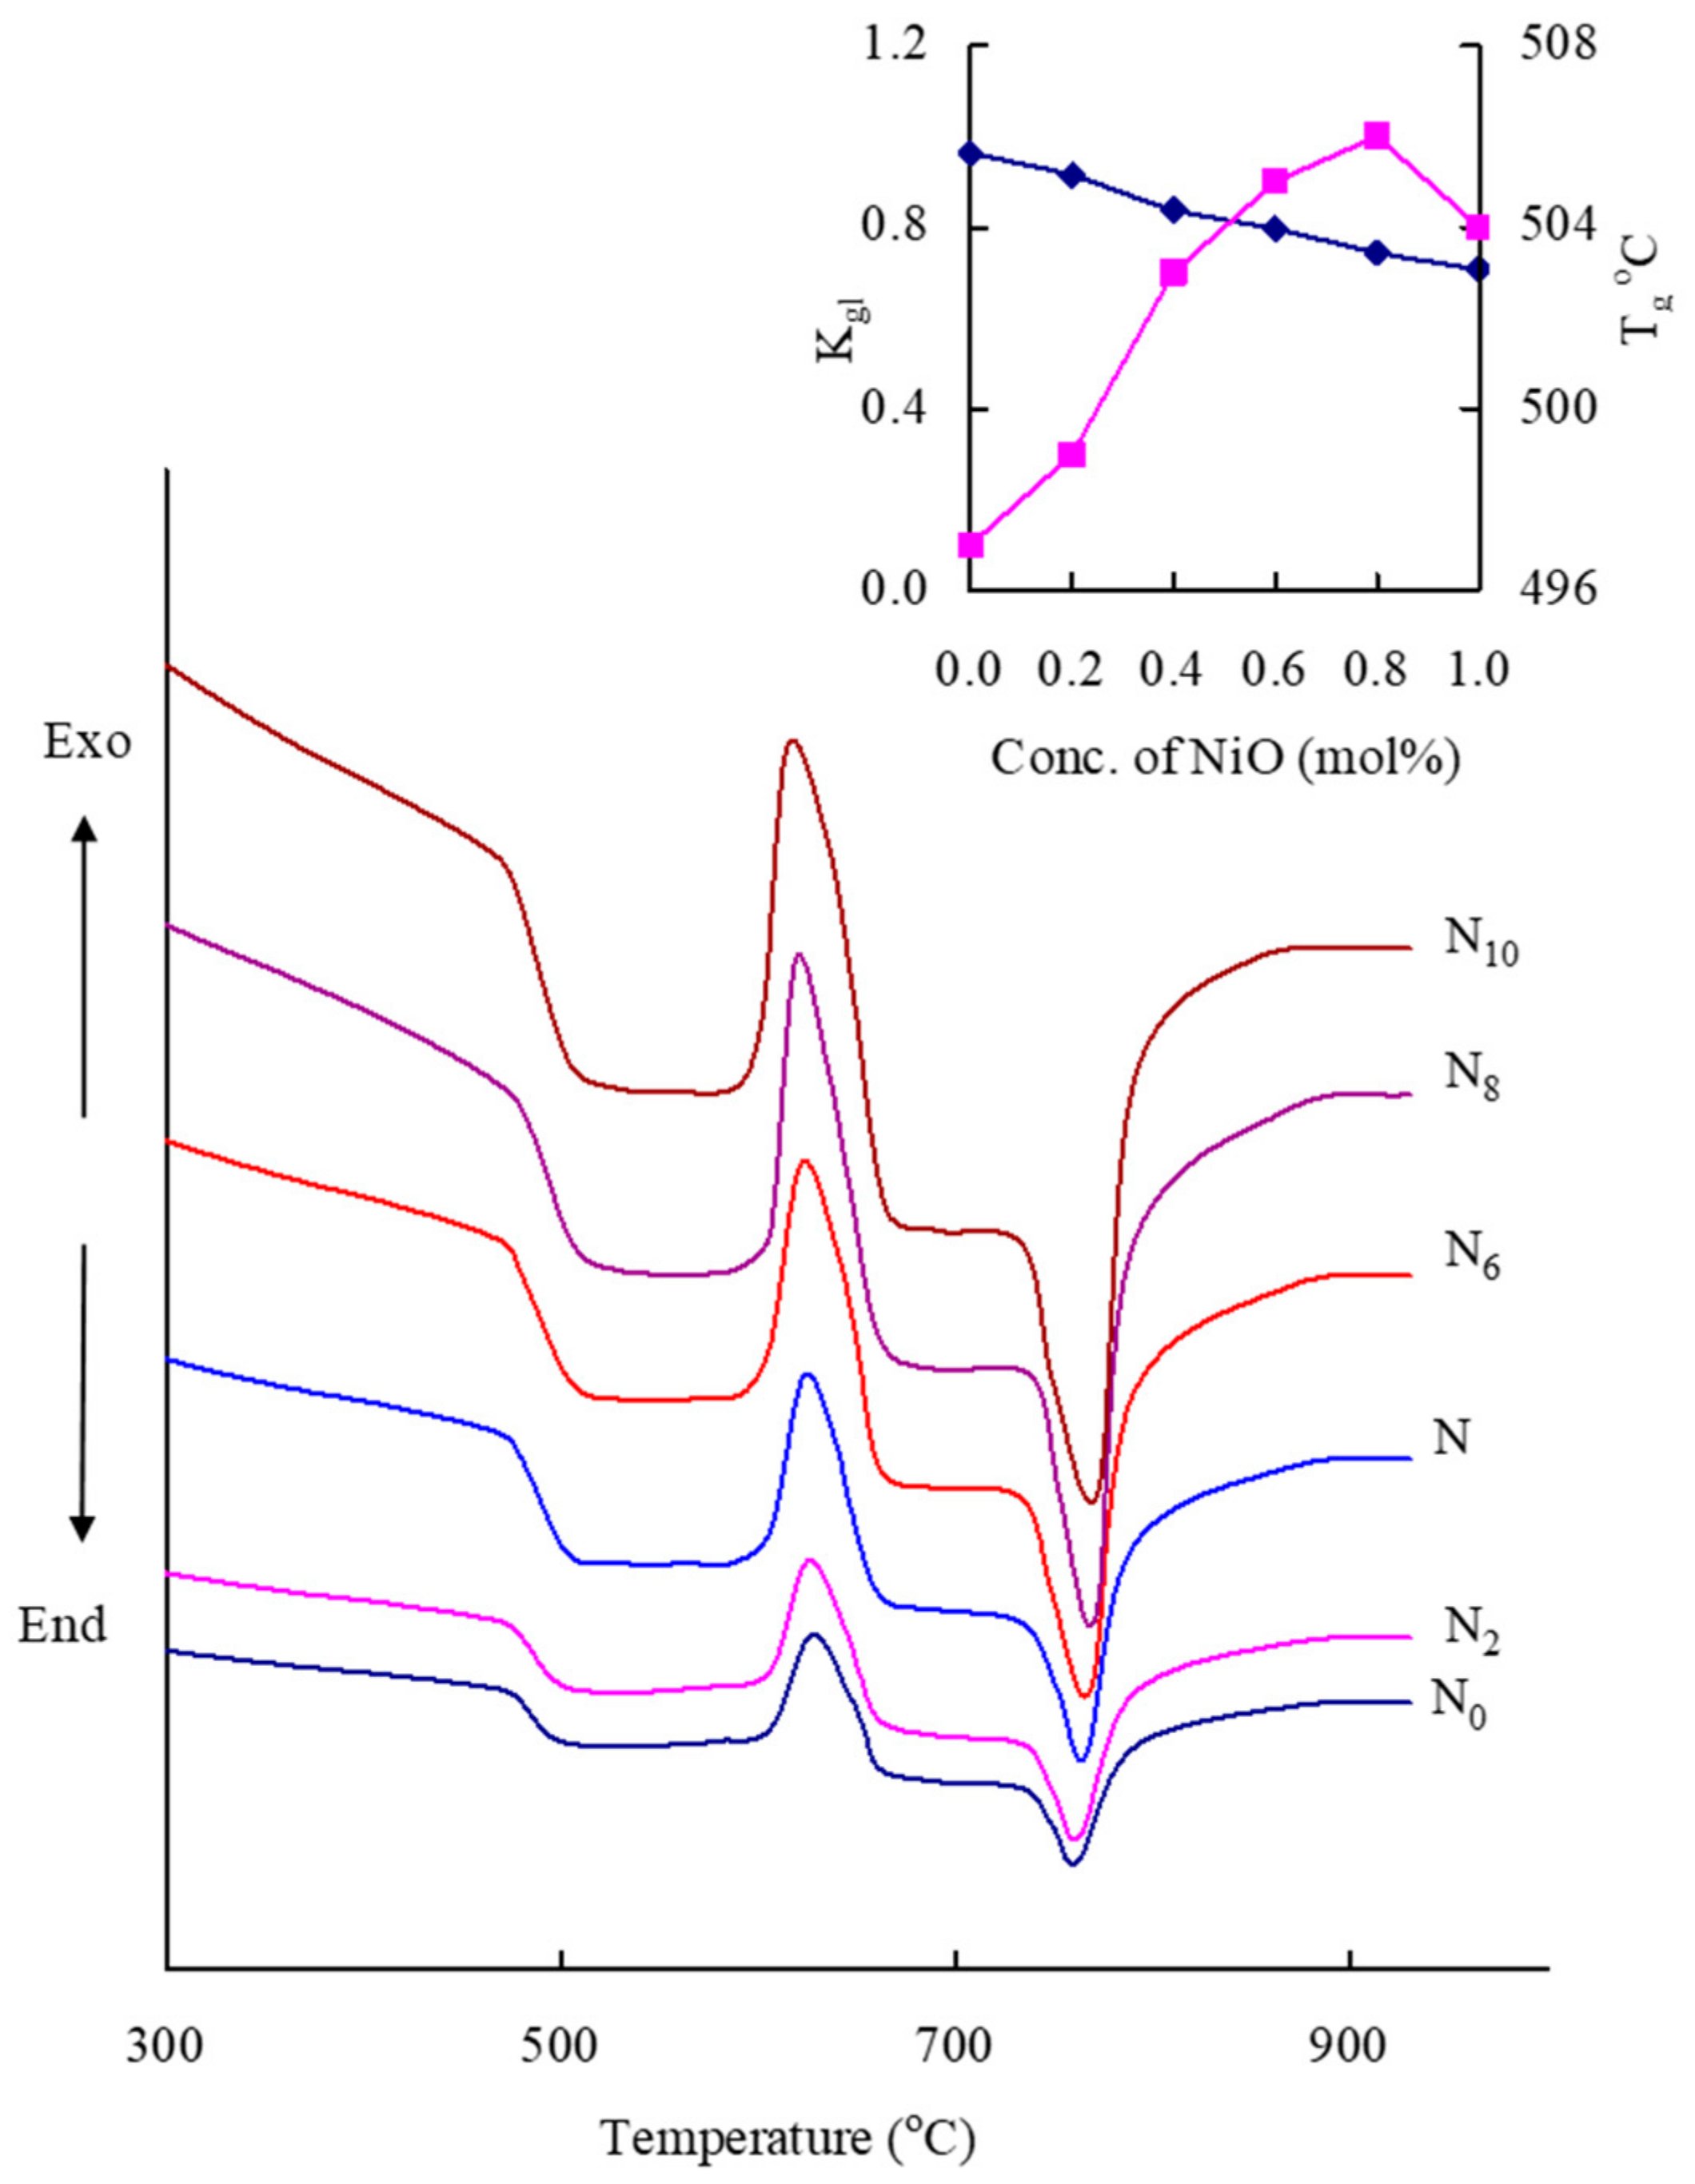
| Glass | Tg (°C) | Tc (°C) | Tm (°C) | Tc − Tg (°C) | Kgl = (Tc − Tg)/(Tm − Tc) |
|---|---|---|---|---|---|
| N0 | 497 | 627 | 762 | 130 | 0.963 |
| N2 | 499 | 625 | 763 | 126 | 0.913 |
| N4 | 503 | 623 | 766 | 120 | 0.834 |
| N6 | 505 | 622 | 769 | 117 | 0.796 |
| N8 | 506 | 619 | 771 | 113 | 0.743 |
| N10 | 504 | 615 | 772 | 111 | 0.707 |
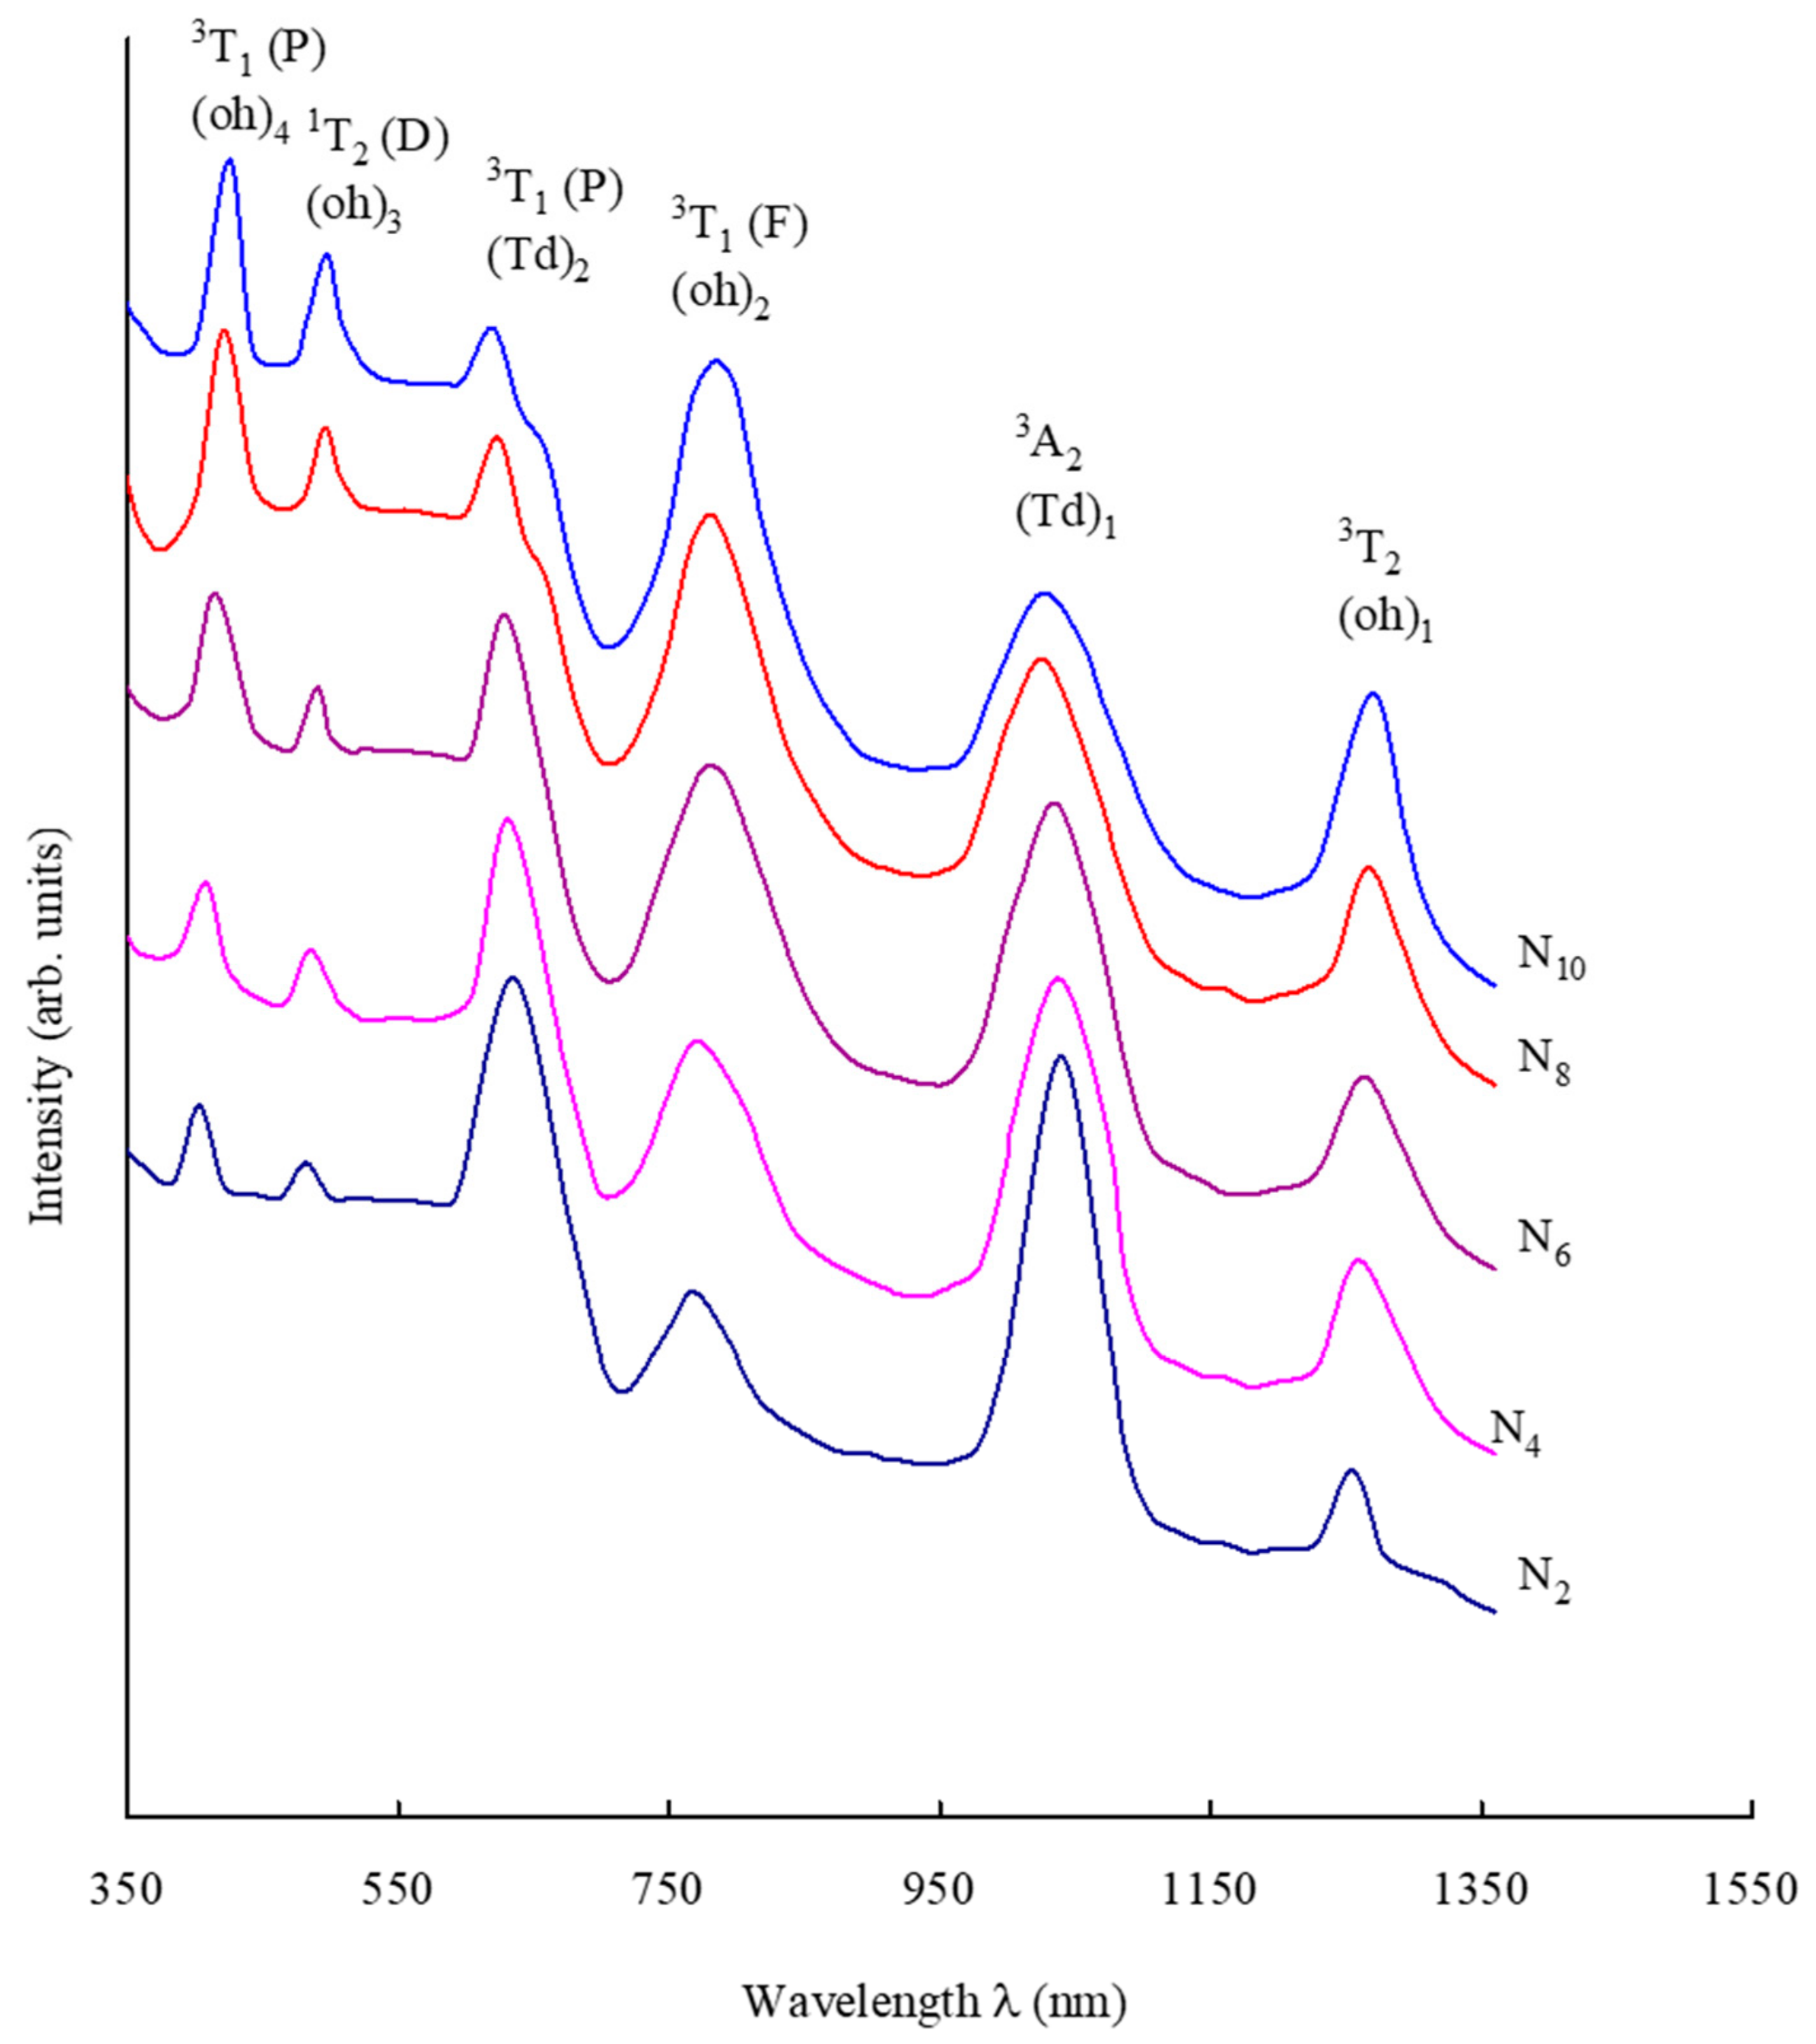
| Band Position (nm) | N2 | N4 | N6 | N8 | N10 |
|---|---|---|---|---|---|
| Ni2+ band positions, octahedral transitions (nm) 3A2(F) → 3T2(F) | 1254 | 1258 | 1262 | 1265 | 1269 |
| 3A2(F) → 3T1(F) | 769 | 771 | 774 | 781 | 784 |
| 3T2(F) → 1T2(D) | 482 | 484 | 490 | 495 | 497 |
| 3A2(F) → 3T1(P) | 403 | 408 | 415 | 421 | 425 |
| Ni2+ band positions, tetrahedral transitions (nm) 3A2(F) → 3A2(F) | 1040 | 1038 | 1034 | 1029 | 1024 |
| 3A2(F) → 3T1(F) | 635 | 631 | 628 | 623 | 620 |
| Optical band gap Eo (eV) | 2.58 | 2.51 | 2.36 | 2.32 | 2.27 |
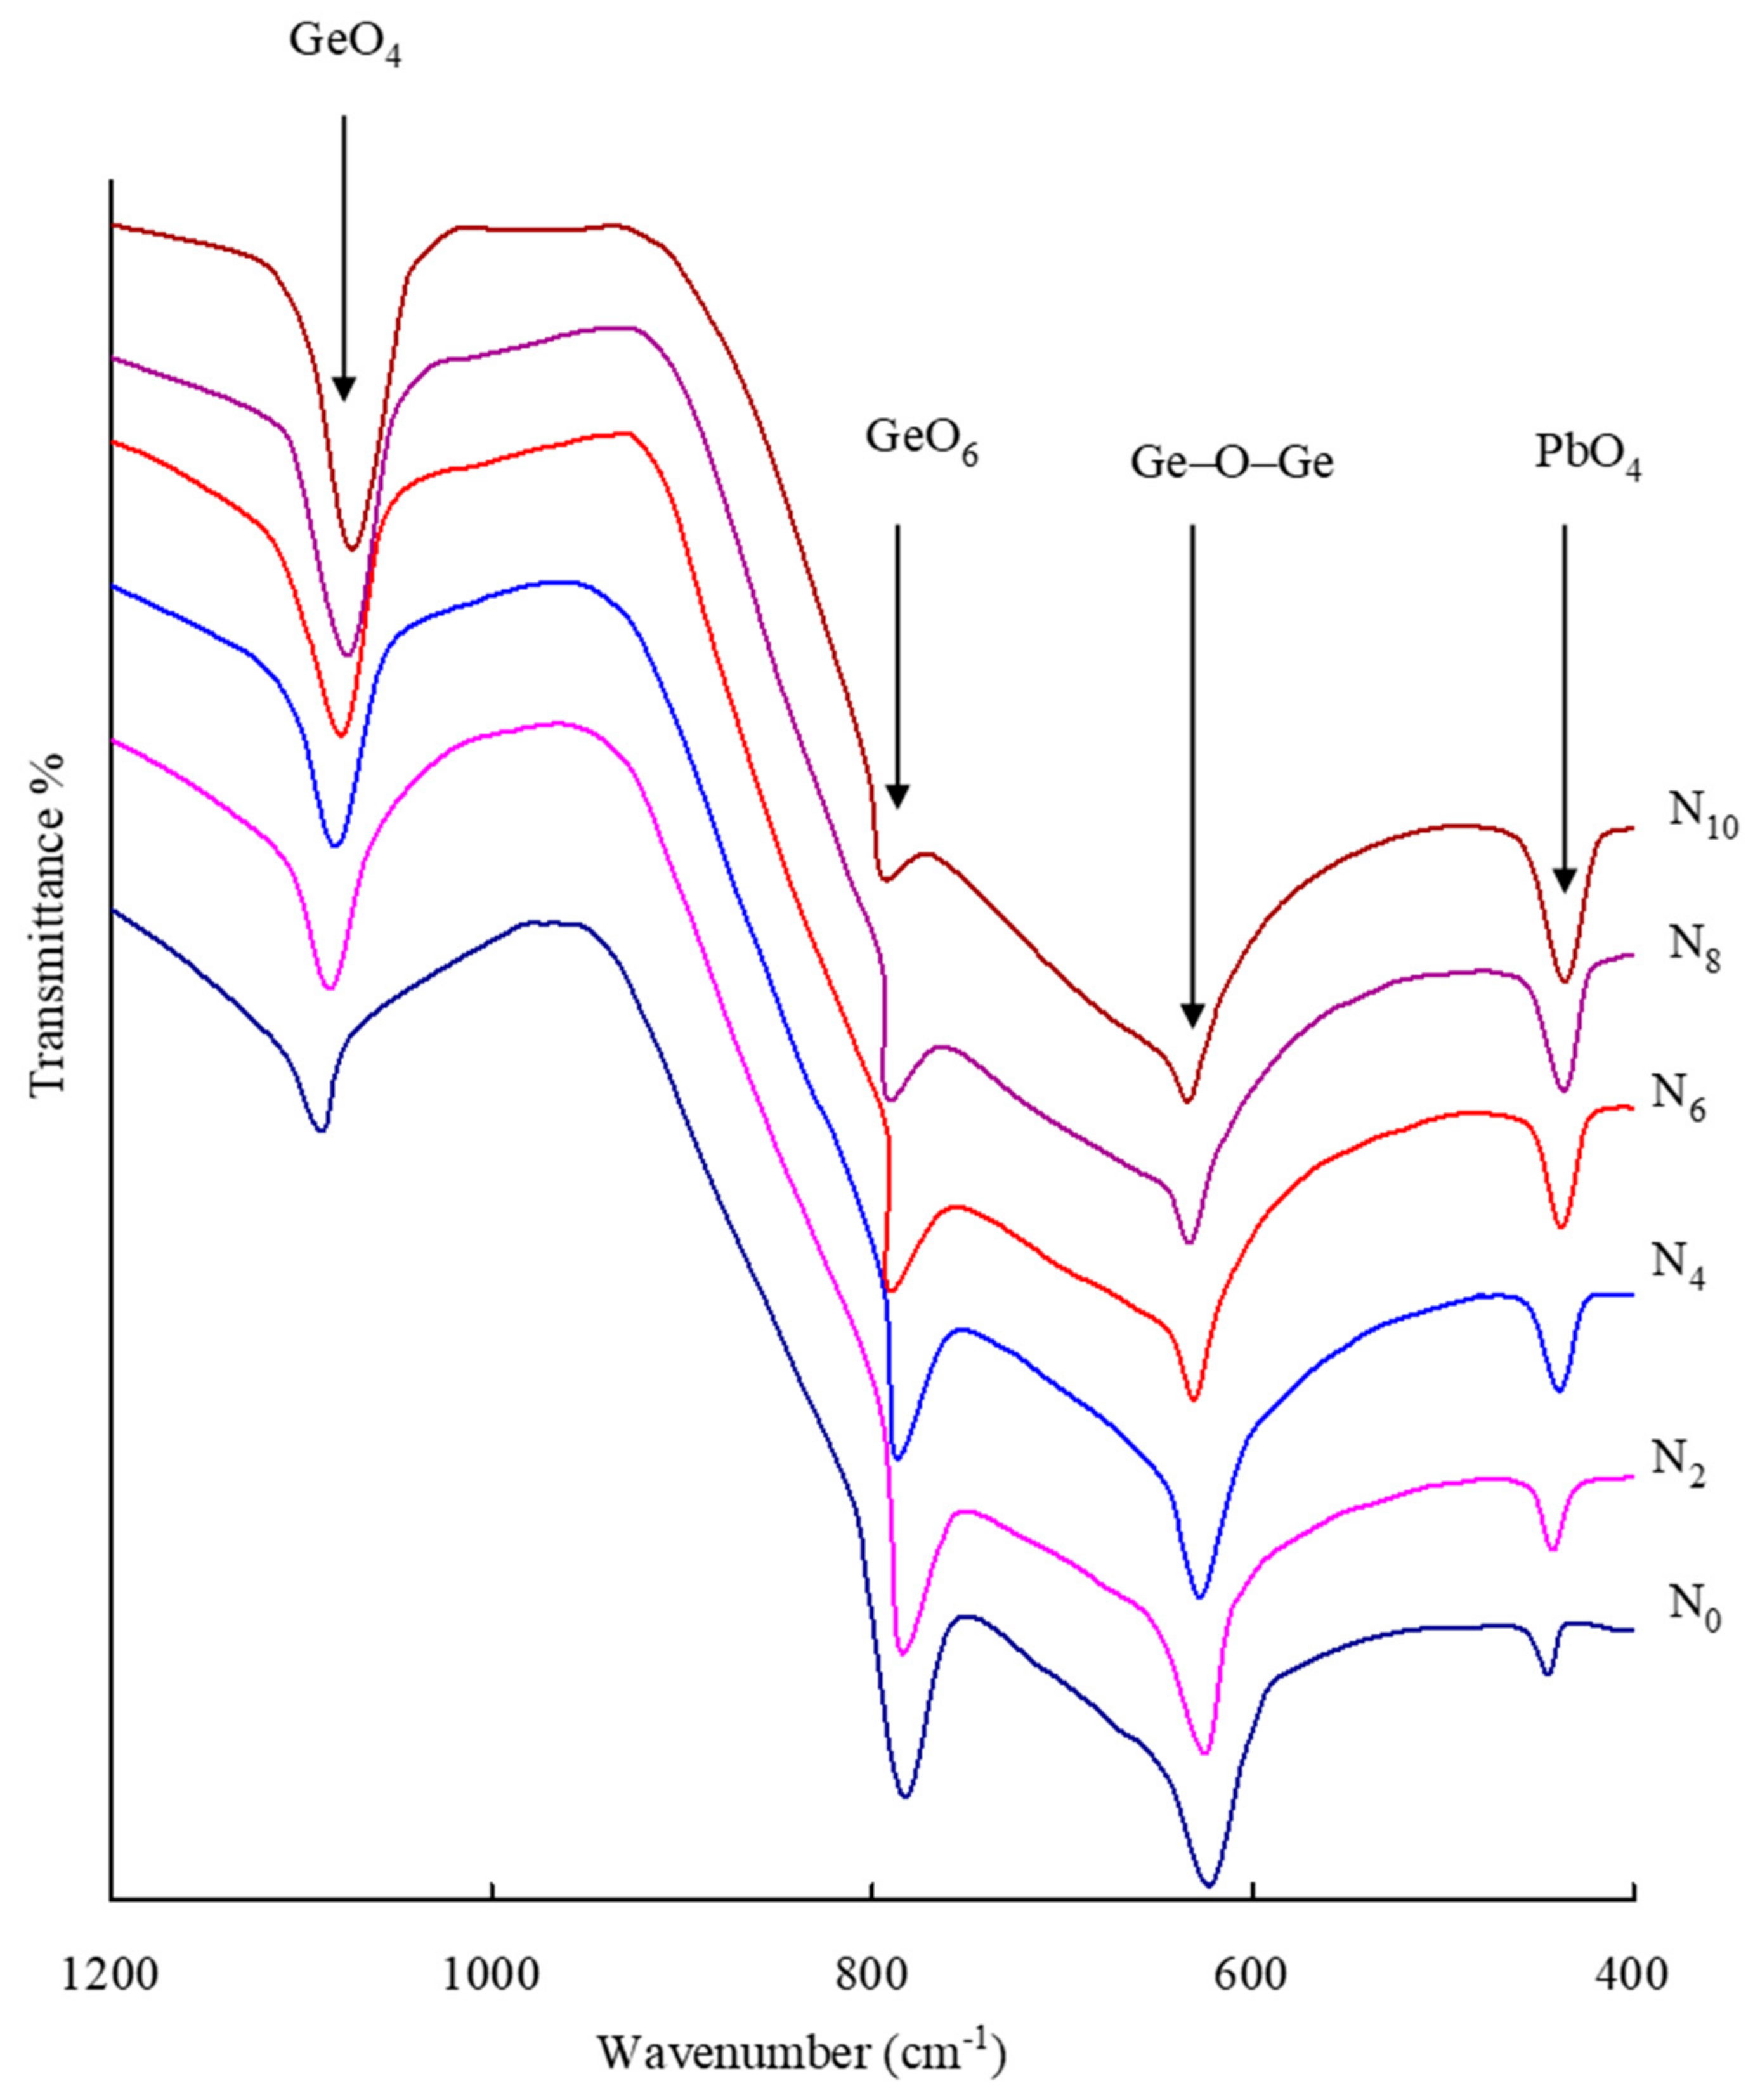
| Glass | GeO4 Units | GeO6 Units | Ge–O–Ge Bending Vibrations | PbO4 Units |
|---|---|---|---|---|
| N0 | 1088 | 783 | 622 | 445 |
| N2 | 1085 | 785 | 625 | 442 |
| N4 | 1080 | 787 | 627 | 439 |
| N6 | 1077 | 791 | 631 | 437 |
| N8 | 1075 | 792 | 633 | 436 |
| N10 | 1072 | 794 | 634 | 435 |
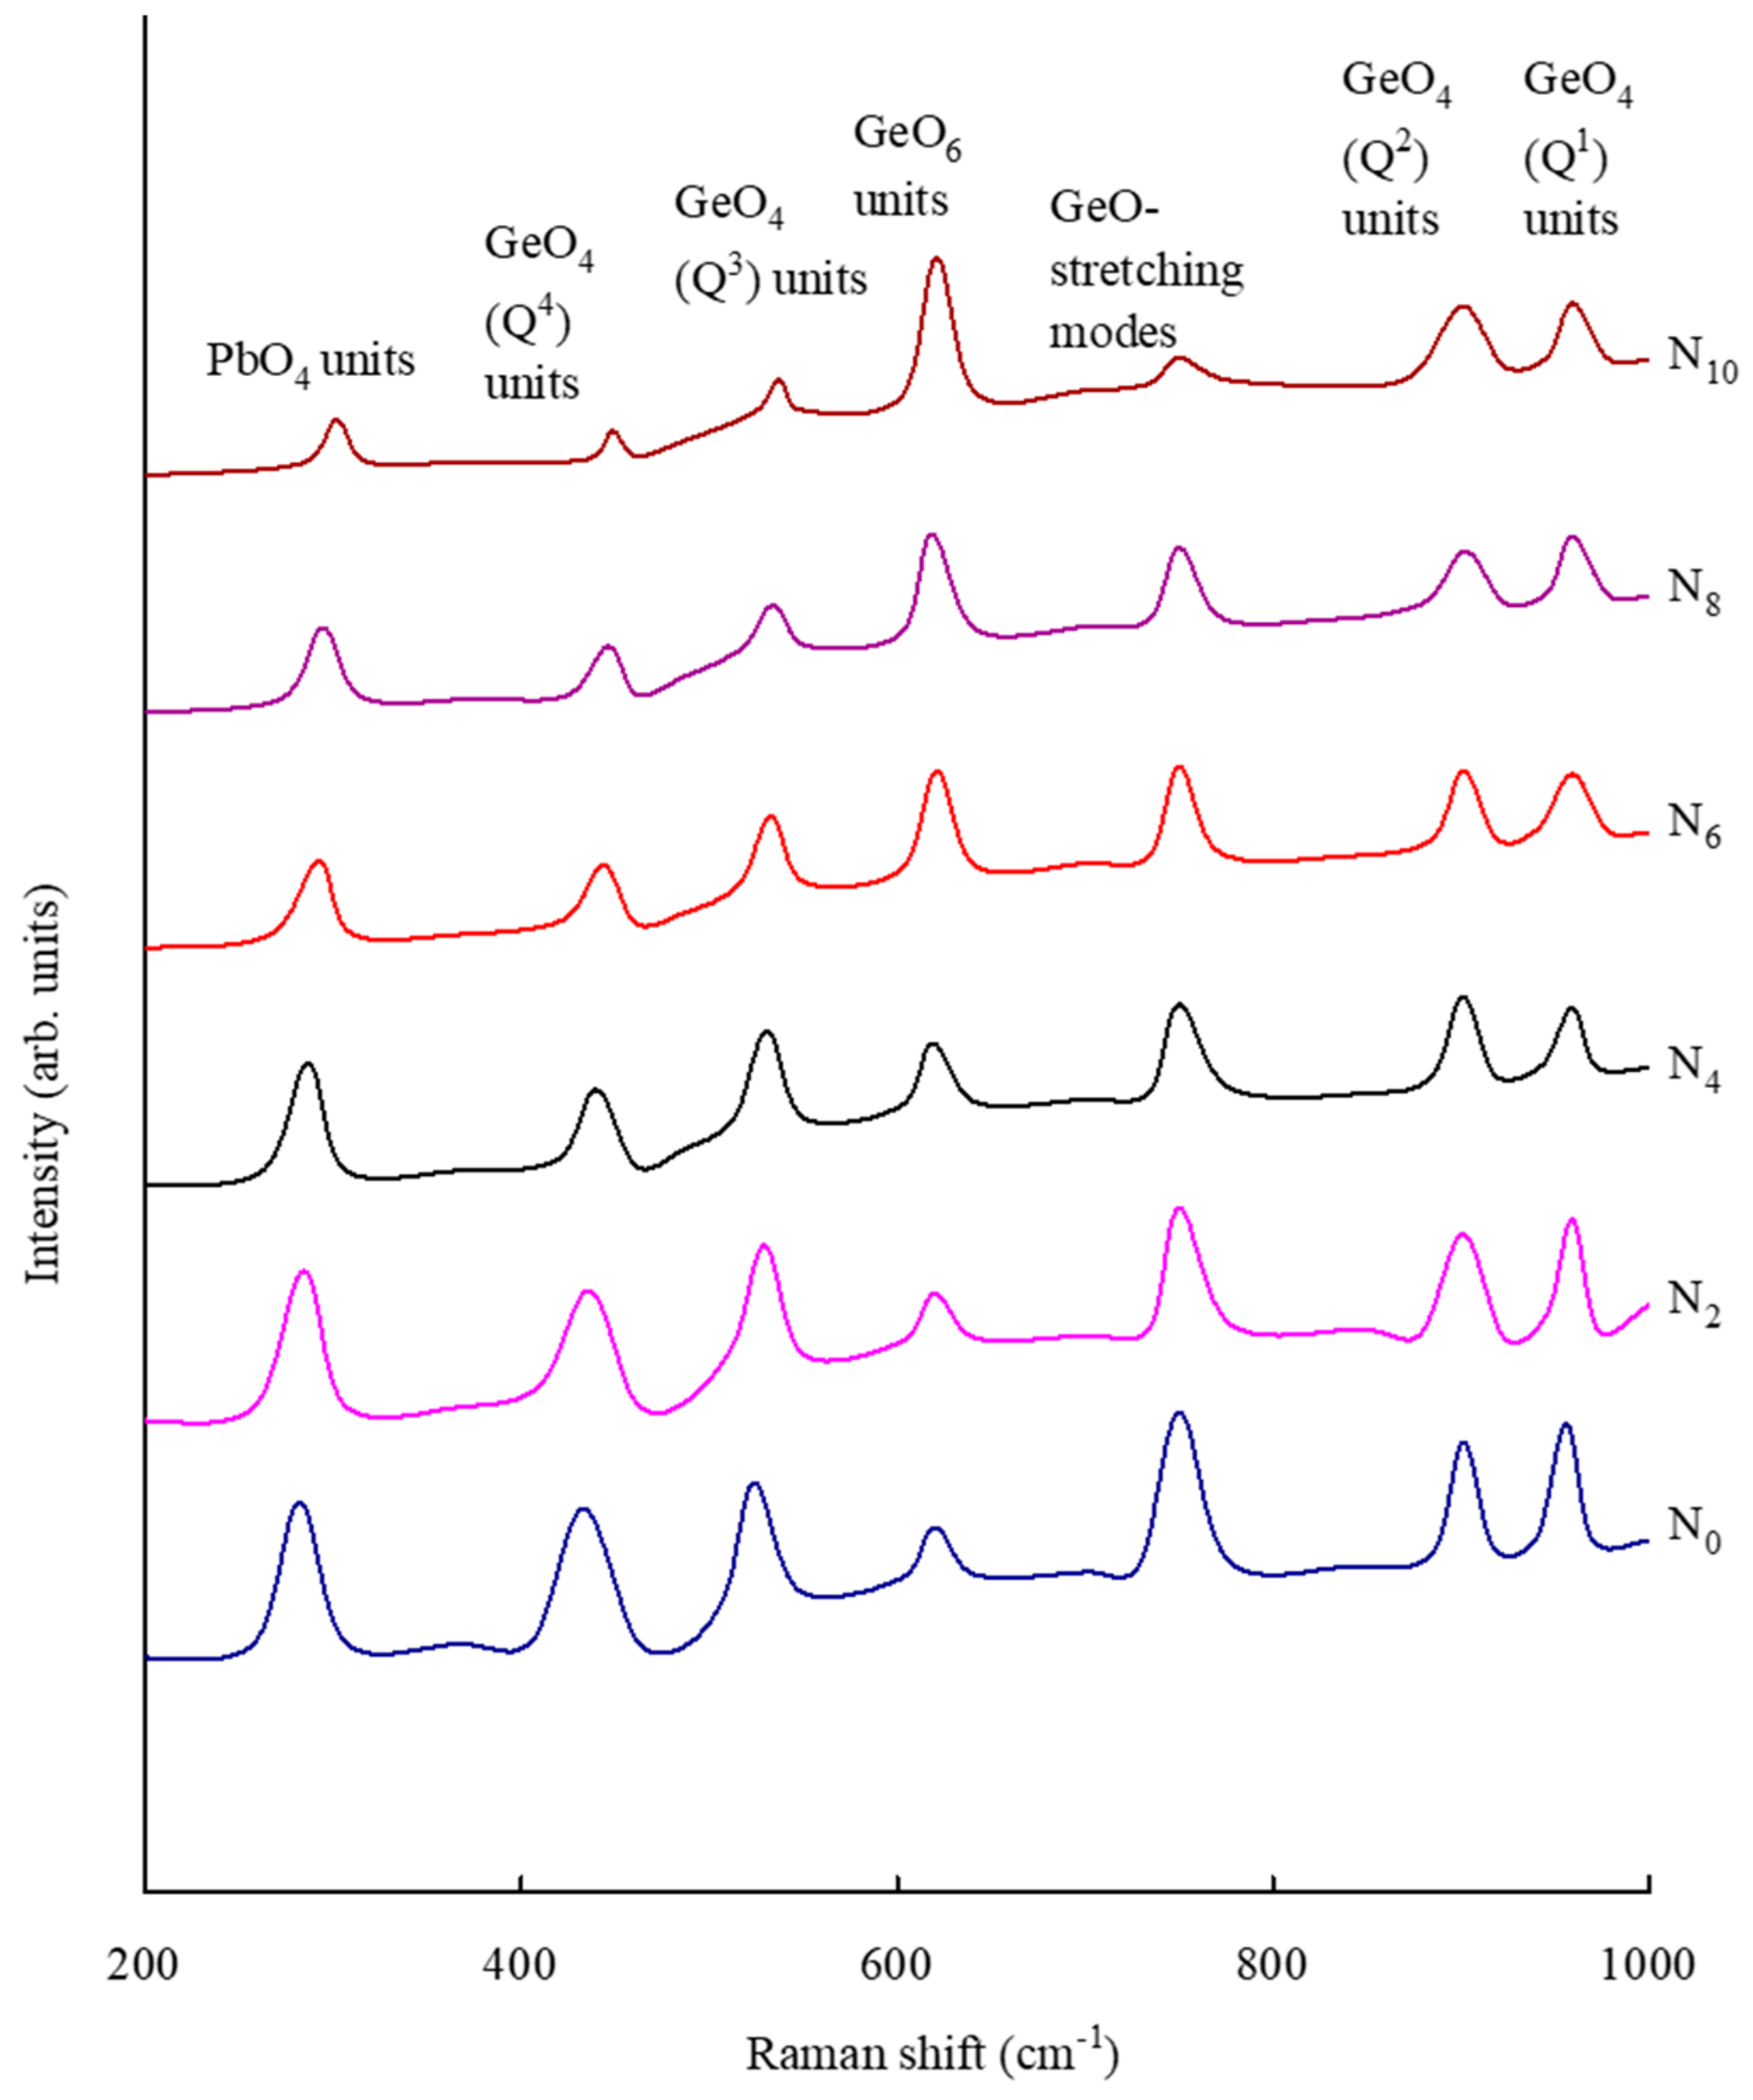
| Glass | PbO4 | GeO4 (Q4) Units | Geo4 (Q3) Units | GeO6 Units | GeO− Units | GeO4 (Q2) Units | GeO4 (Q1) Units |
|---|---|---|---|---|---|---|---|
| N0 | 282 | 433 | 524 | 621 | 750 | 901 | 959 |
| N2 | 284 | 436 | 529 | 620 | 750 | 901 | 959 |
| N4 | 286 | 440 | 530 | 619 | 750 | 901 | 959 |
| N6 | 292 | 443 | 532 | 618 | 750 | 901 | 959 |
| N8 | 294 | 446 | 534 | 618 | 750 | 901 | 959 |
| N10 | 301 | 448 | 537 | 618 | 750 | 901 | 959 |
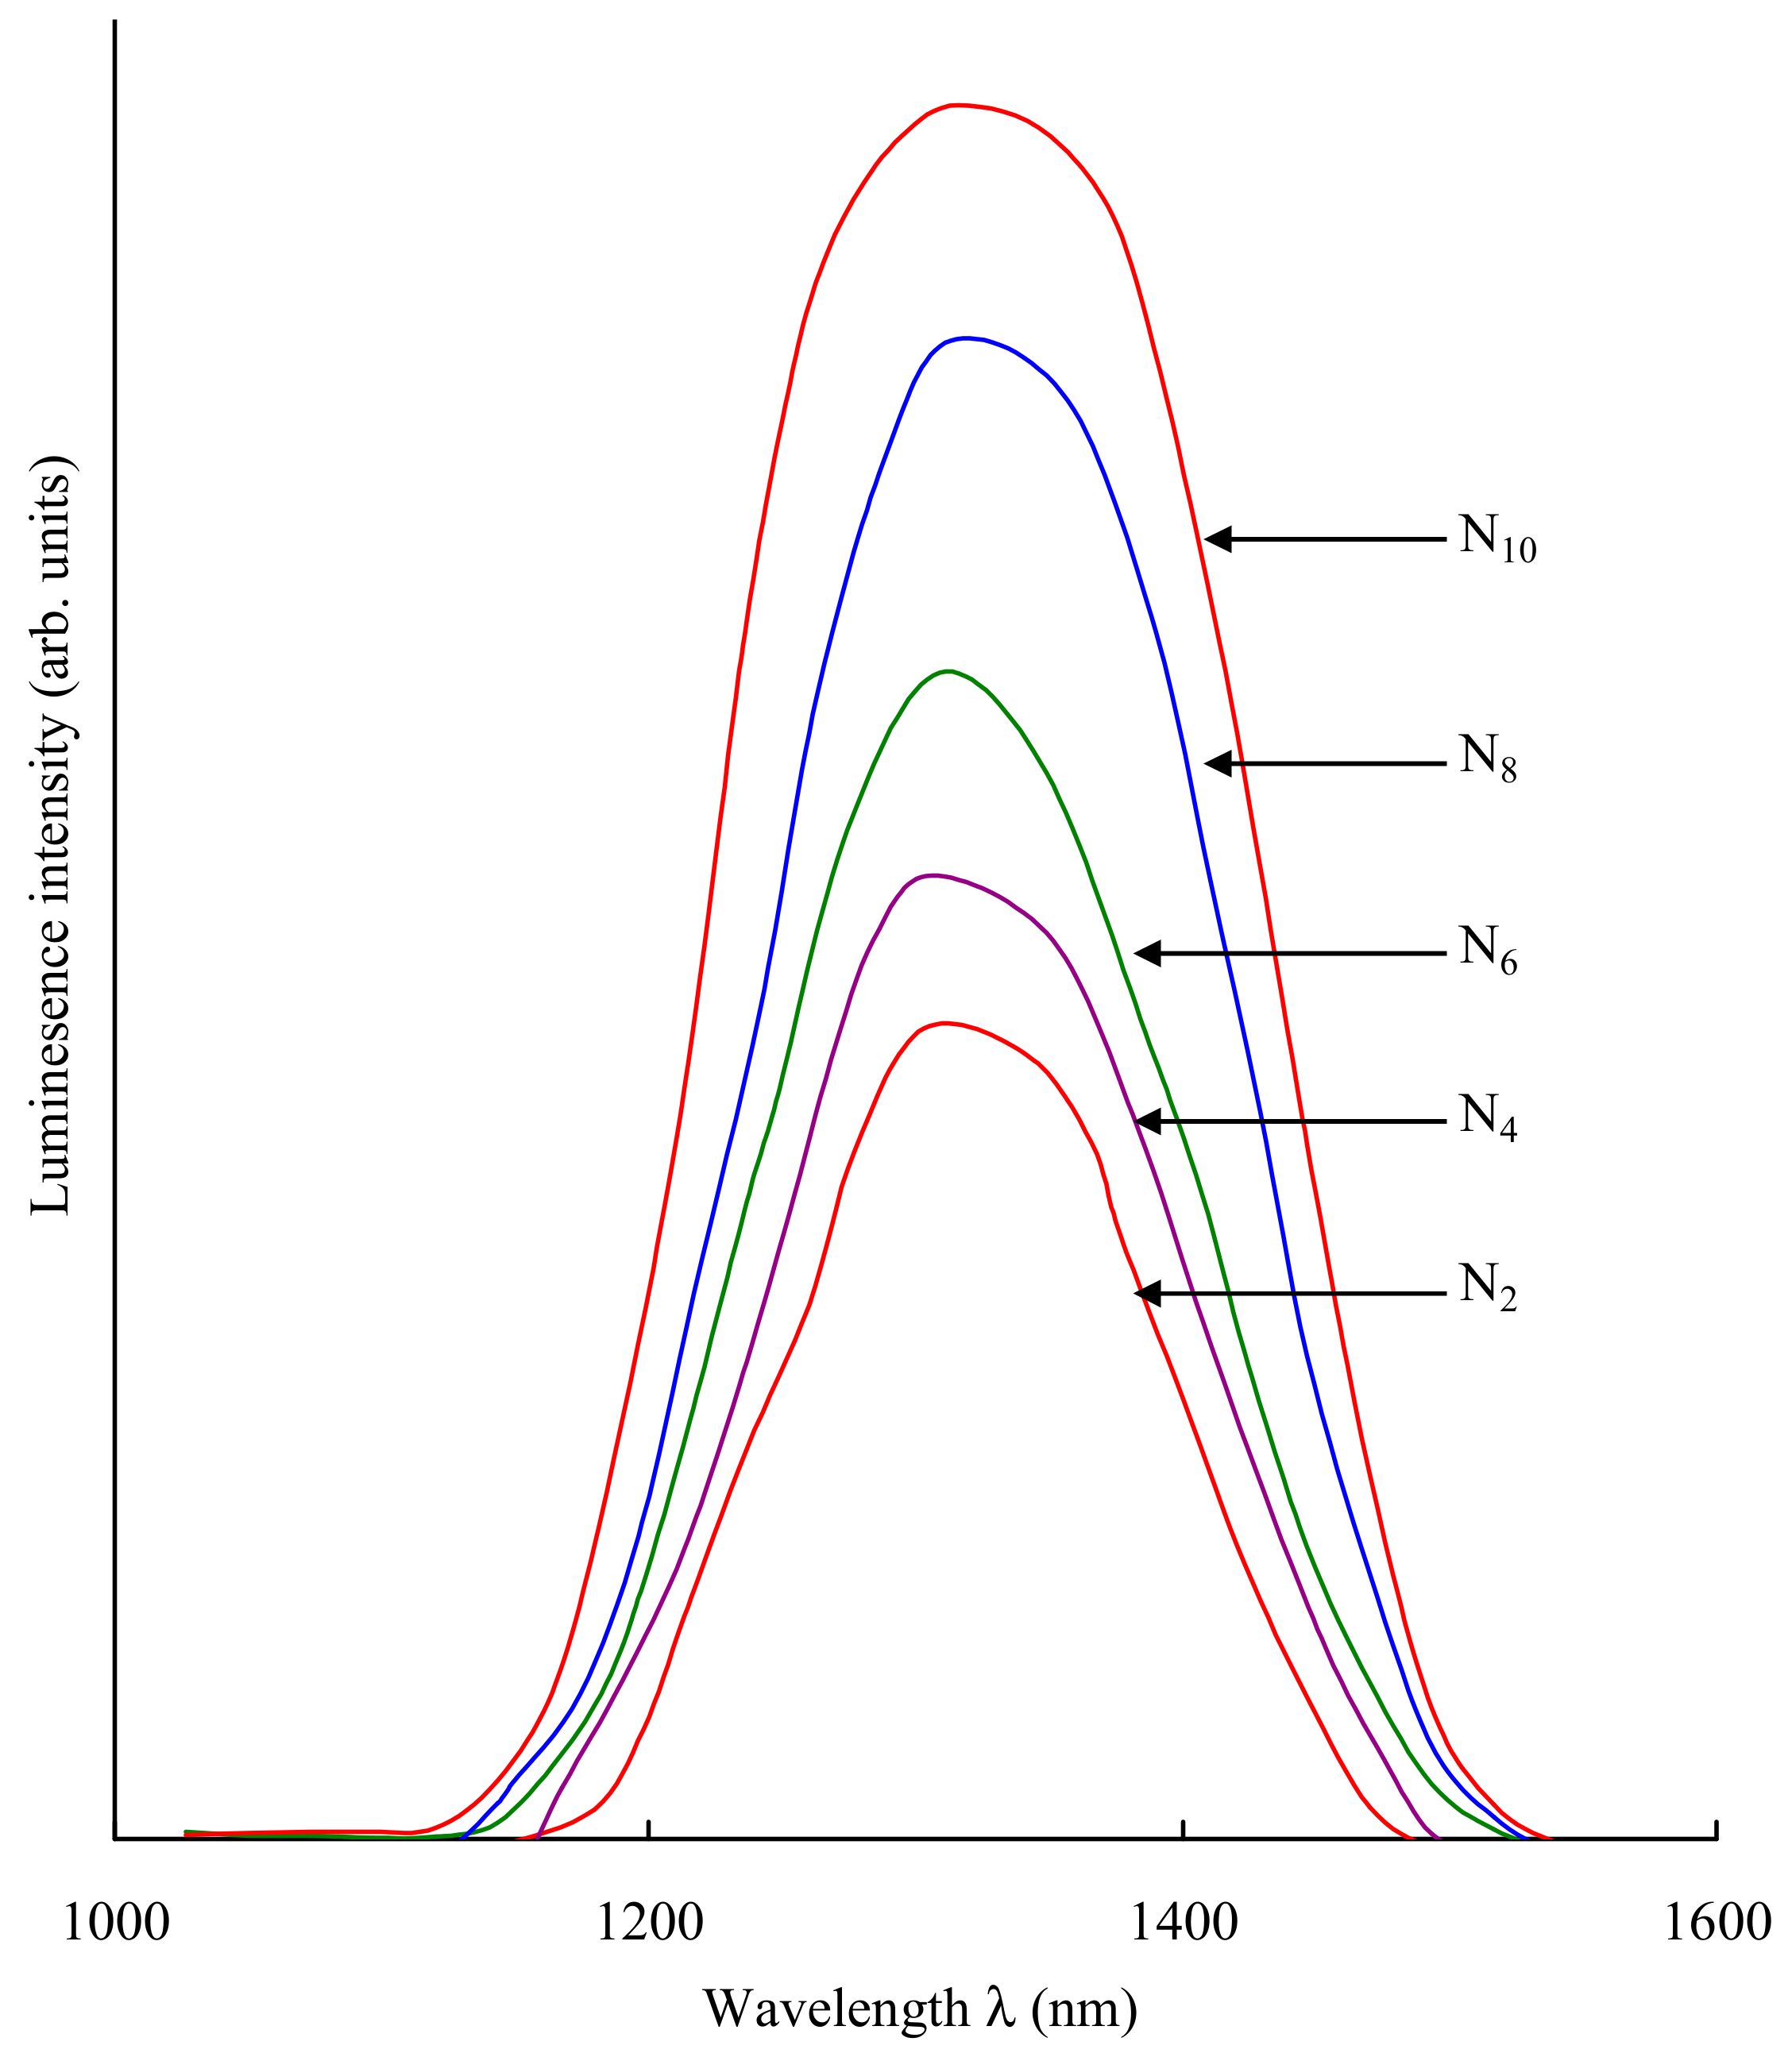
| Sample | Emission Peak Position (nm) | Refractive Index | σpE (1033, cm2) |
|---|---|---|---|
| N2 | 1303 | 1.542 | 0.932 |
| N4 | 1306 | 1.545 | 0.934 |
| N6 | 1309 | 1.549 | 0.939 |
| N8 | 1313 | 1.552 | 0.943 |
| N10 | 1316 | 1.556 | 0.945 |
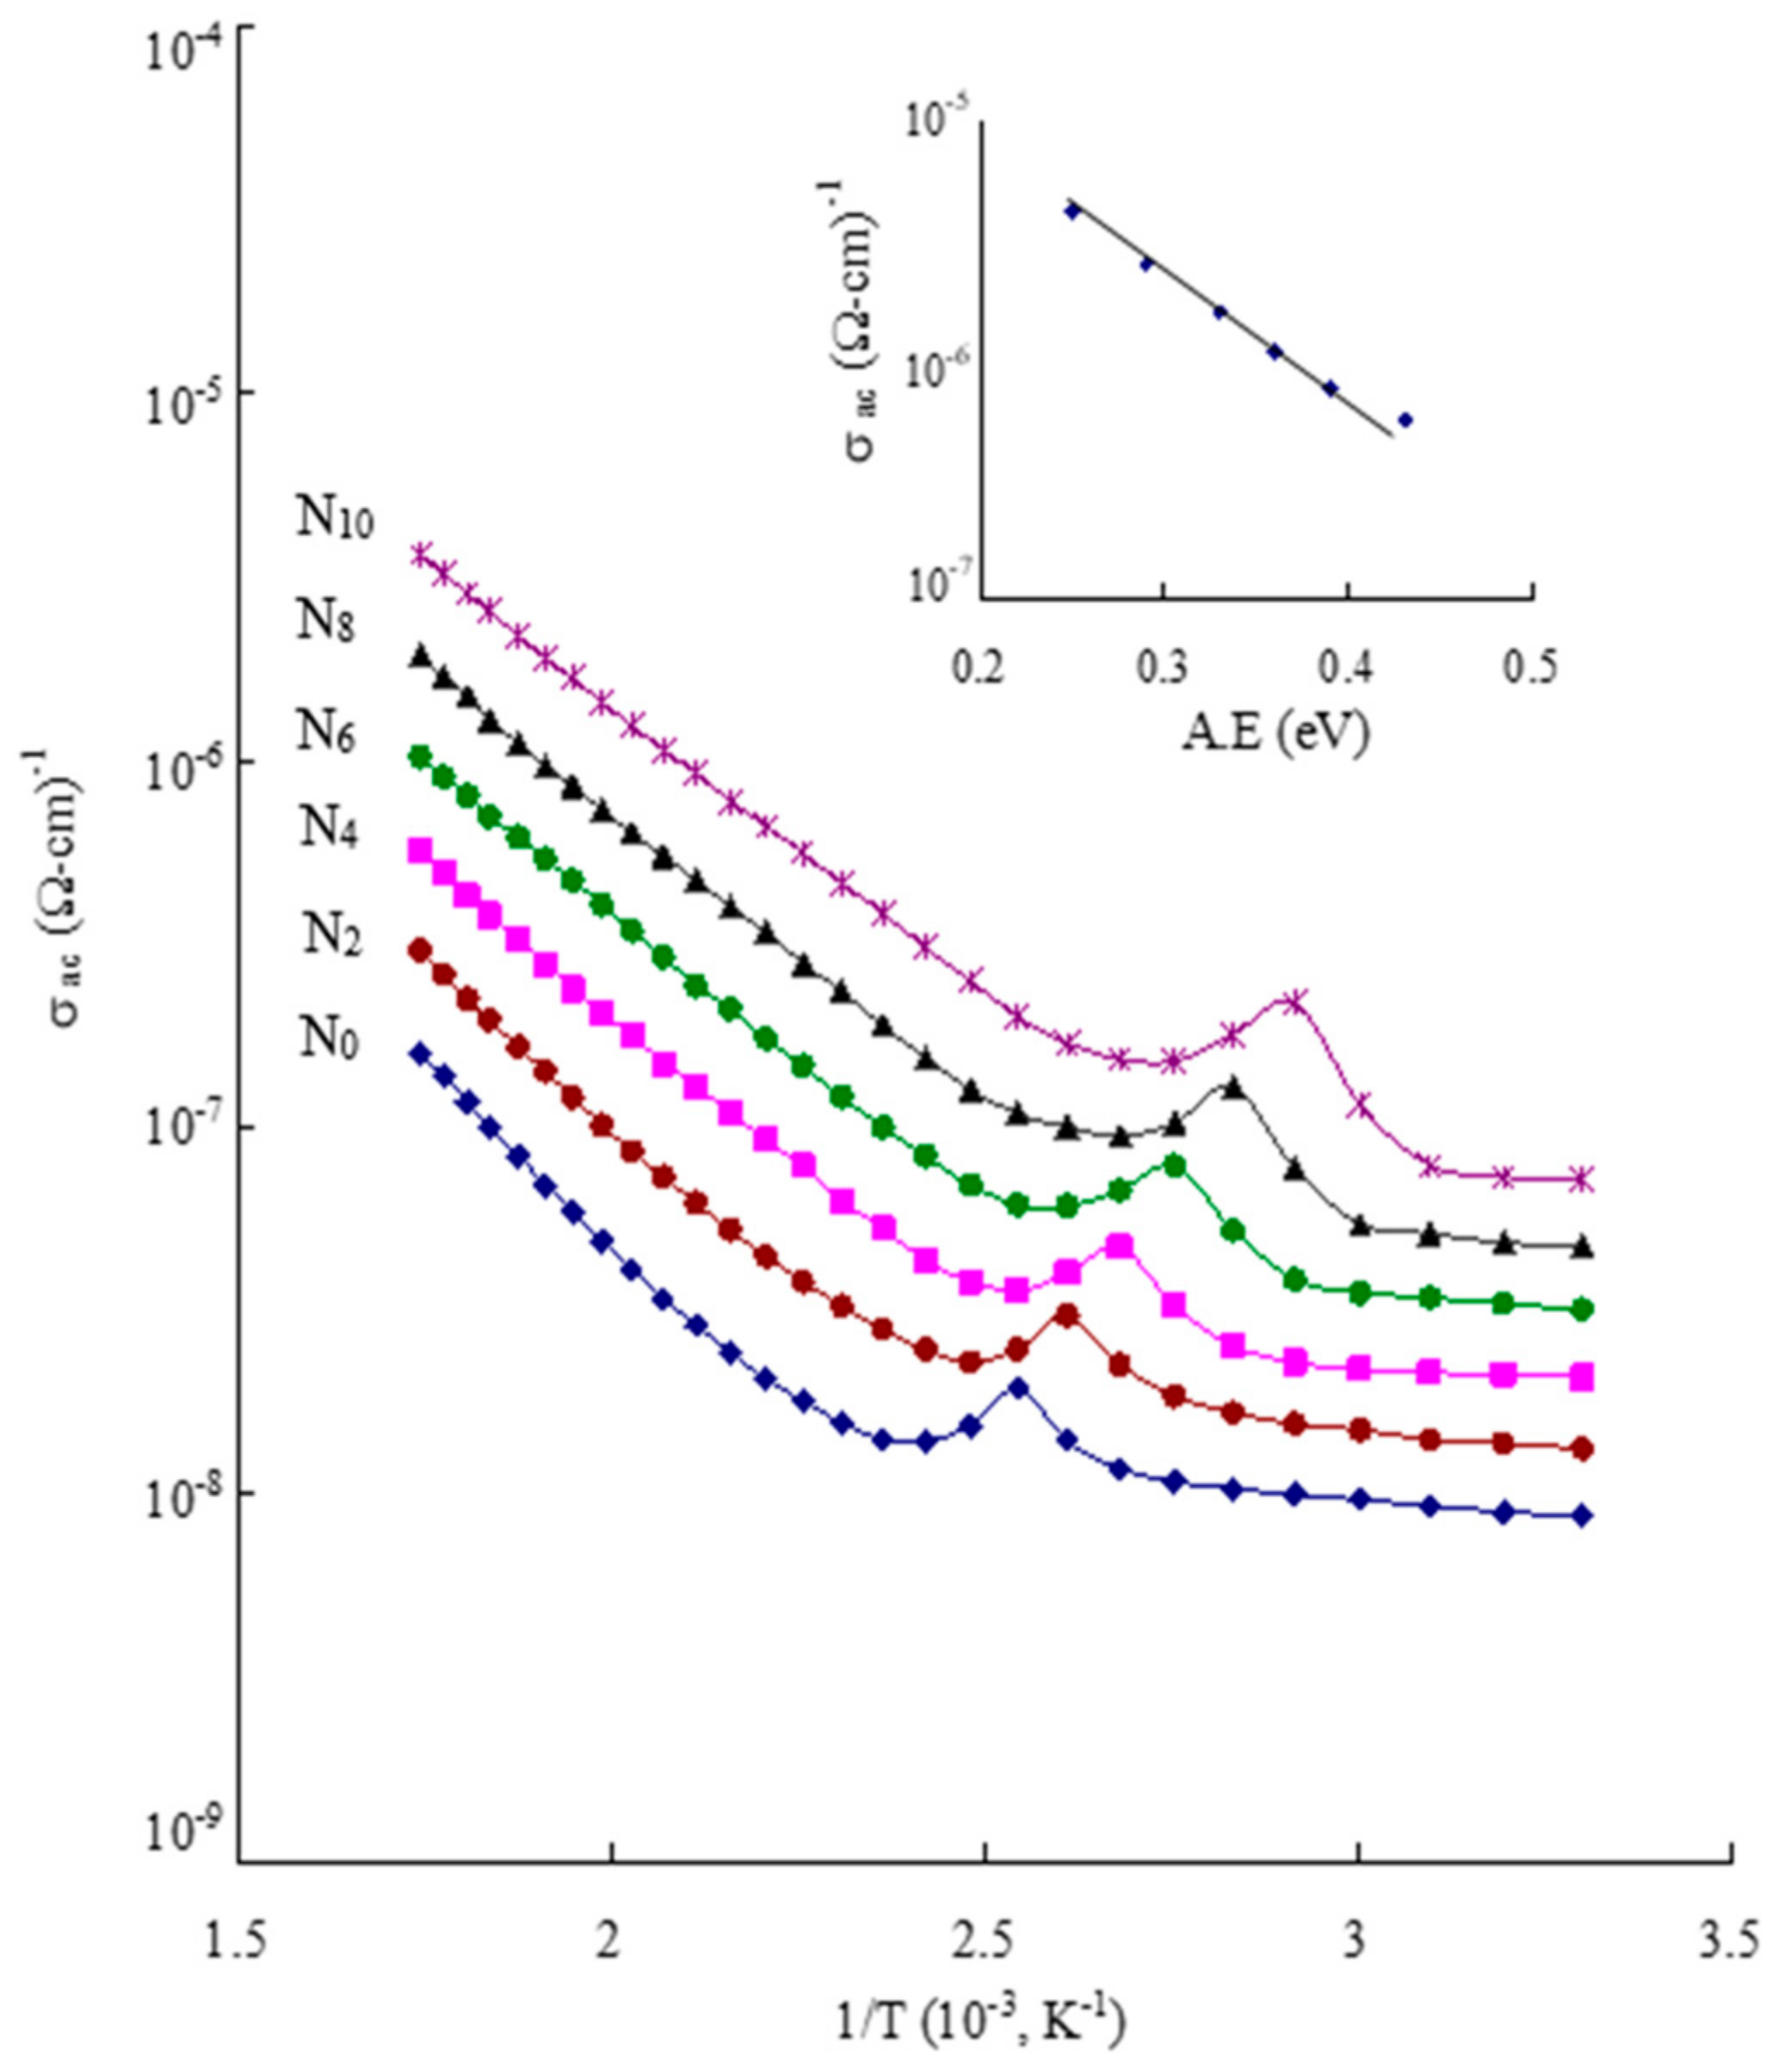
| Glass | A.E for Conduction (eV) | σac (10−7) (Ω cm)−1 |
|---|---|---|
| N0 | 0.43 | 0.56 |
| N2 | 0.39 | 0.77 |
| N4 | 0.36 | 1.08 |
| N6 | 0.33 | 1.59 |
| N8 | 0.29 | 2.54 |
| N10 | 0.25 | 4.22 |
Disclaimer/Publisher’s Note: The statements, opinions and data contained in all publications are solely those of the individual author(s) and contributor(s) and not of MDPI and/or the editor(s). MDPI and/or the editor(s) disclaim responsibility for any injury to people or property resulting from any ideas, methods, instructions or products referred to in the content. |
© 2024 by the authors. Licensee MDPI, Basel, Switzerland. This article is an open access article distributed under the terms and conditions of the Creative Commons Attribution (CC BY) license (https://creativecommons.org/licenses/by/4.0/).
Share and Cite
Vijayalakshmi, L.; Meera Saheb, S.; Vijay, R.; Palle, K.; Ramesh Babu, P.; Kwon, S.-J.; Raju, G.N. Nickel Ions Activated PbO–GeO2 Glasses for the Application of Electrolytes and Photonic Devices. Inorganics 2024, 12, 215. https://doi.org/10.3390/inorganics12080215
Vijayalakshmi L, Meera Saheb S, Vijay R, Palle K, Ramesh Babu P, Kwon S-J, Raju GN. Nickel Ions Activated PbO–GeO2 Glasses for the Application of Electrolytes and Photonic Devices. Inorganics. 2024; 12(8):215. https://doi.org/10.3390/inorganics12080215
Chicago/Turabian StyleVijayalakshmi, L., Shaik Meera Saheb, R. Vijay, Kishor Palle, P. Ramesh Babu, Seong-Jin Kwon, and G. Naga Raju. 2024. "Nickel Ions Activated PbO–GeO2 Glasses for the Application of Electrolytes and Photonic Devices" Inorganics 12, no. 8: 215. https://doi.org/10.3390/inorganics12080215
APA StyleVijayalakshmi, L., Meera Saheb, S., Vijay, R., Palle, K., Ramesh Babu, P., Kwon, S.-J., & Raju, G. N. (2024). Nickel Ions Activated PbO–GeO2 Glasses for the Application of Electrolytes and Photonic Devices. Inorganics, 12(8), 215. https://doi.org/10.3390/inorganics12080215