Abstract
To address challenges in antibiotic wastewater treatment, we synthesized a series of graphitic carbon nitride (g-C3N4)-based photocatalysts (BCN, PCN, TCN, BTCN, and TCNE-modified PTCN) via defect engineering. TCNE modification disrupted the triazine ring-bridging amino network in PTCN, forming a porous structure with enhanced specific surface area validated by SEM/TEM while retaining the graphene-like framework confirmed by XRD/FTIR. Photoluminescence (PL) analysis revealed prolonged photogenerated carrier lifetime and improved separation efficiency in PTCN, achieving 89.10% degradation of chlortetracycline hydrochloride under visible light—1.65-fold higher than pristine g-C3N4. Mechanistic studies identified superoxide radicals (•O2−) as dominant active species, generated via O2 activation at defect sites and efficient electron-hole utilization. Optimized conditions enabled PTCN to maintain high activity across a broad pH range and retain 82.59% efficiency after five cycles. This work advances defect-engineered photocatalyst design for adaptable, high-performance antibiotic degradation, offering practical insights for wastewater remediation.
1. Introduction
More than 80% of the world’s wastewater is discharged without treatment, which causes significant pollution to the water resource environment. Therefore, it is of great research significance to detect and treat the pollutants in the water [1,2]. The production of tetracycline antibiotics is widely used in human disease treatment and animal reproductive growth. As tetracycline drugs contain many hydroxyl groups, enol hydroxyl groups, and groups producing good water solubility, approximately 70% of tetracycline is still excreted in the maternal body after biological metabolism [3,4,5]. There are many kinds of antibiotics, including tetracyclines, macrolides, chloramphenicol, and antifungal antibiotics. Tetracycline antibiotics are widely used and belong to the broad-spectrum category. Aureomycin, oxytetracycline, and tetracycline are typical representatives of this class of antibiotics. Due to the production process and technology, antibiotic wastewater is characterized by high toxicity, high concentration, and complex biochemical degradation [6,7,8,9,10]. The effectiveness of using the activated sludge method or biological filter method in removing antibiotic wastewater is limited, and there are still many problems with the treatment technology. Currently, the treatment techniques of antibiotic-containing wastewater, both domestically and internationally, mainly include biological, physical, and chemical methods. The photocatalytic method utilizes solar energy for the reduction of carbon dioxide and the degradation of organic pollutants and water to produce hydrogen. Pollutants are completely converted into non-toxic and harmless substances; therefore, this approach offers a new kind of antibiotic wastewater treatment technology. Photocatalysis offers advantages such as good catalyst stability, ease of operation, and recyclability. It is one of the essential methods that could be used to address the problem of pollution in the water environment [2,11,12,13,14,15,16,17,18].
The semiconductor material graphene carbon-nitrogen compound g-C3N4 has a graphite-like layered structure, with a 3-S-triazine structure as its basic structural unit [19,20,21]. Due to its unique optical characteristics, metal-free composition, low cost, and environmental friendliness, it has good thermal and chemical stability through the hybrid connection of carbon and nitrogen atoms. It is widely used in degrading organic pollutants, electrochemical sensing, energy, and electronics [22]. However, the photocatalytic efficiency of pure g-C3N4 is often limited due to its low surface area and rapid photocatalytic efficiency. In order to expand the application of graphitic carbon nitride (g-C3N4), the primary approach is to modify its design and synthesize graphitic carbon nitride materials [23,24]. Graphite carbon nitride can be modified through methods such as doping, polymerization, and heterojunction formation. This paper uses precursor copolymerization to prepare g-C3N4 by thoroughly mixing precursors such as cyanamide and urea with organic monomers similar to its structure. Tetracyanoethylene (TCNE) has a composition similar to g-C3N4, which is a compound containing only C and N elements. When TCNE and urea undergo copolymerization it can generate g-C3N4 defects. The cyanide can react with urea and cyanamide, which can be directly involved in the formation of the graphene carbon skeleton. This modified graphite carbon can be used for degradation analysis and to improve the graphite carbon photocatalytic degradation of tetracycline pollutants, providing new insights.
2. Results and Analysis
2.1. Structure and Morphology of TCNE Copolymerization g-C3N4
2.1.1. XRD Analysis
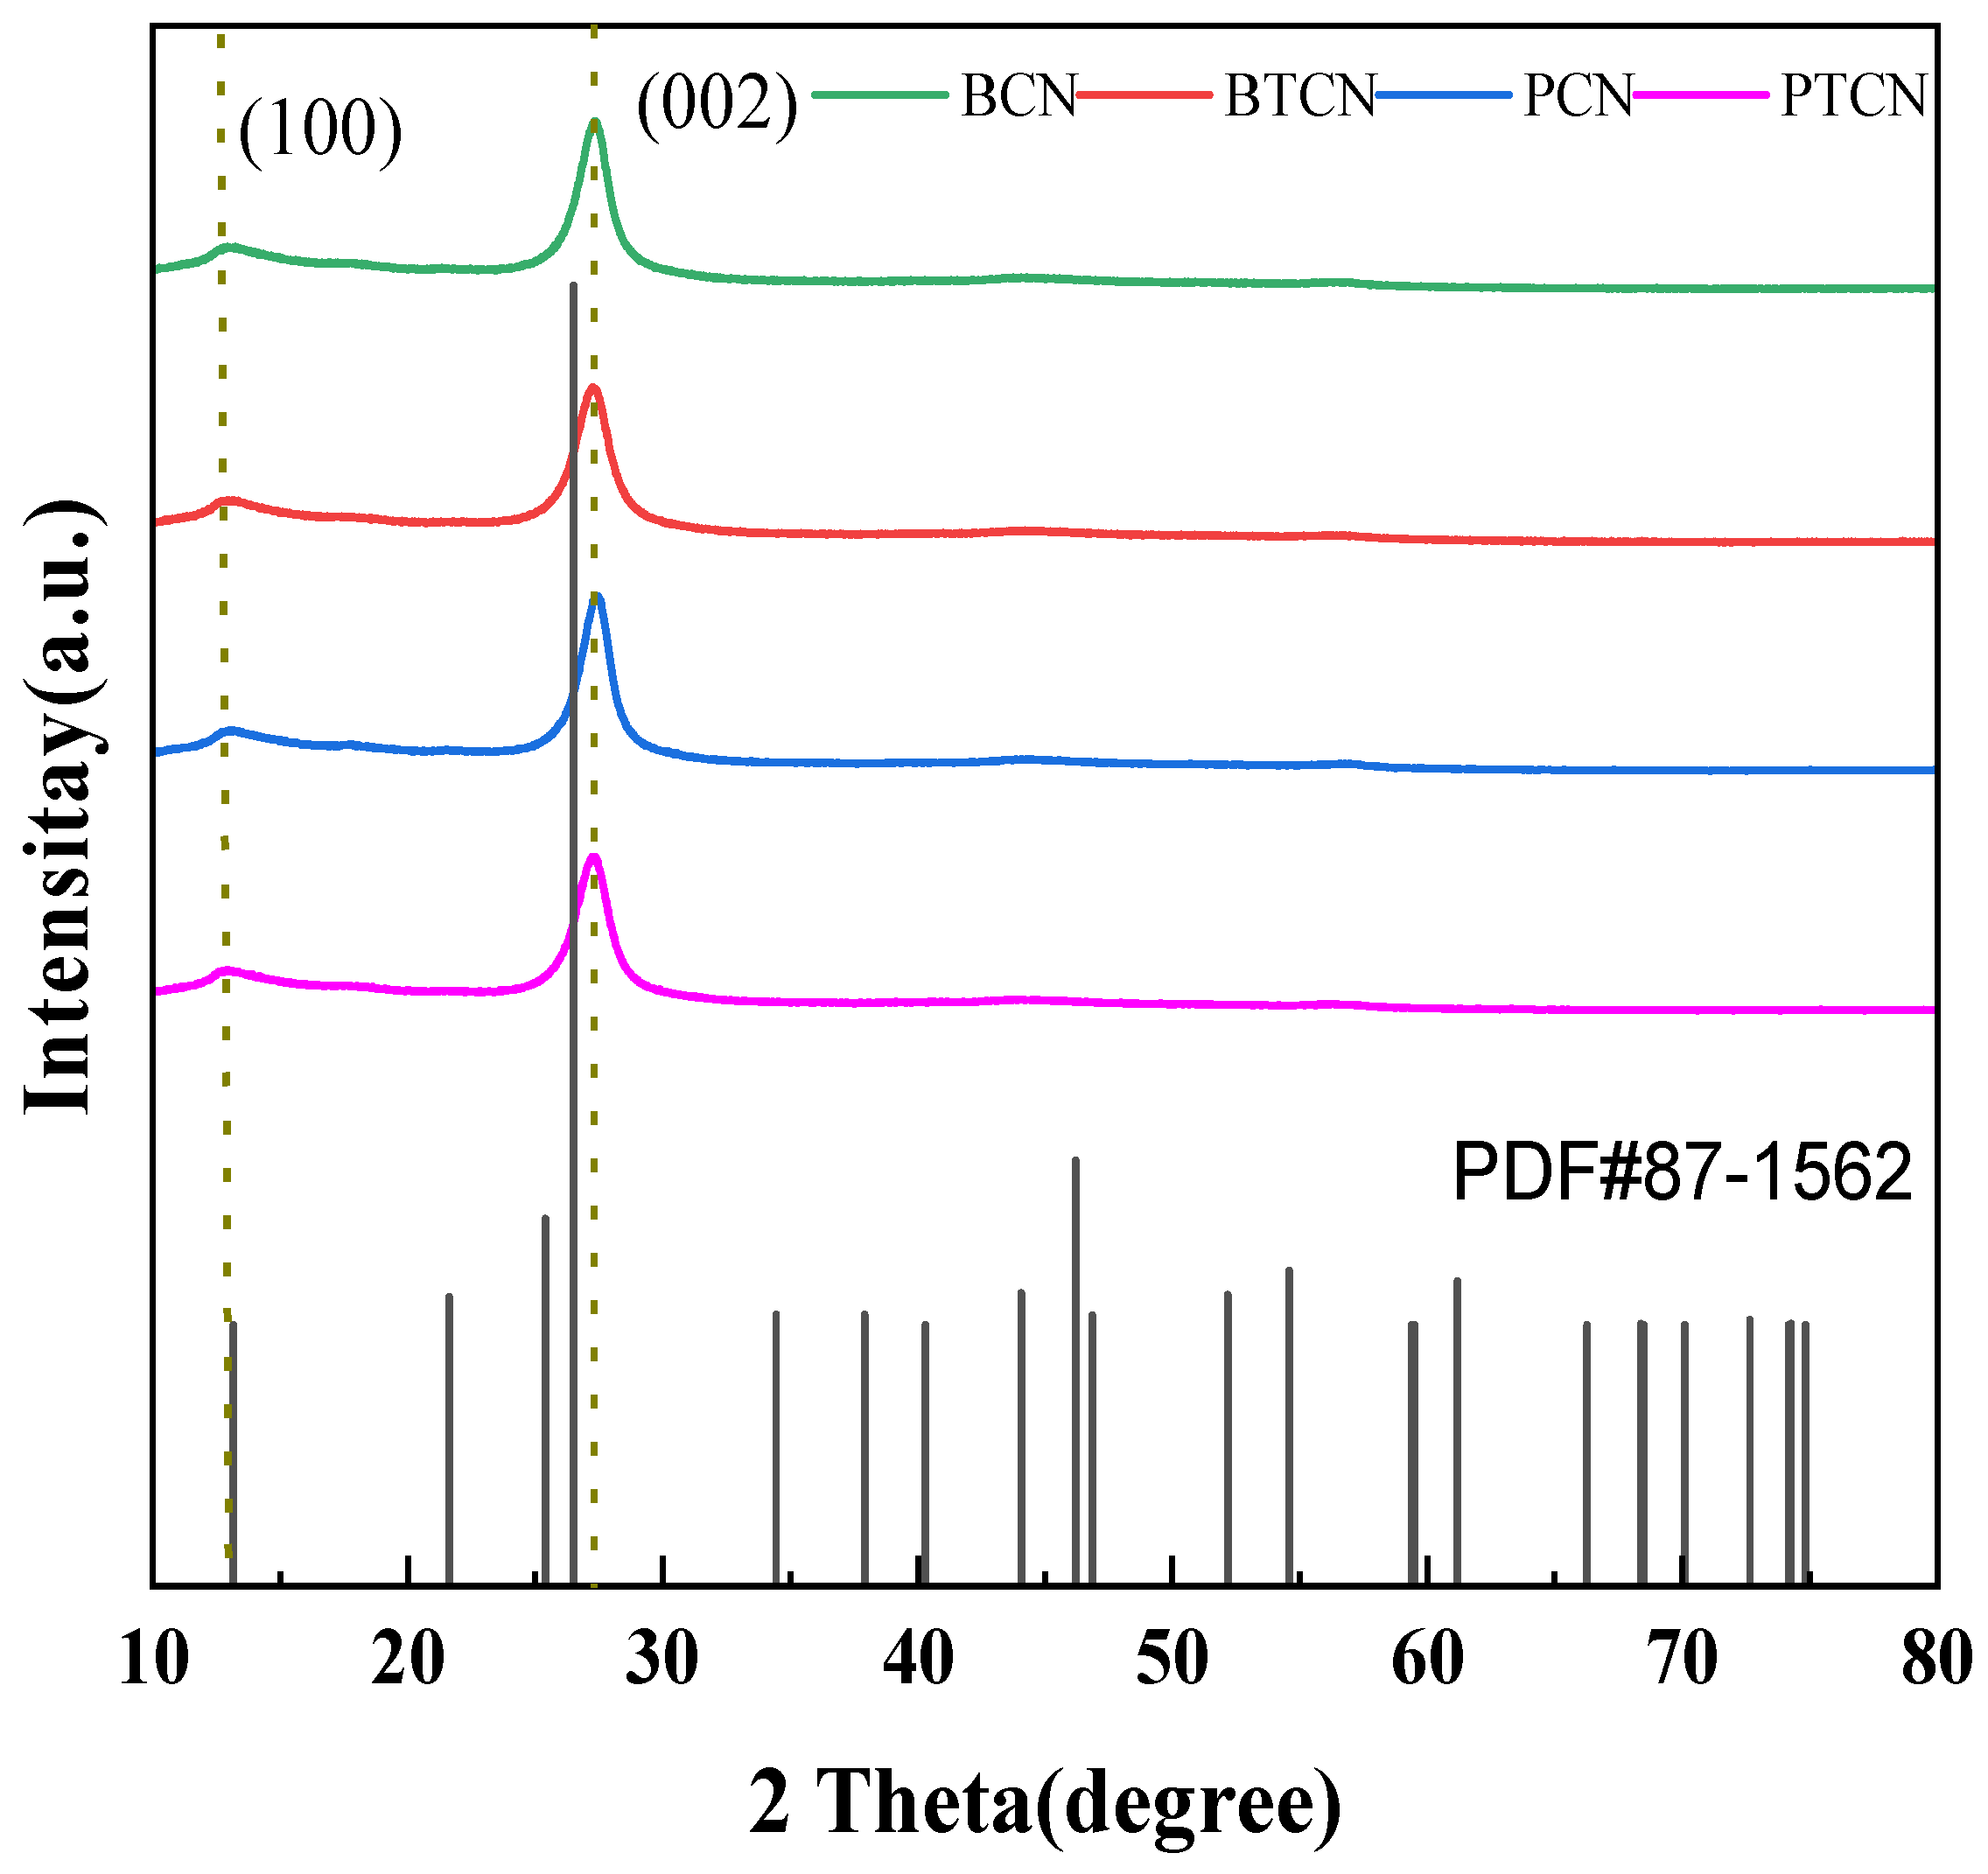
Figure 1 shows the XRD patterns of samples BCN, BTCN, PCN, and PTCN. It can be observed from the figure that BCN, BTCN, PCN, and PTCN samples all have prominent diffraction peaks at 13.3° and 27.5°, among which the peak at 27.5° is the (002) peak of g-C3N4, representing the aromatic triazine ring’s interlayer accumulation structure, and the interlayer distance is d = 0.326 nm. The (100) peak of g-C3N4 is represented by the peak of 13.1, which is in line with the crystal structure of g-C3N4 and shows the in-plane structure of the triazine unit with an in-plane distance of d = 0.676 nm. This indicates that the sample can retain g-C3N4’s graphene-like in-plane and interlayer properties. In addition to the displacement of diffraction peaks, it is also noted that with the increase in TCNE content, the peak strength of PTCN and BTCN samples decreases, and the half-peak width becomes more extensive than that of PCN and BCN samples. Such changes reflect the deterioration of crystal quality and reduction in size, indicating that TCNE copolymerization with melamine can cause defects in the g-C3N4 generated. The quality and size of graphite-like structures worsen and decrease in size.
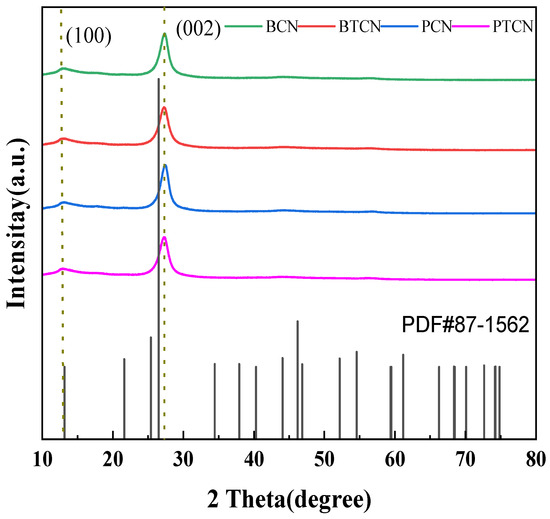
Figure 1.
XRD patterns of BCN, BTCN, PCN, and PTCN.
2.1.2. FTIR Analysis
FTIR spectral analysis can reveal the functional groups of the sample, and then analyze the possible chemical composition of the sample. Figure 2 shows the FTIR diagram of each sample, indicating that all samples’ distinctive spectra are comparable. In the range of 1200–1700 cm−1, multiple absorption peaks were observed. Among them, the peak at approximately 1350 cm−1 is attributed to the C-N stretching vibration, indicating the presence of C-N bonds in the material. The peak around 1630 cm−1 corresponds to the C=N polarization vibration, suggesting the existence of structural units containing C=N in the material. The absorption peak at 800 cm−1 corresponds to the triazine ring (C3N3). After copolymerization with TCNE, the intensity of the peak at 800 cm−1 remains relatively unchanged, indicating that the copolymerization with TCNE has minimal impact on the structure of the triazine ring. In addition, the peak at 3100–3400 cm−1 corresponds to the stretching vibration of a small amount of residual amino (−NH2) groups. FTIR test results showed that TCNE copolymerization did not change the graphene-like chemical skeleton structure of the material, nor did it generate or introduce new functional groups such as C=C, C≡N in g-C3N4.
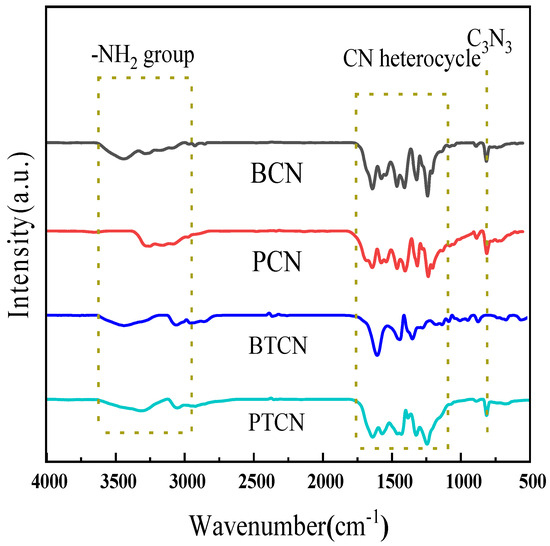
Figure 2.
FTIR spectra of BCN, BTCN, PCN and PTCN.
2.1.3. SEM Analysis
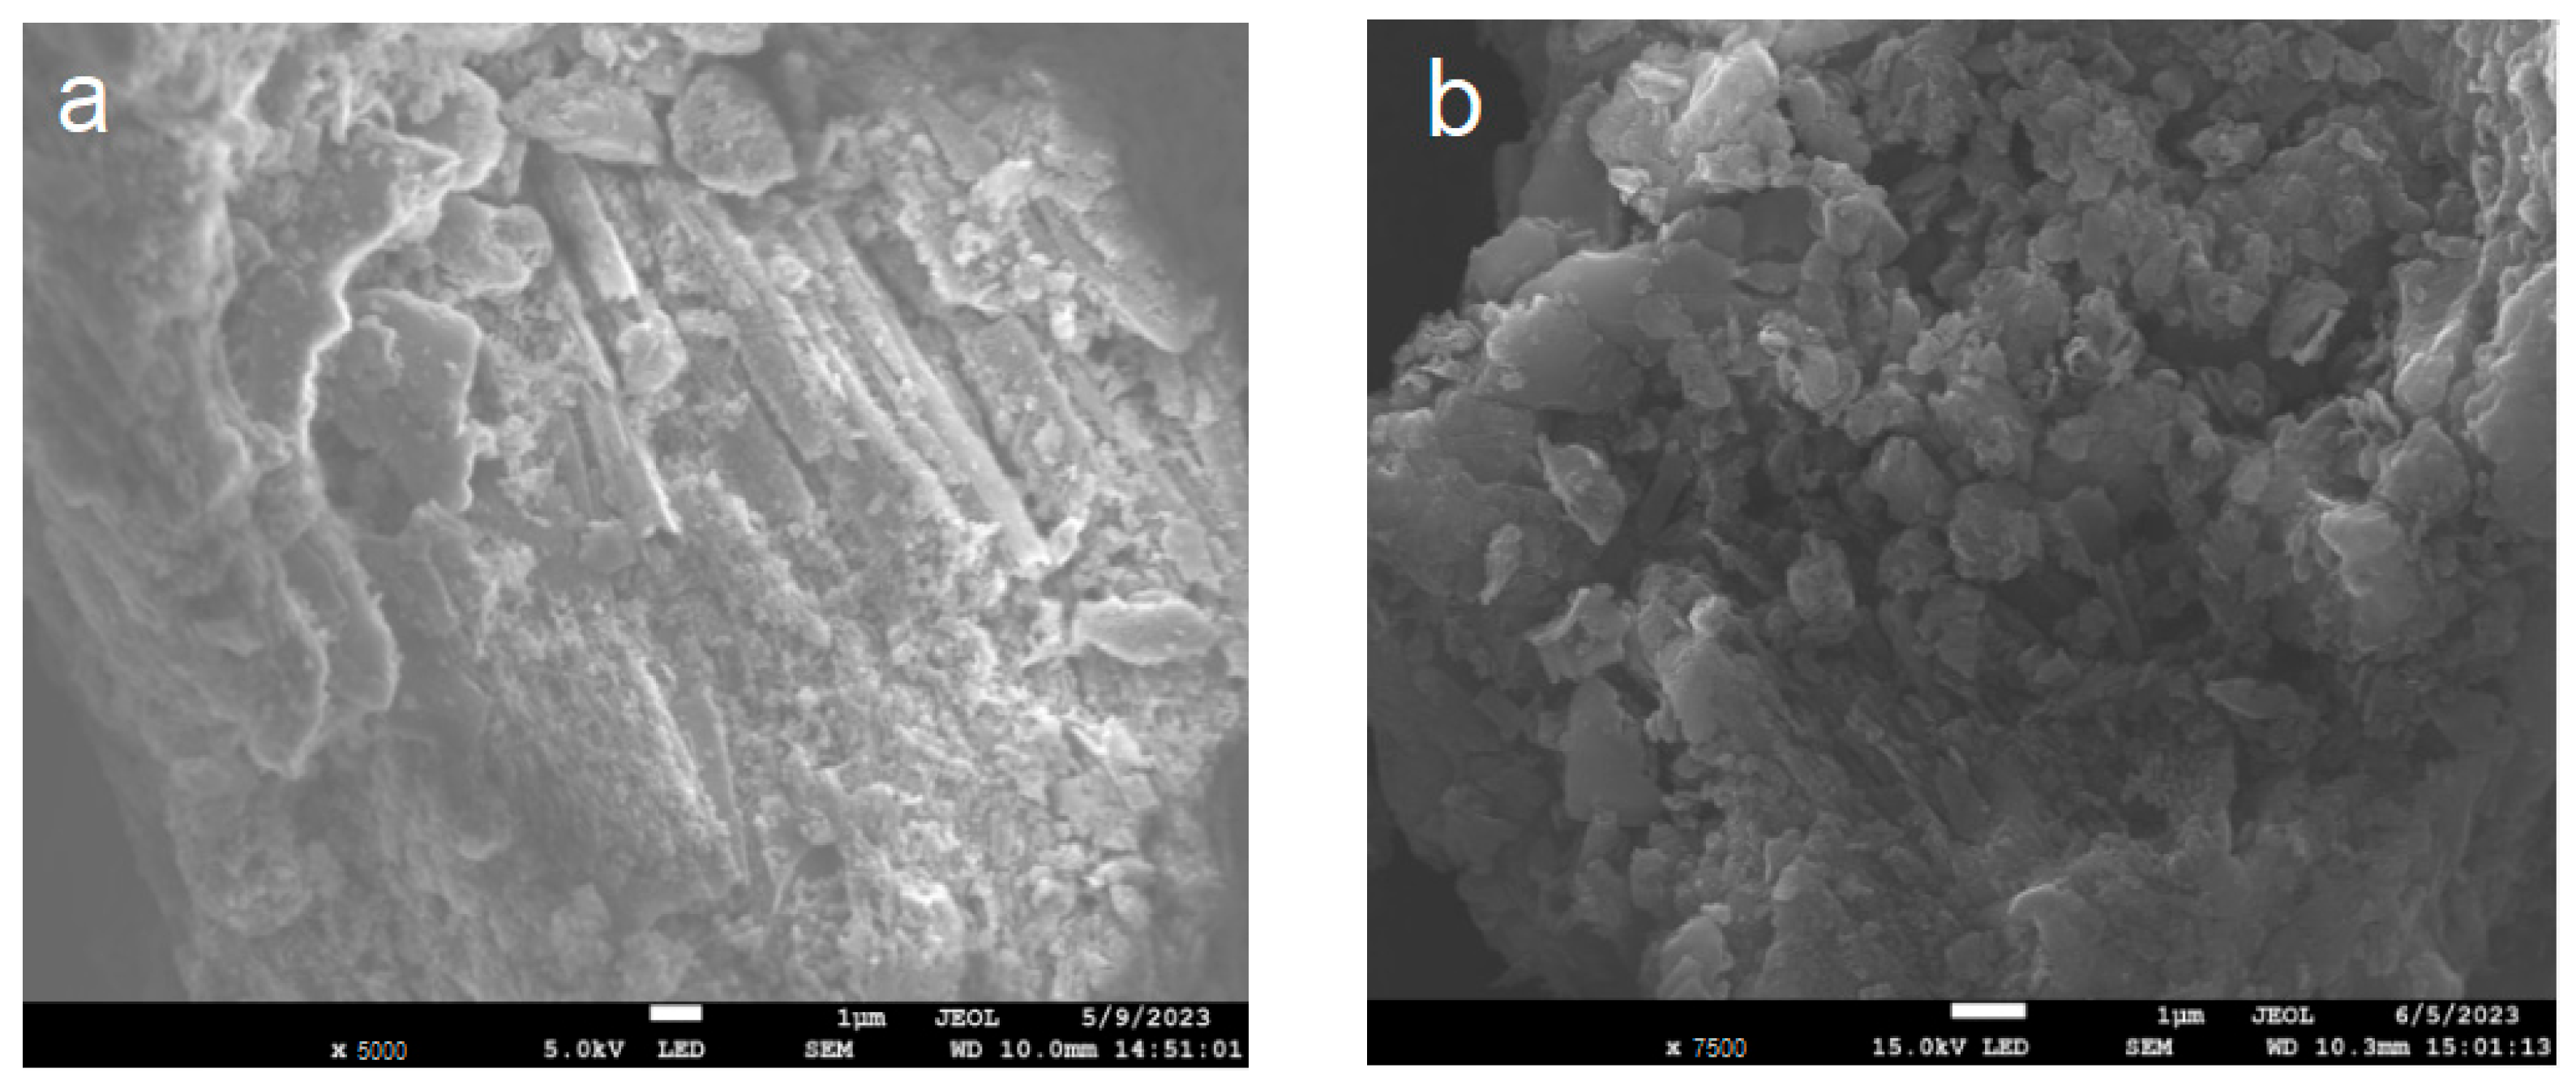
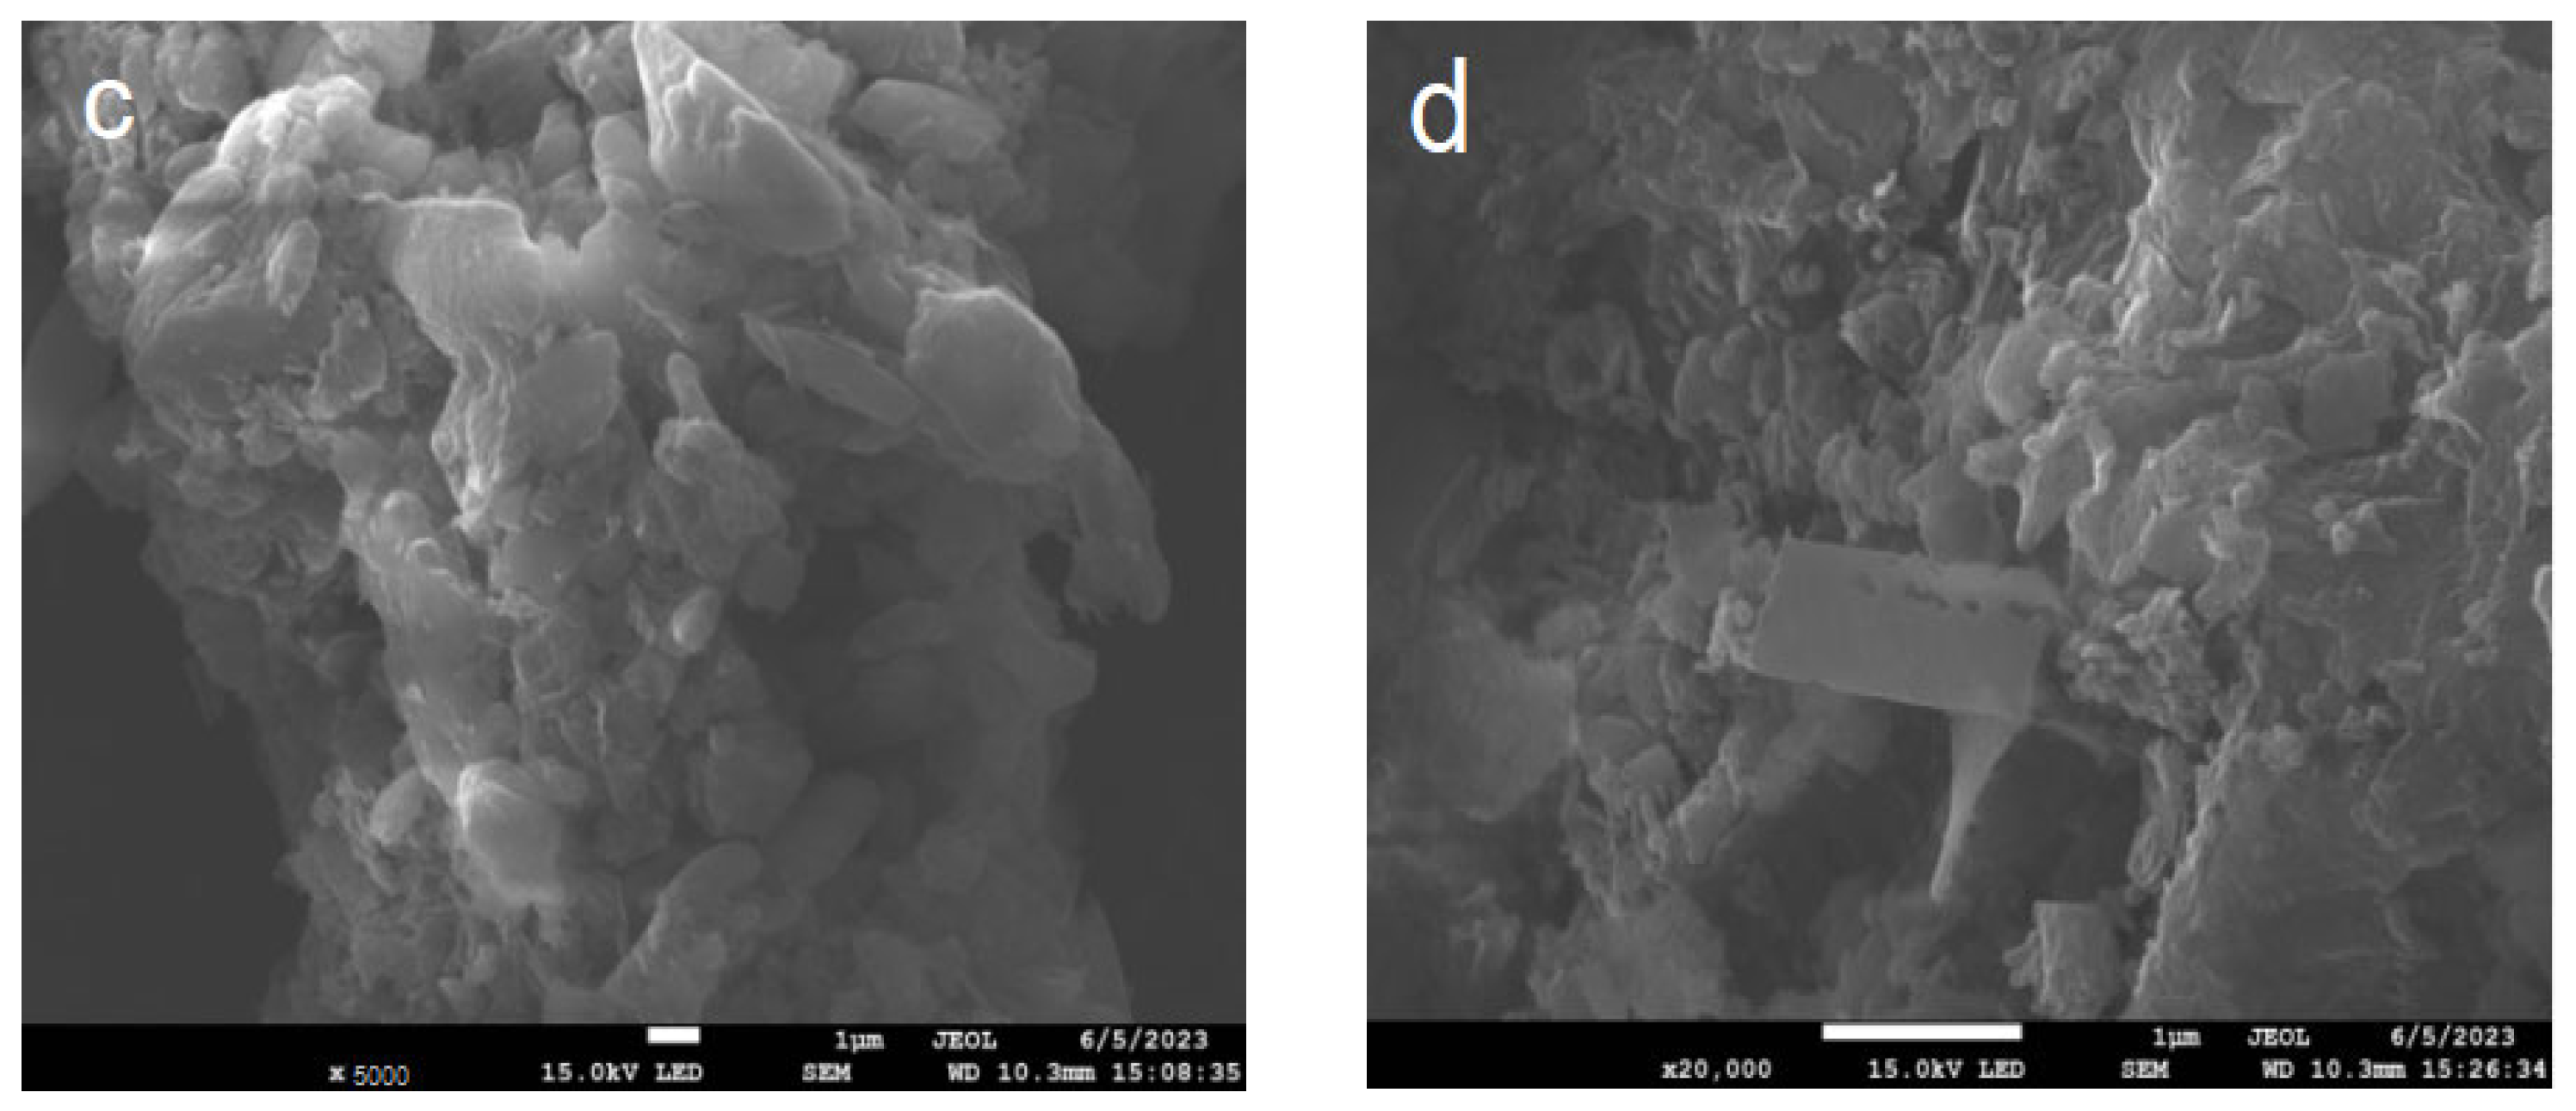
Figure 3 shows the SEM diagrams of BCN, BTCN, PCN, and PTCN samples. The BCN produced by polycondensation of melamine after a single calcination has a microstructure with a certain texture and morphology, with the structure features such as sheet and strip visible in the figure. After TCNE was added for copolymerization modification, the BTCN material was changed from the original BCN structure to a more granular and uneven surface. Furthermore, the PCN prepared by secondary calcination showed the characteristics of a thinning structure. After TCNE was added for copolymerization modification, a pore structure appeared on the surface of the PTCN. These phenomena indicate that the addition of TCNE to the reaction system for copolymerization modification can lead to a change in the surface morphology of raw materials.
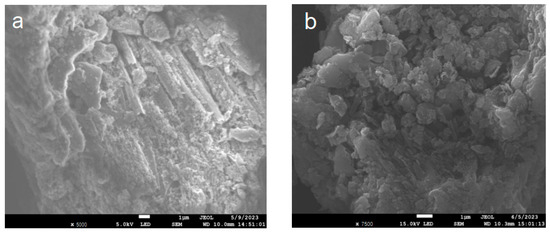

Figure 3.
SEM patterns of (a) BCN, (b) BTCN, (c) PCN, and (d) PTCN.
2.1.4. TEM Analysis
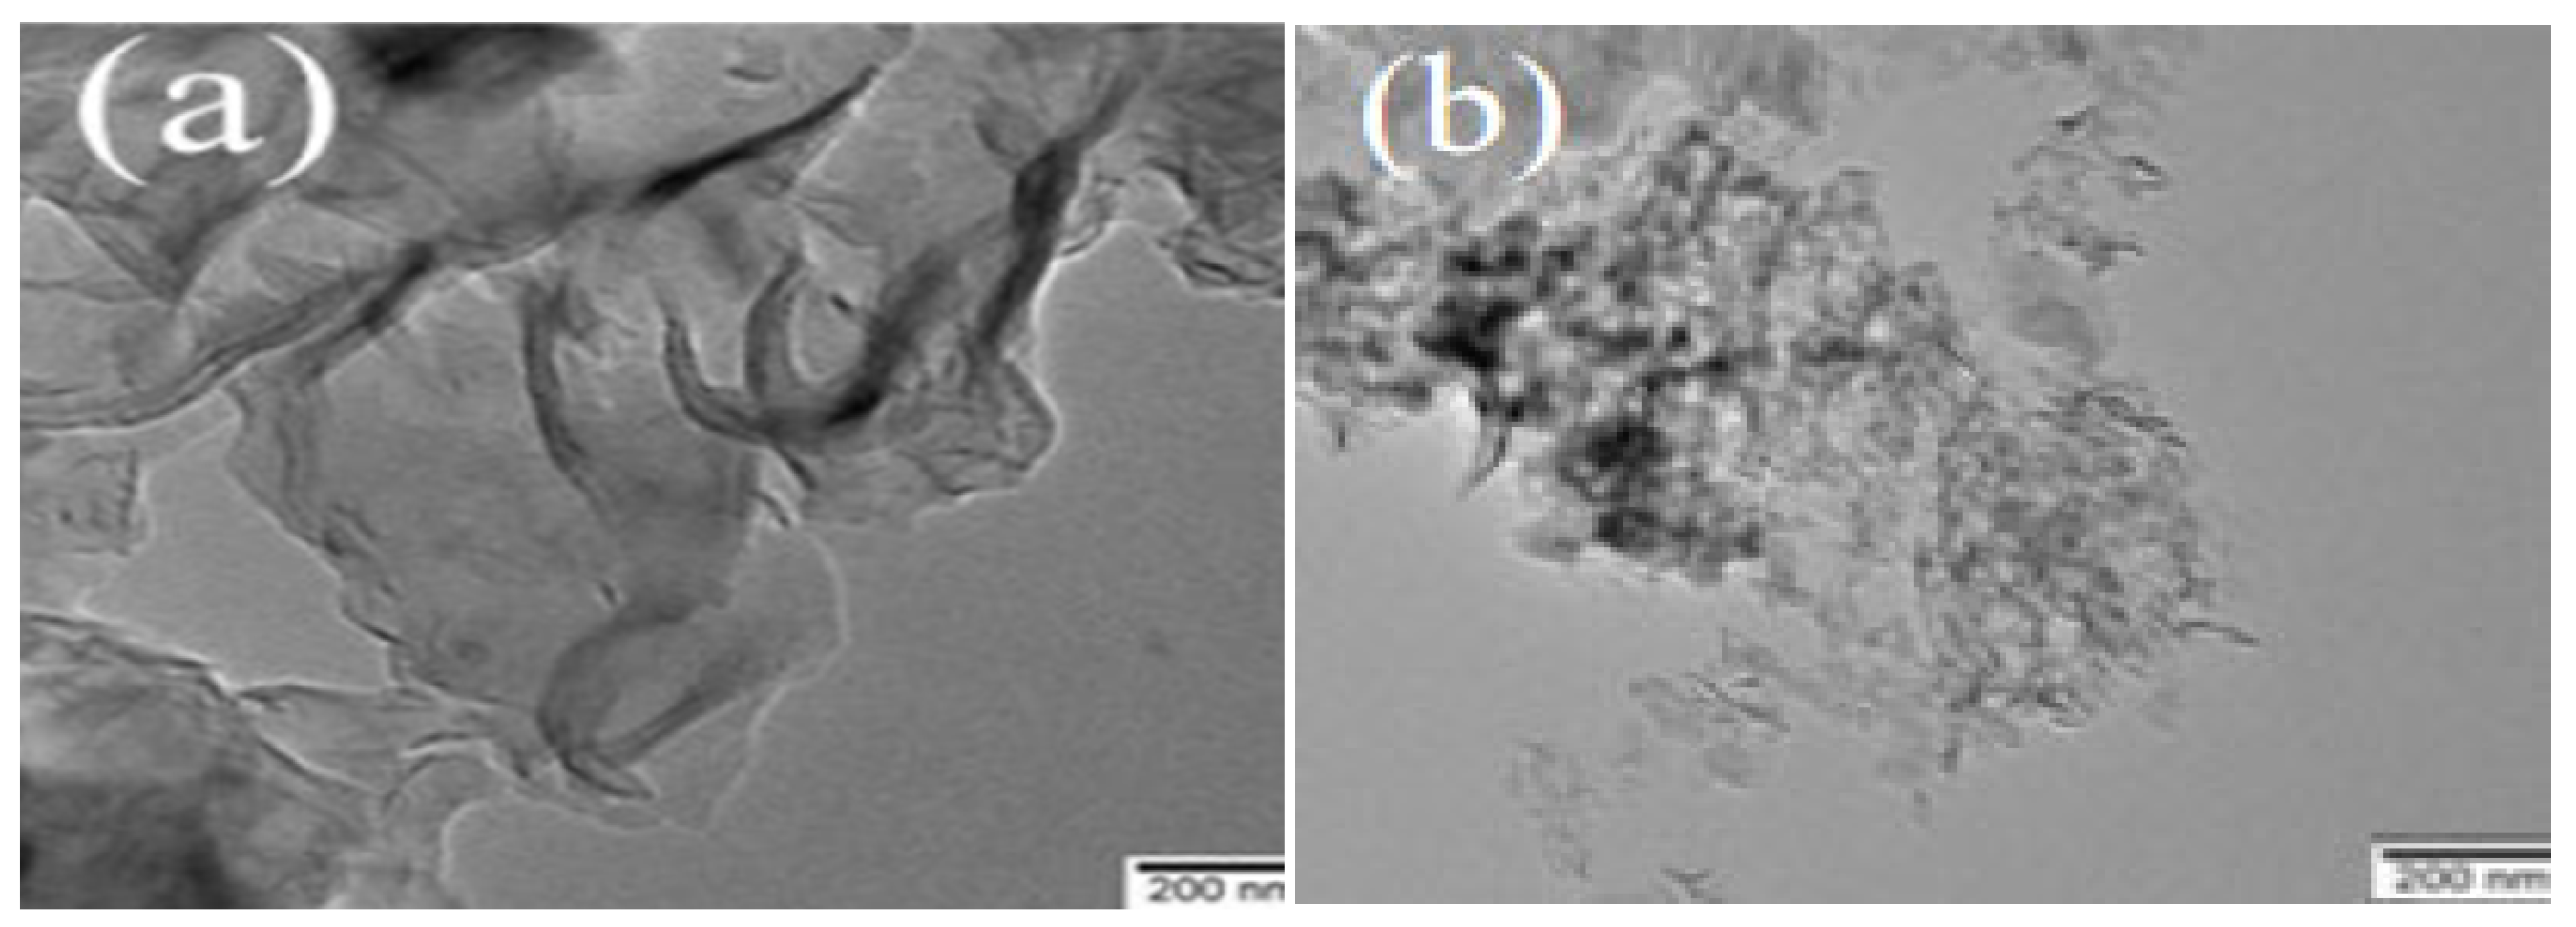
Figure 4 shows the TEM images of PCN and PTCN. The graphic illustrates that the samples consist of two-dimensional nanomaterials. The second calcined PCN is a two-dimensional sheet with a smooth and complete surface, but the size of PTCN nanosheets decreases, and more pores are formed on the surface when TCNE is added. The results show that the TCNE copolymerization process can lead to the fragmentation of nanosheets, resulting in the formation of pores on the material’s surface, which is consistent with the XRD results.

Figure 4.
TEM images of (a) PCN, (b) PTCN.
2.1.5. UV-Vis DRS Analysis
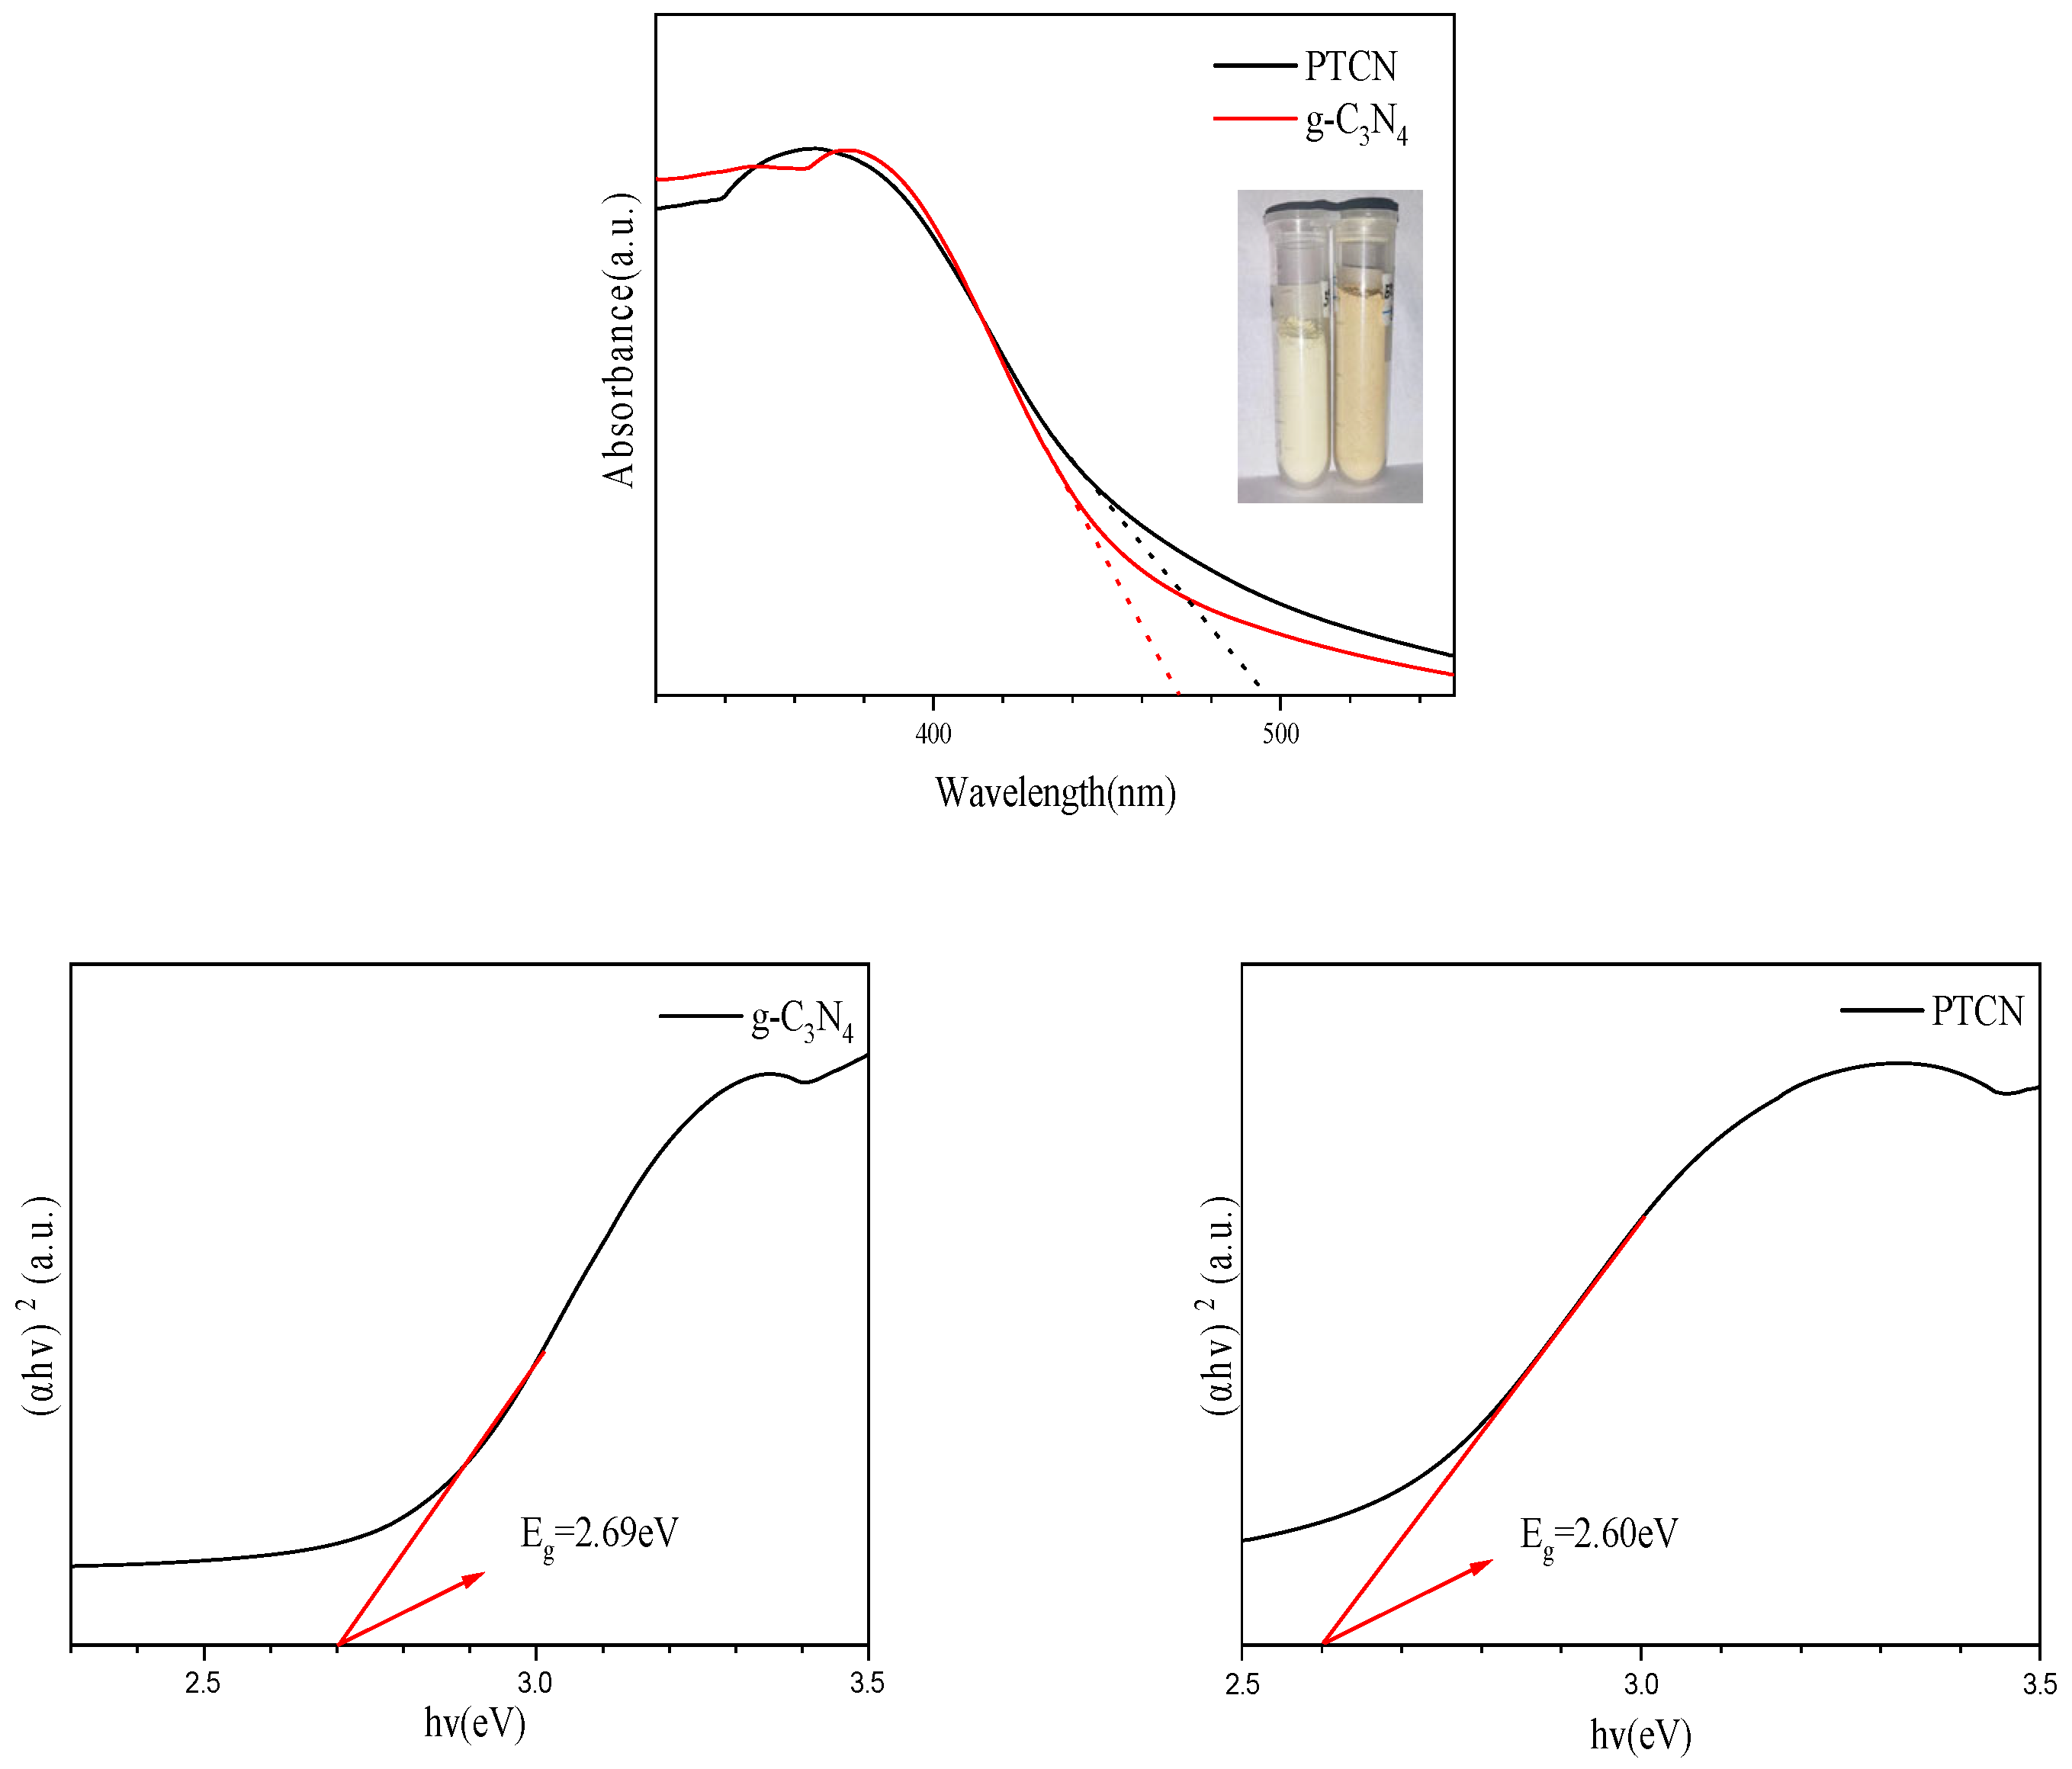
Figure 5 shows that the absorption thresholds of g-C3N4 and PTCN samples appear at 471 nm and 495 nm, and the corresponding bandwidths are 2.69 eV and 2.60 eV. The color changes of the samples can also be seen in the illustration. Pure g-C3N4 is bright yellow, and with the addition of TCNE copolymerization, the color of the samples is deepened into deep yellow. This demonstrates that TCNE copolymerization can successfully close the band gap, enhance the visible light region’s absorption, raise the sample’s photoexcitation efficiency, and, to some extent, raise photocatalytic activity.
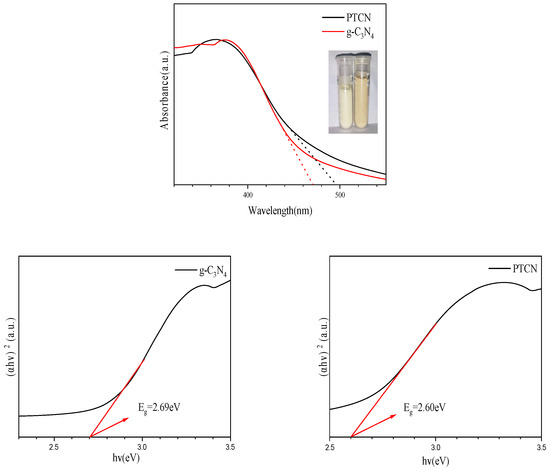
Figure 5.
UV-Vis and Eg images of g-C3N4, PTCN.
2.1.6. XPS Analysis
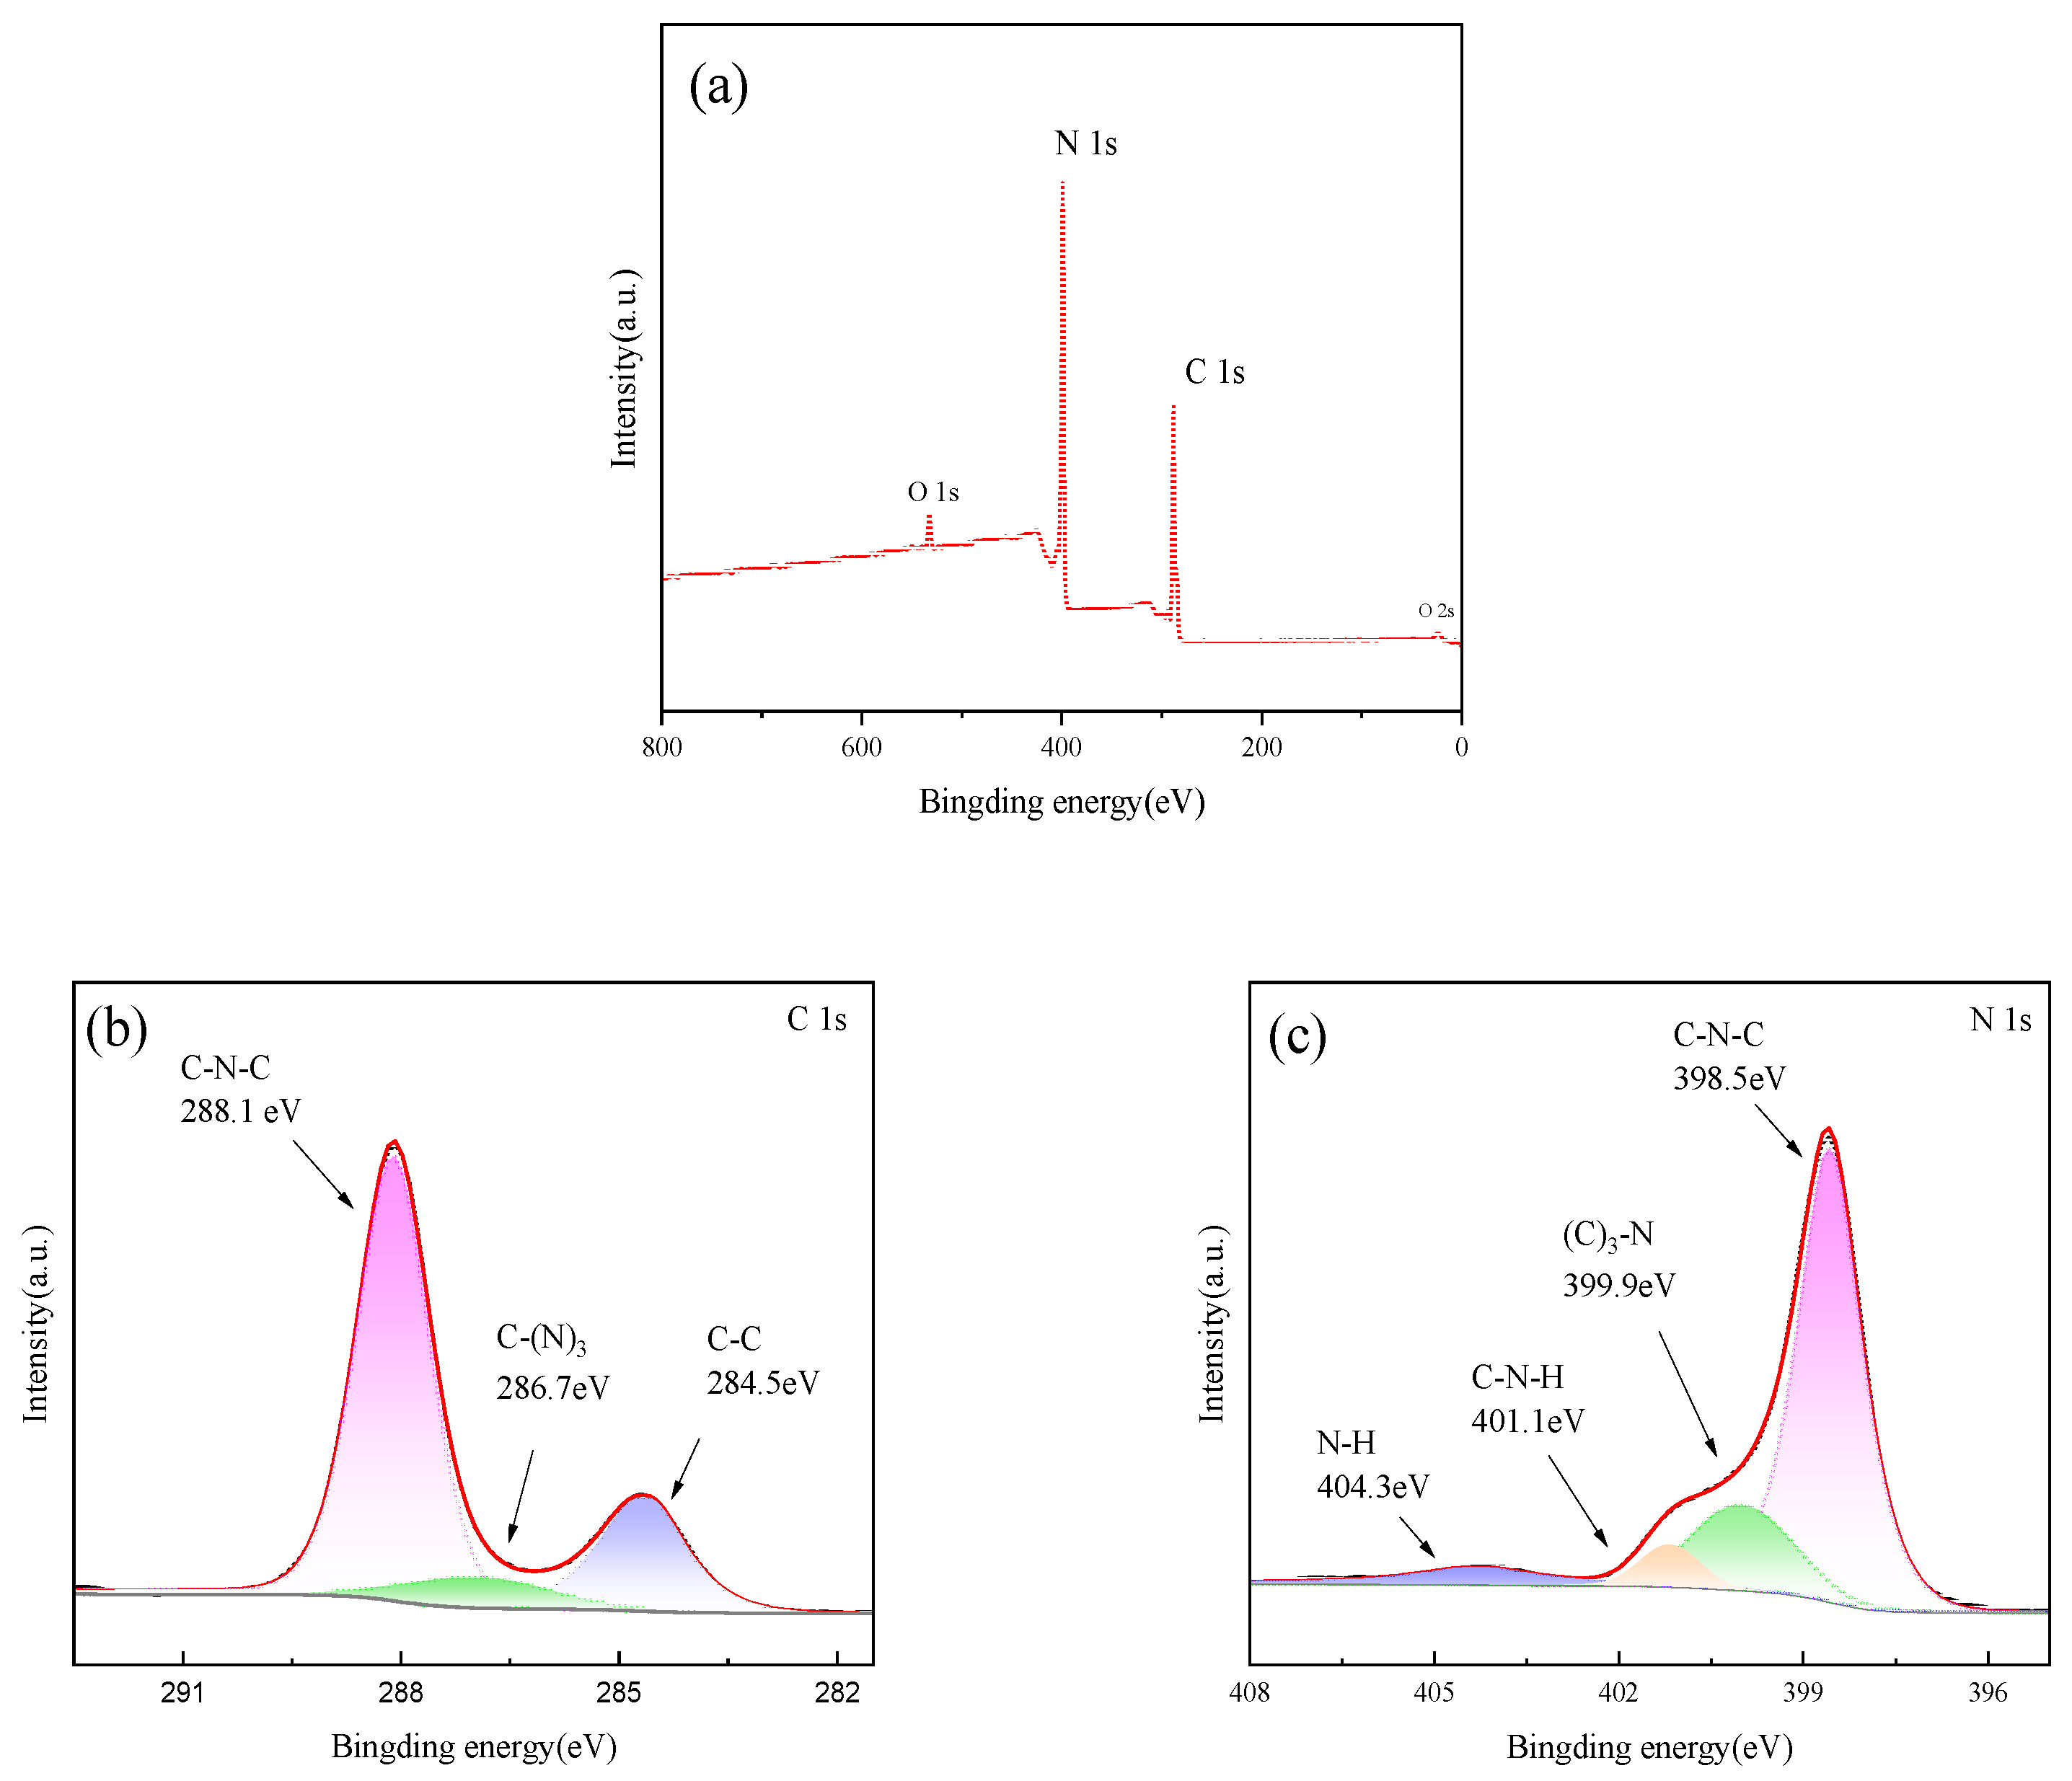
Figure 6 shows the XPS diagram of sample PTCN. It can be seen from Figure 6a that sharp photoelectron peaks appear at the binding energies of 287 eV and 399 eV, which are attributed to C1s and N1s, respectively, indicating that the sample is mainly composed of carbon and nitrogen. Figure 6b shows that for C1s, three peaks of 284.5, 286.7, and 288.1 eV can be fitted. The first peak refers to the characteristic peak of the presence of C atoms in the sample, the second peak is attributed to the C–(N)3 bond, and the third peak is the typical signal of sp2 hybrid carbon, which can be identified as the C-N=C bond in g-C3N4. Figure 6c shows that the N1s spectrum can be simulated to synthesize four peaks, among which the peaks centered at 398.5 eV and 399.9 eV correspond to sp2 hybrid nitrogen (C-N=C) and N–(C)3 in the triazine ring, respectively, while amino functional groups generate the weak peaks at 401.1 and 404.3 eV. This may be due to incomplete condensation of the amino group.
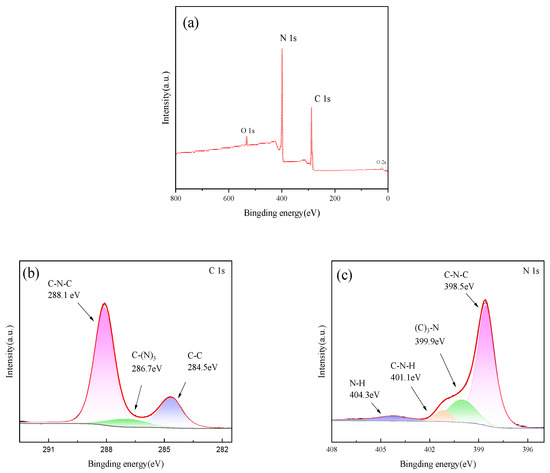
Figure 6.
XPS spectra of PTCN (a) total spectrum, (b) C spectrum, (c) N spectrum.
2.1.7. Photoluminescence Analysis (PL)
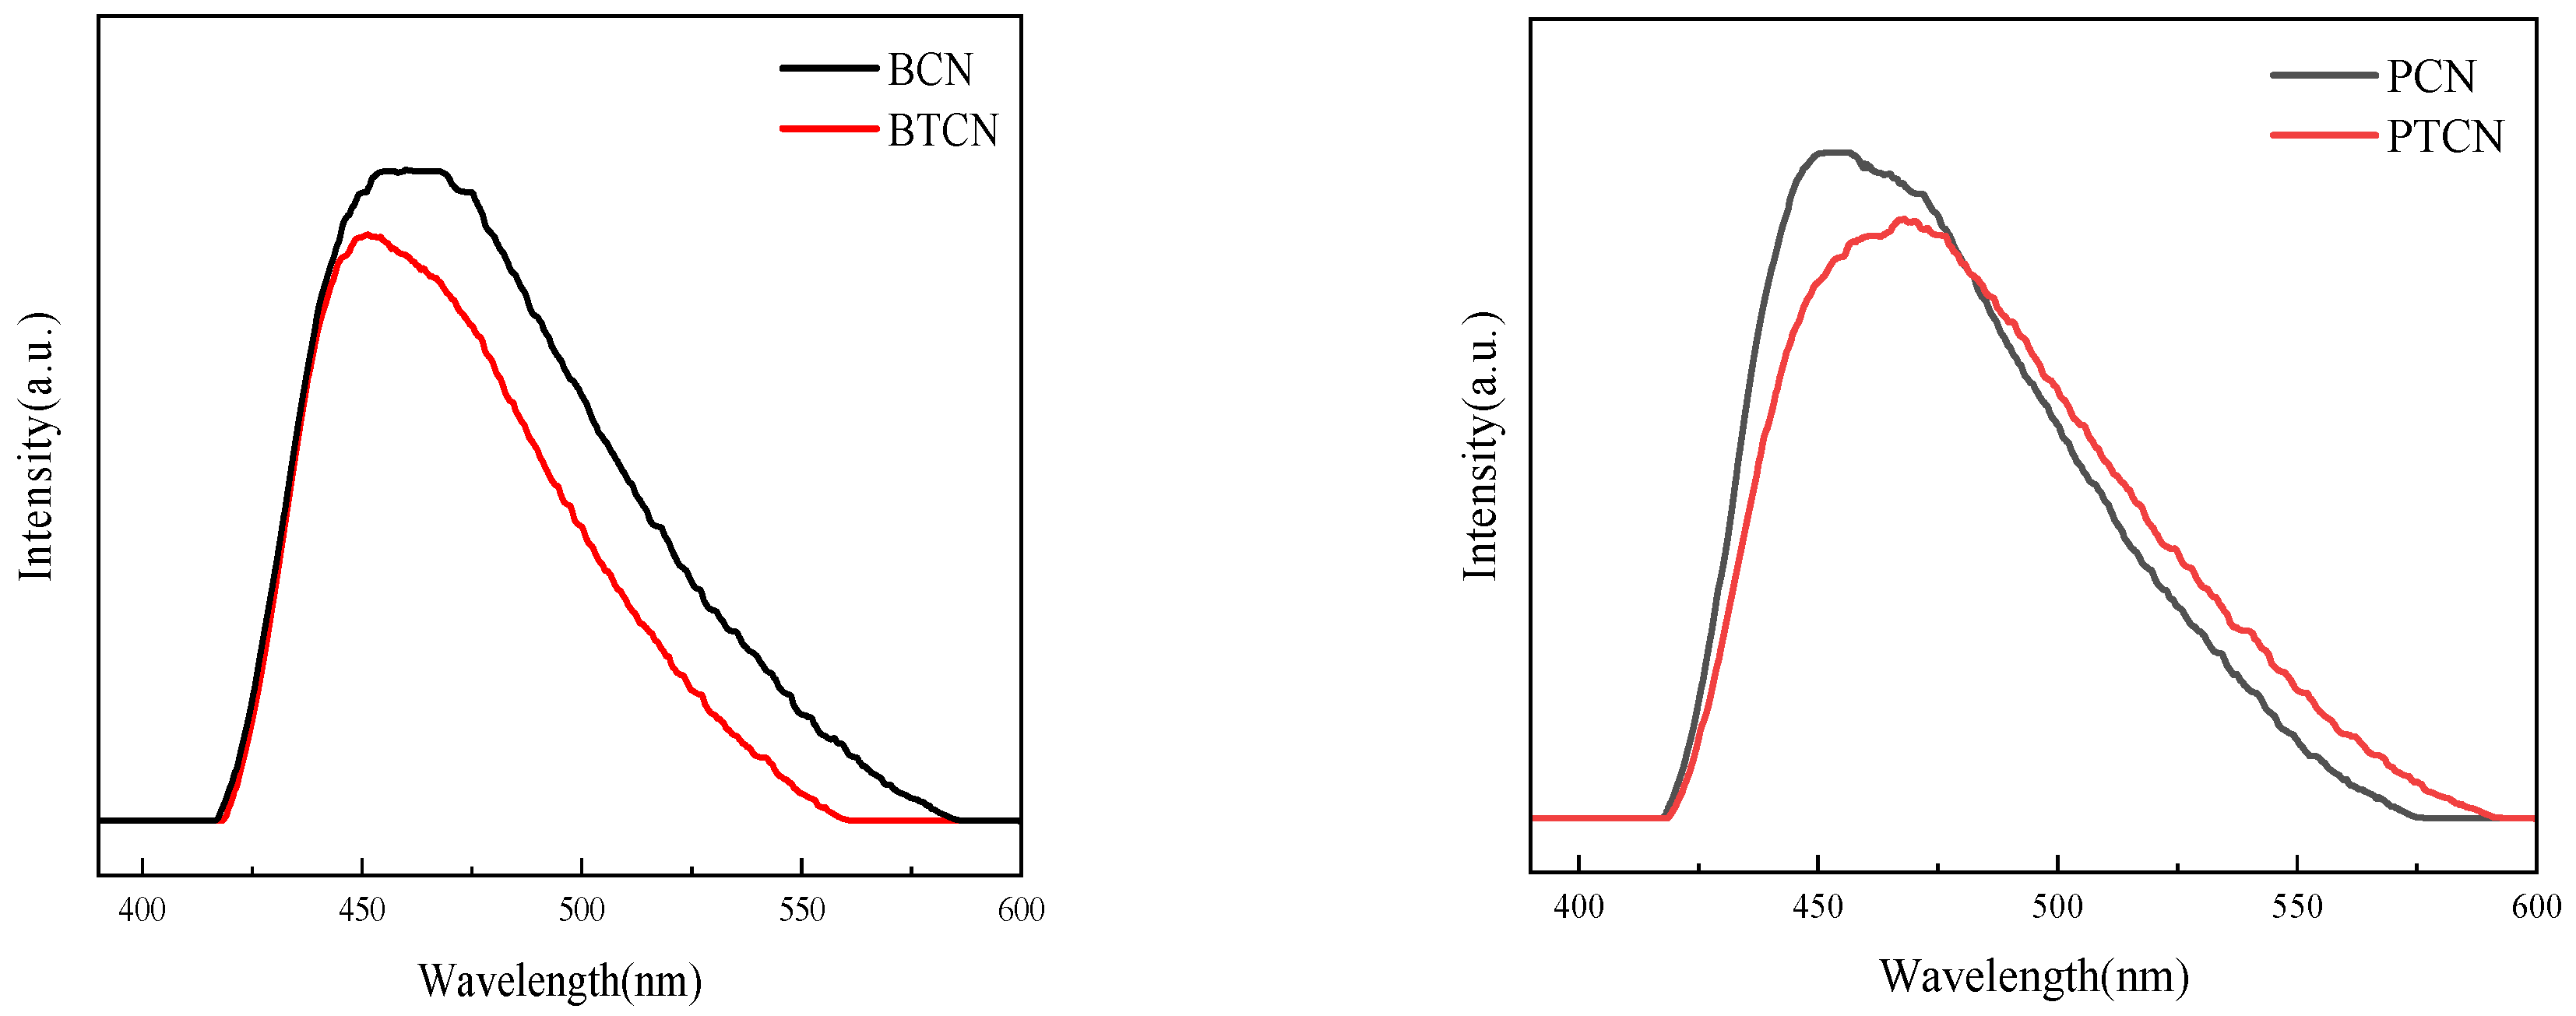
A photoluminescence (PL) emission spectroscopy was used to investigate the transfer and recombination of photogenerated carriers in semiconductor materials. Figure 7 shows the PL spectrum of each sample. The images in Figure 7 show that in the visible light band (about 420 to 550 nm), all samples can produce fluorescence signals, indicating that the material can generate electron-hole pairs when absorbing photons, which is a critical step in triggering a photocatalytic reaction. With the addition of TCNE copolymerization, PL signal intensity decreases, indicating that the photogenerated carrier recombination rate decreases. TCNE copolymerization can inhibit the photogenerated electron-hole carrier recombination and improve its separation efficiency. The increase in charge separation efficiency can be attributed to the increase in sample pore volume and surface area, which is favorable for the transfer and separation of photogenic charge carriers, extending their lifetime and thus reducing PL strength.

Figure 7.
PL images of BCN, BTCN, PCN, and PTCN.
3. Experiment and Discussion
3.1. Study on Photocatalytic Degradation of Tetracycline by TCNE Copolymerization g-C3N4
3.1.1. Degradation of Chloromycetin Hydrochloride by Different Samples
Figure 8 shows the photocatalytic effects of different BCN, BTCN, PCN, and PTCN samples on chloramphenicol hydrochloride. It is evident from Figure 8a that, as time elapses, although the degradation rates of all samples exhibit certain trends of change, the degradation rate curves of BCN and PCN are relatively gentle overall. In contrast, the curves of the copolymerized BTCN and PTCN are steeper, which indicates that within the same time period, BTCN and PTCN significantly enhance the degradation efficiency of chloramphenicol hydrochloride. When we look at Figure 8b, under dark conditions, the decline amplitudes of each curve in the initial stage are similar, suggesting that when there is no photocatalytic effect, the differences in the impacts of different samples on chloramphenicol hydrochloride are relatively small. However, after entering the light-irradiation stage, the decline speeds of the curves corresponding to BCN and PCN are notably lower than those of BTCN and PTCN. In particular, the curve of PTCN declines most rapidly, which corresponds to the trend of degradation rate changes in Figure 8a and further proves that the copolymerized TCNE samples possess stronger photocatalytic activity. Considering the relationship between ln(A/A0), the light-irradiation time in Figure 8c, and the bar chart of reaction rate constants in Figure 8d, the slope of the curve in Figure 8c reflects information related to the reaction rate. The slope of the curve of PTCN is relatively large, which is consistent with the fact that it has the largest reaction rate constant (0.013 min−1) in Figure 8d. On the other hand, both BCN and PCN have relatively small values in terms of both the curve slope and the reaction rate constant. This series of figures collectively demonstrates that after the copolymerization of TCNE, samples such as BTCN and PTCN, due to the synergistic effects of increased sample surface area, enhanced visible light absorption capacity, and improved electron-hole separation efficiency, exhibit superior photocatalytic activity compared to BCN and PCN. Meanwhile, the adsorption capacity of flaky samples during the dark reaction is weaker than that of bulk samples, which also provides additional reference information from more dimensions for the study of this photocatalytic system.
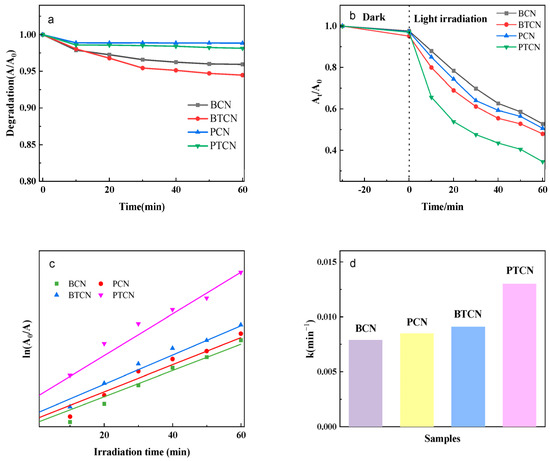
Figure 8.
Photocatalytic performance of BCN, BTCN, PCN, and PTCN: (a) Degradation Effect Over Time. (b) Photocatalytic Degradation Rates of Different Samples. (c) Assessment of Reaction Kinetics. (d) Reaction Rate Constants.
3.1.2. Different Tetracycline Concentrations’ Effects on Catalytic Action
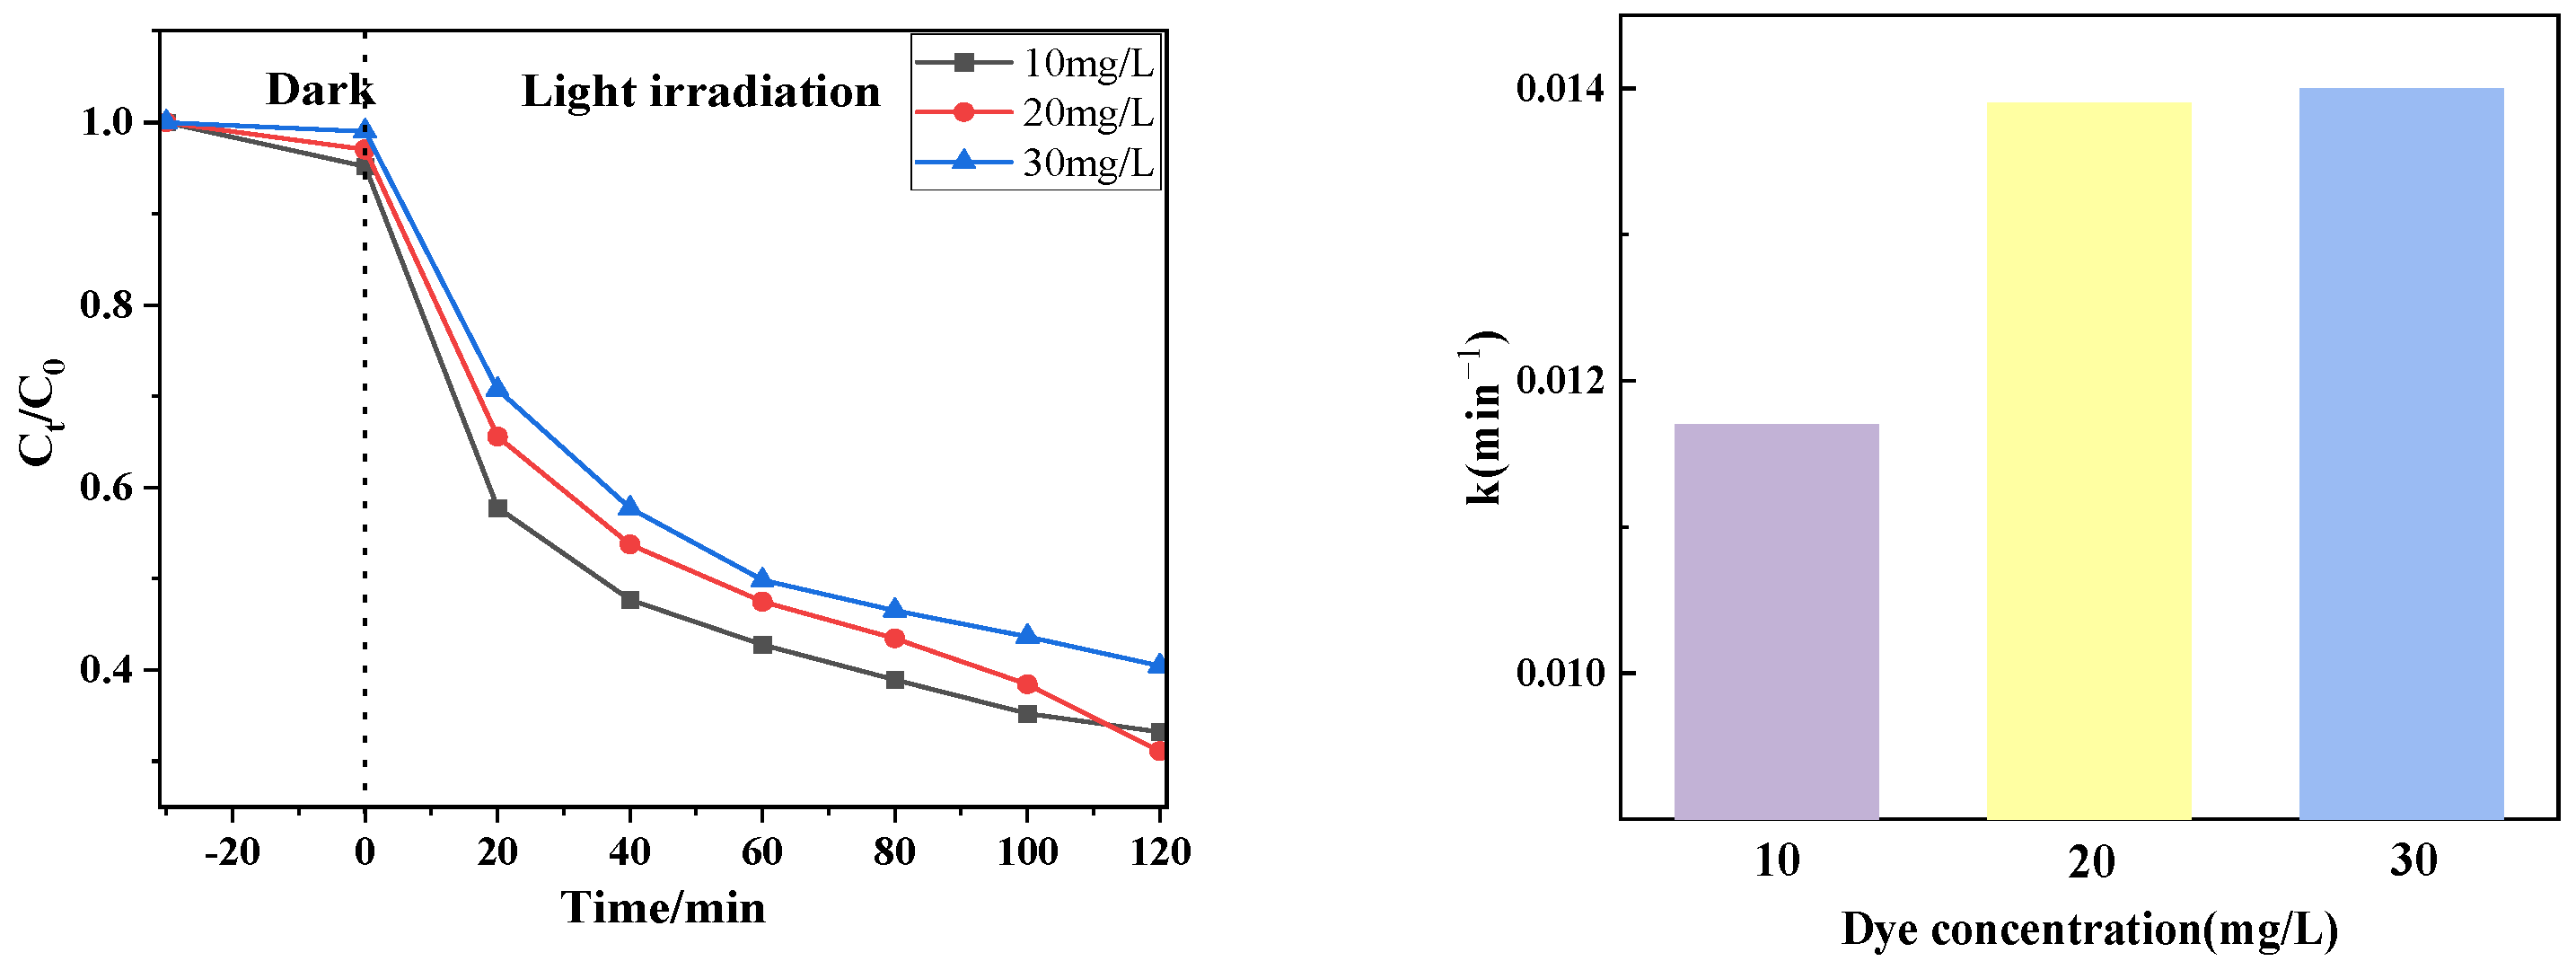
Figure 9 shows the photocatalytic effect of degradation of different concentrations of drugs (10 mg/L, 20 mg/L, 30 mg/L) using PTCN samples. It can be seen from the figure that the catalytic degradation effect is related to the tetracycline concentration. When the tetracycline concentration is 20 mg/L, the catalytic effect is the best; when the tetracycline concentration is 30 mg/L, the catalytic effect is the worst. The reasons for this change are as follows: for PTCN samples, the photogenerated electron holes are unchanged at the same time under the condition of illumination; that is, the generated active substances are constant. When the concentration of tetracycline increases, the active substance that can catalyze the degradation of tetracycline does not increase, and too many tetracycline molecules will block the absorption of light by the catalyst, which will inevitably lead to a poor degradation effect.
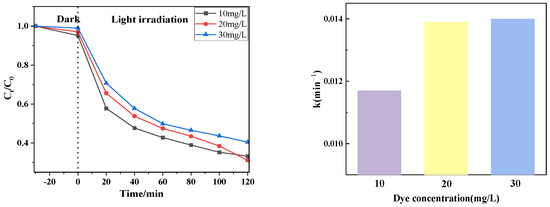
Figure 9.
Photocatalytic effect at different CTC-HCl concentrations.
3.1.3. Influence of Different Catalyst Dosages on Catalytic Effect
Figure 10 shows the photocatalytic effect of degradation of tetracycline at 20 mg/L concentration using PTCN samples of different qualities (0.25 g/L, 0.5 g/L, 0.75 g/L, 1 g/L). It can be seen from the figure that the catalytic degradation effect decreases with the decrease in the sample dosage of PTCN. The catalytic effect is the best when the sample dosage is 0.75 g/L and the worst when the sample dosage is 0.25 g/L. The reason for this change is that, for PTCN samples under the same lighting conditions, the greater the dosage, the more photogenerated electron holes will generate active compounds. An increase in catalyst dosage elevates the system’s turbidity, resulting in intensified light scattering effects. When the dosage exceeds a critical threshold (0.75 g/L), the penetration depth of light in the solution decreases significantly, weakening the actual light intensity received on the surface of the photocatalyst and inhibiting the generation of photogenerated carriers. At high dosages, catalyst particles are prone to aggregation, leading to a reduction in specific surface area and pore blockage, which impairs the contact efficiency of pollutant molecules with active sites. Furthermore, particle aggregation exacerbates light reflection, further decreasing the utilization rate of light energy. Although an increased catalyst dosage provides more active sites, the probability of photogenerated carrier recombination also increases, as evidenced by enhanced fluorescence intensity in PL spectra for high-dosage samples. When the number of active sites surpasses the light excitation capacity, excess sites cannot effectively participate in the reaction, forming “inactive loading”. In summary, the optimal dosage of PTCN is 0.75 g/L, as this condition achieves a dynamic balance between the number of active sites and light penetration efficiency while avoiding the negative effects caused by particle aggregation [25,26].
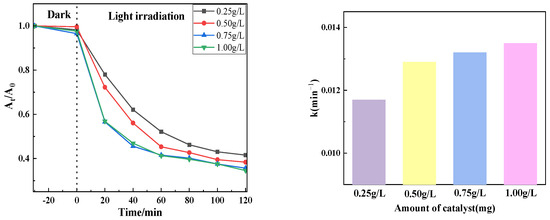
Figure 10.
Photocatalytic effect at different catalyst usage.
3.1.4. Different pH Values’ Effects on the Catalytic Action
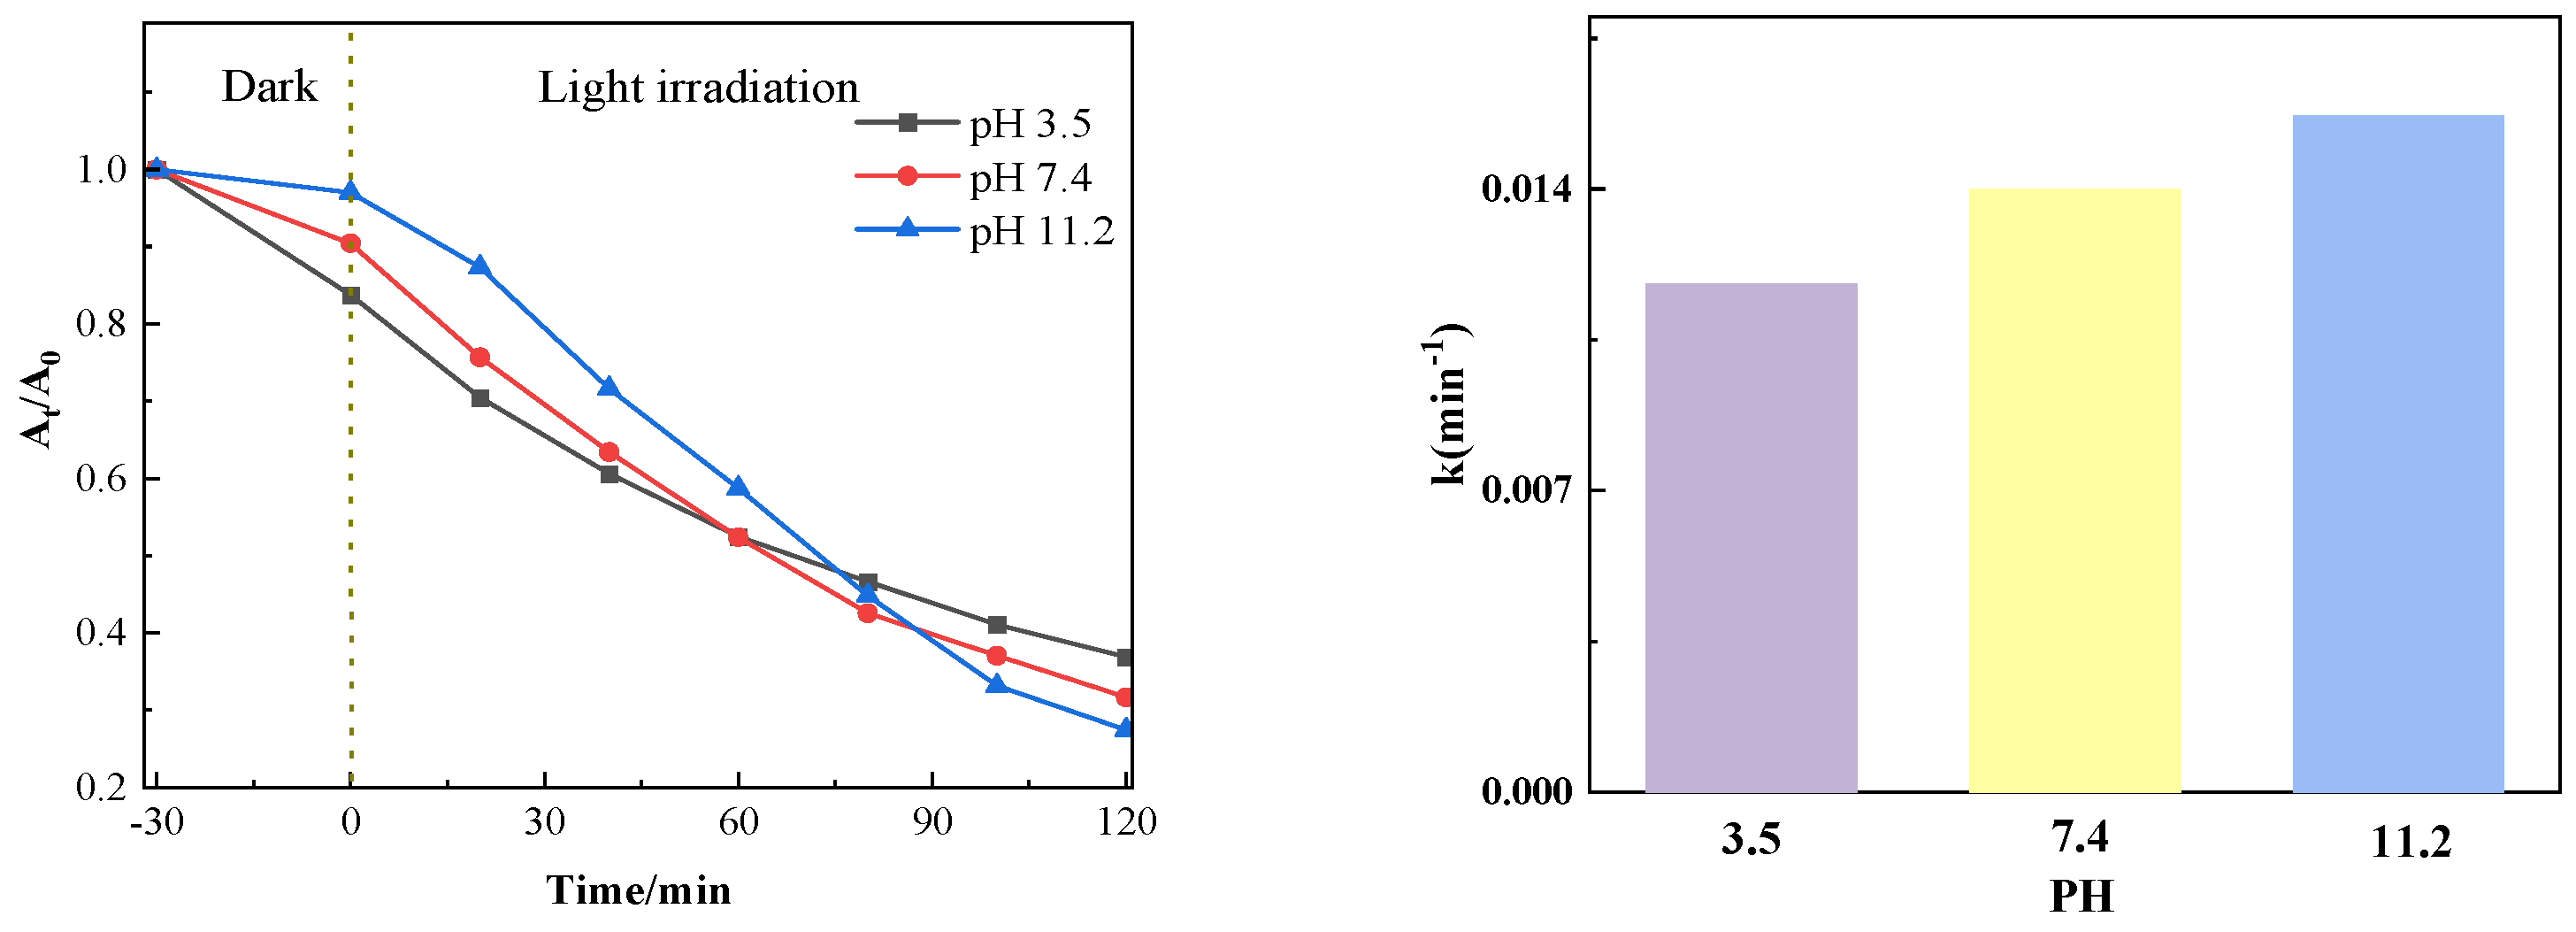
Figure 11 shows the influence of different pH values on the catalytic degradation effect. It can be seen from the figure that after the dark reaction, when the adsorption equilibrium between the pollutant and the catalyst is reached, the lower the pH of the solution, the greater the adsorption capacity of the catalyst, which is conducive to the degradation of the pollutant. When the pH value of the system increases, although the adsorption is weakened, the increase of OH− in the solution is conducive to forming more free radicals, thus accelerating the degradation. Changes in pH significantly alter electrostatic and non-electrostatic interactions by influencing the surface charge of the catalyst and the ionization state of pollutant molecules, thereby affecting adsorption capacity and radical generation efficiency. Enhanced adsorption capacity at low pH values and increased radical production at high pH values collectively ensure the efficient degradation performance of PTCN samples under different pH conditions, providing strong support for their application in practical wastewater treatment.
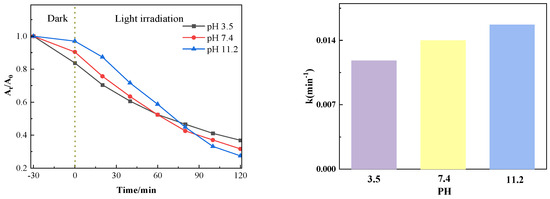
Figure 11.
Photocatalytic effect at different pH levels.
3.1.5. Influence of Different Temperatures on Catalytic Effect
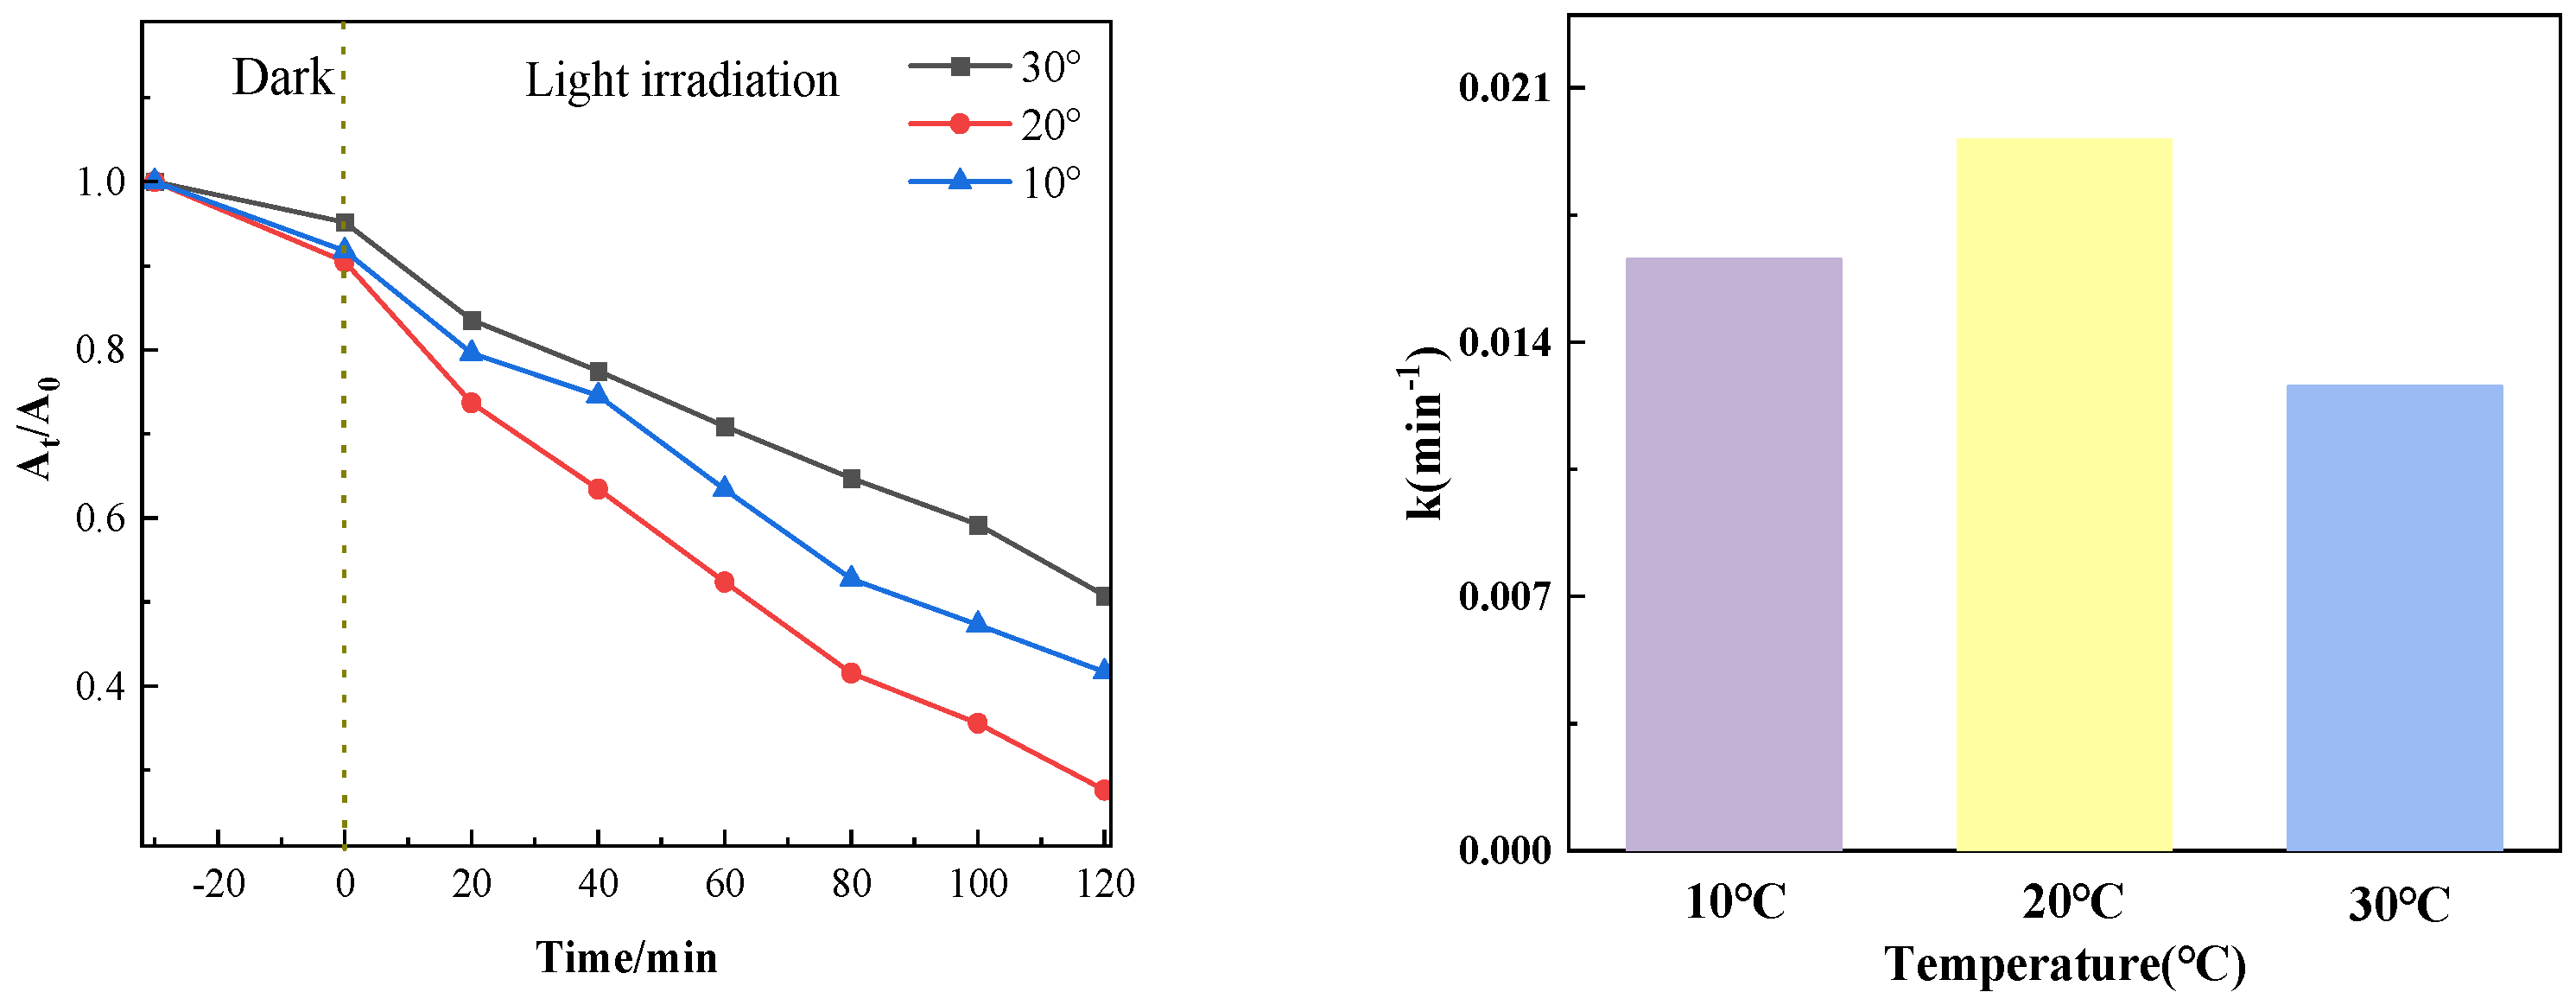
Figure 12 shows the photocatalytic degradation effect when the amount of PTCN is 0.75 g/L, the concentration of chloromycetin hydrochloride is 20 mg/L, and the photocatalytic degradation temperature of chloromycetin is varied (10 °C, 20 °C, 30 °C). As can be seen from the figure, the photocatalytic degradation efficiency gradually decreases with the increase in temperature.
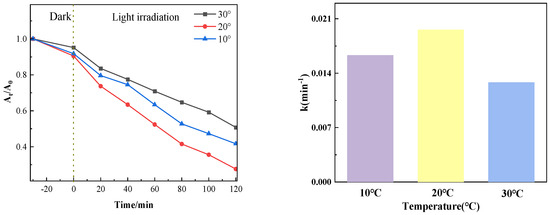
Figure 12.
Photocatalytic effect at different temperatures.
3.1.6. Comparison of Catalytic Effects of Degradation of Different Tetracyclines in Samples
The dark reaction was conducted for thirty minutes after the PTCN samples were added to TC, OTC, and CTC solutions. At that point, it stopped, and the light response began. The samples exhibited an excellent ability to degrade tetracycline antibiotics, as shown by the figure after the photocatalytic reaction was conducted for 90 min. The first-order kinetic approach was employed to model the photocatalytic degradation kinetics of TC, OTC, and CTC. The Figure 13 illustrates a strong linear correlation between the photocatalytic reaction time (t) and each medication’s concentration ratio, ln(C0/Ct).
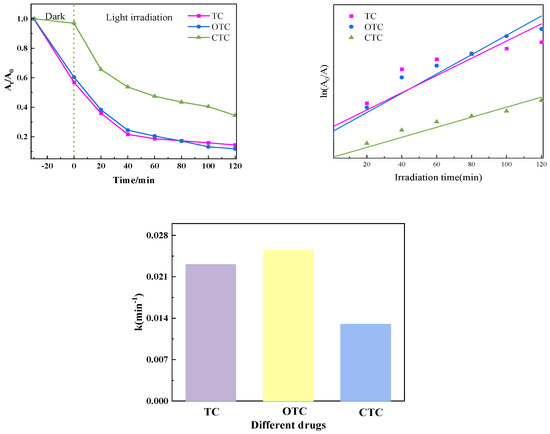
Figure 13.
Photocatalytic effect of degradation of different tetracyclines in PTCN samples.
3.2. Investigation of Photocatalytic Stability
3.2.1. Experimental Investigation of Photocatalytic Reuse
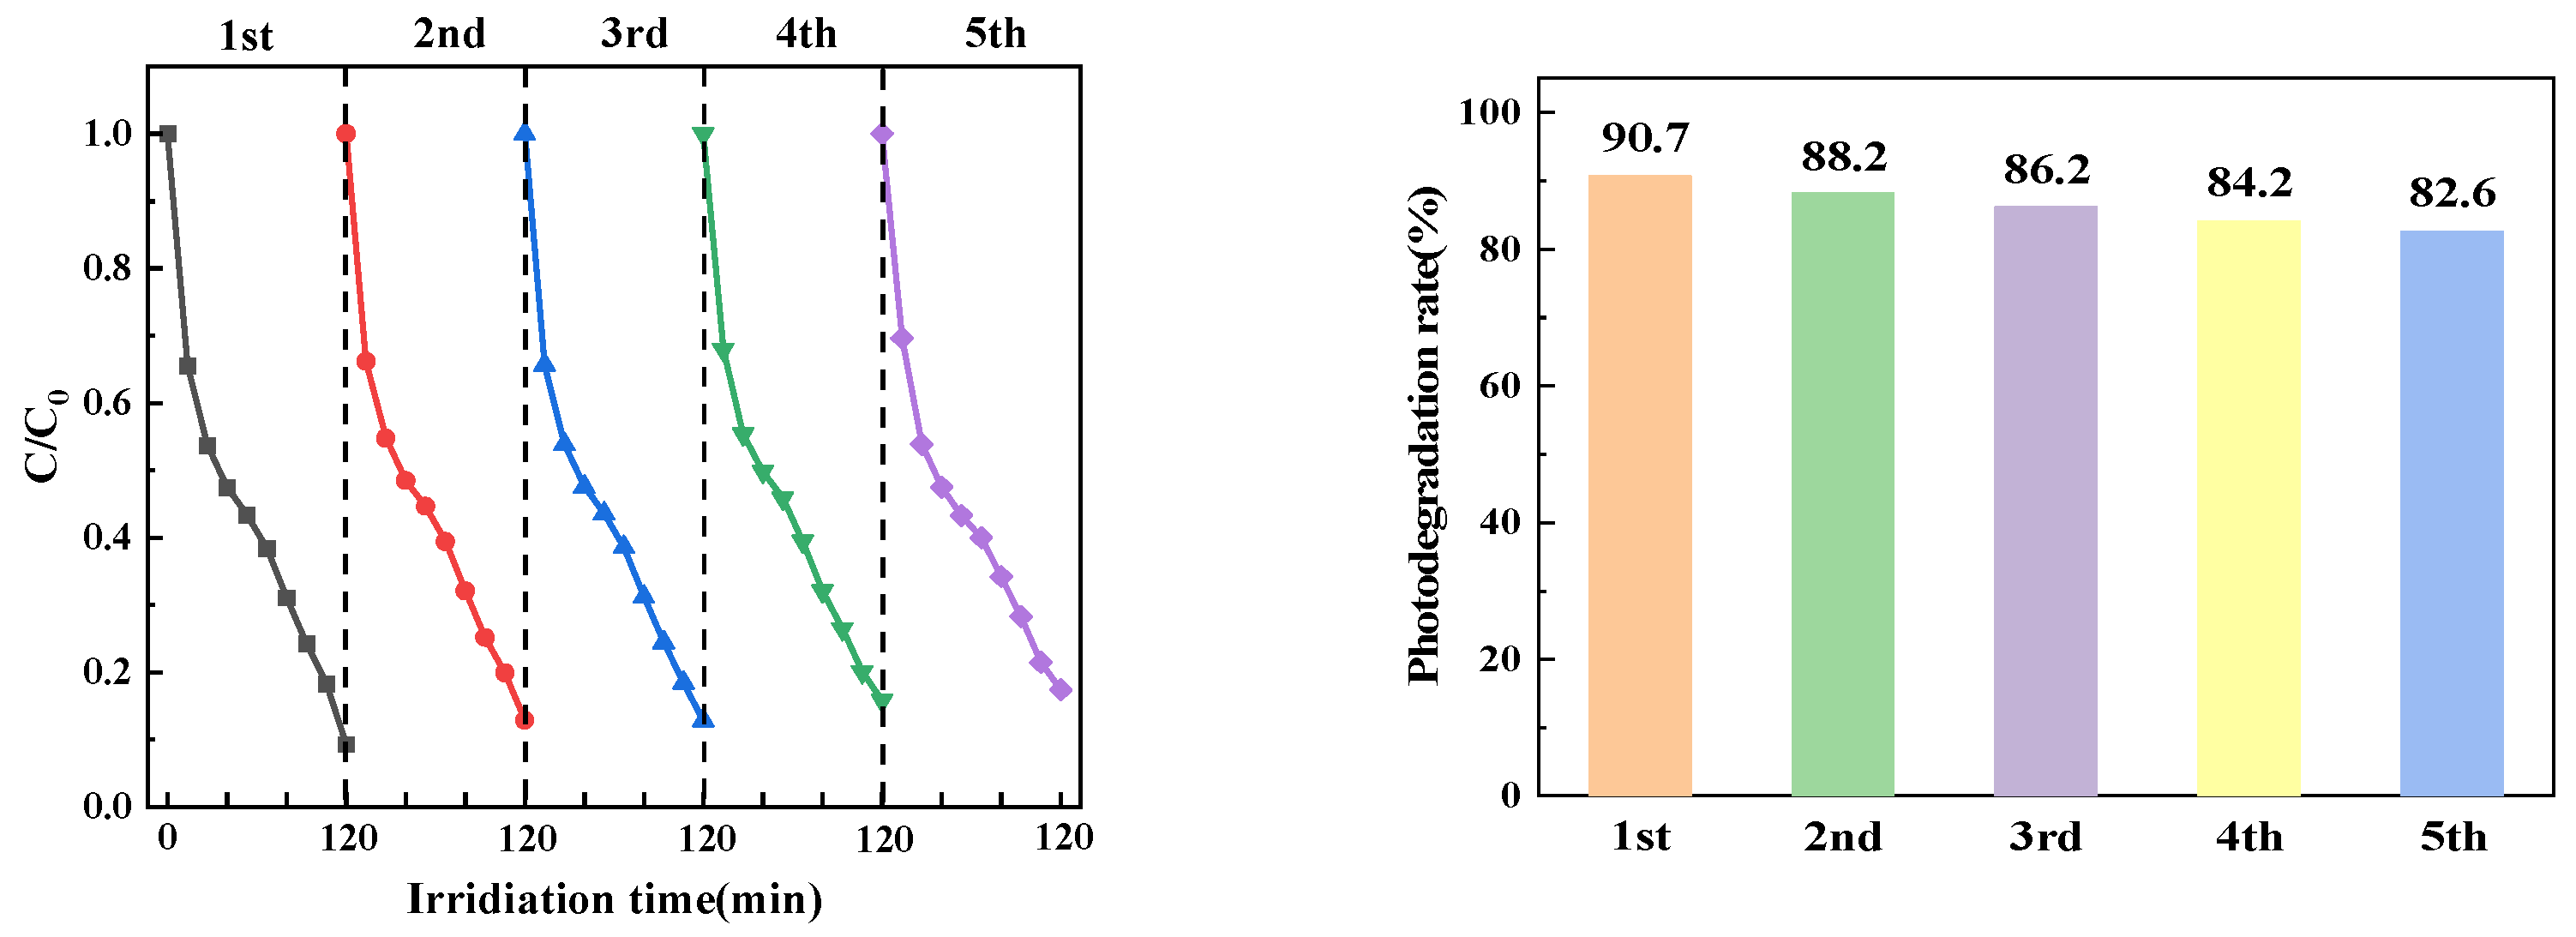
In practical applications, the stability of photocatalysts is a significant factor to be considered. The reaction process of PTCN degradation of CTC was repeated by collecting, washing, and drying the remaining catalysts for the next cycle test. As shown in the Figure 14, even after five reuses, the degradation rate of the PTCN photocatalyst still reached 82.59%, which indicates that the photocatalyst has high stability and catalytic efficiency.
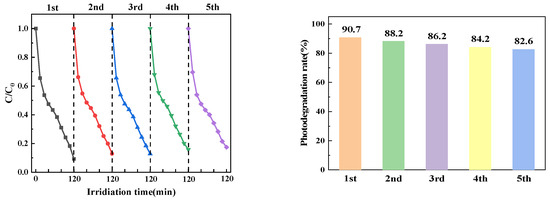
Figure 14.
PTCN sample cycle test diagram.
3.2.2. Characterization and Analysis of Photocatalyst Stability
In order to further study the structure and chemical stability of the photocatalyst, XRD analyzed the samples before and after the photocatalytic reaction.
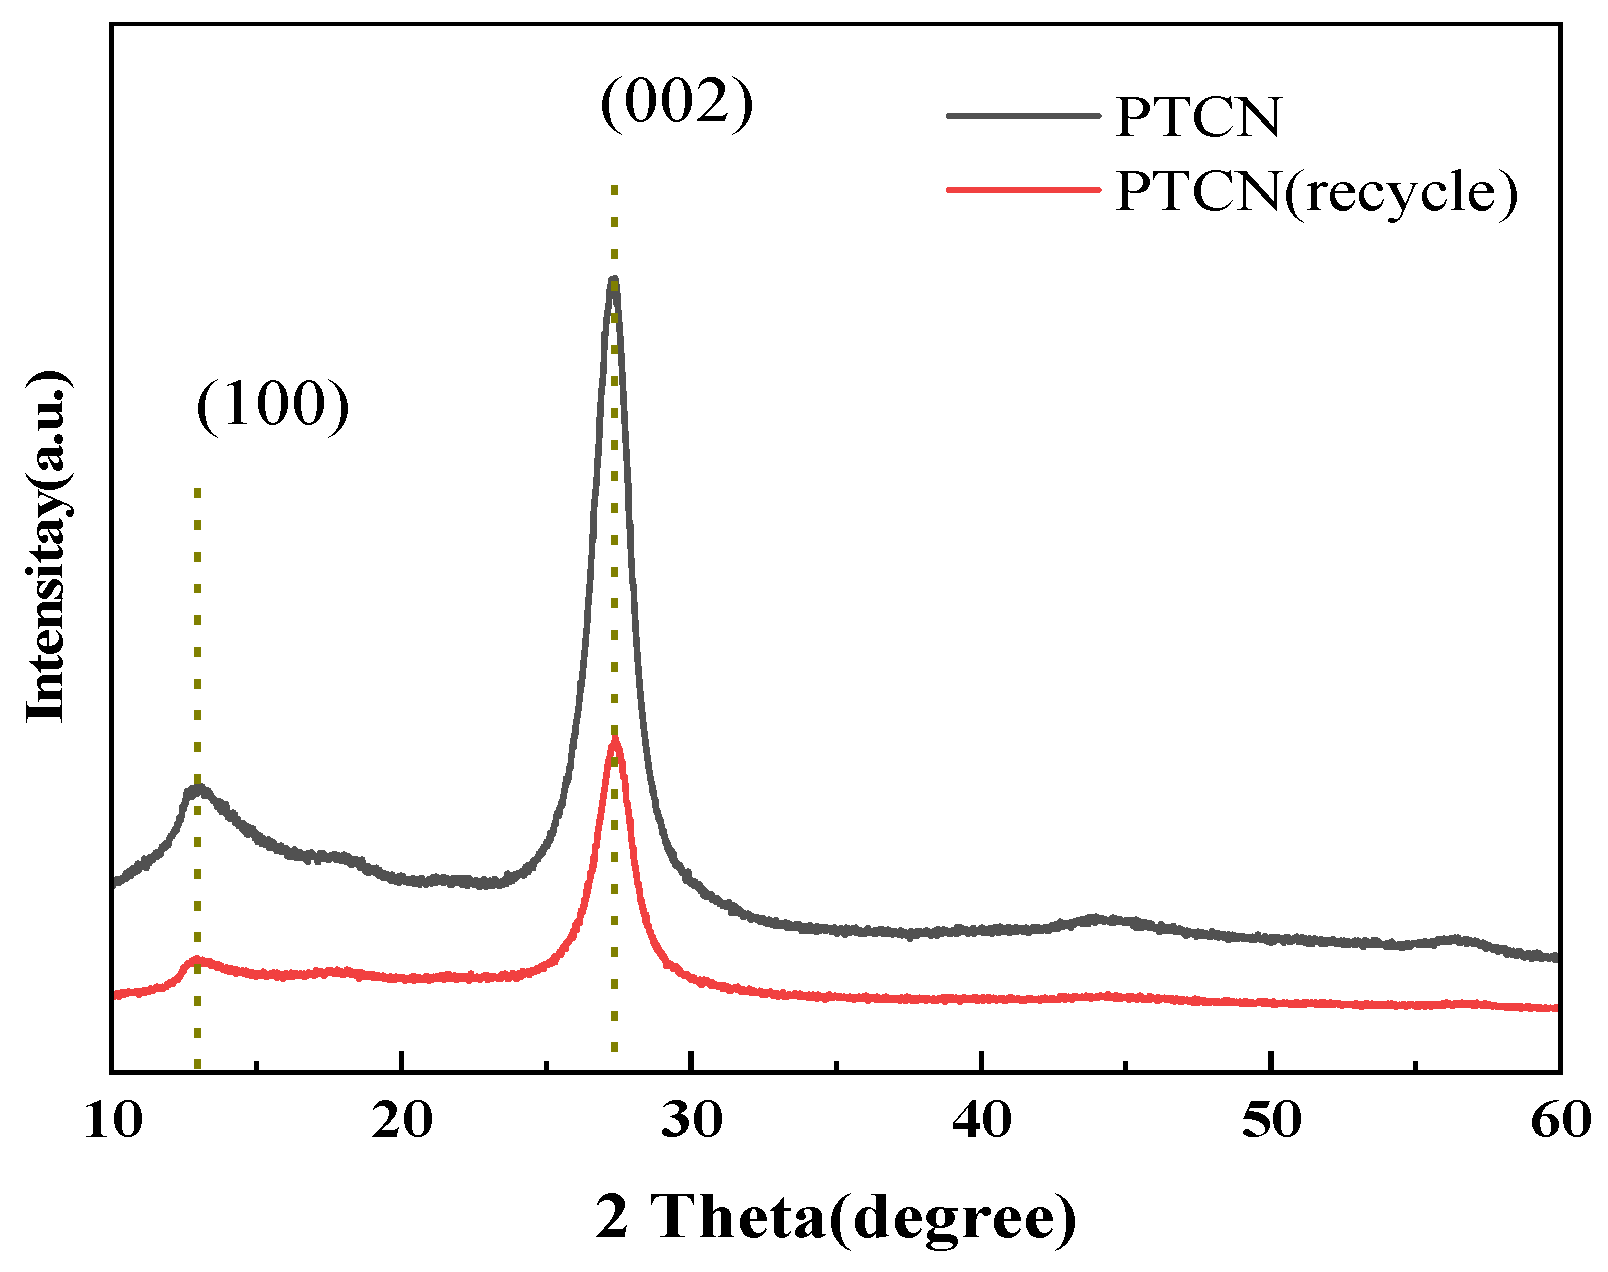
Figure 1 and Figure 2 show that the XRD and FTIR spectra of the PTCN photocatalytic composite used are almost identical to those of the initial sample. The results show that the PTCN composite photocatalyst is stable. Figure 15 shows the XRD test results of CN/TCNE-40 samples before and after reuse. The results show that after reuse, the characteristic peaks (100) and (002) of CN/TCNE-40 samples still exist, indicating that the material’s structure has not changed and is still a graphene-like structure. However, the XRD peak strength becomes weaker, and the half-peak width increases, which should cause a certain degree of photo corrosion in the photocatalysis process.
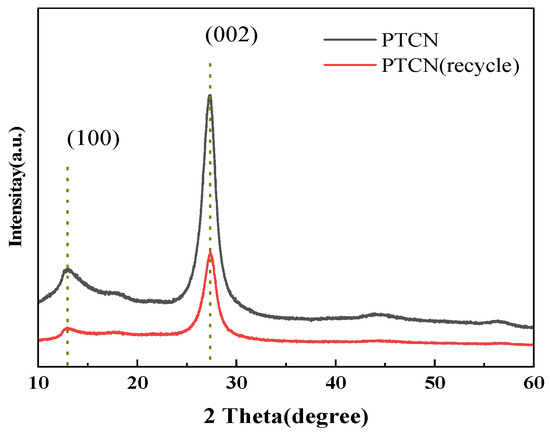
Figure 15.
XRD of PTCN sample before the recycling and after the recycling reuse experiment.
3.3. Probe into the Mechanism of Photocatalytic Reaction
3.3.1. Experiments of Different Trapping Agents
The radical trapping experiment can determine the main active substances in the photocatalysis process and then speculate the possible reaction mechanism. In the experiment, 1, 4-benzoquinone (BQ), tert-butanol (t-BaOH), and EDTA-2Na were used to trap superoxide free radicals (•O2−), hydroxyl free radicals (•OH), and holes (h+), respectively, with a scavenger concentration of 1 mM. Figure 16 presents the outcomes of the experiment. The photocatalytic degradation rate was dramatically decreased when BQ was added to the system to eliminate superoxide free radicals, as the figure shows. This suggests that superoxide free radicals were the primary active ingredient in our experiment. Similarly, introducing t-BaOH can also reduce the degradation rate to a certain extent, indicating that •OH also plays a specific role in the photocatalytic process. However, in this system, superoxide radicals (•O2−) and hydroxyl radicals (•OH) are the primary active species. Upon the addition of EDTA-2Na to capture holes, the hole concentration decreases, subsequently reducing the probability of electron-hole recombination. Consequently, more photogenerated electrons are available to participate in the generation of active species, thereby enhancing the degradation efficiency.
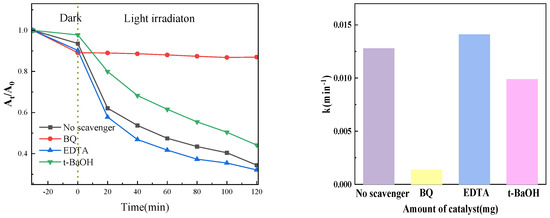
Figure 16.
Effect of different active radical capture agents on catalytic performance.
3.3.2. Discussion on the Catalytic Mechanism of Photodegradation
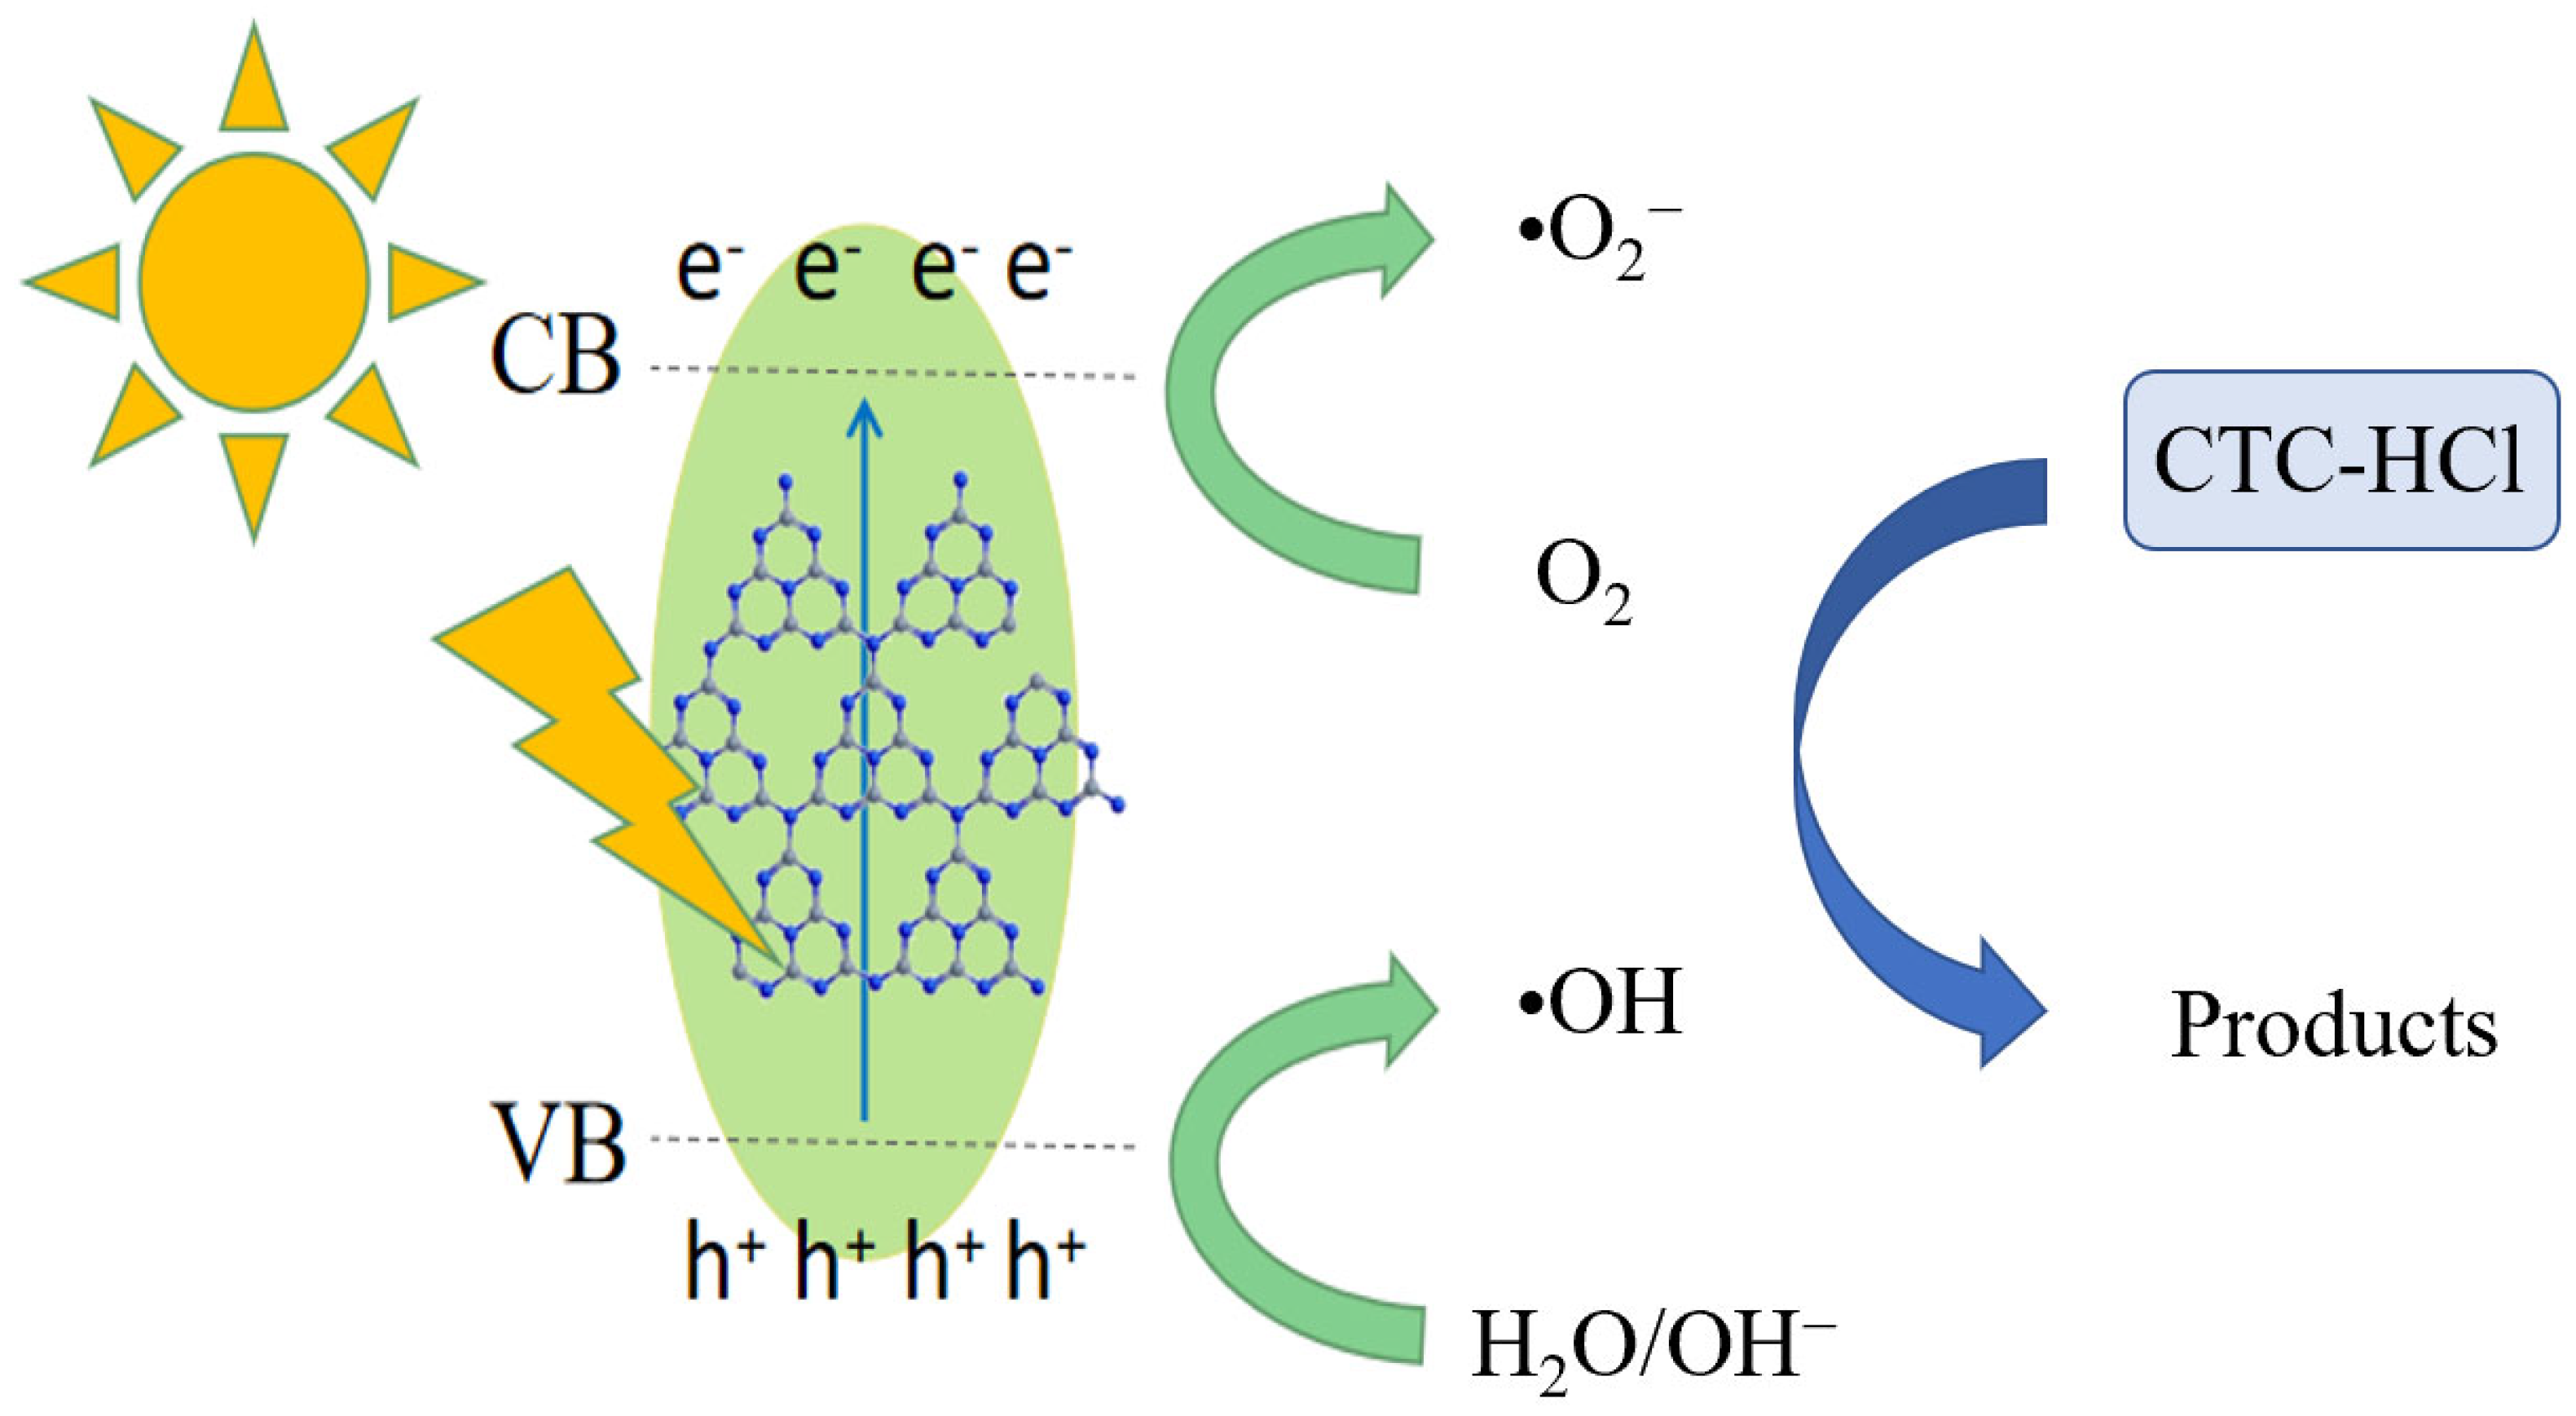
Based on the characterization and photocatalytic results of the materials, the possible photocatalytic reaction mechanism for the degradation of chloromycetin hydrochloride by PTCN materials was proposed. As shown in Figure 17, the photocatalytic degradation process was explained as the band gap width of PTCN is 2.60 eV, which can effectively absorb visible light and form photogenerated electron holes under visible light irradiation. Electrons transfer from their LUMO to the conduction band of semiconductors and react with O2 on the surface of the photocatalyst to form •O2−. At the same time, the photogenerated electrons on the sample CB can react with O2 on the photocatalyst surface to form •O2−. Photogenic holes on VB can also react with H2O to form O2, and these resulting O2 react with photogenic electrons to form •O2−. The holes produced in the system can also be directly oxidized with pollutant molecules to form superoxide radicals and be partially converted into hydroxyl radicals [27,28]. Therefore, under the combined action of •O2− and •OH, chlortetracycline hydrochloride was catalyzed and degraded. According to the existing literature references, it is known that tetracycline compounds, after undergoing a series of degradation processes, ultimately transform into non-toxic small molecular compounds [29,30,31]. TCNE copolymerization doping makes the specific surface area of g-C3N4 larger and improves the adsorption capacity of CN/TCNE samples to tetracycline, which is conducive to improving the catalytic degradation rate.

Figure 17.
Possible photocatalytic mechanisms.
4. Materials and Methods
4.1. Experimental Reagents
Melamine, TCNE (Tetracyanoethylene), Chloramphenicol, Tetracycline Hydrochloride, and Chlortetracycline Hydrochloride. All of the aforementioned reagents were procured from Aladdin Reagent Co., Ltd. (Shanghai, China), with the purity of the reagents being analytically pure.
4.2. Sample Preparation
Preparation of g-C3N4: The layered carbon nitride compound g-C3N4, analogous to graphene in structure, was prepared using the thermal condensation method. The samples were prepared by high-temperature polymerization using melamine as a precursor. After one calcination (the sample was placed in a muffle furnace under atmospheric conditions, the heating rate was controlled at 5 °C/min, and the temperature was heated to 520 °C for 4 h), a light yellow solid was obtained and ground into powder to prepare bulk graphitic carbon nitride as BCN. The material was naturally cooled to room temperature, fully ground again, and placed in a muffle furnace for secondary calcination to obtain flake graphitic carbon nitride light yellow powder as PCN. During this secondary calcination, the temperature was raised at a controlled rate of 5 °C/min until it reached 520 °C, where it was maintained for a stable 4 h period.
TCNE copolymerized g-C3N4: TCNE copolymerized g-C3N4 was prepared using melamine as the precursor and tetracyanoethylene as the copolymer. The sample was prepared by one-pot hot copolymerization and high-temperature copolymerization. The sample was placed in a muffle furnace under atmospheric conditions with the heating rate controlled at 5 °C/min and the temperature was heated to 520 °C for 4 h. The dark yellow sample was ground into powder and the graphite phase carbon nitride material was modified by bulk tetracyanoethylene and was recorded as BTCN. By weighing 1 g of BTCN, grinding it thoroughly, and placing it in a muffle furnace for secondary calcining, the obtained flake tetracyanoethylene-modified graphitic carbon nitride (g-C3N4) material was labeled PTCN. During this secondary calcination, the temperature was raised at a controlled rate of 5 °C/min until it reached 520 °C, where it was maintained for a stable 4 h period.
4.3. Experiment on Photocatalytic Degradation of Tetracycline Wastewater
The catalytic activity of the sample was evaluated by photocatalytic degradation of chloromycetin in tetracycline as a target contaminant. The specific experimental process is as follows: During step one 20 mg/L solution of chlortetracycline hydrochloride solution is poured, then a certain mass of BCN, BTCN, PCN, and PTCN samples is added and a magnetic stirrer is used to stir the reaction solution continuously in the dark for 30 min to achieve adsorption equilibrium. In the second step, the solution is poured into the reactor (double-jacketed glass beaker) and the reaction liquid is exposed to the xenon lamp with a specified wavelength for the reaction. The reaction is kept at a constant temperature of 25 °C by ensuring a constant temperature in the water bath during the entire reaction process, and the solution is kept relatively uniform by magnetic stirring. The third step is to remove 3 mL of the solution from the reactor every 10 min, remove the solid catalyst by centrifugation, take the supernatant, and test the concentration of tetracycline in the supernatant with a UV-visible spectrophotometer. The absorption peak intensity at 366 nm was measured by a UV-Vis spectrophotometer to evaluate the photocatalytic degradation effect of each sample. The calculation formula of degradation rate T of chloramphenicol hydrochloride solution under different reaction times is as follows:
T = (A0 − At)/A0 × 100%
A0 represents the initial absorbance of chlortetracycline hydrochloride solution at 366 nm, and At represents the absorbance of chlortetracycline hydrochloride solution at the moment of the photocatalytic reaction. At the same time, to study the reaction kinetics of chloromycetin catalytic degradation, the experimental data were analyzed, and the following pseudo-first-order equation fitted the experimental data:
where A0 is the initial absorbance of the aureomycin solution, C is the actual absorbance of the aureomycin at the shown reaction time, k is the degradation rate constant, and t is the reaction time.
ln(A0/A) = kt
The selection of the pseudo-first-order equation ln(A0/A) = kt as the model to describe the kinetics of catalytic degradation of chlortetracycline is primarily based on its advantages of high goodness-of-fit, strong practicality, straightforward parameter interpretation, and adaptability to specific experimental conditions. This model fits the experimental data well, allowing for the direct calculation of degradation efficiency and rate constants through absorbance measurements. Furthermore, compared to other kinetic models, it performs better under specific experimental conditions, facilitating rapid evaluation and optimization of the photocatalytic degradation process.
5. Conclusions
This paper prepared BCN, PCN, BTCN, and PTCN samples with different morphologic morphology by adding graphitic carbon nitride (g-C3N4) to TCNE copolymerization. The influence of the copolymerization before and after the calcination method on the photocatalytic degradation of aureomycin hydrochloride was investigated. In this study, a porous g-C3N4 photocatalyst, PTCN, with nitrogen defects was successfully prepared using a TCNE copolymerization strategy. Characterization results obtained by SEM, TEM, BET, XPS, XRD, and FTIR revealed that the introduction of TCNE imparted a porous structure to PTCN, resulting in an approximately 2.3-fold increase in specific surface area compared to pristine g-C3N4 (BCN). Although the surface morphology was altered, the graphene-like framework and in-plane triazine ring structure of g-C3N4 were preserved. Under visible light illumination, PTCN exhibited significantly superior degradation efficiency towards chlortetracycline hydrochloride compared to other samples, with a first-order reaction rate constant 1.65 times that of pure g-C3N4. This enhancement is attributed to the synergistic effects of increased specific surface area due to the porous structure, improved separation efficiency of photogenerated carriers, and enhanced radical generation capacity. In terms of optimizing reaction conditions, the positively charged surface of PTCN under acidic conditions enhanced the electrostatic adsorption of chlortetracycline, while alkaline conditions facilitated the generation of ·OH, ensuring efficient degradation over a broad pH range (3–9). The optimal photocatalytic efficiency was achieved with a PTCN dosage of 0.75 g/L; excessive amounts reduced light energy utilization due to increased turbidity. An increase in temperature led to a decrease in degradation efficiency. Cyclic experiments demonstrated that PTCN maintained 82.59% degradation efficiency after five reuse cycles, with mild photocorrosion observed but no loss of structure or functional groups. In summary, the synergistic optimization of material structure and reaction conditions enhanced the degradation efficiency of chlortetracycline. The mechanism of performance improvement, with •O2− as the dominant reactive species, was clarified. The stability and broad pH adaptability of PTCN provide new insights into material design for antibiotic wastewater treatment, advancing the application of defect engineering in the field of photocatalysis.
Author Contributions
J.L.: Writing—original draft, Methodology, Data curation. Q.S.: Writing—review and editing, Data curation. C.S. (Chaoyu Song): Writing—review and editing, Data curation. C.S. (Chenxi Shi): Writing—review and editing. Y.L.: Writing—review and editing, Formal analysis. All authors have read and agreed to the published version of the manuscript.
Funding
This work has been supported by the Department of Scientific Research in the Basic Scientific Research Funds of Heilongjiang Provincial Colleges and Universities (No. 2023-KYYWF-0594).
Data Availability Statement
The original contributions presented in this study are included in the article. Further inquiries can be directed to the corresponding author.
Acknowledgments
This work was financially supported by the Department of Scientific Research in Heilongjiang province (No. LH2022B022), the 2023 Jiamusi University National Foundation Incubation Program (JMSUGPZR2023–006), and the “Research and Development Team of Northern Unique Medicinal Resources”, Jiamusi University “East Pole” academic team (team no. DJXSTD202403).
Conflicts of Interest
The authors state no conflicts of interest.
References
- Wang, Z.; Huo, Y.; Fan, Y.; Wu, R.; Wu, H.; Wang, F.; Xu, X. Facile synthesis of carbon-rich g-C3N4 by copolymerization of urea and tetracyanoethylene for photocatalytic degradation of Orange II. J. Photochem. Photobiol. A Chem. 2018, 358, 61–69. [Google Scholar] [CrossRef]
- Liu, H.Y.; Niu, C.G.; Huang, D.W.; Liang, C.; Guo, H.; Yang, Y.Y.; Li, L. Unravelling the role of reactive oxygen species in ultrathin Z-scheme heterojunction with surface zinc vacancies for photocatalytic H2O2 generation and CTC degradation. Chem. Eng. J. 2023, 465, 143007. [Google Scholar] [CrossRef]
- Xia, Y.; Yang, H.; Ho, W.; Zhu, B.; Yu, J. Promoting the photocatalytic NO oxidation activity of hierarchical porous g-C3N4 by introduction of nitrogen vacancies and charge channels. Appl. Catal. B Environ. Energy 2024, 344, 123604. [Google Scholar] [CrossRef]
- Zhu, Y.; Wang, L.; Xu, W.; Xu, Z.; Yuan, J.; Zhang, G. ZnO/Cu2O/g-C3N4 heterojunctions with enhanced photocatalytic activity for removal of hazardous antibiotics. Heliyon 2022, 8, e12644. [Google Scholar] [CrossRef]
- Zhang, R.; Cai, L.; Zhao, C.; Yu, J.; Yang, Z.; Chen, Z.; Jiang, J.; Hu, Z. Photocatalytic degradation of organic pollutants by 3D flower-like g-C3N4/Ag3PO4/Bi2O2CO3 and its effect on the growth of lettuce seedlings. Diam. Relat. Mater. 2022, 129, 109362. [Google Scholar] [CrossRef]
- Zhang, R.; Jiang, J.; Zeng, K. Synthesis of Bi2WO6/g-C3N4 heterojunction on activated carbon fiber membrane as a thin-film photocatalyst for treating antibiotic wastewater. Inorg. Chem. Commun. 2022, 140, 109418. [Google Scholar] [CrossRef]
- Liu, Y.; Wang, X.; Sun, Q.; Yuan, M.; Sun, Z.; Xia, S.; Zhao, J. Enhanced visible light photo-Fenton-like degrad-ation of tetracyclines by expanded perlite supported FeMo3Ox/g-C3N4 floating Z-scheme catalyst. J. Hazard. Mater. 2022, 424, 127387. [Google Scholar] [CrossRef] [PubMed]
- Yu, Y.; Chen, D.; Xu, W.; Fang, J.; Sun, J.; Liu, Z.; Chen, Y.; Liang, Y.; Fang, Z. Synergistic adsorption-photocatalytic degrad-ation of different antibiotics in seawater by a porous g-C3N4/calcined-LDH and its application in synthetic mariculture wastewater. J. Hazard. Mater. 2021, 416, 126183. [Google Scholar] [CrossRef]
- Zhang, R.; Zeng, K. A novel flower-like dual Z-scheme BiSI/Bi2WO6/g-C3N4 photocatalyst has excellent photocatalytic activity for the degradation of organic pollutants under visible light. Diam. Relat. Mater. 2021, 115, 108343. [Google Scholar] [CrossRef]
- Ren, Z.; Chen, F.; Wen, K.; Lu, J. Enhanced photocatalytic activity for tetracyclines degradation with Ag modified g-C3N4 composite under visible light. J. Photochem. Photobiol. A Chem. 2020, 389, 112217. [Google Scholar] [CrossRef]
- Zhu, C.; Wang, Y.; Jiang, Z.; Xu, F.; Xian, Q.; Sun, C.; Tong, Q.; Zou, W.; Duan, X.; Wang, S. CeO2 nanocrystal-modified layered MoS2/g-C3N4 as 0D/2D ternary composite for visible-light hydrogen evolution: Interfacial consecutive multi-step electron transfer and enhanced H2O reactant adsorption. In Proceedings of the 10th International (China) Functional Materials and Their Applications Academic Conference, the 6th International Multifunctional Materials and Structures Academic Conference, the 1st International New Materials Frontier Development Conference, Chongqing, China, 23 November 2019; Volume 2. [Google Scholar] [CrossRef]
- Xu, S.; Ding, J.; Chen, L. A fluorescent material for the detection of chlortetracycline based on molecularly imprinted silica-graphitic carbon nitride composite. Anal. Bioanal. Chem. 2018, 410, 7103–7112. [Google Scholar] [CrossRef] [PubMed]
- Wu, Q.; Siddique, M.S.; Wang, H.; Cui, L.; Wang, H.; Pan, M.; Yan, J. Visible-light-driven iron-based hetero-geneous photo-Fenton catalysts for wastewater decontamination: A review of recent advances. Chemosphere 2023, 313, 137509. [Google Scholar] [CrossRef] [PubMed]
- Zhao, Y.; Cao, Z.; Li, J.; Bai, B.; Jia, Y.; Wang, Q.; Cheng, H. Selective adsorption and photocatalytic degradation of chlortetracycline hydrochloride using a La2Ti2O7/acid-modified coal-bearing strata kaolinite composite. Appl. Surf. Sci. 2023, 609, 155489. [Google Scholar] [CrossRef]
- Zhao, Y.; Cao, Z.; Chen, Y.; Jia, Y.; Wang, Q.; Cheng, H. Heterostructure coal-bearing strata kaolinite/MnFe2O4 composite for activation of peroxydisulfate to efficiently degrade chlortetracycline hydro-chloride. Colloids Surf. A Physicochem. Eng. Asp. 2022, 643, 128789. [Google Scholar] [CrossRef]
- Almeida, L.A.; Dosen, A.; Viol, J.; Marinkovic, B.A. TiO2-Acetylacetone as an Efficient Source of Superoxide Radicals under Reduced Power Visible Light: Photocatalytic Degradation of Chlorophenol and Tetracycline. Catalysts 2022, 12, 116. [Google Scholar] [CrossRef]
- Fekr, S.S.; Fazaeli, R.; Ardjmand, M.; Rafizadeh, M. Degradation of Antibiotic Chlortetracycline in Aqueous Solution by Ce/Bi2WO6 Photocatalysis under Solar Light. Russ. J. Phys. Chem. A 2021, 95, 1238–1246. [Google Scholar] [CrossRef]
- Aoudjit, L.; Zioui, D.; Touahra, F.; Mahidine, S.; Bachari, K. Photocatalytic Degradation of Tartrazine Dyes Using TiO2–Chitosan Beads under Sun Light Irradiation. Russ. J. Phys. Chem. A 2021, 95, 1069–1076. [Google Scholar] [CrossRef]
- Wang, P.; Yuan, Q. Photocatalytic degradation of tetracyclines in liquid digestate: Optimization, kinetics and correlation studies. Chem. Eng. J. 2021, 410, 128327. [Google Scholar] [CrossRef]
- Fang, H.X.; Guo, H.; Niu, C.G.; Liang, C.; Huang, D.W.; Tang, N.; Liu, H.Y.; Yang, Y.Y.; Li, L. Hollow tubular graphitic carbon nitride catalyst with adjustable nitrogen vacancy: Enhanced optical absorption and carrier separation for improving photocatalytic activity. Chem. Eng. J. 2020, 402, 126185. [Google Scholar] [CrossRef]
- Zheng, J.; Liu, X.; Zhang, L. Design of porous double-shell Cu2O@CuCo2O4 Z-Scheme hollow microspheres with superior redox property for synergistic photocatalytic degradation of multi-pollutants. Chem. Eng. J. 2020, 389, 124339. [Google Scholar] [CrossRef]
- Wang, W.; Han, Q.; Zhu, Z.; Zhang, L.; Zhong, S.; Liu, B. Enhanced photocatalytic degradation performance of organic contaminants by heterojunction photocatalyst BiVO4/TiO2/RGO and its compatibility on four different tetracycline antibiotics. Adv. Powder Technol. 2019, 30, 1882–1896. [Google Scholar] [CrossRef]
- Farzana, M.H.; Meenakshi, S. Enhanced Photocatalytic Degradation of Chromium(VI) Under UV Light on Chitosan/TiO2 Composite. J. Chitin Chitosan Sci. 2013, 1, 42–49. [Google Scholar] [CrossRef]
- Wang, S.; Yang, J.; Cong, H.; Li, X.; Wang, R.; Yang, M.; Qin, M.; Jin, K.; Zhao, Y.; Wang, H. C-Doped g-C3N4 for Enhanced Photocatalytic Degradation of Azo Dyes under Visible Light. ChemistrySelect 2023, 8, e202303063. [Google Scholar] [CrossRef]
- Sidorowicz, A.; Fais, G.; Desogus, F.; Loy, F.; Licheri, R.; Lai, N.; Locci, A.M.; Cincotti, A.; Orrù, R.; Cao, G.; et al. Optimization of Brilliant Blue R photocatalytic degradation by silver nanoparticles synthesized using Chlorella vulgaris. Environ. Sci. Pollut. Res. 2024, 31, 57765–57777. [Google Scholar] [CrossRef] [PubMed]
- Sidorowicz, A.; Fais, G.; Desogus, F.; Loy, F.; Licheri, R.; Lai, N.; Cao, G.; Concas, A. Eco-friendly photocatalytic treatment of dyes with Ag nanoparticles obtained through sustainable process involving Spirulina platensis. Sustainability 2024, 16, 8758. [Google Scholar] [CrossRef]
- Sidorowicz, A.; Atzori, F.; Zedda, F.; Fais, G.; Loy, F.; Licheri, R.; Lai, N.; Desogus, F.; Cao, G.; Concas, A. Novel experimental and theoretical study on the synthesis and use of microalgae-derived silver nanomaterials for water purification. J. Water Process Eng. 2025, 69, 106831. [Google Scholar] [CrossRef]
- Fernandes, S.M.; Barrocas, B.T.; Vale, M.; Oliveira, M.C.; Al Mohtar, A.; Marques, A.C. MICROSCAFS® for minocycline elimination from water and real wastewater: Porosity and TiO2 nanoparticles effect. Chem. Eng. J. 2025, 504, 158771. [Google Scholar] [CrossRef]
- Jiang, H.; Wang, Q.; Chen, P.; Zheng, H.; Shi, J.; Shu, H.; Liu, Y. Photocatalytic degradation of tetracycline by using a regenerable (Bi) BiOBr/rGO composite. J. Clean. Prod. 2022, 339, 130771. [Google Scholar] [CrossRef]
- Li, S.; Hu, J. Photolytic and photocatalytic degradation of tetracycline: Effect of humic acid on degradation kinetics and mechanisms. J. Hazard. Mater. 2016, 318, 134–144. [Google Scholar] [CrossRef]
- Sun, H.; Xie, Z.; Yang, J.; Xie, T.; Zhang, Z.; Cui, B.; Zhao, Y.; Huang, M. Preparation of NiO/BiOCl composite by impregnation for photocatalytic degradation of tetracycline. Inorg. Chem. Commun. 2024, 164, 112431. [Google Scholar] [CrossRef]


Disclaimer/Publisher’s Note: The statements, opinions and data contained in all publications are solely those of the individual author(s) and contributor(s) and not of MDPI and/or the editor(s). MDPI and/or the editor(s) disclaim responsibility for any injury to people or property resulting from any ideas, methods, instructions or products referred to in the content. |
© 2025 by the authors. Licensee MDPI, Basel, Switzerland. This article is an open access article distributed under the terms and conditions of the Creative Commons Attribution (CC BY) license (https://creativecommons.org/licenses/by/4.0/).