Article

Straightforward Synthesis and Characterization of Analcime@Nickel Orthosilicate Novel Nanocomposite for Efficient Removal of Rhodamine B Dye from Aqueous Media

by
Ehab A. Abdelrahman
1,*,
Fawaz A. Saad
2,
Mortaga M. Abou-Krisha
1,
Abdalla M. Khedr
3 and
Zahrah Alqahtani
4
1
Department of Chemistry, College of Science, Imam Mohammad Ibn Saud Islamic University (IMSIU), Riyadh 11623, Saudi Arabia
2
Department of Chemistry, Faculty of Science, Umm Al-Qura University, Makkah 21955, Saudi Arabia
3
Chemistry Department, Faculty of Science, Tanta University, Tanta 31111, Egypt
4
Department of Physics, Faculty of Science, Taif University, P.O. Box 11099, Taif 21944, Saudi Arabia
*
Author to whom correspondence should be addressed.
Inorganics 2025, 13(4), 120; https://doi.org/10.3390/inorganics13040120
Submission received: 12 March 2025 / Revised: 8 April 2025 / Accepted: 8 April 2025 / Published: 10 April 2025

Abstract

:
Rhodamine B dye is a hazardous pollutant that poses significant risks to human health and aquatic ecosystems due to its toxic, carcinogenic nature and high chemical stability. To address this issue, analcime@nickel orthosilicate nanocomposites were synthesized via the hydrothermal method for efficient rhodamine B dye removal. Two nanocomposites were synthesized: EW (without a template) and ET (with polyethylene glycol 400 as a template, followed by calcination at 600 °C for 5 h). X-ray diffraction (XRD) confirmed the formation of analcime (NaAlSi2O6) and nickel orthosilicate (Ni2SiO4), with crystallite sizes of 72.93 nm (EW) and 63.60 nm (ET). Energy-dispersive X-ray spectroscopy (EDX) showed distinct distributions of oxygen, sodium, aluminum, silicon, and nickel. Field-emission scanning electron microscopy (FE-SEM) revealed irregular morphology for EW and uniform spherical nanoparticles for ET. The maximum adsorption capacities (Qmax) were 174.83 mg/g for EW and 210.53 mg/g for ET. Adsorption followed the pseudo-second-order kinetic model and was best described by the Langmuir isotherm, indicating monolayer chemisorption. Thermodynamic studies showed that adsorption was exothermic (ΔH = −45.62 to −50.92 kJ/mol) and spontaneous (ΔG < 0) and involved an entropy increase (ΔS = +0.1441 to +0.1569 kJ/mol·K). These findings demonstrate the superior adsorption efficiency of the ET composite and its potential application in dye-contaminated wastewater treatment.

1. Introduction

Water contamination by organic dyes has become a critical environmental issue due to the rapid expansion of industries such as textiles, paper, leather, and cosmetics. These industries discharge large quantities of synthetic dyes into water bodies, leading to severe pollution [1,2,3]. Organic dyes are extensively used for their chemical stability and resistance to degradation, making their removal from wastewater challenging. The presence of dyes in water sources is primarily attributed to inadequate wastewater treatment processes, accidental spills, and inefficient dye fixation during industrial applications. Given their high solubility, even small concentrations of dyes can cause significant contamination, altering water quality and posing risks to aquatic ecosystems [4,5]. The environmental and human health hazards associated with organic dyes are of significant concern. Many dyes are toxic, mutagenic, and carcinogenic, affecting both terrestrial and aquatic life [6,7]. When released into natural water bodies, dyes can reduce light penetration, disrupting photosynthesis in aquatic plants and disturbing the ecological balance. Additionally, several dyes degrade into harmful by-products that persist in the environment for extended periods. Exposure to organic dyes has been linked to skin irritation, respiratory diseases, and in some cases, organ damage in humans [8]. The continuous discharge of these contaminants necessitates the development of efficient removal strategies. Rhodamine B dye is a widely used xanthene dye that poses severe threats to human health and the environment. It is classified as a potential carcinogen and has been associated with cytotoxic effects upon prolonged exposure [9]. In aquatic environments, rhodamine b dye is highly stable and resistant to biodegradation, allowing it to persist and accumulate. Its presence in water bodies results in bioaccumulation in aquatic organisms, leading to harmful effects across the food chain. The rhodamine B dye can also disrupt endocrine functions in humans and animals, making its removal from wastewater a priority in environmental management. Various techniques have been explored for the removal of organic dyes from wastewater, including adsorption, chemical precipitation, membrane filtration, electrochemical methods, and bioremediation. Chemical precipitation involves the addition of coagulants to form insoluble precipitates, but it generates sludge that requires further disposal [10]. Membrane filtration is highly effective in removing dyes but suffers from high operational costs and membrane fouling [11,12,13]. Electrochemical methods, such as electrocoagulation and advanced oxidation processes, are energy-intensive and require sophisticated equipment [14,15]. Bioremediation, which employs microorganisms to degrade dyes, is often slow and limited by specific environmental conditions [16,17]. Among these techniques, adsorption is considered one of the most promising due to its simplicity, cost-effectiveness, and high efficiency in removing dyes from aqueous solutions [18].
Metal oxide nanoparticles, particularly silicon-based oxides and their composites, have gained significant attention as potential adsorbents for organic dye removal. These materials exhibit high surface area, excellent thermal stability, and tunable surface properties, which enhance their adsorption capacity [19,20,21,22,23]. For instance, mesoporous ZnO nanoparticles derived from metal–organic frameworks have demonstrated excellent adsorption capacities (up to 975 mg/g for Congo red) and follow Langmuir and pseudo-second-order models, confirming their chemisorptive nature and high performance in aqueous dye systems [19]. Moreover, metal silicate materials, such as nickel silicates, have emerged as promising candidates owing to their rich surface hydroxyl groups and structural stability. Hollow nickel silicate fibers synthesized by using cotton fibers as biotemplates have shown high adsorption capacities for both cationic and anionic dyes, driven by electrostatic interactions and hydrogen bonding, with capacities reaching 414.9 mg/g for Congo red and 195.7 mg/g for methylene blue [23]. Surfactant-modified nanostructures have also proven effective in enhancing adsorption capacity. For instance, Bi2O2CO3 nanostructures synthesized with CTAB exhibited significantly higher adsorption performance and excellent reusability for removing organic pollutants such as methyl orange [24].
Zeolites are crystalline aluminosilicates with high affinity for cationic dyes, allowing them to remove pollutants efficiently through ion exchange. The presence of exchangeable cations in the zeolite framework facilitates the substitution of dye molecules, leading to their immobilization [25,26]. Zeolites and their composites are also highly effective adsorbents for organic dyes due to their ion-exchange capabilities and well-defined porous structures. For instance, natural clinoptilolite-rich zeolite was successfully fabricated into 3D-printed monoliths by using additive manufacturing techniques, demonstrating methylene blue adsorption efficiency as high as 82.5% at moderate sintering temperatures [27]. Furthermore, composite materials incorporating zeolite P, activated carbon, and bentonite have shown outstanding adsorption performance with cationic dyes such as Basic Blue 41, achieving a monolayer adsorption capacity of 232.6 mg/g and fitting well to the Langmuir isotherm and pseudo-first-order kinetics [28].
Among zeolites, analcime has attracted significant interest as an efficient adsorbent due to its unique structural properties, high ion-exchange capacity, and thermal stability. Analcime zeolite possesses a three-dimensional porous network with tunable cationic sites, making it highly effective in the removal of organic dyes. Its ion-exchange ability enables the substitution of dye cations with sodium ions, leading to enhanced adsorption efficiency [29]. For instance, Zhao et al. synthesized a porous analcime composite from semi-coke waste and reported exceptional adsorption capacities of 243.84 mg/g for methylene blue and 71.74 mg/g for Cu(II), with over 99% removal efficiency for both pollutants [29].
Despite numerous reports on individual adsorbents such as zeolites and nickel-based silicates, the combination of analcime with nickel orthosilicate in a hybrid nanocomposite structure has not been extensively investigated for cationic dye removal. This study aims to address this gap by synthesizing and evaluating a dual-function nanocomposite with enhanced ion-exchange and electrostatic adsorption capabilities. In this paper, the work presents an innovative approach to rhodamine B dye removal by synthesizing a novel analcime@nickel orthosilicate nanocomposite. Analcime, a zeolitic aluminosilicate, provides efficient ion-exchange capabilities, while nickel orthosilicate enhances adsorption through electrostatic attraction. The combination of these materials results in a high-performance nanocomposite with improved adsorption properties. Two variants of the nanocomposite were synthesized: EW, synthesized without a template, and ET, synthesized by using polyethylene glycol 400 as a template followed by calcination at 600 °C for 5 h. The structural and morphological properties of these nanocomposites were analyzed to determine their rhodamine B dye adsorption efficiency. To the best of our knowledge, this is the first study to synthesize and apply an analcime@nickel orthosilicate nanocomposite for the adsorption of rhodamine B dye. The novelty of this work lies in the strategic combination of two distinct functional phases—analcime, known for its ion-exchange properties, and nickel orthosilicate, known for its surface electrostatic interactions—within a single nanostructured composite. Moreover, the use of polyethylene glycol 400 as a soft template to control particle morphology and enhance porosity represents an innovative approach that significantly improves adsorption capacity. This dual-function composite system offers a synergistic mechanism for efficient dye removal, setting it apart from previously reported single-phase or physically mixed adsorbents.

2. Results and Discussion

2.1. Characterization

The XRD patterns of the EW and ET nanocomposites are presented in Figure 1A,B, respectively. The EW sample was synthesized by using the hydrothermal method in the absence of polyethylene glycol 400, while the ET sample was synthesized by using the hydrothermal method in the presence of polyethylene glycol 400 as an organic template, followed by calcination at 600 °C for 5 h. The identified crystalline phases in both samples include analcime (NaAlSi2O6) with a monoclinic crystal system (COD-9015469) and nickel orthosilicate (Ni2SiO4) with an orthorhombic crystal system (COD-9001102). The diffraction peaks corresponding to analcime were observed at 2θ angles of 15.94°, 18.35°, 24.33°, 26.01°, 30.64°, 32.10°, 33.36°, 35.88°, 37.14°, 40.60°, 41.66°, 42.69°, 54.35°, 57.07°, and 64.53°, which are assigned to the (121), (220), (312), (004), (323), (224), (413), (512), (404), (116), (620), (514), (714), (606), and (518) crystallographic planes, respectively. The diffraction peaks of nickel orthosilicate appeared at 2θ angles of 38.30°, 39.23°, 44.91°, 47.84°, 48.90°, 52.57°, 53.52°, 55.30°, 57.91°, 60.76°, 62.02°, 62.85°, 63.69°, 66.21°, 67.58°, 68.42°, 69.26°, 72.30°, 73.87°, 75.33°, 76.80°, and 78.38°, corresponding to the (041), (210), (221), (042), (150), (222), (123), (241), (160), (301), (213), (143), (321), (114), (170), (252), (153), (341), (063), (204), (350), and (342) crystallographic planes, respectively. The average crystallite sizes of the EW and ET samples are 72.93 nm and 63.60 nm, respectively, indicating that the presence of polyethylene glycol 400 and its subsequent calcination influenced crystallite growth and morphology. The smaller crystallite size in the ET sample is attributed to the role of polyethylene glycol 400 as a structure-directing agent, which hinders particle agglomeration and promotes the formation of smaller crystallites. Additionally, the calcination step at 600 °C for 5 h further contributes to reducing the crystallite size by removing the organic template and inducing controlled crystallization, preventing excessive grain growth compared with the EW sample, which lacks this templating effect.
The EDX spectra of the EW and ET nanocomposites are presented in Figure 2A,B, respectively. The elemental composition of both samples, as determined by EDS analysis, is summarized in Table 1. The detected elements include oxygen, sodium, aluminum, silicon, and nickel, confirming the successful formation of the desired phases. The EW sample exhibits atomic percentages of 54.1% oxygen, 9.4% sodium, 6.1% aluminum, 22.1% silicon, and 8.3% nickel, whereas the ET sample shows atomic percentages of 56.0% oxygen, 8.2% sodium, 5.5% aluminum, 21.7% silicon, and 8.6% nickel. The differences in elemental composition between the two samples may be attributed to the presence of polyethylene glycol 400, which, although primarily used as a porosity-directing template, can interact with Al3+, Ni2+, and Si4+ ions during synthesis. These interactions may slightly influence the incorporation or distribution of elements during crystallization. Since polyethylene glycol 400 was added during the precursor mixing stage and remained throughout the hydrothermal process, it likely affected the co-crystallization of both the analcime and nickel orthosilicate phases, leading to the improved morphology and surface characteristics observed in the ET sample.
The theoretical Na–Al molar ratio in pure analcime (NaAlSi2O6) is 1:1, but in the EW and ET samples, the Na–Al atomic ratios are approximately 1.54 and 1.49, respectively, indicating sodium excess—possibly due to residual Na+ ions trapped in the analcime pores. When using Al as a marker for analcime and Ni for nickel orthosilicate, the calculated molar ratios of analcime to nickel orthosilicate are approximately 3:2 for EW and 4:3 for ET. These estimated ratios support the results from X-ray diffraction semi-quantitative (XRD-SQ) analysis and are included in Table 1.
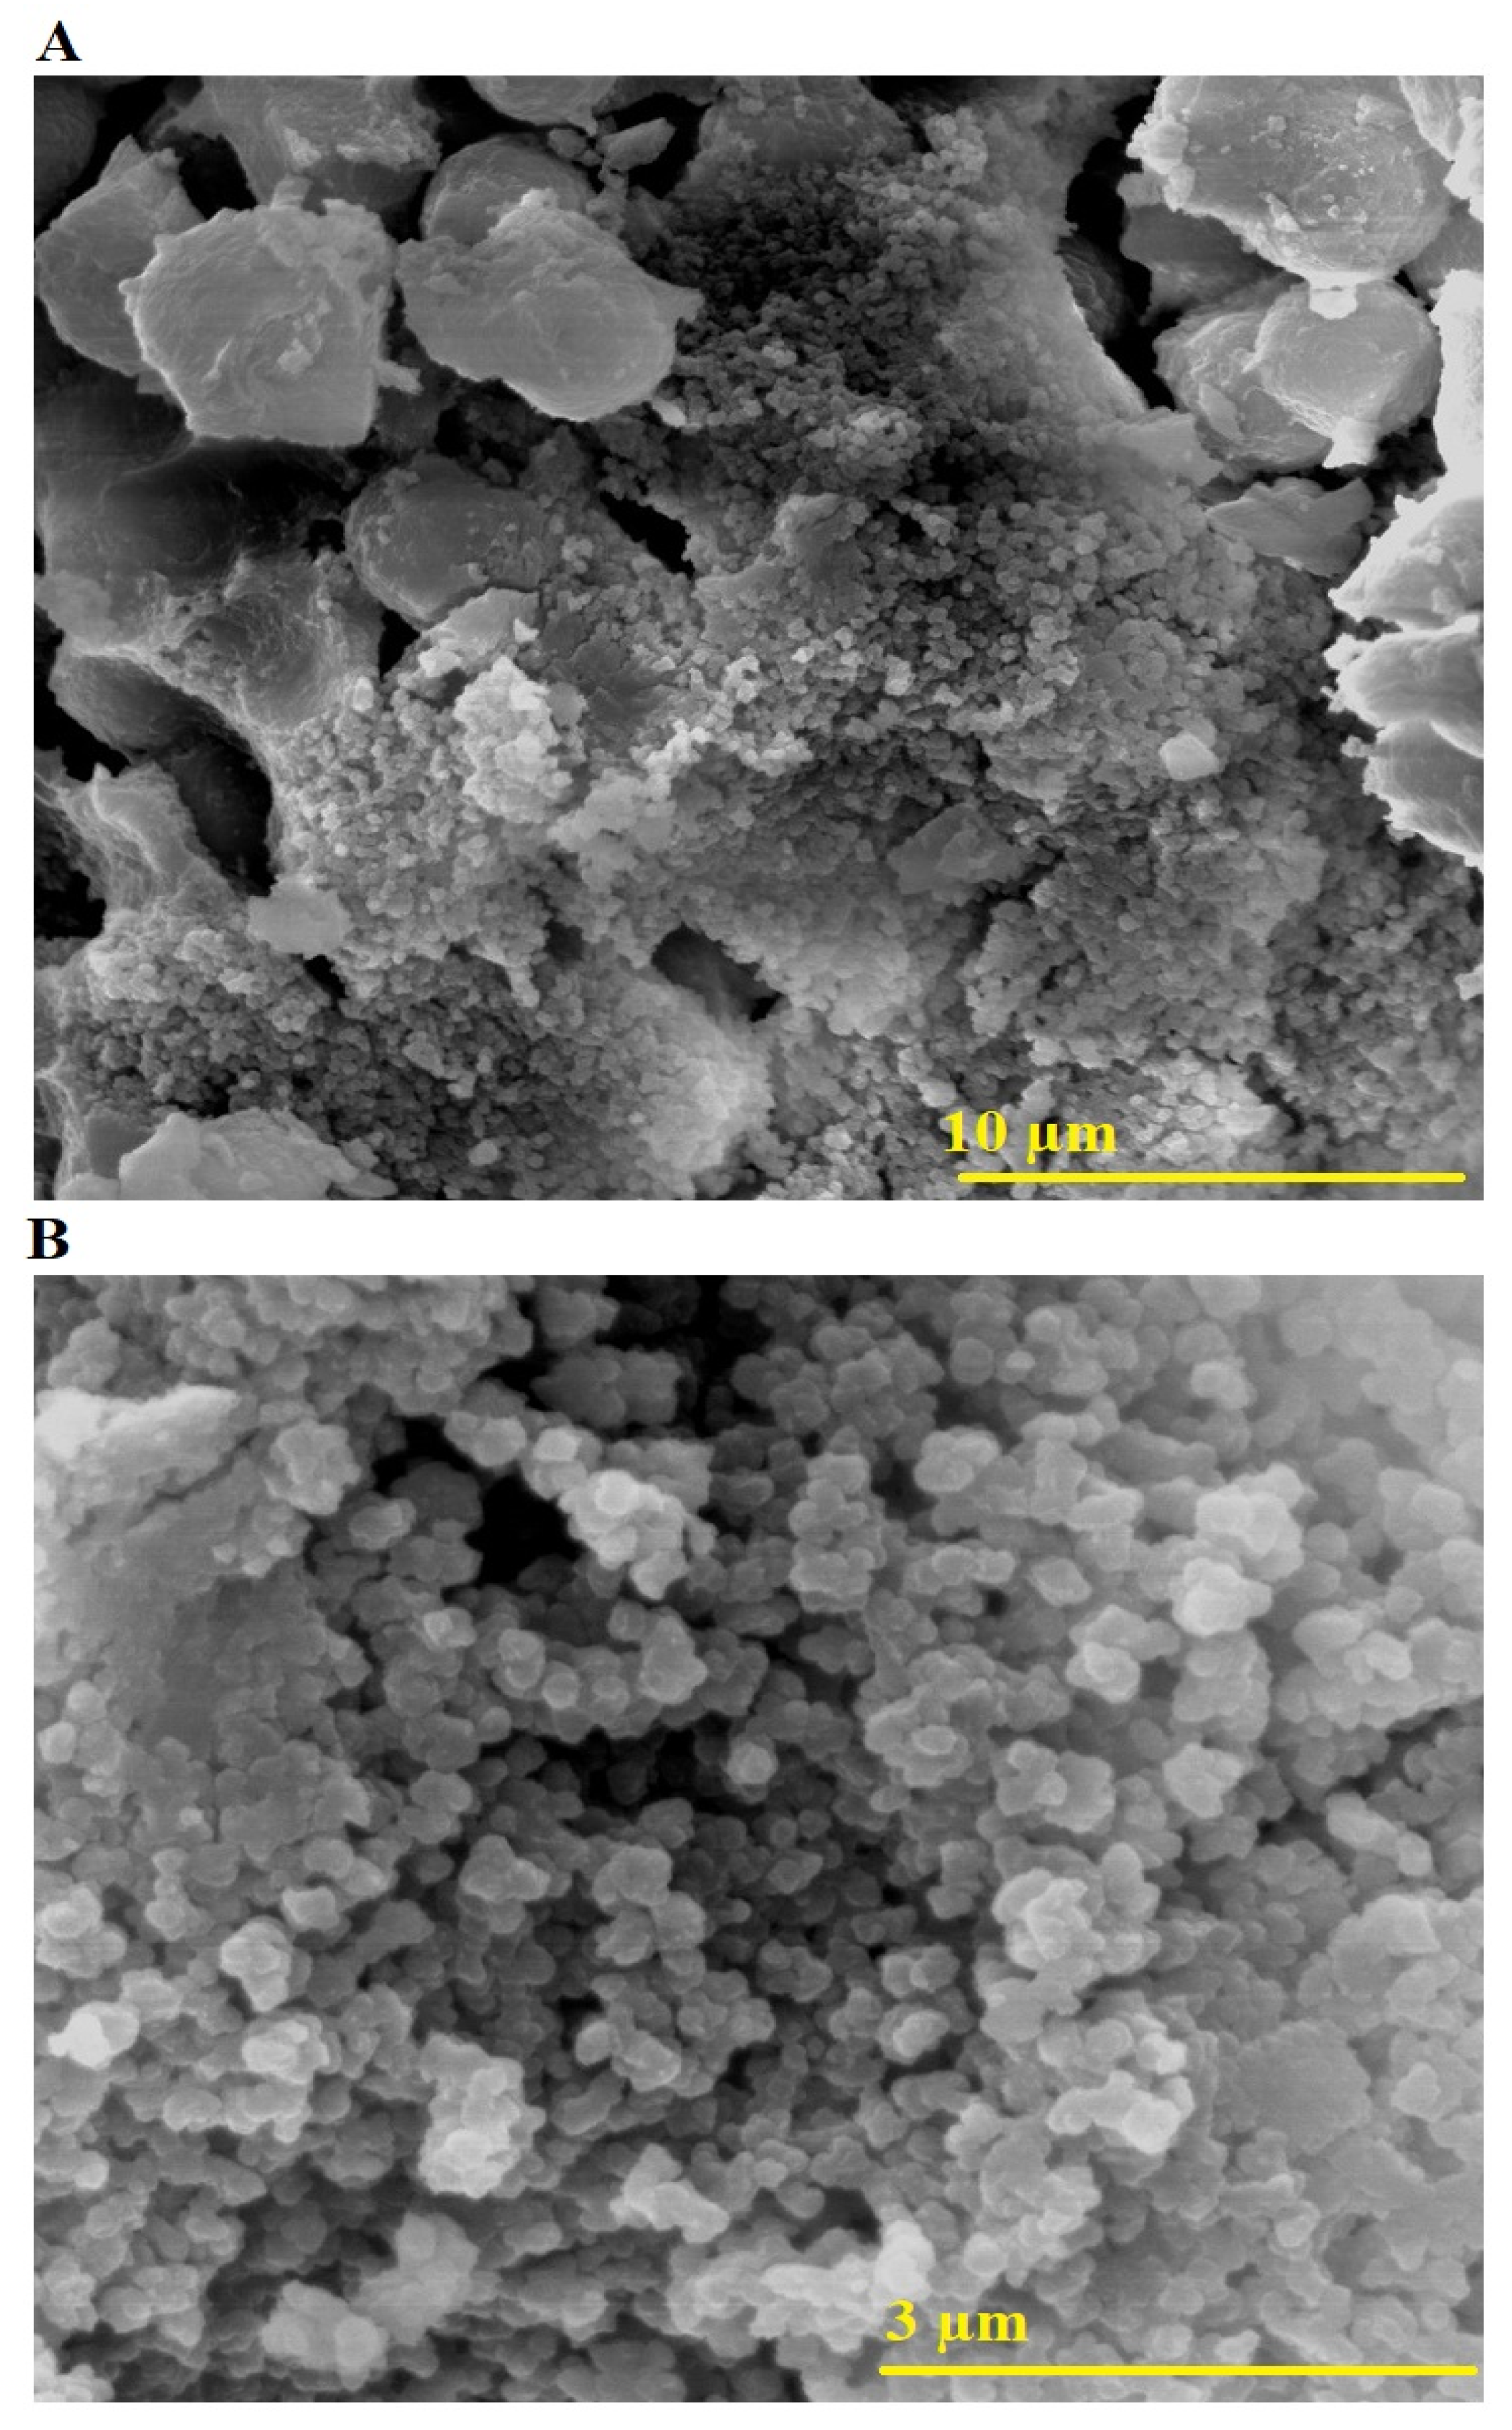
The FE-SEM images of the EW and ET nanocomposites are shown in Figure 3 and Figure 4, respectively, providing insights into their morphological features. Figure 3A illustrates the EW sample at 10,000× magnification, revealing a heterogeneous structure with a combination of large, irregularly shaped agglomerates and smaller dispersed particles. Figure 3B at 40,000× magnification highlights the presence of fine nanoparticles with a rough surface texture, indicating a less uniform growth pattern. Figure 4A presents the ET sample at 10,000× magnification, showing a more uniform morphology with well-distributed spherical nanoparticles, suggesting the role of polyethylene glycol 400 as a template in controlling particle growth. Figure 4B at 40,000× magnification further confirms the formation of spherical nanoparticles with a relatively smooth surface and reduced agglomeration compared with the EW sample. The observed morphological differences between the two samples can be attributed to the presence of polyethylene glycol 400 during synthesis, which facilitated the formation of smaller and more uniform spherical nanoparticles in the ET sample while inhibiting excessive particle aggregation. The calcination step at 600 °C for 5 h further influenced the structural organization by removing the organic template, leading to a well-defined morphology in the ET sample compared with the irregular structures observed in the EW sample.
As shown in Figure 5, the HR-TEM analysis further supports the structural differences between the EW and ET nanocomposites. In the EW sample (Figure 5A), relatively distinct spherical particles are observed, suggesting limited interaction between the analcime and nickel orthosilicate phases. In contrast, the ET sample (Figure 5B) exhibits well-dispersed nanoparticles with more intimate phase integration, likely due to the templating and calcination effects during synthesis. This supports the presence of a synergistic nanocomposite system rather than a simple physical mixture, especially for ET, where enhanced structural homogeneity contributes to improved adsorption performance.

2.2. Adsorption of Rhodamine B Dye from Aqueous Media

The percentage of rhodamine B dye removal (E%) and the adsorption capacity of the adsorbent (Q) were determined by using Equations (1) and (2), respectively [30].
E % = C o C e C o × 100
Q = C o C e × V W
In these equations, Co (mg/L) represents the initial concentration of rhodamine B dye, Ce (mg/L) is the equilibrium concentration of rhodamine B dye in solution, V (L) is the volume of the rhodamine B dye solution, and W (mg) is the mass of the adsorbent used.

2.2.1. Effect of pH

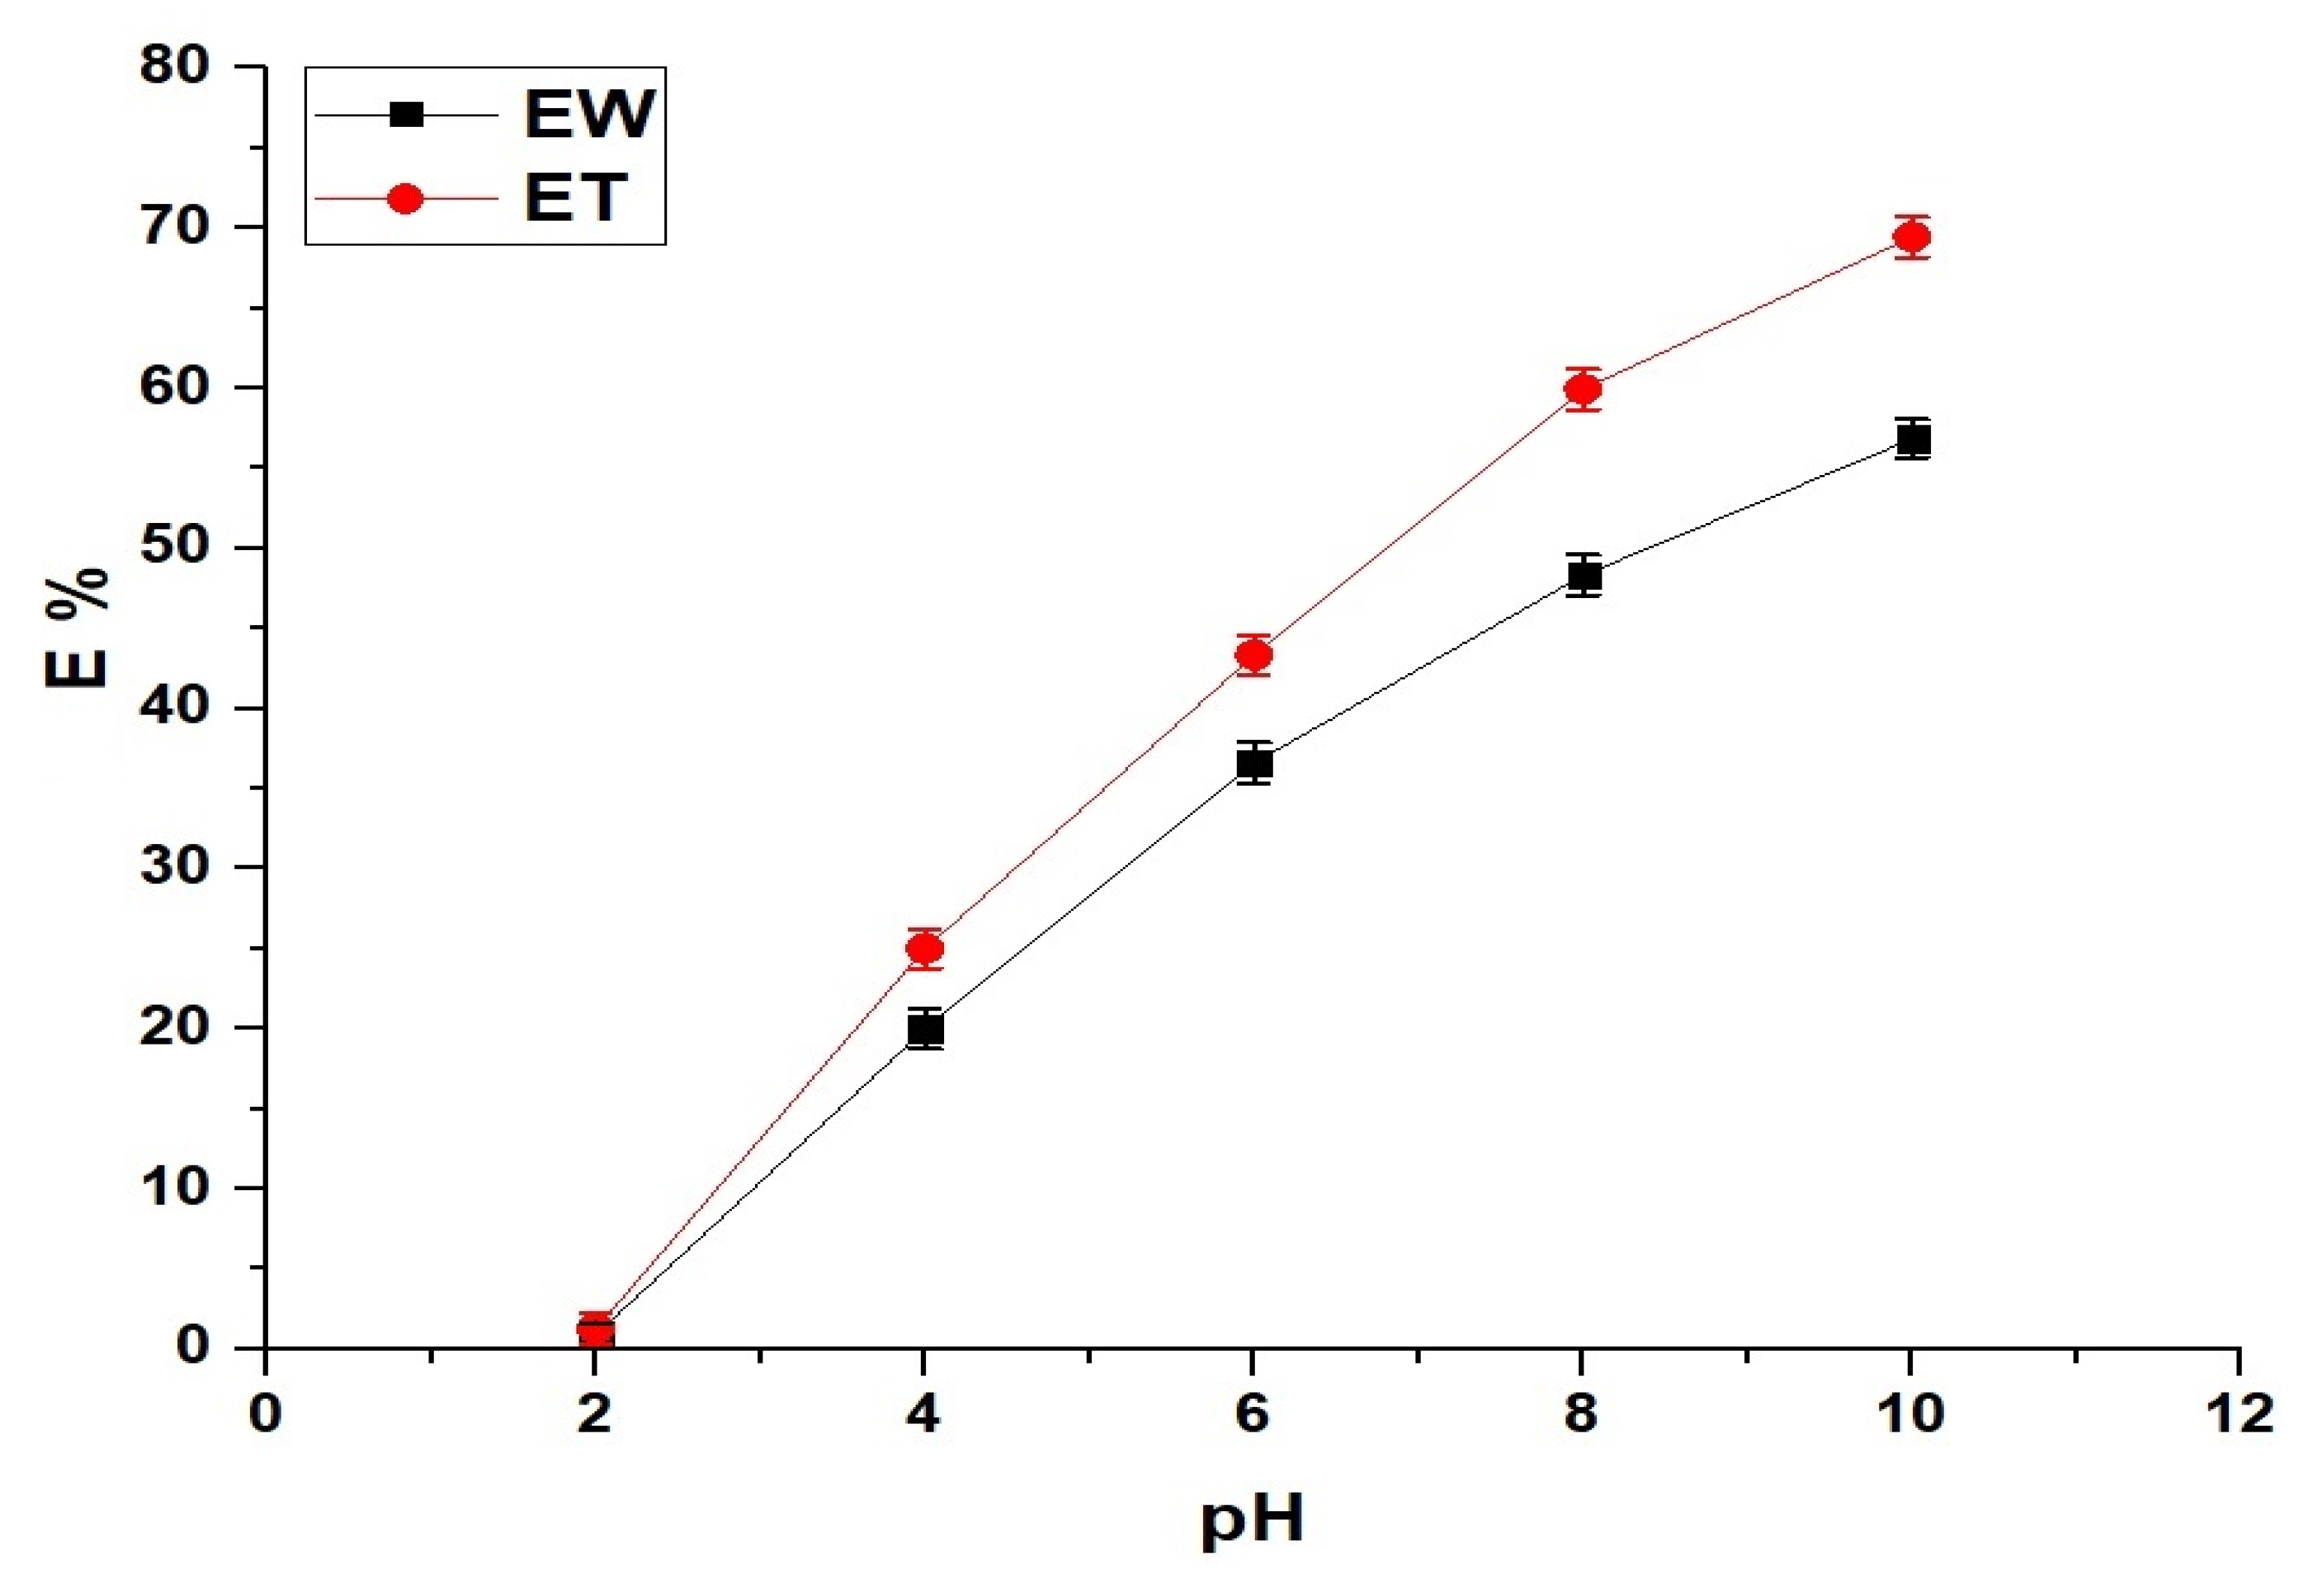
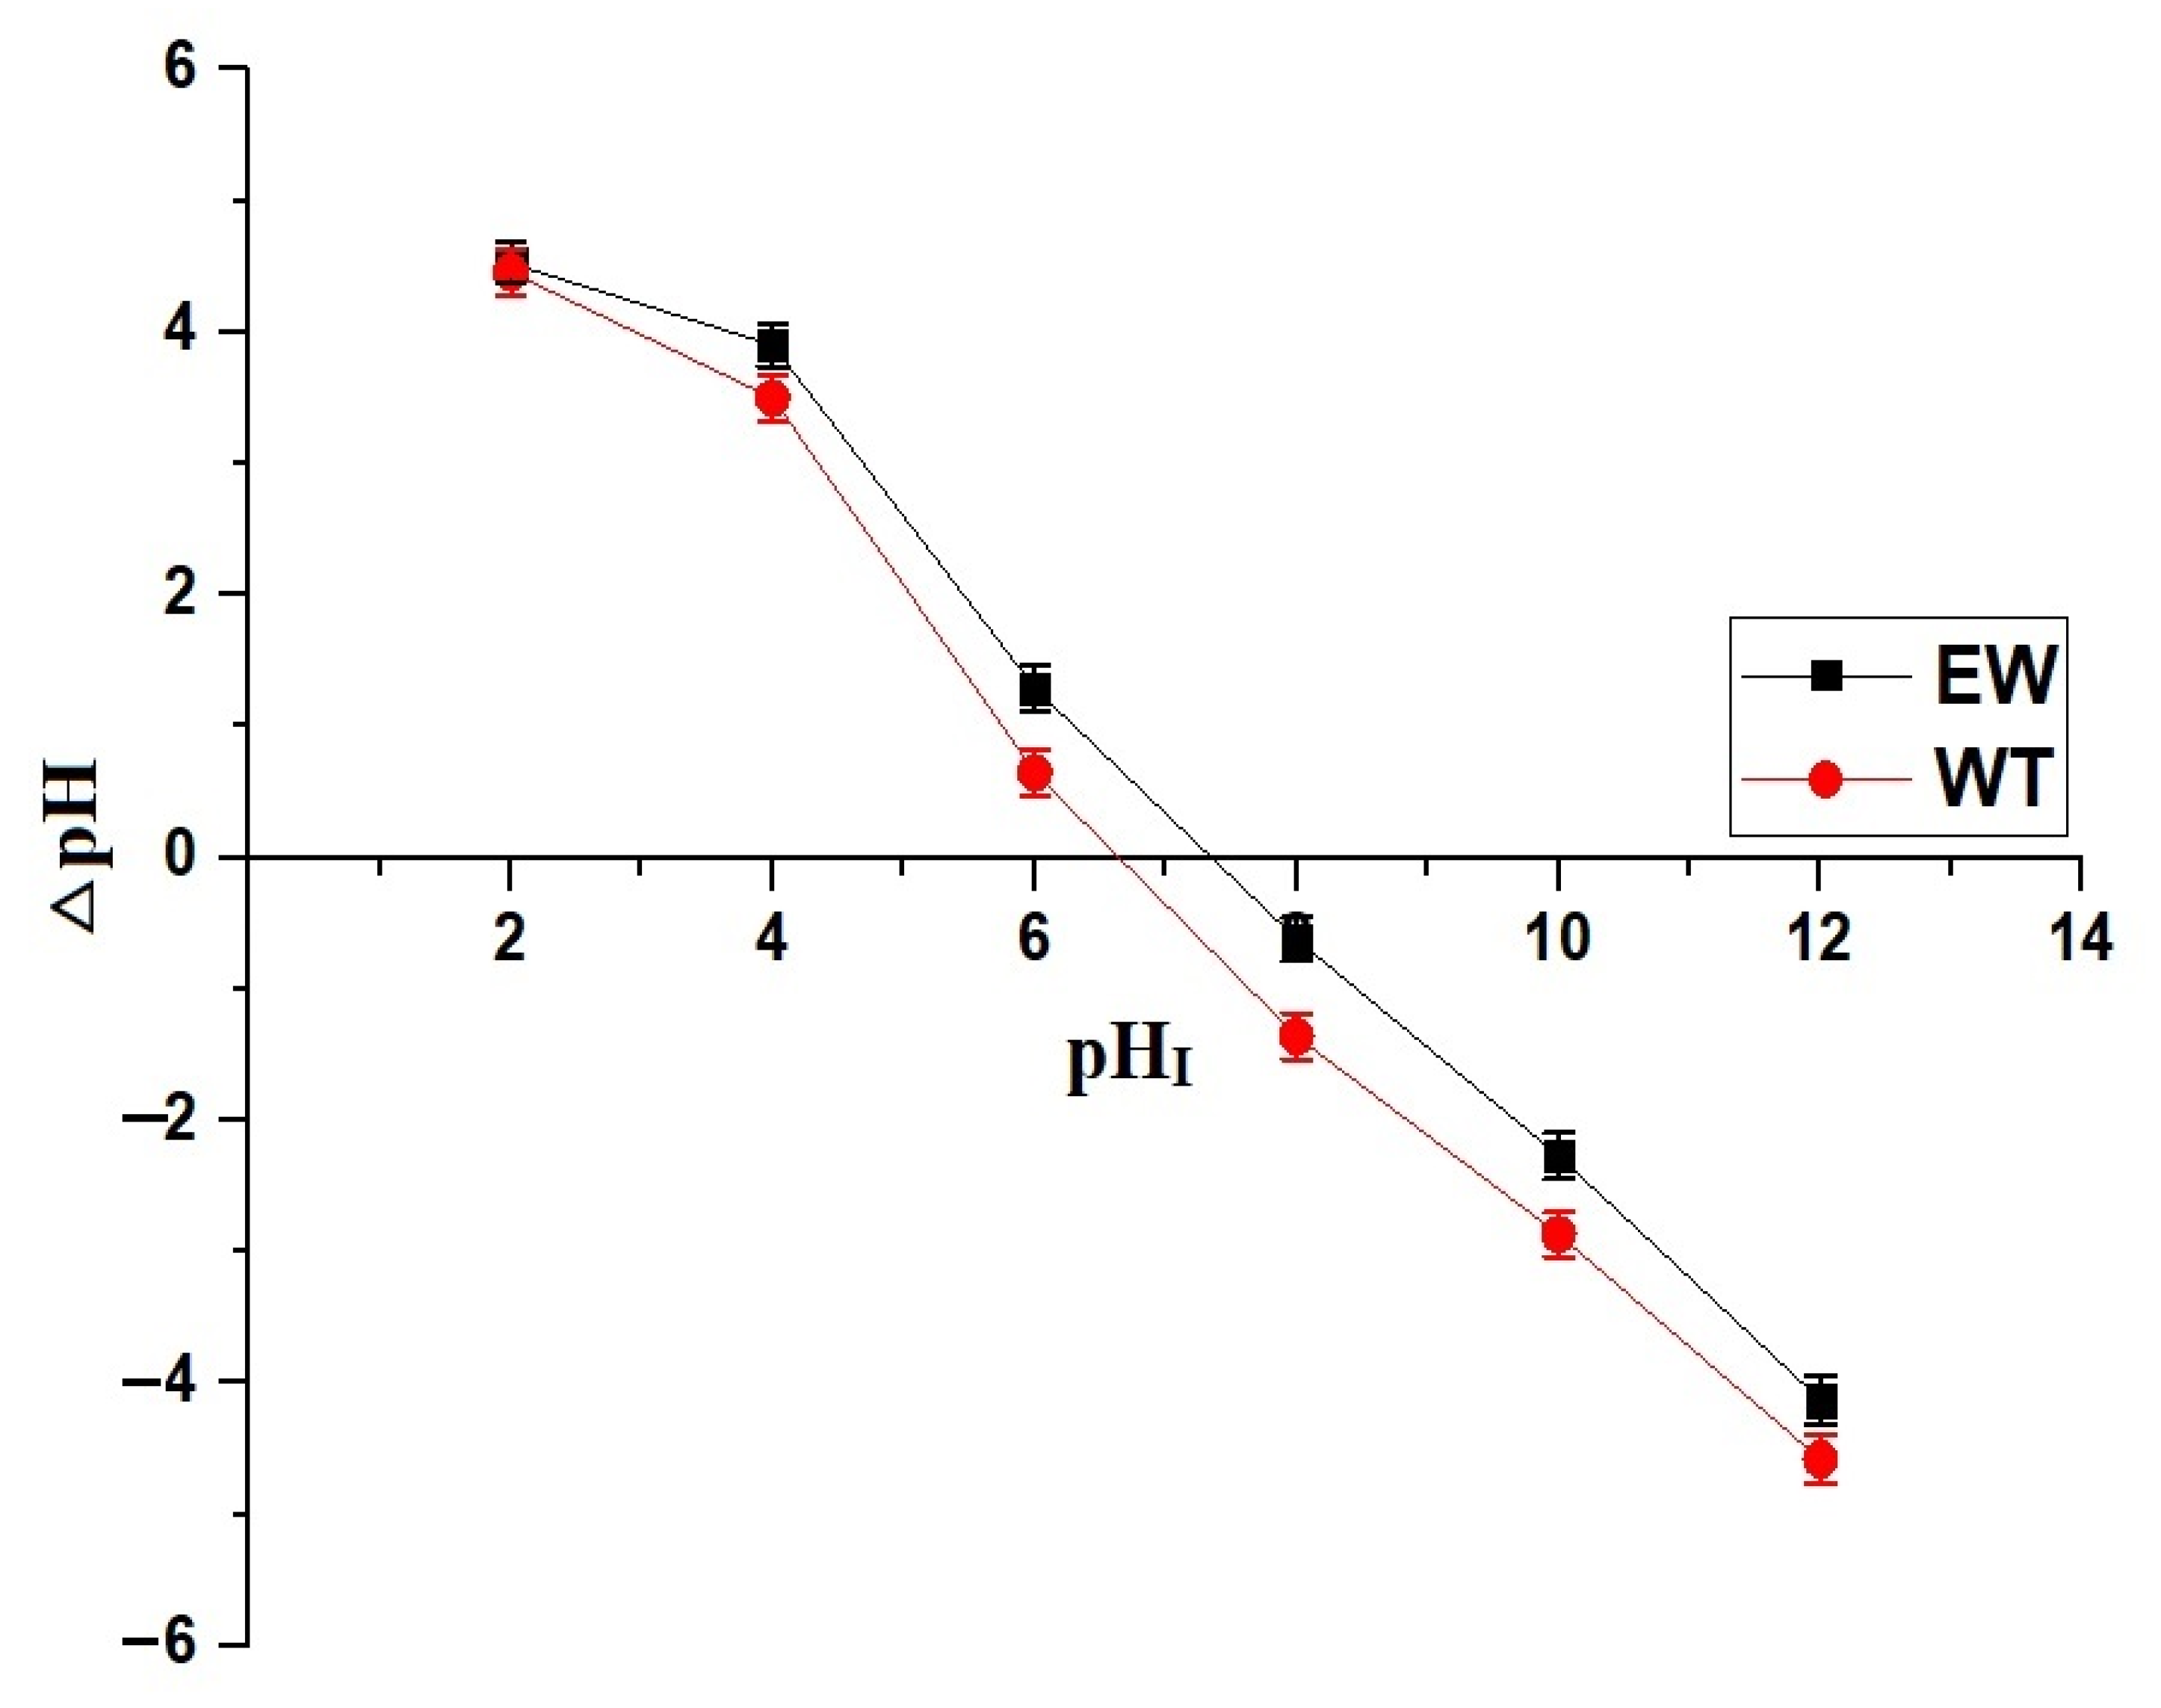
The rhodamine B dye removal efficiency of EW and ET nanocomposites is highly pH-dependent, as illustrated in Figure 6. At pH 2, the removal percentages for EW and ET are significantly low, reaching only 0.91% and 1.28%, respectively. This poor adsorption performance is attributed to the surface charge characteristics of the nanocomposites under highly acidic conditions, as explained in Figure 7. The points of zero charge (pHPZC) for EW and ET are 7.34 and 6.57, respectively, indicating that at pH 2, both materials exhibit a positively charged surface. Since rhodamine B dye is a cationic dye, electrostatic repulsion occurs between the positively charged nickel orthosilicate phase in the nanocomposites and the dye molecules, leading to minimal adsorption, as illustrated in Figure 8. Moreover, at this pH, the analcime phase does not effectively contribute to dye removal through ion exchange because of the high concentration of hydrogen ions in solution, which compete with the dye molecules for exchange sites. At pH 10, the removal efficiency increases significantly, reaching 56.84% for EW and 69.44% for ET. This improvement is due to the shift in surface charge beyond pHPZC, where the nickel orthosilicate phase develops a negatively charged surface that strongly attracts the cationic rhodamine B dye via electrostatic attraction, as shown schematically in Figure 8. Additionally, while the analcime phase is known for its ion-exchange capacity, the rhodamine B cation is relatively large (~1.8 nm) compared with the typical pore diameter of analcime (~0.3–0.4 nm) [29,31]. Therefore, complete intrapore ion exchange is unlikely. Instead, the interaction likely occurs at the external surfaces or at intercrystalline boundaries, where exchangeable sodium ions may still be accessible, contributing to the overall adsorption process. The higher removal efficiency of ET compared with EW is attributed to its lower pHPZC, which allows it to acquire a negative charge at a lower pH, facilitating stronger electrostatic attraction with dye molecules. Additionally, the presence of polyethylene glycol 400 during ET synthesis improves its porosity and surface area, increasing the number of available active sites for both electrostatic attraction and ion exchange mechanisms. The correlation between adsorption behavior and the dual removal mechanisms confirms that nickel orthosilicate primarily removes rhodamine B via electrostatic attraction, while analcime enhances dye removal through ion exchange.
Nickel orthosilicate was selected for its high thermal stability, non-toxicity, and surface chemistry rich in hydroxyl groups. In aqueous media, these surface hydroxyl groups can undergo deprotonation at pH levels above the material’s point of zero charge, resulting in a negatively charged surface. As rhodamine B is a cationic dye, this negative charge promotes electrostatic attraction, enhancing adsorption efficiency. Previous studies have demonstrated similar mechanisms for nickel orthosilicate and nickel-based silicates such as the NiO/SiO2 composite, where negatively charged surfaces effectively adsorbed cationic dyes via electrostatic interactions [23,32]. The observed increase in dye removal at pH 10 aligns with this mechanism, confirming that nickel orthosilicate primarily contributes to the removal of rhodamine B through surface-mediated electrostatic attraction.
While XRD confirms the presence of separate analcime and nickel orthosilicate phases, the improved adsorption performance of the composite, particularly in the ET sample, suggests a synergistic interaction between the two. The analcime component offers ion-exchange capacity, while nickel orthosilicate provides a surface with a negative charge at high pH, enabling the electrostatic attraction of rhodamine B cations. Their coexistence within a single nanostructured matrix allows both mechanisms to act in parallel, thus enhancing overall dye removal beyond what either material could achieve alone.
It is noteworthy that rhodamine B exhibits a zwitterionic structure at pH values above ~3.7 due to the deprotonation of its carboxylic acid group, while the amine group remains protonated, resulting in a molecule carrying both positive and negative charges [31]. This amphoteric behavior, similar to that of amino acids, may influence the adsorption characteristics. Although the molecule retains a net positive charge in most of the studied pH range, the negative carboxylate group may enhance interactions with positively charged surface sites or contribute to specific binding modes on the adsorbent surface. The shift to this zwitterionic form around pH 3.7 could partly explain changes in adsorption capacity with pH, particularly as it allows for dual electrostatic interactions and possibly hydrogen bonding. However, the deprotonation of the amine group to form a neutral or anionic structure typically requires a much higher pH than those studied here and is unlikely to influence adsorption behavior within the tested range.

2.2.2. Effect of Contact Time

The adsorption behavior of rhodamine B dye on EW and ET nanocomposites is time-dependent, as illustrated in Figure 9. Both materials exhibit a rapid increase in removal efficiency in the initial stages of adsorption, followed by a gradual approach to equilibrium. The fast initial uptake is attributed to the abundance of available active sites on the nanocomposites, which facilitates strong interactions between the dye molecules and the adsorbent surfaces. Over time, the removal efficiency slows as these active sites become progressively occupied, ultimately reaching a saturation point where no further significant adsorption occurs. At 10 min, the removal efficiencies of EW and ET are 49.03% and 58.33%, respectively, indicating that ET demonstrates a higher adsorption rate in the early stages. This enhanced performance is attributed to its larger surface area and improved porosity, which provide greater accessibility to adsorption sites. The equilibrium time for ET is 50 min, at which the removal efficiency reaches 66.21%, whereas EW continues to adsorb dye until equilibrium is reached at 70 min, with a removal efficiency of 56.75%. The longer equilibrium time for EW suggests a slower adsorption process, likely due to differences in surface characteristics and the interaction strength between the dye and the adsorbent. Beyond the equilibrium times, no further significant increase in dye removal is observed, indicating the saturation of the adsorption sites on both materials.
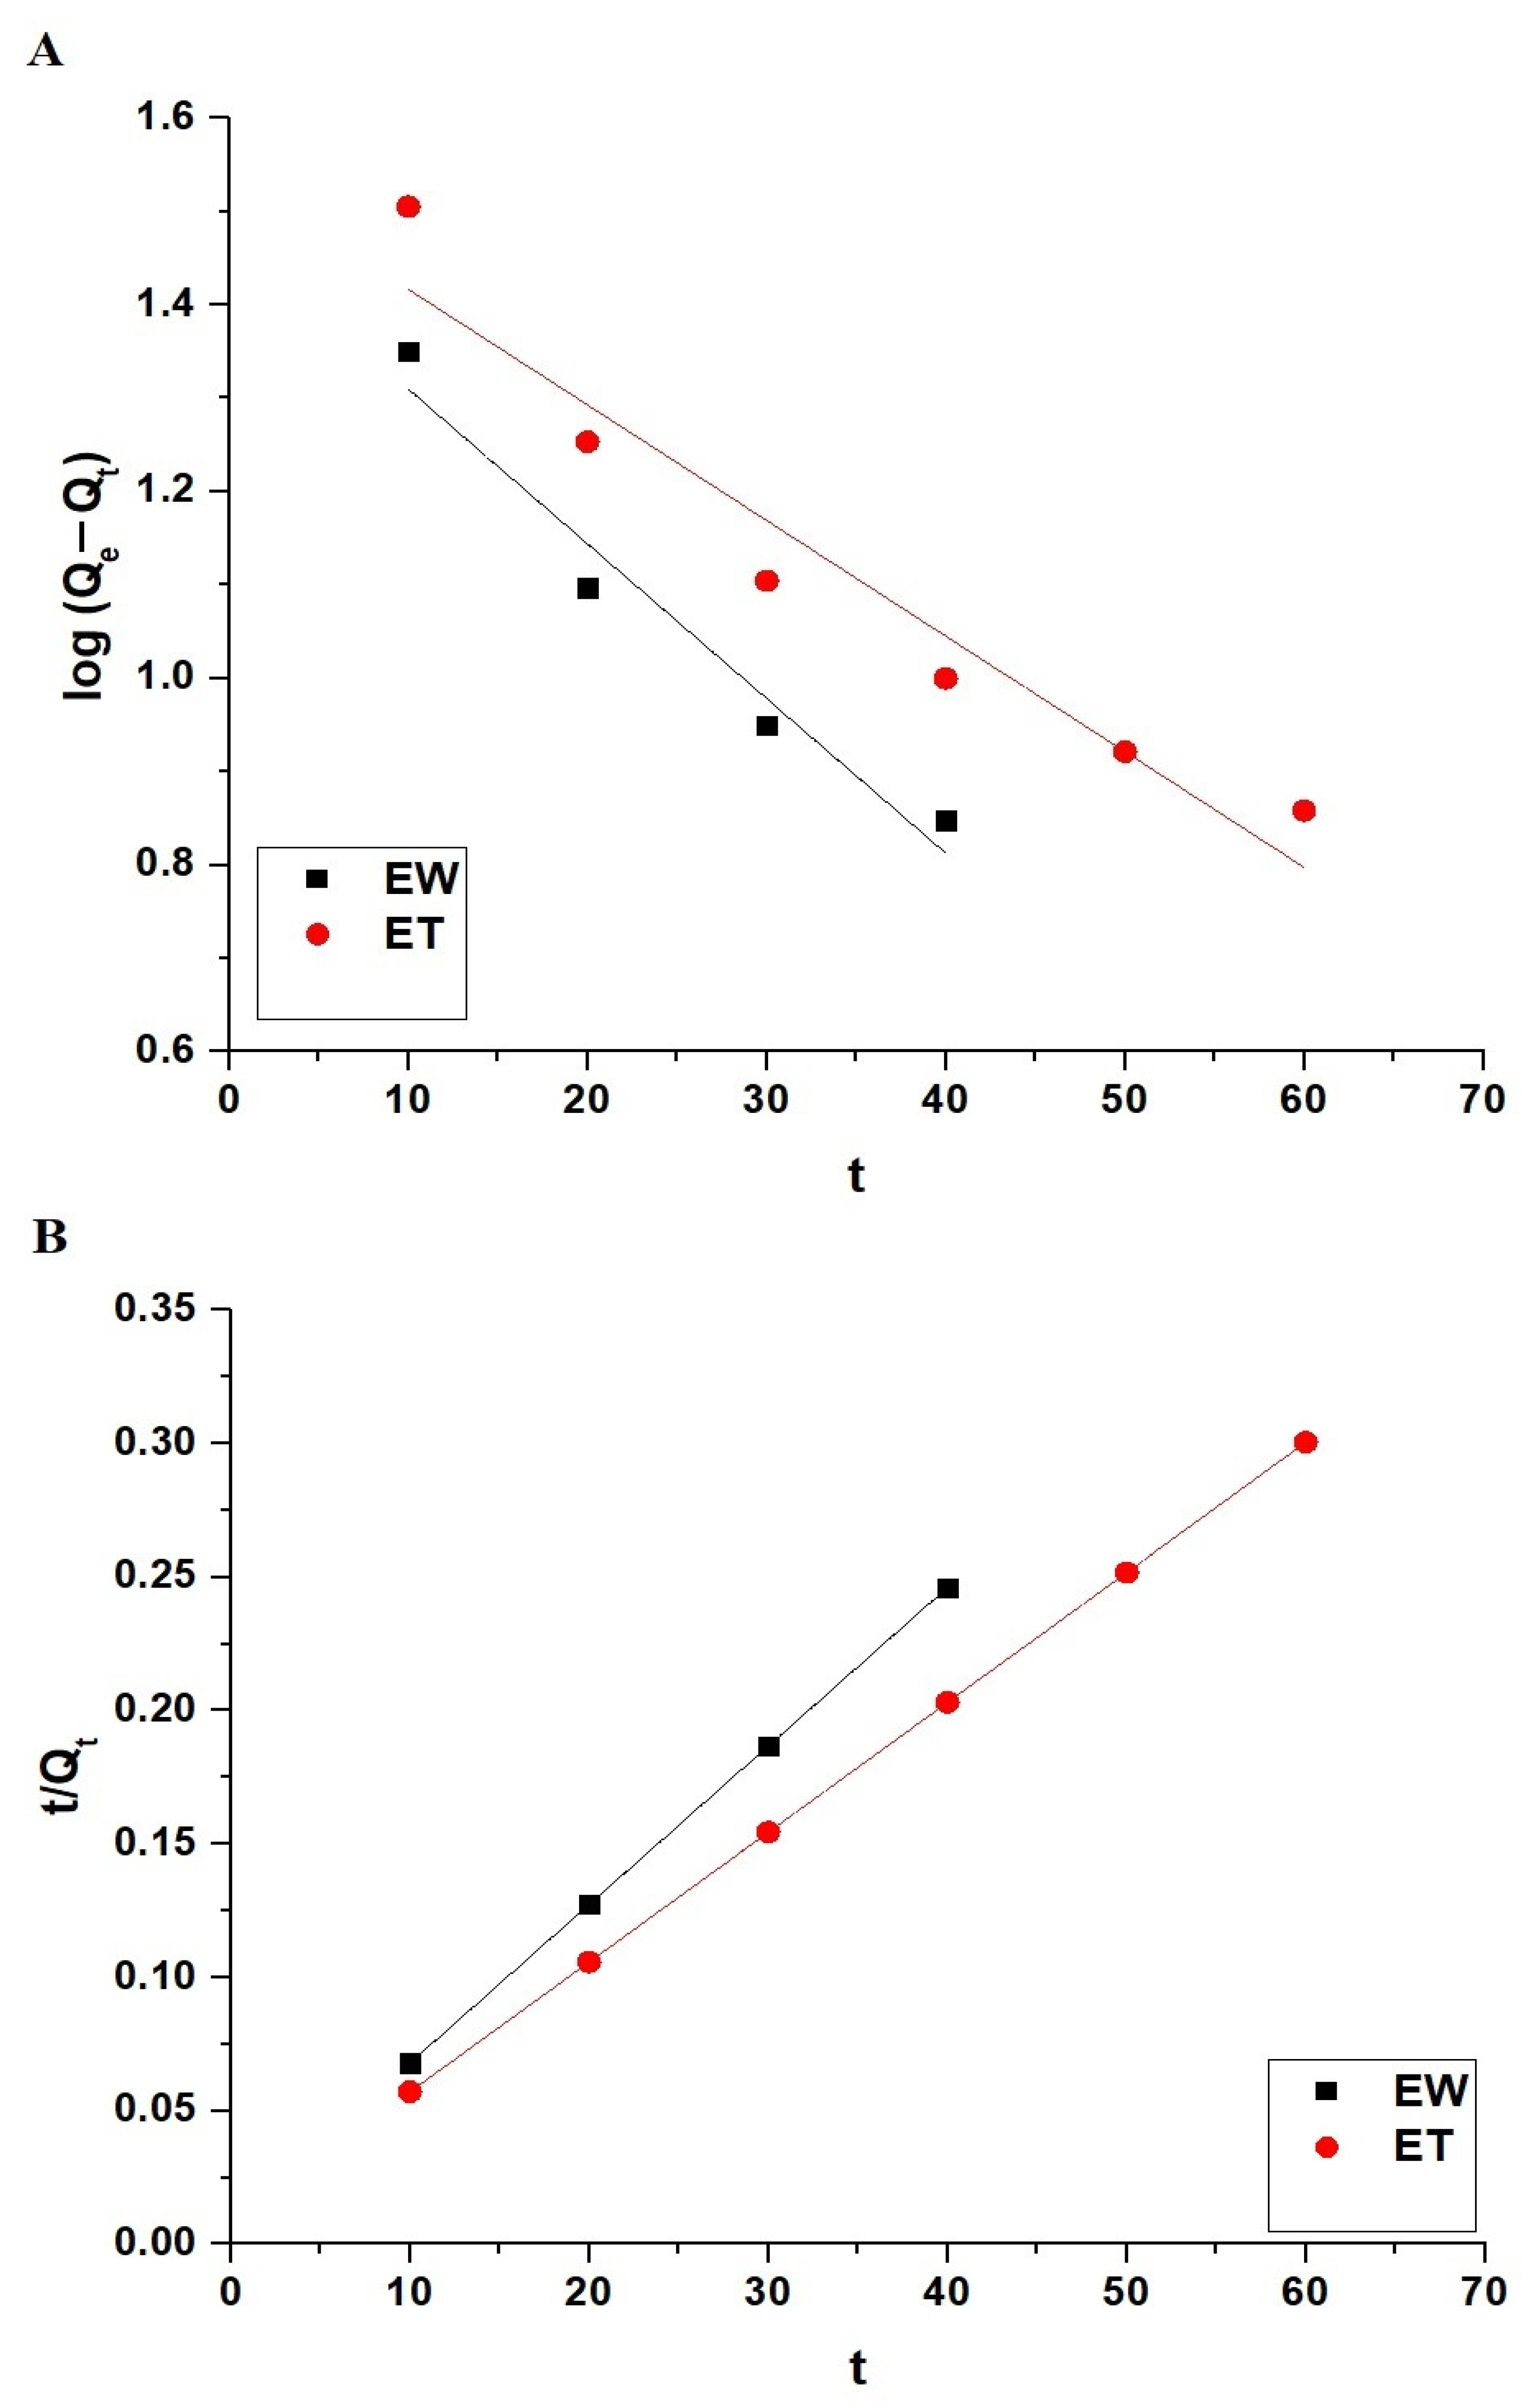
The kinetics of rhodamine B dye adsorption onto EW and ET nanocomposites were analyzed by using the pseudo-first-order and pseudo-second-order kinetic models, as shown in Figure 10A,B, respectively. The pseudo-first-order model is described by Equation (3) [33].
log Q e Q t = l o g Q e K 1 2.303 t
The pseudo-second-order model is represented by Equation (4) [33].
t Q t = 1 K 2 Q e 2 + 1 Q e t
In this equations, Qe (mg/g) represents the amount of rhodamine B dye adsorbed at equilibrium, Qt (mg/g) is the amount of rhodamine B dye adsorbed at time t, K1 (1/min) is the pseudo-first-order rate constant, and K2 (g/mg·min) is the pseudo-second-order rate constant.
The kinetic parameters for the adsorption process are presented in Table 2. The experimental equilibrium adsorption capacities (QExp) for EW and ET are 169.52 mg/g and 206.96 mg/g, respectively. The pseudo-first-order model exhibits low correlation coefficients (R2) of 0.9377 for EW and 0.9162 for ET, with significantly underestimated Qe values of 29.87 mg/g for EW and 34.70 mg/g for ET, indicating a poor fit to the experimental data. Conversely, the pseudo-second-order model provides an excellent fit, with R2 values of 0.9999 for both EW and ET. The calculated Qe values from this model, 168.35 mg/g for EW and 205.76 mg/g for ET, are in close agreement with the experimental values, confirming that adsorption follows the pseudo-second-order model. The high correlation coefficients and accurate prediction of Qe suggest that the adsorption process is more controlled by chemisorption (ion exchange) than by physisorption (electrostatic attraction).

2.2.3. Effect of Temperature

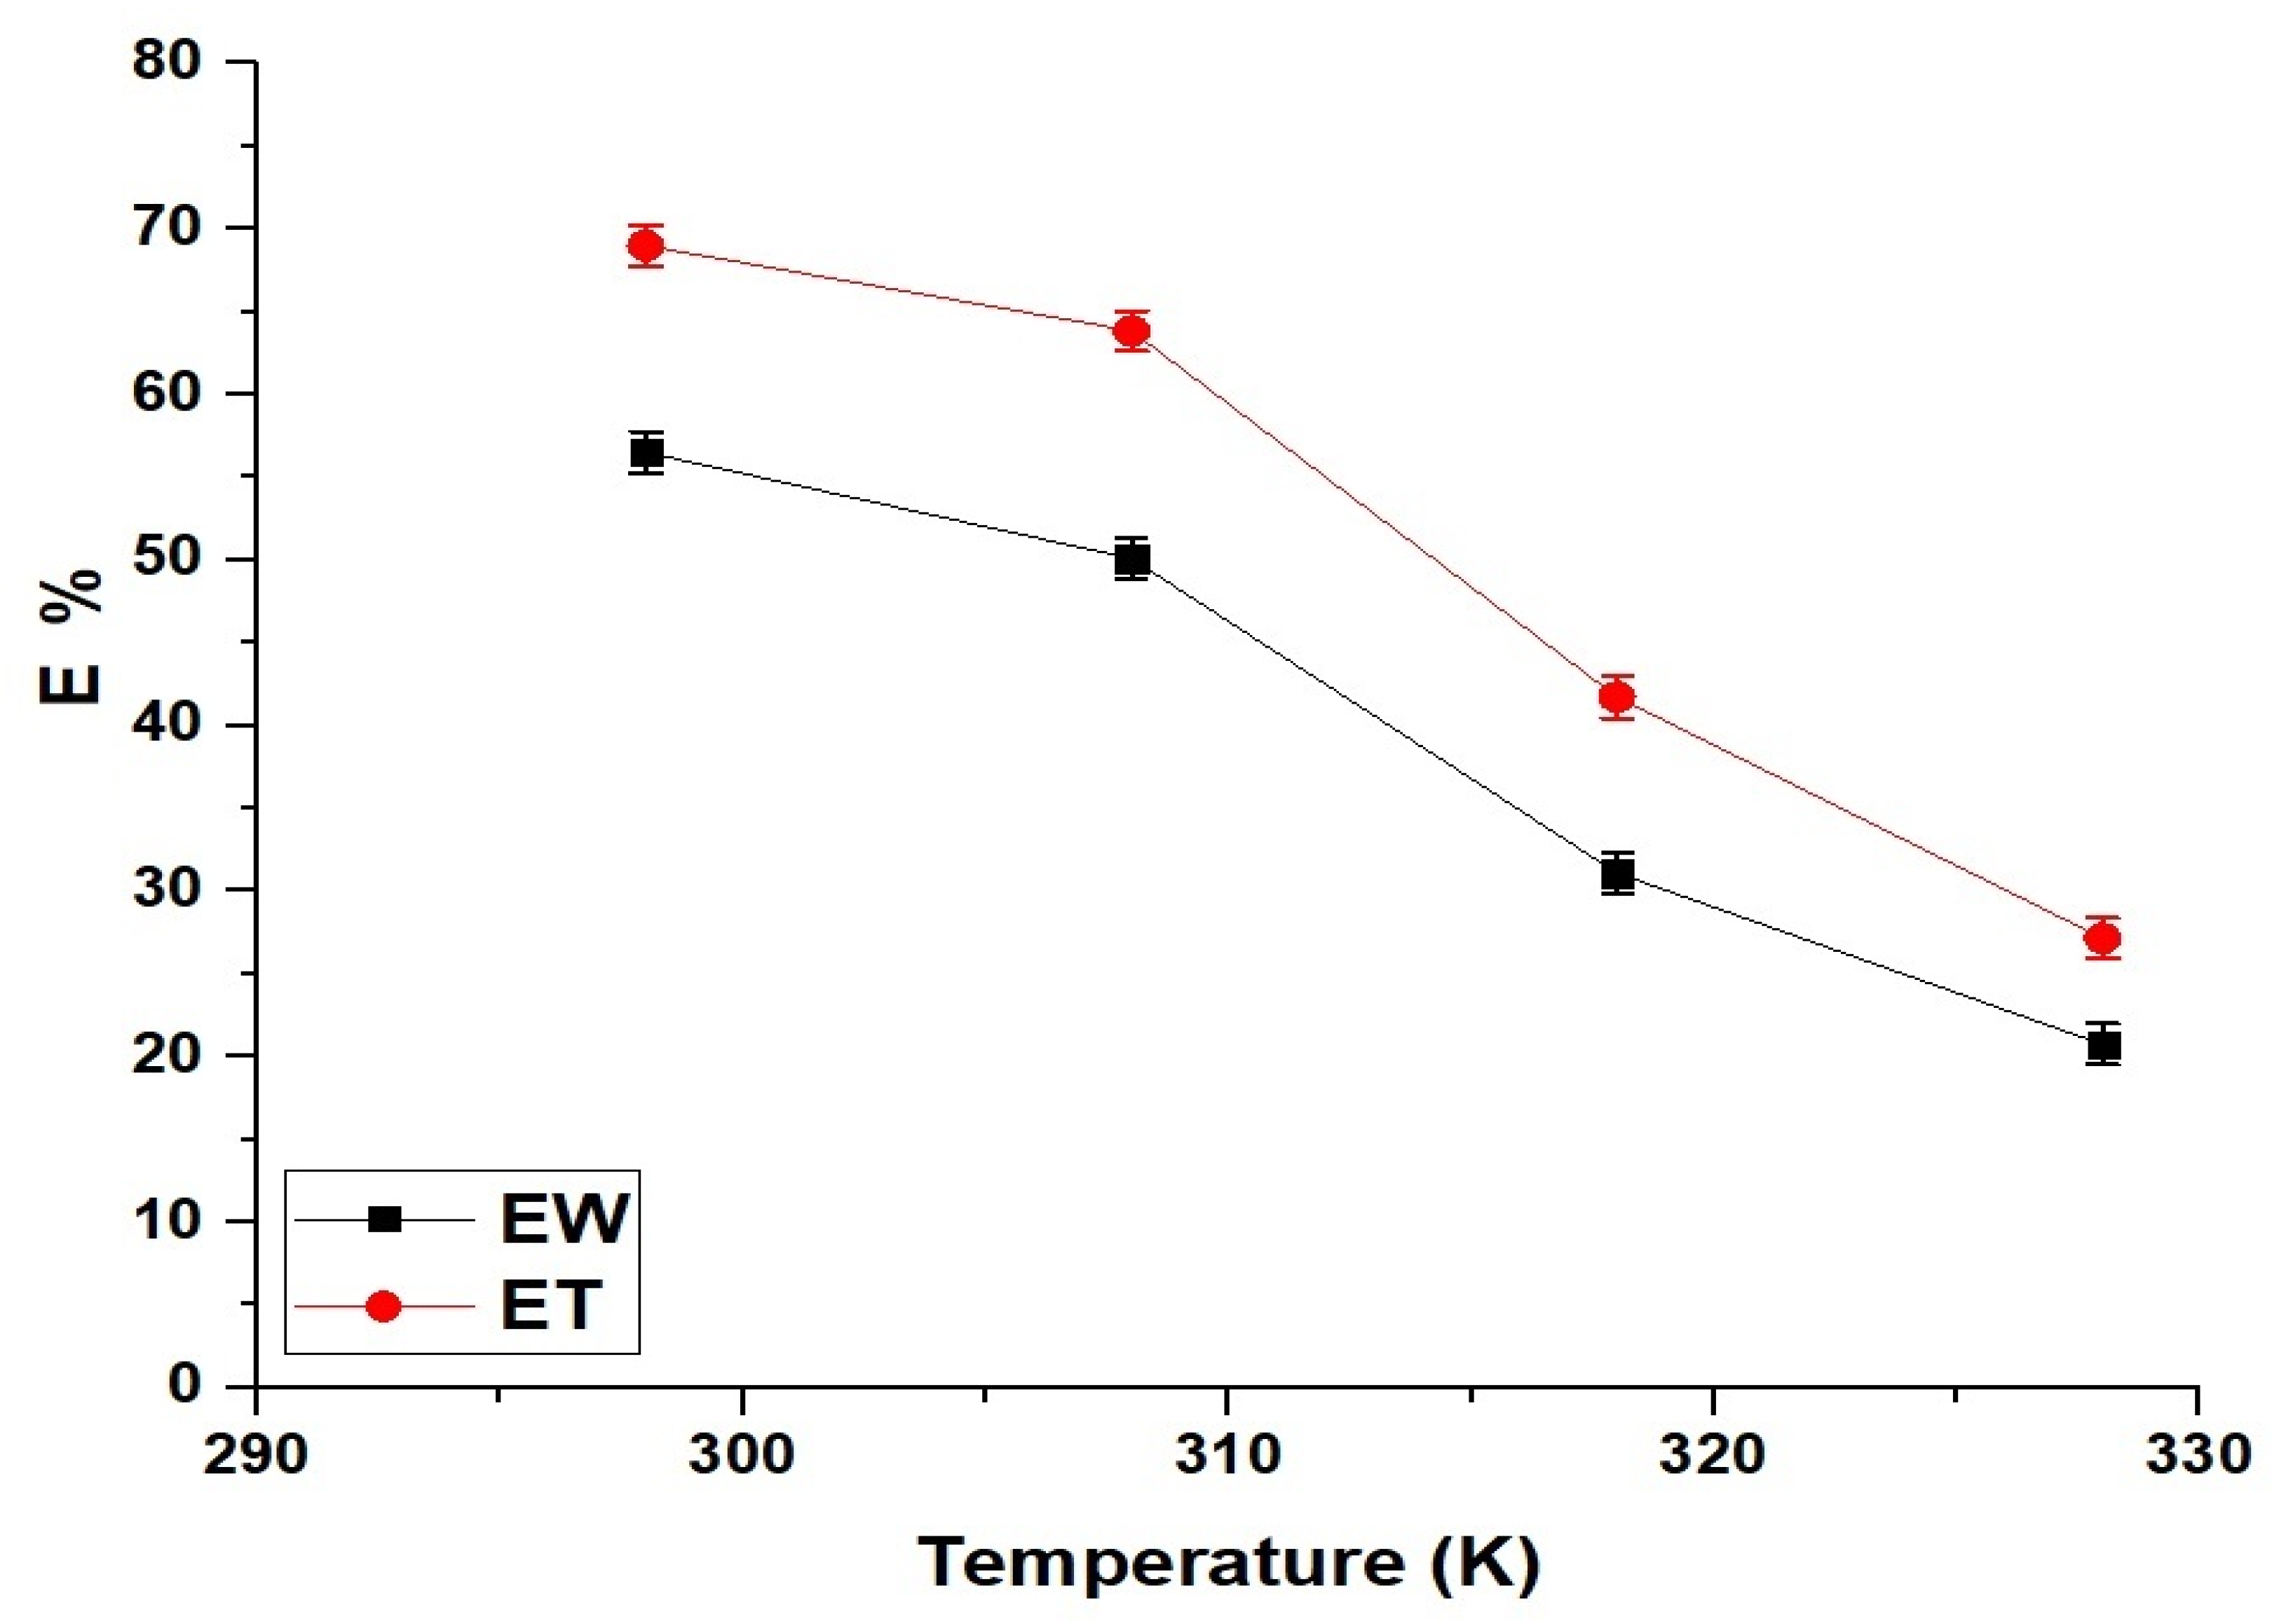
The adsorption behavior of rhodamine B dye on EW and ET nanocomposites is significantly influenced by temperature, as shown in Figure 11. At 298 K, the removal efficiencies of EW and ET are 56.51% and 68.99%, respectively, indicating that ET exhibits higher adsorption capacity due to its enhanced surface properties and porosity. As the temperature increases to 328 K, the removal efficiencies decrease to 20.75% for EW and 27.15% for ET, demonstrating that the adsorption process is less favorable at elevated temperatures. This decline suggests that adsorption occurs through an exothermic mechanism, where higher temperatures reduce the interaction strength between dye molecules and active adsorption sites.
The thermodynamic parameters for the adsorption of rhodamine B dye onto EW and ET nanocomposites were determined by using Equations (5)–(7) [34,35].
The relationship between the distribution coefficient (Kd) and temperature (T) is described by the Van’t Hoff equation, which is described in Equation (5).
l n K d = Δ S o R Δ H o R T
The Gibbs free energy change (ΔGo), entropy change (ΔSo), and enthalpy change (ΔHo) values for the adsorption process are calculated by using Equation (6).
Δ G o = Δ H o T Δ S o
where R (8.314 × 10⁻³ kJ/mol·K) is the universal gas constant.
The distribution coefficient (Kd) is calculated by Equation (7).
K d = Q e C e
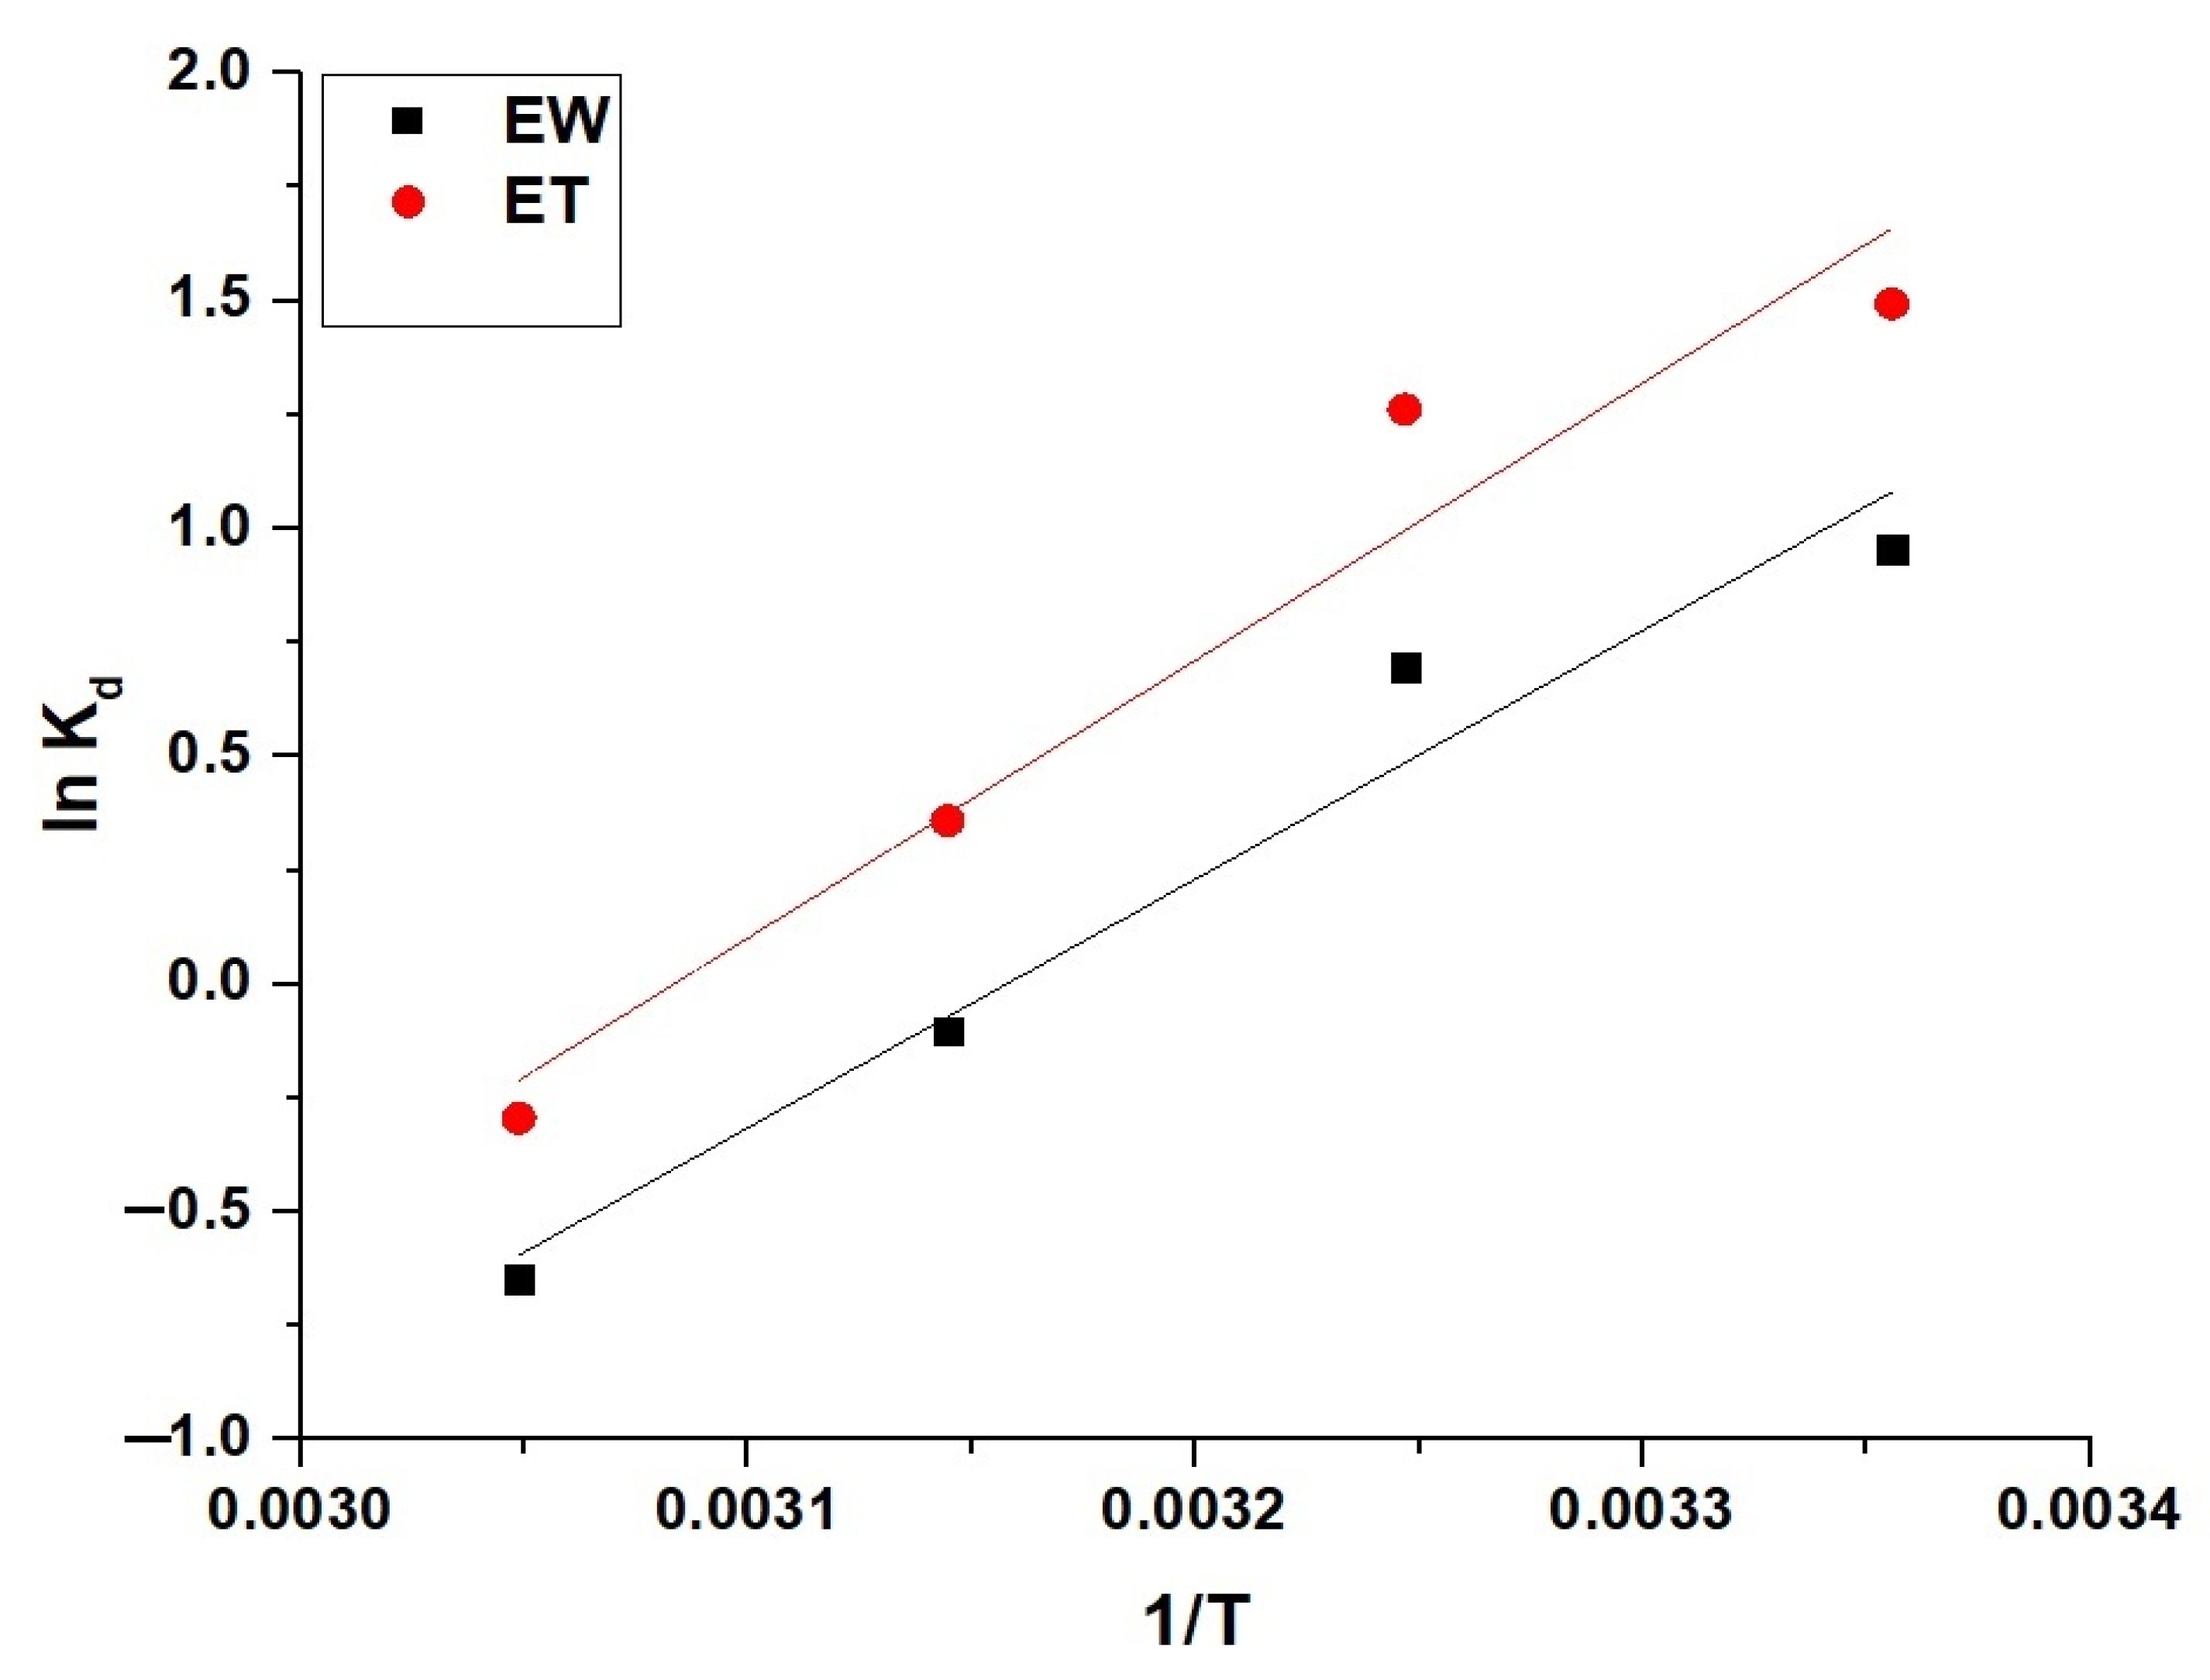
The Van’t Hoff plot shown in Figure 12 confirms the temperature dependence of the adsorption process. The thermodynamic parameters presented in Table 3 indicate that the adsorption process is more chemical than physical, as ΔHo is more than 40 kJ/mol for both EW (−45.62 kJ/mol) and ET (−50.92 kJ/mol). The negative values of ΔHo confirm that adsorption is exothermic, meaning that increasing the temperature reduces the adsorption capacity. The negative values of ΔGo at all temperatures indicate that the adsorption process is spontaneous, with the more negative values at higher temperatures suggesting an increased thermodynamic driving force. The positive values of ΔSo demonstrate that the adsorption process undergoes an increase in randomness at the solid–liquid interface. The observed positive entropy change may be attributed to the release of water molecules or counterions from the hydration shell of the dye and adsorbent surface into the bulk solution during adsorption, resulting in an overall increase in system disorder despite the localization of dye molecules. These findings confirm that the adsorption of rhodamine B dye onto EW and ET nanocomposites is thermodynamically favorable and primarily driven by chemical interactions.

2.2.4. Effect of Concentration

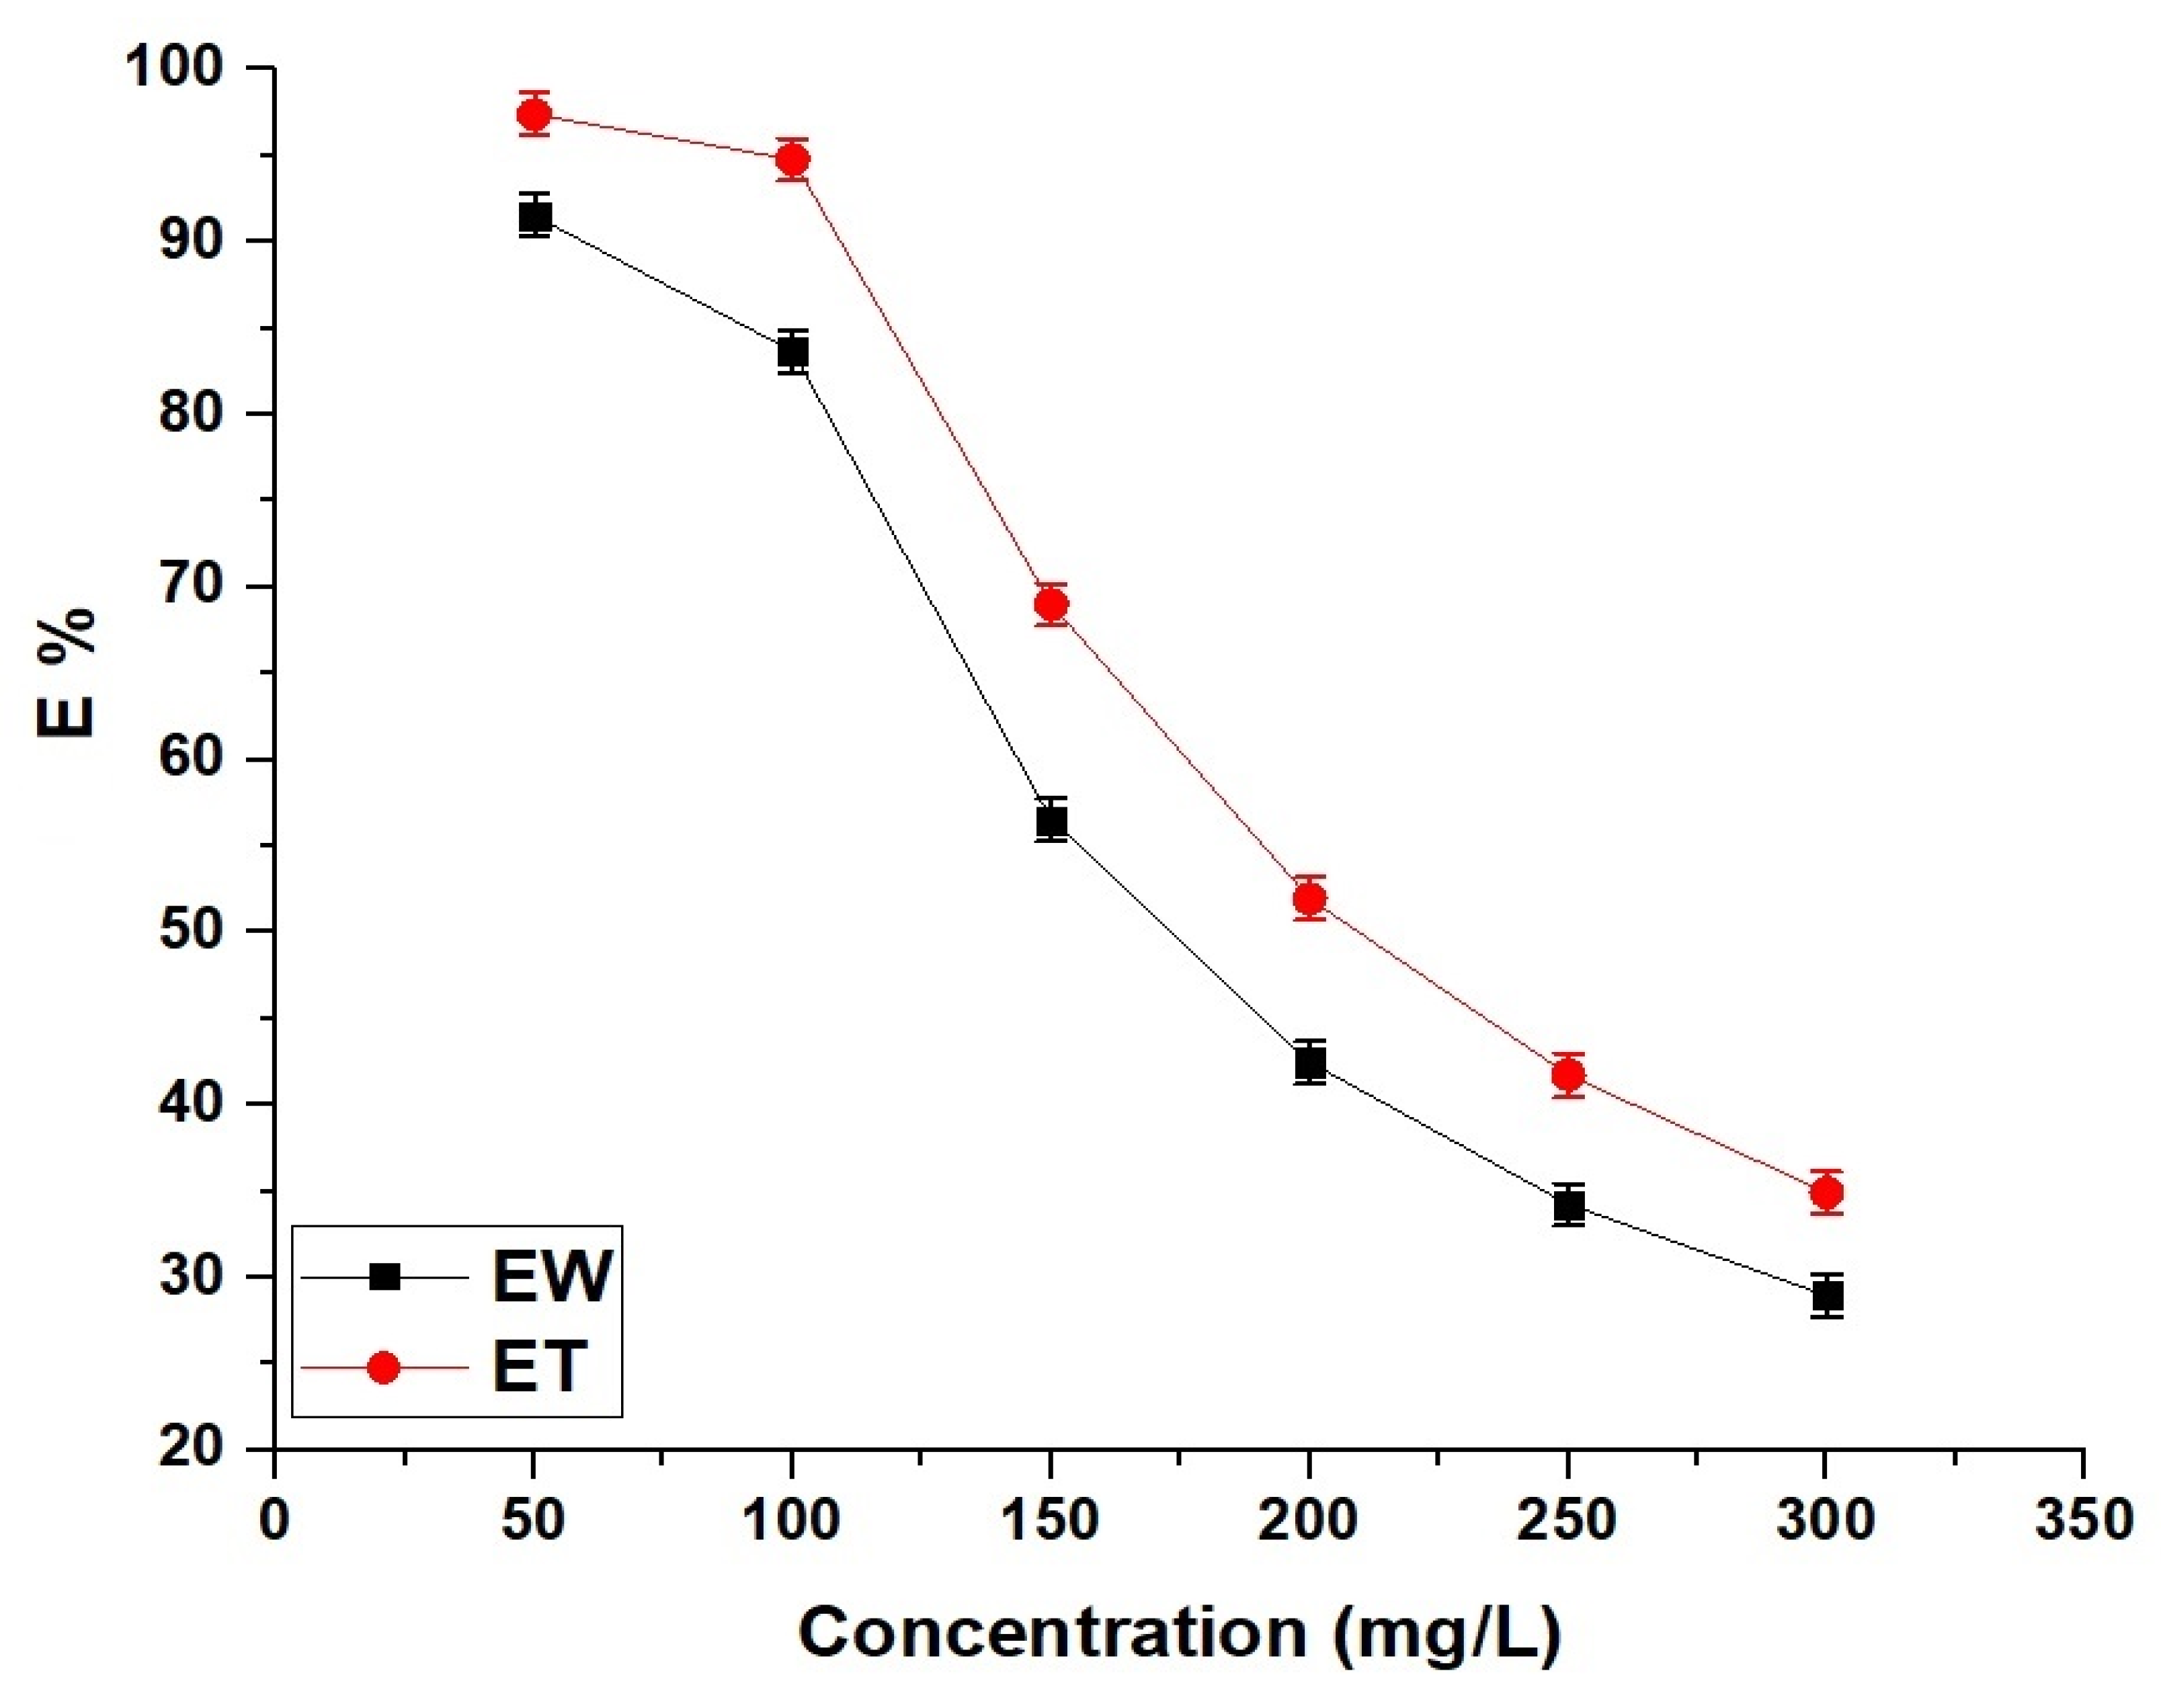
The efficiency of rhodamine B dye adsorption onto EW and ET nanocomposites is influenced by the initial dye concentration, as shown in Figure 13. At a low concentration of 50 mg/L, the removal efficiencies of EW and ET are 91.52% and 97.38%, respectively, indicating that both nanocomposites exhibit high adsorption capacity when sufficient active sites are available. As the concentration increases to 300 mg/L, the removal efficiencies decrease to 28.95% for EW and 34.92% for ET, demonstrating that the adsorption process becomes less effective at higher dye concentrations. This decline is attributed to the saturation of available adsorption sites, leading to reduced efficiency in capturing additional dye molecules from the solution. The consistently higher removal efficiency of ET compared with EW at both low and high concentrations suggests that ET possesses a greater number of active sites and enhanced surface characteristics that facilitate higher dye uptake. The observed trend confirms that adsorption efficiency is inversely related to initial dye concentration due to the progressive saturation of active sites on the nanocomposites.
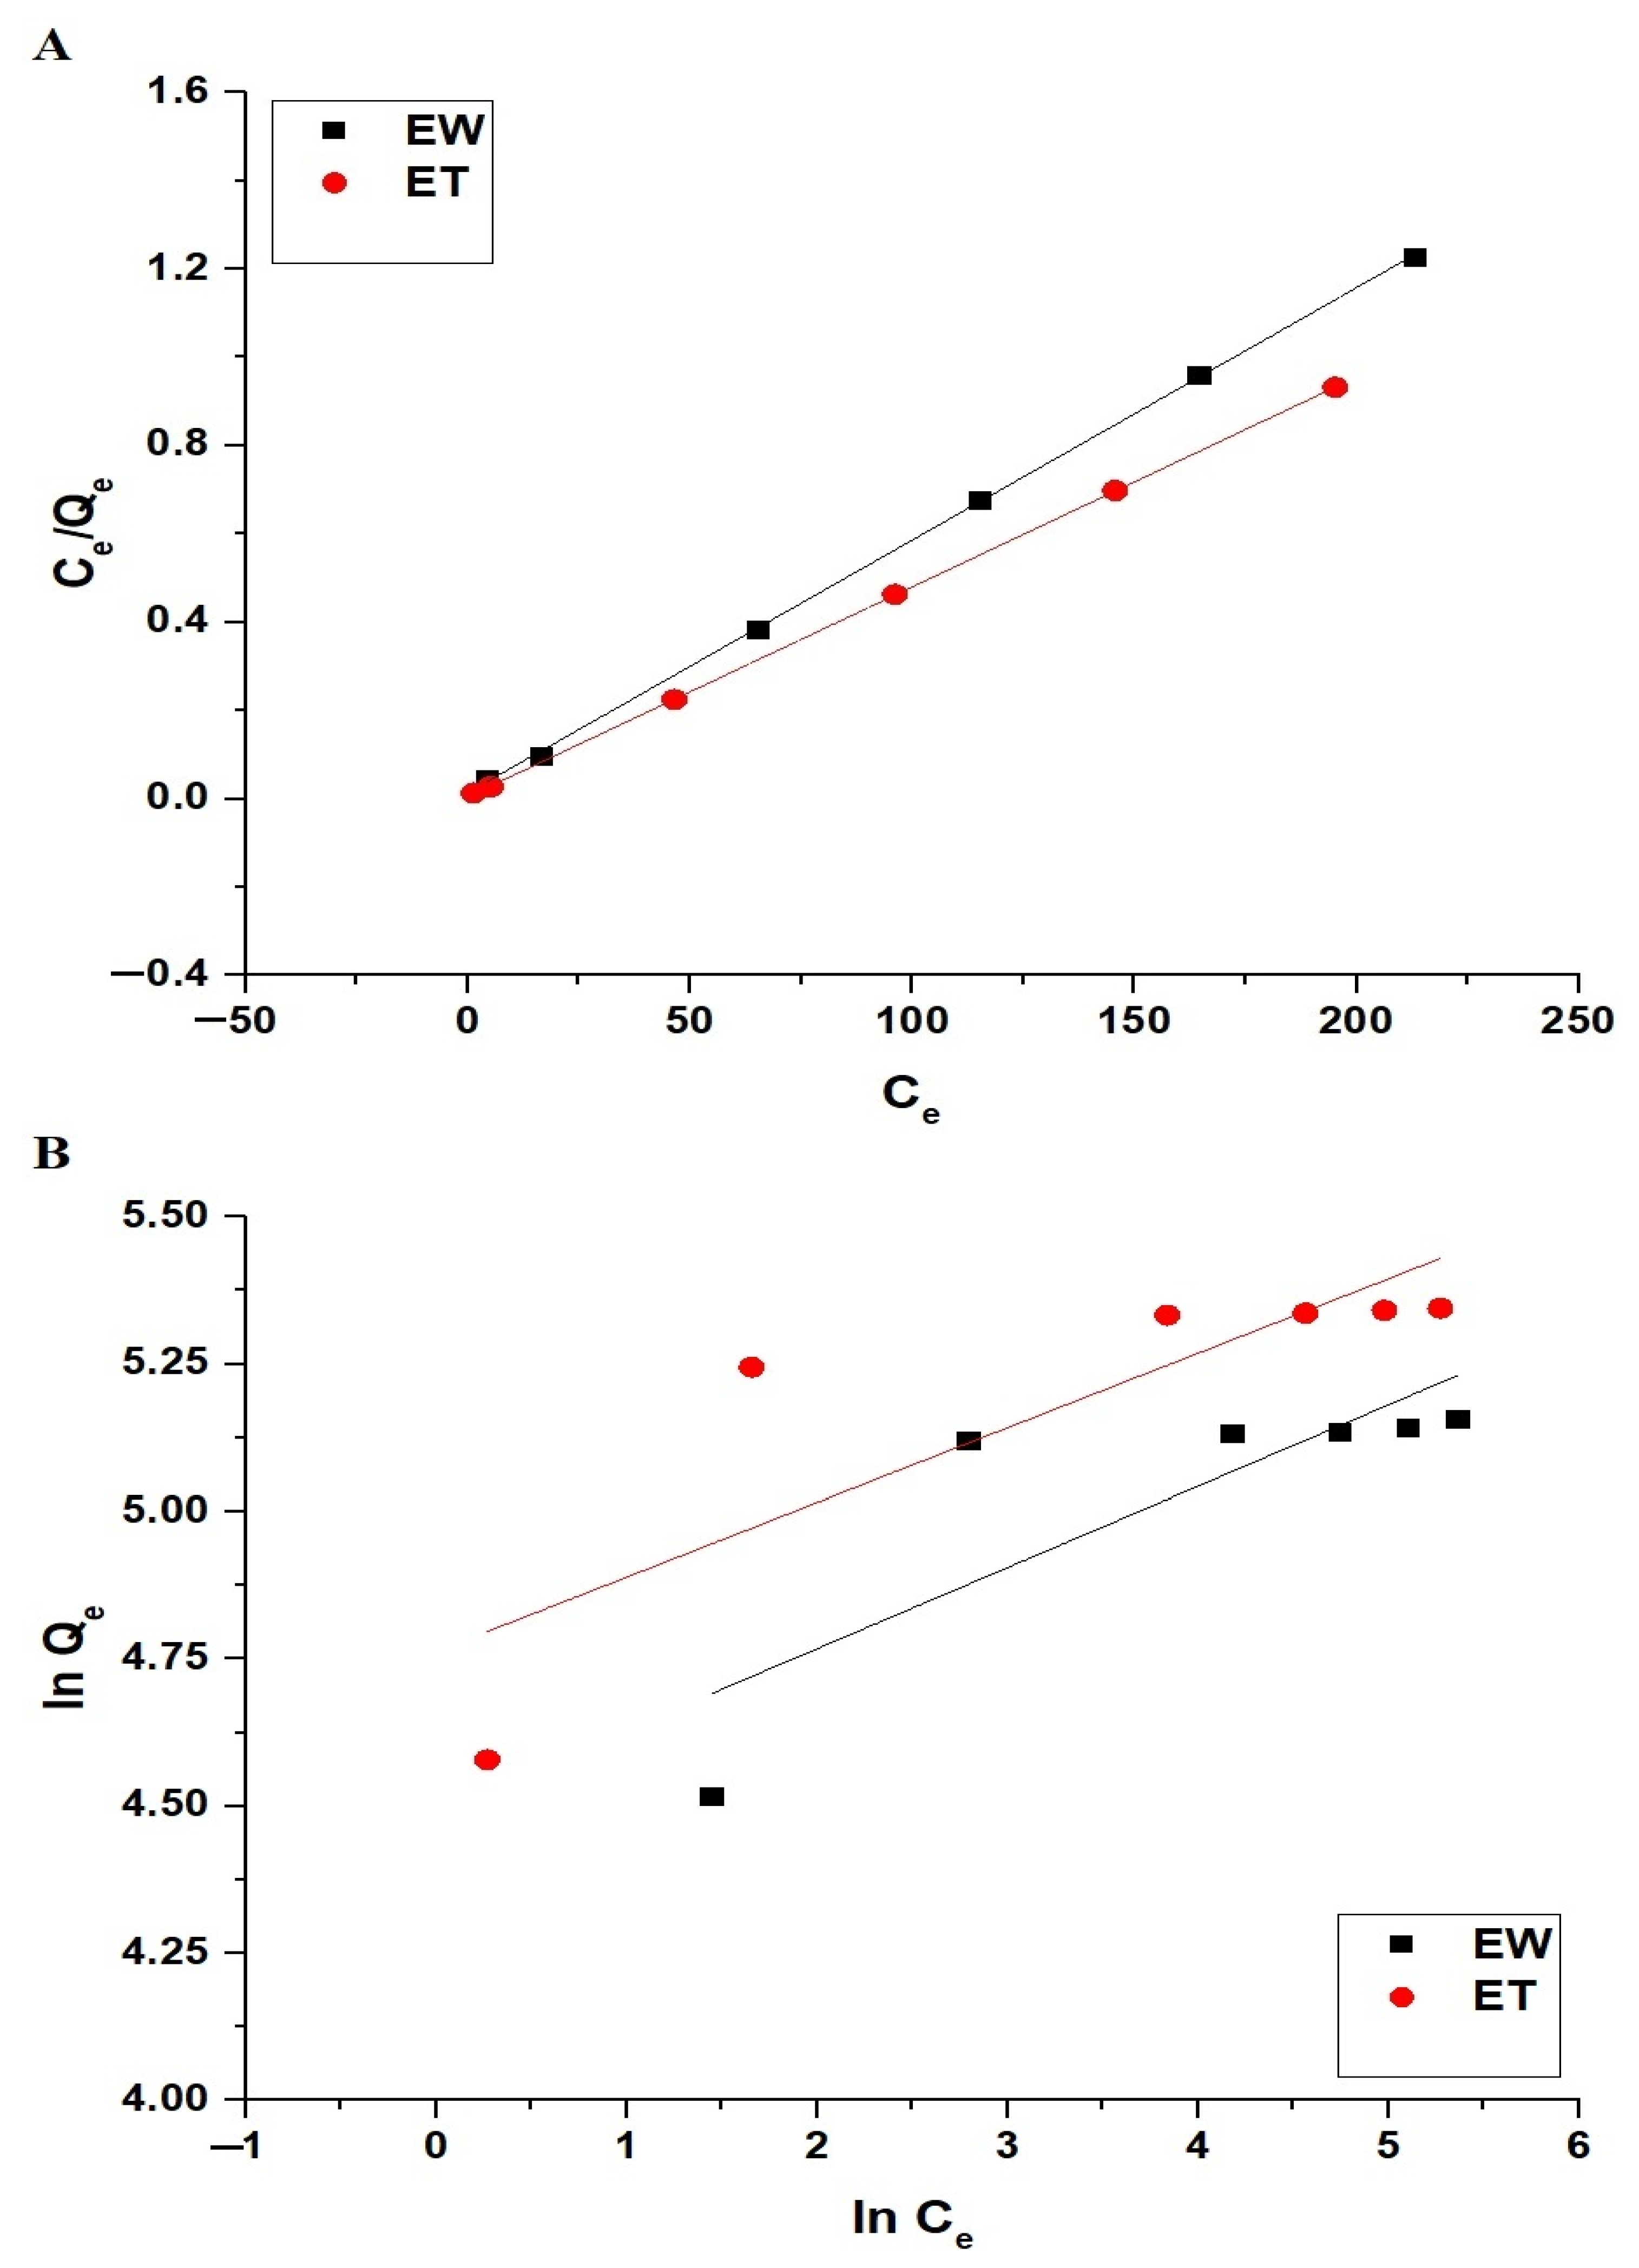
The adsorption behavior of rhodamine B dye onto EW and ET nanocomposites was analyzed by using the Langmuir and Freundlich isotherm models, as shown in Figure 14. The Langmuir isotherm is described by Equation (8) [36].
C e Q e = 1 K 3 Q m a x + C e Q m a x
The Freundlich isotherm is represented by Equations (9) and (10) [35,36].
l n Q e = l n K 4 + 1 n l n C e
Q m a x = K 4 C o 1 / n
In these equations, K3 (L/mg) is the Langmuir constant, K4 ((mg/g)(L/mg)1/n) is the Freundlich constant, and n is the Freundlich exponent, which indicates adsorption intensity.
The adsorption isotherm parameters presented in Table 4 confirm that the adsorption process follows the Langmuir isotherm model, as evidenced by the high correlation coefficients (R2) of 0.9997 for EW and 0.9999 for ET. The calculated Qmax values from the Langmuir model are 174.83 mg/g for EW and 210.53 mg/g for ET, which closely match the experimental data, indicating monolayer adsorption onto a homogeneous surface with uniform active sites. In contrast, the Freundlich model exhibits lower R2 values of 0.6048 for EW and 0.6268 for ET, suggesting a poor fit to the experimental data. The higher adsorption capacity and stronger correlation with the Langmuir model demonstrate that adsorption occurs through monolayer coverage rather than multilayer adsorption, confirming that the adsorption of rhodamine b dye onto EW and ET nanocomposites is best described by the Langmuir isotherm.
The rhodamine B dye adsorption capacities of various adsorbents are compared in Table 5. The EW and ET nanocomposites exhibit superior adsorption performance, with maximum uptake capacities of 174.83 and 210.53 mg/g, respectively, surpassing all other materials listed [32,37,38,39,40,41,42,43,44]. Among the previously reported adsorbents, biochar (169.50 mg/g) and SBA-16 mesoporous silica (166.70 mg/g) demonstrate relatively high adsorption capacity, while other materials, such as activated carbon (144.36 mg/g), Fe3O4 nanoparticles (138.40 mg/g), and CoFe2O4 nanoparticles (145.10 mg/g), show moderate adsorption efficiency. The lowest adsorption capacities are observed for the magnetic ZnFe2O4 nanocomposite (9.83 mg/g) and iodo-polyurethane foam (22.03 mg/g), highlighting their limited adsorption potential for rhodamine B dye removal. The superior adsorption performance of EW and ET nanocomposites can be attributed to their unique structural and physicochemical properties. The presence of nickel orthosilicate provides a high density of active sites, which enhances electrostatic interactions with dye molecules, while the analcime phase facilitates ion exchange, contributing to the overall adsorption capacity. The enhanced porosity and well-defined surface structure of ET, resulting from the synthesis process involving polyethylene glycol 400 as a template, further improve its adsorption efficiency by increasing the accessibility of active sites. The higher uptake capacity of ET compared with EW suggests that surface modifications play a crucial role in optimizing adsorption performance. The combination of electrostatic attraction and ion exchange mechanisms makes these nanocomposites highly effective adsorbents, outperforming conventional materials in rhodamine B dye removal.
For comparison, pure analcime and pure nickel orthosilicate were synthesized according to previously reported procedures [45,46], and a physical mixture (PM) of the two phases was also tested under identical conditions. The measured adsorption capacity of pure analcime was 68.40 mg/g, while the estimated capacity of nickel orthosilicate and the PM sample were 96.15 and 110.56 mg/g, respectively. Both nanocomposites (EW and ET) significantly outperformed the reference materials, confirming that their superior performance is not due to simple additive effects but rather a synergistic interaction between the two phases.
The Brunauer–Emmett–Teller surface area (BET surface area), average pore size, and total pore volume of the EW and ET nanocomposites were evaluated by using nitrogen adsorption–desorption analysis, and the results are presented in Table 6. These parameters provide key insights into the structural differences between the two materials and their potential influence on adsorption performance. As shown in Table 6, the BET surface area of the ET nanocomposite (108 m2/g) is significantly higher than that of EW (66 m2/g). This enhancement can be attributed to the presence of polyethylene glycol 400 as a templating agent during the synthesis of ET, which facilitates the formation of more uniform and porous structures. The increase in surface area directly contributes to the availability of a greater number of active sites for dye adsorption. Similarly, the average pore size of ET (10.06 nm) is markedly larger than that of EW (4.52 nm), indicating the development of mesoporous channels in ET as a result of the templating effect and subsequent calcination. Larger pore diameters are advantageous for the diffusion of bulky dye molecules such as rhodamine B, reducing steric hindrance and enhancing adsorption kinetics. In terms of total pore volume, ET also demonstrates a superior value (0.3812 cm3/g) compared with EW (0.1162 cm3/g), further confirming its improved porosity and structural openness. This combination of higher surface area, larger pores, and greater pore volume explains the enhanced adsorption capacity and faster equilibrium rate observed for ET in the batch adsorption experiments.

3. Experimental Methodology

3.1. Materials

All chemicals used in this study were of analytical grade and were utilized without further purification. Aluminum nitrate nonahydrate (Al(NO3)3·9H2O), sodium metasilicate pentahydrate (Na2SiO3·5H2O), nickel nitrate hexahydrate (Ni(NO3)3·6H2O), sodium hydroxide (NaOH), polyethylene glycol 400 (H(OCH2CH2)nOH), potassium chloride (KCl), and hydrochloric acid (HCl) were all purchased from Sigma-Aldrich. Rhodamine B dye (C28H31ClN2O3) was also obtained from Sigma-Aldrich and was used as the model pollutant in the adsorption experiments.

3.2. Synthesis of Analcime@Nickel Orthosilicate Nanocomposites

The analcime@nickel orthosilicate nanocomposites were synthesized through a hydrothermal method. Initially, 20 g of Na2SiO3·5H2O was dissolved in 50 mL of distilled water. In a separate beaker, 6 g of Al(NO3)3·9H2O and 6 g of Ni(NO3)3·6H2O were dissolved in 50 mL of distilled water. The sodium metasilicate solution was then gradually added to the nitrate solution under continuous stirring for 30 min. Following this, 10 mL of polyethylene glycol 400 was introduced into the mixture and stirred for an additional 30 min. The resulting mixture was transferred into a 150 mL Teflon-lined stainless-steel autoclave and subjected to hydrothermal treatment at 180 °C for 12 h. After cooling to room temperature, the formed precipitate was separated by filtration, washed with distilled water to remove residual impurities, dried at 60 °C, and subsequently calcined at 600 °C for 5 h to obtain the analcime@nickel orthosilicate nanocomposite (ET). To synthesize the analcime@nickel orthosilicate nanocomposite (EW), the same procedure was repeated in the absence of polyethylene glycol 400, where 10 mL of distilled water was used instead. Figure 15 illustrates the synthesis process of the analcime@nickel orthosilicate nanocomposites.
The amounts of Al(NO3)3·9H2O, Ni(NO3)2·6H2O, and Na2SiO3·5H2O (6 g, 6 g, and 20 g, respectively) were selected to provide a molar ratio of Al3+:Ni2+:Si4+ = 1.0:1.29:5.89, ensuring sufficient silicon availability for the formation of both analcime and nickel orthosilicate.

3.3. Instrumentation

The structural properties of all synthesized nanocomposites were analyzed by using an X-ray diffraction diffractometer (D8 Discover, Bruker, Billerica, MA, USA). The surface morphology and elemental composition of all synthesized nanocomposites were examined by using a field-emission scanning electron microscope equipped with energy-dispersive X-ray spectroscopy (FE-SEM/EDX Quanta 250 FEG, Thermo Fisher Scientific, Waltham, MA, USA). The concentration of rhodamine B dye in solution was determined by using an ultraviolet–visible (UV–Vis) spectrophotometer (Cintra 3030, GBC, Keysborough, Australia). The surface textures of the EW and ET nanocomposites were obtained by utilizing a N2 gas analyzer (NOVA2000 series, Quantachrome, Boynton Beach, FL, USA). High-resolution transmission electron microscopy (HR-TEM), performed with a JEM-2100Plus microscope (JEOL Ltd., Tokyo, Japan), provided detailed insights into the morphology of the synthesized nanocomposites.

3.4. Procedure of Rhodamine B Dye Adsorption from Aqueous Solutions

The adsorption of rhodamine B dye onto EW and ET nanocomposites was investigated by evaluating the effects of solution pH, contact time, temperature, and initial dye concentration, as shown in Table 7. All adsorption experiments were conducted under continuous stirring using a magnetic stirrer. To study the effect of pH, 0.1 L of rhodamine B dye solution at an initial concentration of 150 mg/L was prepared, and 50 mg of the adsorbent was added. The adsorption experiments were performed at 298 K for 240 min, while the solution pH was adjusted in the range of 2 to 10 by using either hydrochloric acid or sodium hydroxide. The influence of contact time was examined by adding 50 mg of the adsorbent to 0.1 L of rhodamine B dye solution with an initial concentration of 150 mg/L at pH 10. The adsorption process was conducted at 298 K with varying contact times ranging from 10 to 100 min. The effect of temperature on adsorption was analyzed by adding 50 mg of the adsorbent to 0.1 L of rhodamine B dye solution with an initial concentration of 150 mg/L at pH 10. The adsorption experiments were carried out at different temperatures between 298 K and 328 K. The equilibrium time was set to 50 min for ET and 70 min for EW. The influence of initial dye concentration was investigated by varying the concentration of rhodamine B dye between 50 and 300 mg/L while maintaining a solution volume of 0.1 L at pH 10 and the amount of adsorbent of 50 mg. The adsorption experiments were conducted at 298 K with an equilibrium time of 50 min for ET and 70 min for EW. After the adsorption process, the adsorbent was separated by using a centrifuge, and the concentration of rhodamine B dye in the filtrate was measured by using a UV–Vis spectrophotometer at 556 nm.

3.5. pHPZC of Analcime@Nickel Orthosilicate Nanocomposites

The pHPZC of EW and ET nanocomposites was determined by using the batch adsorption method with potassium chloride (KCl) as the supporting electrolyte. A series of 50 mL KCl solutions (0.01 M) were prepared, and their initial pH (pHI) was adjusted in the range of 2 to 12 by using either hydrochloric acid or sodium hydroxide. A fixed amount of 100 mg of the nanocomposite was added to each solution, and the mixtures were continuously stirred for 24 h at room temperature to ensure equilibrium. After equilibrium was reached, the final pH (pHF) of each solution was measured. The difference between the final and initial pH values (ΔpH) was calculated by using Equation (11) [34].
ΔpH = pHF − pHI
The pHPZC was determined by plotting ΔpH versus pHI, where the point at which ΔpH = 0 corresponds to the pHPZC of the nanocomposite.

4. Conclusions

This study successfully synthesized analcime@nickel orthosilicate nanocomposites (EW and ET) through the hydrothermal method, demonstrating their efficiency in the removal of rhodamine B dye from aqueous solutions. XRD analysis confirmed the formation of analcime (NaAlSi2O6) and nickel orthosilicate (Ni2SiO4) phases, with ET exhibiting a smaller crystallite size (63.60 nm) compared with EW (72.93 nm) due to the templating effect of polyethylene glycol 400. EDX analysis confirmed the presence of oxygen, sodium, aluminum, silicon, and nickel, with slight variations in elemental composition between EW and ET due to the impact of the templating and calcination process. FE-SEM analysis revealed that ET exhibited spherical nanoparticles, while EW displayed a more irregular morphology, further confirming the influence of polyethylene glycol 400 on particle formation. The adsorption mechanism involved ion exchange via the analcime phase, where sodium ions were replaced by rhodamine B cations, and electrostatic attraction via nickel orthosilicate, where negatively charged sites interacted with the positively charged rhodamine B dye molecules. Adsorption kinetics followed the pseudo-second-order model, indicating chemisorption as the dominant process, while isotherm analysis confirmed that adsorption was best described by the Langmuir model, suggesting a monolayer adsorption mechanism. The maximum adsorption capacities were 174.83 mg/g for EW and 210.53 mg/g for ET. Thermodynamic analysis revealed that the adsorption process was exothermic (ΔH < 0) and spontaneous (ΔG < 0), with a positive entropy change (ΔS > 0) indicating increased randomness during adsorption. The superior adsorption performance of ET compared with EW was attributed to the template-assisted synthesis, which enhanced the structural properties and increased the number of active adsorption sites. These findings demonstrate that analcime@nickel orthosilicate nanocomposites are highly effective adsorbents for rhodamine B removal and have strong potential for wastewater treatment applications.

Author Contributions

E.A.A. (methodology, funding acquisition, conceptualization, and writing—review and editing), F.A.S. (writing—review and editing), M.M.A.-K. (conceptualization and writing—review and editing), A.M.K. (methodology and writing—review and editing), Z.A. (visualization, conceptualization, and writing—review and editing). All authors have read and agreed to the published version of the manuscript.

Funding

This work was supported and funded by the Deanship of Scientific Research at Imam Mohammad Ibn Saud Islamic University (IMSIU) (grant number IMSIU-DDRSP2502).

Institutional Review Board Statement

Not applicable.

Informed Consent Statement

Not applicable.

Data Availability Statement

All data generated or analyzed during this study are included in this published article.

Acknowledgments

This work was supported and funded by the Deanship of Scientific Research at Imam Mohammad Ibn Saud Islamic University (IMSIU) (grant number IMSIU-DDRSP2502).

Conflicts of Interest

The authors declare no conflicts of interest.

References

  1. Gadore, V.; Mishra, S.R.; Yadav, N.; Yadav, G.; Ahmaruzzaman, M. Advances in Zeolite-Based Materials for Dye Removal: Current Trends and Future Prospects. Inorg. Chem. Commun. 2024, 166, 112606. [Google Scholar] [CrossRef]
  2. Pattanayak, D.S.; Surana, M.; Kumar, A.; Singh, D.; Pal, D. Graphitic Carbon Nitride(g-C3N4)-Based Photocatalysts for Dye Removal: Current Status. Sustain. Chem. Environ. 2024, 7, 100141. [Google Scholar] [CrossRef]
  3. Fattahi, N.; Fattahi, T.; Kashif, M.; Ramazani, A.; Jung, W.K. Lignin: A Valuable and Promising Bio-Based Absorbent for Dye Removal Applications. Int. J. Biol. Macromol. 2024, 276, 133763. [Google Scholar] [CrossRef]
  4. Lee, S.Y.; Tan, Y.H.; Lau, S.Y.; Mubarak, N.M.; Tan, Y.Y.; Tan, I.S.; Lee, Y.H.; Ibrahim, M.L.; Karri, R.R.; Khalid, M.; et al. A State-of-the-Art Review of Metal Oxide Nanoflowers for Wastewater Treatment: Dye Removal. Environ. Res. 2024, 259, 119448. [Google Scholar] [CrossRef] [PubMed]
  5. Dada, A.O.; Inyinbor, A.A.; Atunwa, B.T.; Gonuguntla, S.; Bello, O.S.; Adekola, F.A.; Pal, U. Agrowaste-Carbon and Carbon-Based Nanocomposites for Endocrine Disruptive Cationic Dyes Removal: A Critical Review. Biotechnol. Rep. 2024, 44, e00860. [Google Scholar] [CrossRef] [PubMed]
  6. Deivayanai, V.C.; Karishma, S.; Thamarai, P.; Saravanan, A.; Yaashikaa, P.R. Efficient Red Azo Dye Removal from Wastewater Using Magnetic Nanoparticle Impregnated Prosopis Juliflora Biomass: ANN Modeling Approach. Desalin. Water Treat. 2024, 320, 100746. [Google Scholar] [CrossRef]
  7. Loura, N.; Rathee, K.; Dhull, R.; Singh, M.; Dhull, V. Carbon Nanotubes for Dye Removal: A Comprehensive Study of Batch and Fixed-Bed Adsorption, Toxicity, and Functionalization Approaches. J. Water Process Eng. 2024, 67, 106193. [Google Scholar] [CrossRef]
  8. Kayani, K.F. Bimetallic Metal-Organic Frameworks (BMOFs) for Dye Removal: A Review. RSC Adv. 2024, 14, 31777–31796. [Google Scholar] [CrossRef]
  9. Amalina, F.; Abd Razak, A.S.; Krishnan, S.; Zularisam, A.W.; Nasrullah, M. A Review of Eco-Sustainable Techniques for the Removal of Rhodamine B Dye Utilizing Biomass Residue Adsorbents. Phys. Chem. Earth 2022, 128, 103267. [Google Scholar] [CrossRef]
  10. Ta, M.; An, Y.; Yang, H.; Bai, C.; Wang, T.; Zhang, T.; Cai, H.; Zheng, H. Attraction Behavior Induces the Aggregation and Precipitation of Organic Dyes: Improving Efficiency through Co-Treatment Strategy. J. Mol. Liq. 2024, 415, 126331. [Google Scholar] [CrossRef]
  11. Amanda, S.; Amanda, T.; Rifqah, N.; Eka, S.; Putra, M.; Khairurrijal, K.; Arif, M.F.; Taher, T.; Rianjanu, A. Complex Mixture Dye Removal Using Natural Zeolite Modified Polyacrylonitrile/Polyvinylidene Fluoride (Ze-PAN/PVDF) Composite Nanofiber Membrane via Vacuum Filtration Technique. Mater. Today Commun. 2025, 42, 111357. [Google Scholar] [CrossRef]
  12. Cui, F.; Hua, D.; Cheng, X.; Luo, C.; He, J.; Zhou, Y.; Wen, X.; Zhan, G. Design of Ternary GO@AgNPs@g-C3N4 Membranes for Efficient Dye Removals in Integrated Photocatalysis-Filtration Reactors. Sep. Purif. Technol. 2025, 356, 129930. [Google Scholar] [CrossRef]
  13. Lima, A.M.; de Oliveira, A.M.; de Sousa, T.G.; Pereira, A.C.; de Carvalho, R.B.; Pinheiro, W.A. Filtration Membranes of Reduced Graphene Oxide for Dye Removal—Production and Characterization. Desalin. Water Treat. 2022, 278, 217–225. [Google Scholar] [CrossRef]
  14. Sugha, A.; Bhatti, M.S. Optimization of Electrocoagulation Removal of a Mixture of Three Azo Dyes: Spectrophotometric Colour Characteristics for Best Operating Conditions. RSC Adv. 2025, 15, 6492–6505. [Google Scholar] [CrossRef]
  15. Huang, X.; Zeng, Y.; Fu, H.; Zhong, L.; Qi, B.; Chen, D.; Yu, J.; Zhang, P.; Lee, S.S. Simultaneous Removal of Phosphorus, Chromium (VI), and Antimony (V) from Textile Dye Wastewater by Electrocoagulation. J. Hazard. Mater. 2025, 488, 137409. [Google Scholar] [CrossRef]
  16. Pratap Singh, V.; Godara, P.; Srivastava, A. Sustainable Microalgal Bioremediation of Heavy Metals and Dyes from Synthetic Wastewater: Progressing towards United Nations Sustainable Development Goals. Waste Manag. Bull. 2024, 2, 123–135. [Google Scholar] [CrossRef]
  17. Goswami, D.; Mukherjee, J.; Mondal, C.; Bhunia, B. Bioremediation of Azo Dye: A Review on Strategies, Toxicity Assessment, Mechanisms, Bottlenecks and Prospects. Sci. Total Environ. 2024, 954, 176426. [Google Scholar] [CrossRef]
  18. Ikhlaq, A.; Raashid, M.; Akram, A.; Kazmi, M.; Farman, S. Removal of Methylene Blue Dye from Aqueous Solutions by Adsorption in Combination with Ozonation on Iron Loaded Sodium Zeolite: Role of Adsorption. Desalin. Water Treat. 2021, 237, 302–306. [Google Scholar] [CrossRef]
  19. Al-Hazmi, G.H.; Refat, M.S.; El-Desouky, M.G.; El-Bindary, A.A. Effective Adsorption and Removal of Industrial Dye from Aqueous Solution Using Mesoporous Zinc Oxide Nanoparticles via Metal Organic Frame Work: Equilibrium, Kinetics and Thermodynamic Studies. Desalin. Water Treat. 2022, 272, 277–289. [Google Scholar] [CrossRef]
  20. Ahmad, A.; Khan, Z.U.H.; Sabahat, S.; Sun, J.; Shah, N.S.; Khan, Z.U.; Muhammad, N.; Mir, S.; Rahim, A.; Nadeem, M.; et al. Innovations in Metal Oxides-Biochar Nanoparticles for Dye Removal. Nano-Struct. Nano-Objects 2024, 39, 101269. [Google Scholar] [CrossRef]
  21. Luo, B.; Zhang, M.; Zhou, N.; Fu, Y.; Ma, X.; Dai, C. Mechanism Study of a Novel Modified Mesoporous Silicon-Based NiT50/MCM-41 Adsorbent for the Selective Adsorption of Methylene Blue from Water. RSC Adv. 2025, 15, 5737–5749. [Google Scholar] [CrossRef] [PubMed]
  22. Kamali, A.R.; Zhu, W.; Shi, Z.; Wang, D. Combustion Synthesis-Aqueous Hybridization of Nanostructured Graphene-Coated Silicon and Its Dye Removal Performance. Mater. Chem. Phys. 2022, 277, 125565. [Google Scholar] [CrossRef]
  23. Jia, Z.; Han, C.; Wu, L.; Zhang, D.; Li, M. Biotemplated Synthesis of Hollow Nickel Silicate Fiber for Organic Dye Contaminants and Its Selective Adsorption. Colloids Surf. A Physicochem. Eng. Asp. 2022, 648, 129219. [Google Scholar] [CrossRef]
  24. Chen, C.; Ma, J.; Yi, Z.; Wang, S.; Gao, H.; Wang, Y.; Yang, H. Highly-Efficient and Recyclable Bi2O2CO3 Adsorbent Achieved by Surfactant Modification and Its Application in Pollutant Removal. Mater. Res. Bull. 2023, 159, 112091. [Google Scholar] [CrossRef]
  25. Ritter, M.T.; Lobo-Recio, M.Á.; Padilla, I.; Nagel-Hassemer, M.E.; Romero, M.; López-Delgado, A. Adsorption of Safranine-T Dye Using a Waste-Based Zeolite: Optimization, Kinetic and Isothermal Study. J. Ind. Eng. Chem. 2024, 136, 177–187. [Google Scholar] [CrossRef]
  26. Panic, V.V.; Velickovic, S.J. Removal of Model Cationic Dye by Adsorption onto Poly(Methacrylic Acid)/Zeolite Hydrogel Composites: Kinetics, Equilibrium Study and Image Analysis. Sep. Purif. Technol. 2014, 122, 384–394. [Google Scholar] [CrossRef]
  27. Rianjanu, A.; Taher, T.; Desriani, F.; Delmita, R.O.; Sianturi, A.G.N.; Amanda, S.; Ariwahjoedi, B.; Istiqomah, N.; Rastri, D.; Arif, M.F. Examining the Influence of Sintering Temperatures on the Efficiency of 3D-Printed Natural Zeolite for Methylene Blue Dye Adsorption. Results Surf. Interfaces 2024, 17, 100337. [Google Scholar] [CrossRef]
  28. Chumee, J.; Javadi, B.; Peungsamran, N.; Kumpun, S.; Seekakee, J.; Hoonsuwan, T.; Ohama, P. Synthesis of Zeolite P-Metal Organic Composite Beads for Superior Cationic Dye Removal. Inorg. Chem. Commun. 2025, 177, 114344. [Google Scholar] [CrossRef]
  29. Zhao, W.; Wu, X.; Xu, W.; Xing, H.; Zhai, N. Porous Analcime Composite Synthesized from Solid Waste: A Cost-Effective and Superb Adsorbent for Efficient Removal of Cu(II) and Cationic Dye. Chem. Eng. Res. Des. 2023, 189, 474–484. [Google Scholar] [CrossRef]
  30. Kishore, K.; Kaur, J.; Saddeek, Y.B.; Sharma, M.; Singh, M.; Thakur, P.; Walia, Y.K.; Lal, M.; Suman, R.; Reddy, A.S.; et al. Efficient Removal of Toxic Dyes from Water Using Mn3O4 Nanoparticles: Synthesis, Characterization, and Adsorption Mechanisms. J. Mol. Struct. 2025, 1333, 141756. [Google Scholar] [CrossRef]
  31. Ouachtak, H.; El Haouti, R.; El Guerdaoui, A.; Haounati, R.; Amaterz, E.; Addi, A.A.; Akbal, F.; Taha, M.L. Experimental and Molecular Dynamics Simulation Study on the Adsorption of Rhodamine B Dye on Magnetic Montmorillonite Composite γ-Fe2O3@Mt. J. Mol. Liq. 2020, 309, 113142. [Google Scholar] [CrossRef]
  32. Rubab, R.; Ali, S.; Rehman, A.U.; Khan, S.A.; Khan, A.M. Templated Synthesis of NiO/SiO2 Nanocomposite for Dye Removal Applications: Adsorption Kinetics and Thermodynamic Properties. Colloids Surf. A Physicochem. Eng. Asp. 2021, 615, 126253. [Google Scholar] [CrossRef]
  33. Duan, Y.; Sun, S.Y.; Zhao, J.; Yuan, H. Microplastics Affect the Removal of Dye in Textile Wastewater: Adsorption Capacity and Its Effect on Coagulation Behavior. Sep. Purif. Technol. 2025, 359, 130505. [Google Scholar] [CrossRef]
  34. Al-Kadhi, N.S.; Abdelrahman, E.A.; Alamro, F.S.; Saad, F.A.; Al-Raimi, D.S. Innovative nanocomposite comprising of ZrO2, MnCO3, and CdCO3 for superior crystal violet dye adsorption: Synthesis, characterization, and regeneration insights. Sci Rep. 2025, 15, 5525. [Google Scholar] [CrossRef]
  35. Fathi, A.G.; Abdelrahman, E.A.; Abou-Krisha, M.M.; Shah, R.; Saad, F.A.; El Rayes, S.M. Facile Synthesis of Novel Nanocomposite Consists of β-FeOOH, Chitosan, and Salicylaldehyde for Efficient Removal of Zn (II) Ions from Aqueous Media. J. Inorg. Organomet. Polym. Mater. 2025, in press. [Google Scholar] [CrossRef]
  36. Saheed, I.O.; Zairuddin, N.I.; Nizar, S.A.; Hanafiah, M.A.K.M.; Latip, A.F.A.; Suah, F.B.M. Adsorption Potential of CuO-Embedded Chitosan Bead for the Removal of Acid Blue 25 Dye. Ain Shams Eng. J. 2024, 15, 103125. [Google Scholar] [CrossRef]
  37. Behera, A.K.; Shadangi, K.P.; Sarangi, P.K. Efficient Removal of Rhodamine B Dye Using Biochar as an Adsorbent: Study the Performance, Kinetics, Thermodynamics, Adsorption Isotherms and Its Reusability. Chemosphere 2024, 354, 141702. [Google Scholar] [CrossRef]
  38. Venkatesan, A.; Srividhya, B.; Alajmi, A.; Sadeq, A.M.; Chava, R.K.; Habila, M.A.; Senthil Kumar, D.; Guganathan, L.; Ragupathy, S. High Adsorption Capacities of Rhodamine B Dye by Activated Carbon Synthesized from Cotton Stalks Agricultural Waste by Chemical Activation. Ceram. Int. 2025, in press. [Google Scholar] [CrossRef]
  39. Damasceno, B.S.; da Silva, V.C.; Rodrigues, A.R.; Falcão, E.H.L.; Vaz de Araújo, A.C. Use of Magnetic Nanoparticles of Iron Oxide and Their Derivatives in the Adsorption of Rhodamine 6G and Rhodamine B Dyes. J. Alloys Compd. 2024, 1005, 175907. [Google Scholar] [CrossRef]
  40. Jinendra, U.; Bilehal, D.; Nagabhushana, B.M.; Kumar, A.P. Adsorptive Removal of Rhodamine B Dye from Aqueous Solution by Using Graphene—Based Nickel Nanocomposite. Heliyon 2021, 7, e06851. [Google Scholar] [CrossRef]
  41. Konicki, W.; Siber, D.; Narkiewicz, U. Removal of Rhodamine B from Aqueous Solution by ZnFe2O4 Nanocomposite with Magnetic Separation Performance. Pol. J. Chem. Technol. 2017, 19, 65–74. [Google Scholar] [CrossRef]
  42. Alwan, S.H.; Alshamsi, H.A.H.; Jasim, L.S. Rhodamine B Removal on A-RGO/Cobalt Oxide Nanoparticles Composite by Adsorption from Contaminated Water. J. Mol. Struct. 2018, 1161, 356–365. [Google Scholar] [CrossRef]
  43. El-Shafey, S.S.; Sayed Ahmed, S.A.; Aboelenin, R.M.; Fathy, N.A. Synthesis of SBA-16 Mesoporous Silica from Rice Husk Ash for Removal of Rhodamine B Cationic Dye: Effect of Hydrothermal Treatment Time. Desalin. Water Treat. 2024, 317, 100179. [Google Scholar] [CrossRef]
  44. Saigl, Z.M.; Aljuaid, O.A. Adsorption of Rhodamine B Dye onto Iodo-Polyurethane Foam: Kinetics and Thermodynamic Study. Desalin. Water Treat. 2023, 315, 227–240. [Google Scholar] [CrossRef]
  45. Yang, S.; Huang, Y.; Zhang, D.; Han, G.; Cao, Y.; Liu, J. Fabrication and Characterization of Dinickel Orthosilicate Nanosheets as High Performance Anode Material for Lithium-Ion Batteries. J. Alloys Compd. 2019, 785, 80–88. [Google Scholar] [CrossRef]
  46. Fotouh, A.E.; Al-Farraj, E.S.; Kotp, Y.H.; El Rayes, S.M.; Elfalleh, W.; Khezami, L. Facile Synthesis of Analcime (NaSi2AlO6·H2O) Nanoparticles Using Polyethylene Glycol 400 as an Organic Template for Effective Removal of Zn(II) and Cd(II) Ions from Aqueous Solutions. Silicon 2024, 16, 2671–2687. [Google Scholar] [CrossRef]
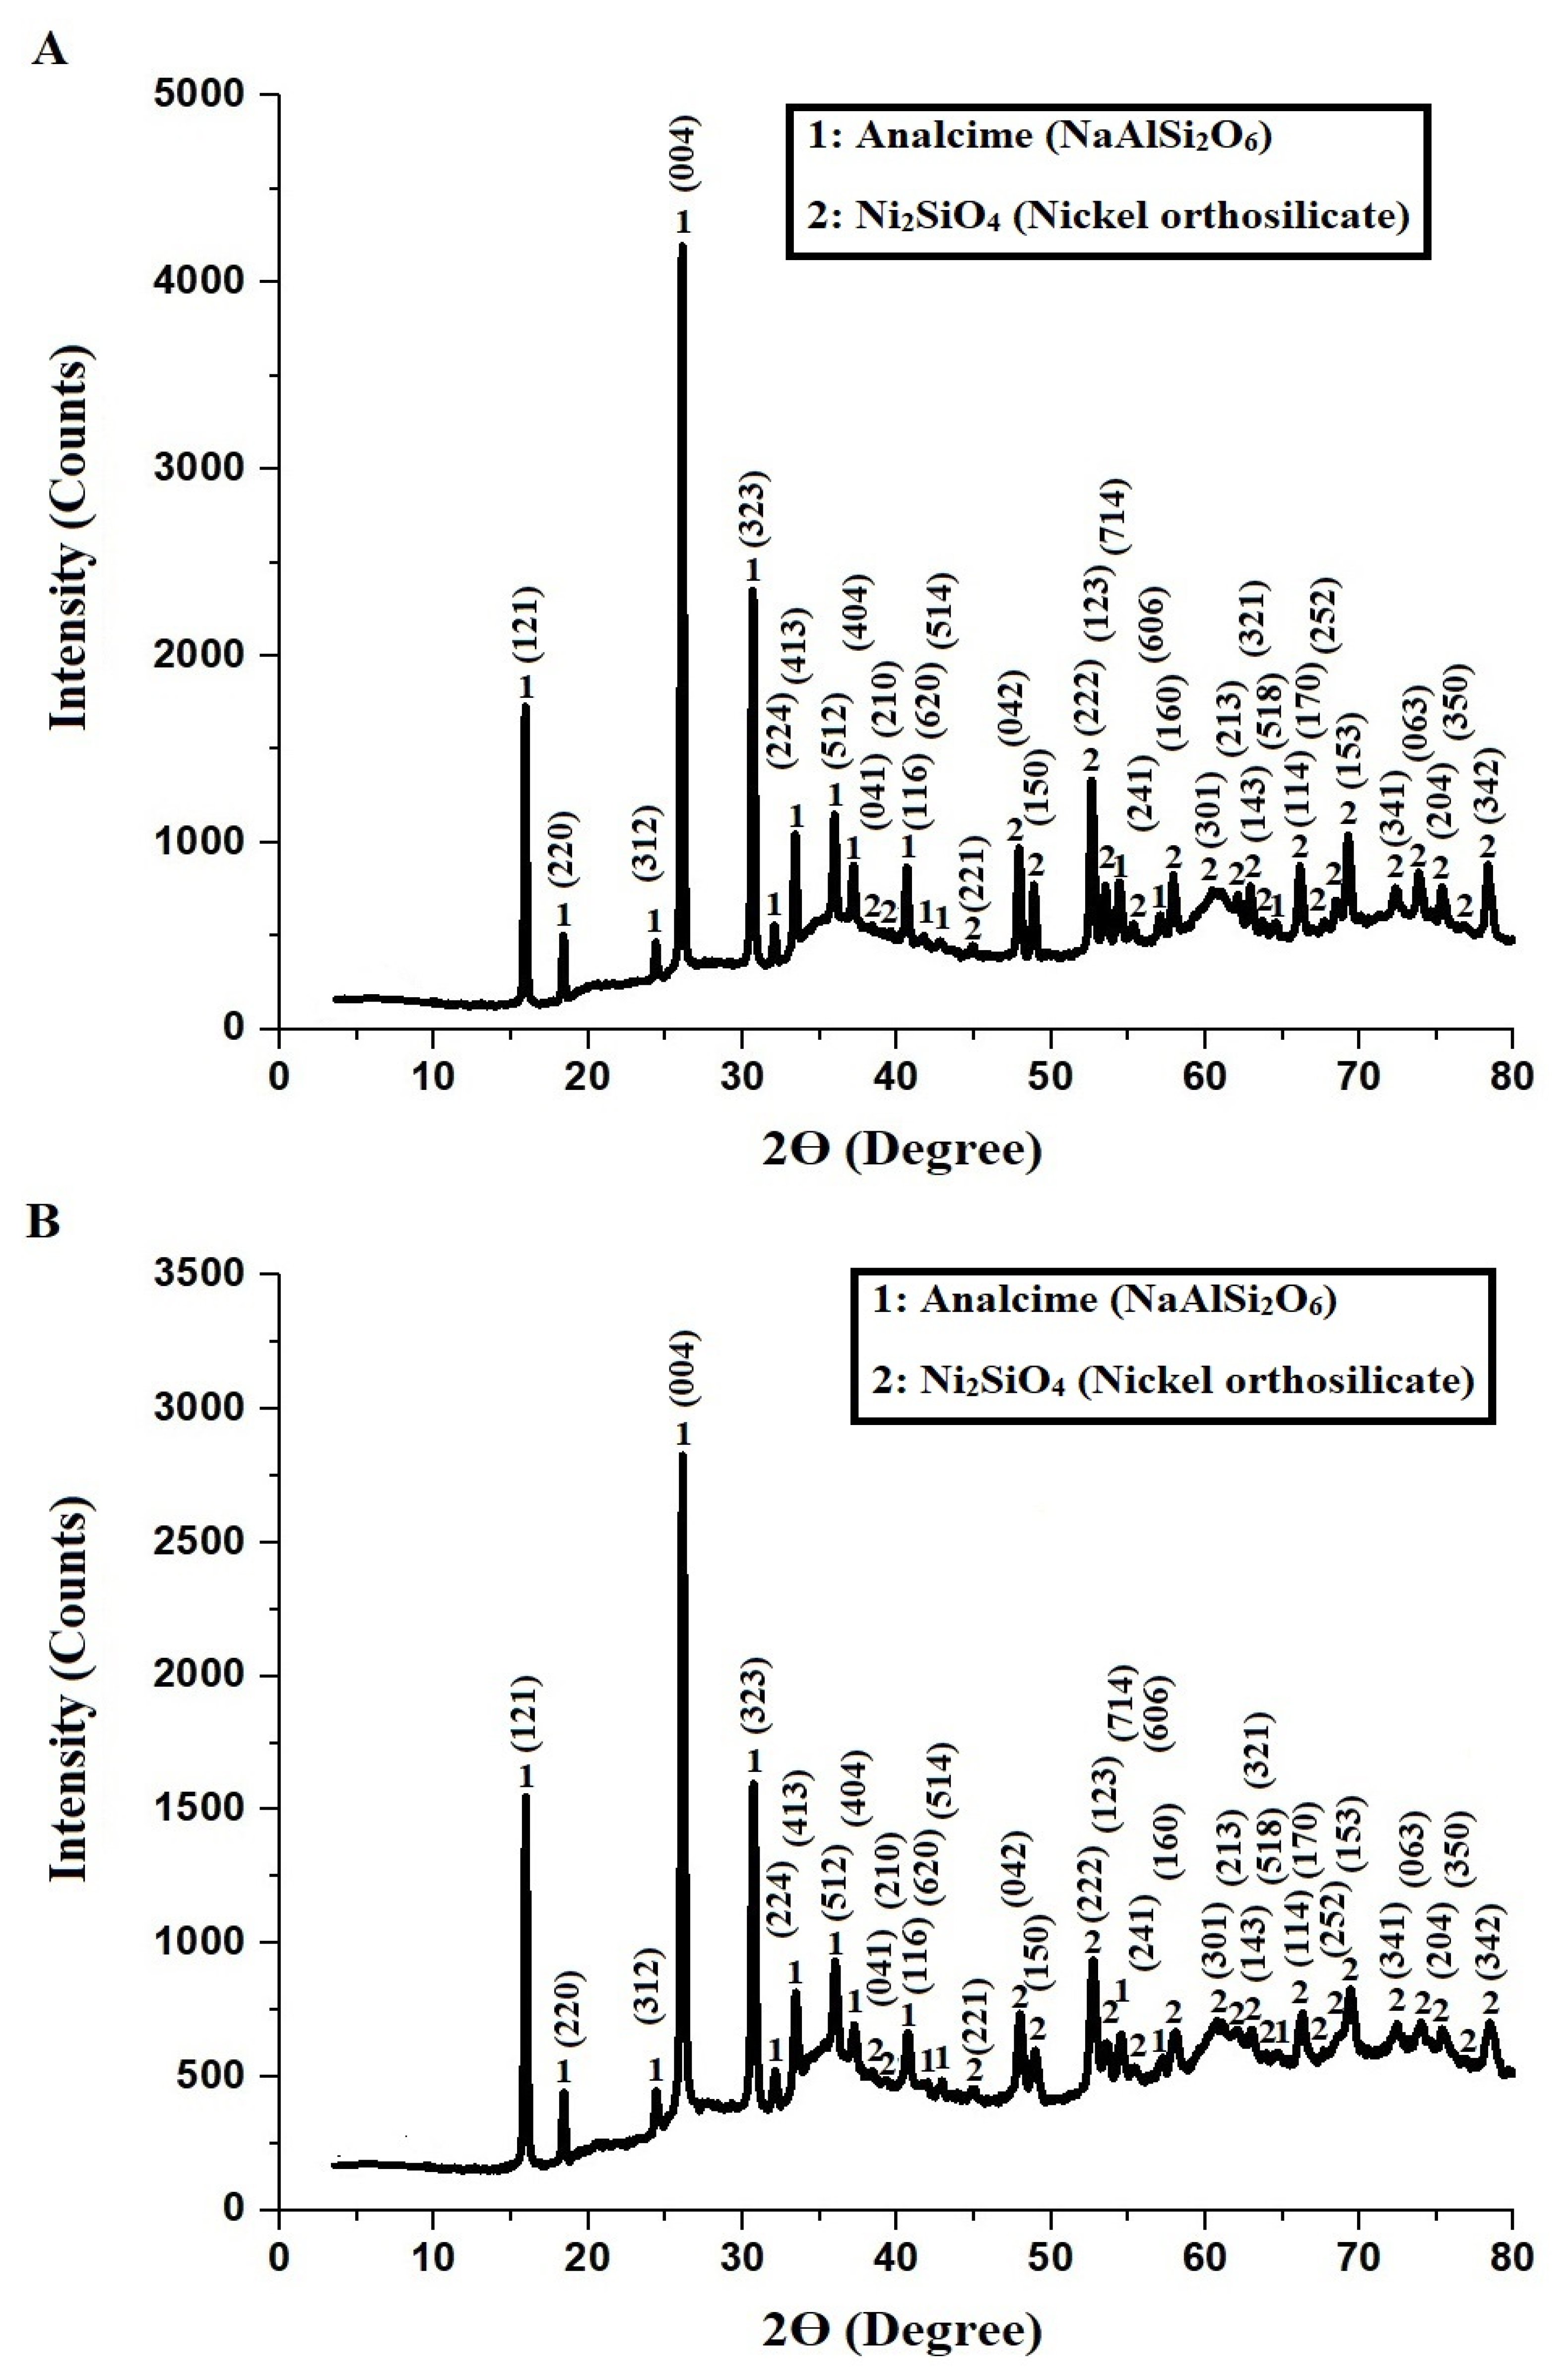
Figure 1. XRD patterns of (A) EW and (B) ET nanocomposites.
Inorganics 13 00120 g001
Figure 2. EDX patterns of (A) EW and (B) ET nanocomposites.
Inorganics 13 00120 g002
Figure 3. FE-SEM images of EW nanocomposite at (A) 10,000× and (B) 40,000×.
Inorganics 13 00120 g003
Figure 4. FE-SEM images of ET nanocomposite at (A) 10,000× and (B) 40,000×.
Inorganics 13 00120 g004
Figure 5. HR-TEM images of (A) EW and (B) ET nanocomposites.
Inorganics 13 00120 g005
Figure 6. Influence of pH on rhodamine B dye removal efficiency (% E) of EW and ET nanocomposites.
Inorganics 13 00120 g006
Figure 7. pHPZC determination for EW and ET nanocomposites.
Inorganics 13 00120 g007
Figure 8. Schematic representation of rhodamine B dye removal mechanism of EW and ET nanocomposites.
Inorganics 13 00120 g008
Figure 9. Time-dependent rhodamine B dye removal efficiency (% E) of EW and ET nanocomposites.
Inorganics 13 00120 g009
Figure 10. Kinetic modeling of rhodamine B dye adsorption onto EW and ET nanocomposites: (A) pseudo-first-order model and (B) pseudo-second-order model.
Inorganics 13 00120 g010
Figure 11. Effect of temperature on rhodamine B dye removal efficiency (% E) of EW and ET nanocomposites.
Inorganics 13 00120 g011
Figure 12. Van’t Hoff plot for adsorption of rhodamine B dye onto EW and ET nanocomposites.
Inorganics 13 00120 g012
Figure 13. Effect of initial concentration of dye on rhodamine B dye removal efficiency (% E) of EW and ET nanocomposites.
Inorganics 13 00120 g013
Figure 14. Isotherm modeling of adsorption of rhodamine B dye onto EW and ET nanocomposites: (A) Langmuir isotherm plot and (B) Freundlich isotherm plot.
Inorganics 13 00120 g014
Figure 15. Schematic representation of synthesis of analcime@nickel orthosilicate nanocomposites using hydrothermal method.
Inorganics 13 00120 g015
Table 1. Atomic percentages of elements in EW and ET nanocomposites as determined by EDS analysis.
SampleAtomic Percentages
% O% Na% Al% Si% NiNa–Al RatioAnalcime–Nickel
Orthosilicate Ratio
EW54.19.46.122.18.31.543:2
ET56.08.25.521.78.61.494:3
Table 2. Kinetic parameters for adsorption of rhodamine B dye onto EW and ET nanocomposites, based on pseudo-first-order and pseudo-second-order models.
SampleQExp
(mg/g)
Pseudo-First-OrderPseudo-Second-Order
K1
(1/min)
R2Qe
(mg/g)
K2
(g/mg·min)
R2Qe
(mg/g)
EW169.520.03820.937729.870.004110.9999168.35
ET206.960.02850.916234.700.002780.9999205.76
Table 3. Thermodynamic parameters for the uptake of rhodamine B dye onto EW and ET nanocomposites.
SampleΔS°
(kJ/mol.K)
ΔH°
(kJ/mol)
ΔG°
(kJ/mol)
298308318328
EW0.1441−45.62−88.55−89.99−91.43−92.87
ET0.1569−50.92−97.70−99.27−100.84−102.41
Table 4. Isotherm parameters of adsorption of rhodamine B dye onto EW and ET nanocomposites based on Langmuir and Freundlich models.
SampleLangmuirFreundlich
Qmax
(mg/g)
R2K3
(L/mg)
K4
(mg/g)(L/mg)1/n
Qmax
(mg/g)
1/nR2
EW174.830.99970.395889.29185.210.13770.6048
ET210.530.99990.9654117.02228.690.12650.6268
Table 5. Comparison of maximum uptake capacities (Qmax) of several adsorbents used in elimination of rhodamine B dye.
AdsorbentQmax
(mg/g)
Ref.
Biochar169.50[37]
Activated carbon144.36[38]
Fe3O4 nanoparticles138.40[39]
CoFe2O4 nanoparticles145.10[39]
Graphene-based nickel nanocomposite65.31[40]
Magnetic ZnFe2O4 nanocomposite9.83[41]
NiO/SiO2 nanocomposite68.00[32]
Co3O4@reduced graphene oxide nanocomposite102.90[42]
SBA-16 mesoporous silica166.70[43]
Iodo-polyurethane foam22.03[44]
EW174.83This study
ET210.53This study
Table 6. Surface textures of EW and ET nanocomposites.
SampleBET Surface Area (m2/g)Average Pore Size (nm)Total Pore Volume (cm3/g)
EW664.520.1162
ET10810.060.3812
Table 7. Experimental parameters for investigating the influences of pH, temperature, contact time, and initial dye concentration on the rhodamine B dye adsorption efficacy of EW and ET nanocomposites.
EffectV (L)Co (mg/L)W (mg)T (K)t (min)pH
pH 0.1150502982402–10
Time 0.11505029810–10010
Temperature0.115050298–32850 (ET)
70 (EW)
10
Concentration of rhodamine B dye0.150–3005029850 (ET)
70 (EW)
10
Disclaimer/Publisher’s Note: The statements, opinions and data contained in all publications are solely those of the individual author(s) and contributor(s) and not of MDPI and/or the editor(s). MDPI and/or the editor(s) disclaim responsibility for any injury to people or property resulting from any ideas, methods, instructions or products referred to in the content.