Abstract
The heteroleptic halogen-substituted Fe3+ complex of formula [FeL2Bipy]Cl, where L is 1-(4-fluoro-phenyl)-3-(4-bromo-phenyl)-propane-1,3-dione and Bipy is 2,2′-bipyridine, was synthesized, and its optic and magnetic properties were studied. Magnetic measurements showed that the complex at high temperatures (T > 75 K) is predominantly in the high-spin (HS) state of Fe3+ ions (S = 5/2, γHS1 = 93%) with a small admixture of low-spin (LS) state (S = 1/2, γLS1 = 7%). At T* ≈ 46 K, a partial spin-crossover transition (SCO, 5/2↔1/2) occurs. This process is accompanied not only by a change in the magnetic state (γHS2 = 76%, γLS2 = 24%), but also by the appearance of AFM interactions (θII = −2.3 K) between neighboring Fe3+ ions. A theoretical model was proposed to describe magnetic susceptibility, χ(T). As a result of the analysis of the ground spin state M(H) at 2.0 K, it was established that the majority of the LS states, as well as part of the HS states of Fe3+ ions (γHS ~ 53%), do not participate in exchange interactions. EPR studies confirmed the presence of HS and LS Fe3+ centers and made it possible to isolate I-type and II-type HS centers, corresponding to strong low-symmetry and weak distorted octahedral fields. SCO was also detected and the temperature dependences of the EPR intensities, I(T), of the HS and LS centers were analyzed.
1. Introduction
β-Diketones are distinctive building blocks for the creation of coordination-based assemblies [1]. Coordination chemistry involving β-diketonate ligands have always been a subject of interest to chemists due to their importance in various fields [2,3]. A large number of studies on the synthesis of metal-containing β-diketonate derivatives can be found among scientific publications. Complexes of this type are potential candidates for application as molecular precursors in chemical vapor deposition (CVD) techniques [4]. Another primary field of interest is the potential application as promising precursors for microelectronic and optical devices [5,6]. Most literature in this field is devoted to the lanthanide-metal derivatives. Their intriguing photoluminescence and catalytic features make them outstanding candidates for the development of a range of energy-efficient emissive materials [7] and promising catalysts in many organic syntheses [8]. The use of 3d- metal ions makes it possible to obtain magnetic complexes in addition to photoactive. There are a number of publications on Fe(II) and Fe(III) clusters containing β-diketonate donors, which can show interesting magnetic behavior; although their share is relatively small. The first references to this type of complexes come from the publication of German scientists who showed the possibility of forming metal complexes by β-diketonates [9]. Subsequent work has dealt with the tautomeric equilibrium of β-diketones, their metal complexation and the protonation constants of Fe(II) and Fe(III) complexes [10]. In the following works, it was established that iron (III) forms mainly 1:1 and 1:3 complexes with acetylacetone and with benzoylacetone in DMF [11]. An attempt to study the spin state of a metal was made by the group of Dr. T.Iyoda at the beginning of the millennium, who reported about dinuclear metal complexes of phenylene-linked bis-diketone ligands [12]. Ferro- and antiferromagnetic interactions were observed in case of dimeric complexes of metals [13]. Due to the fact that iron ion can be in different spin states, low-spin (LS) and high-spin (HS), which interconvert under external influences, such as temperature, magnetic field, light irradiation or ligand modification [14,15,16,17,18], cationic SCO Fe complexes are good candidates for the creation of magnetic systems. Another important characteristic of this type of coordination compound is its process ability in film or by wet lithography, which is a key advantage for its technological applications [19,20,21,22].
The aim of this work was to synthesize a new coordination Fe(III) complex formed by β-diketones and nitrogen-containing heterocycle 2,2′-bipyridine, and explore its optical and magnetic properties. Particular attention is paid to a detailed analysis of the magnetic state by combining two experimental methods (EPR spectroscopy and SQUID magnetometry) to obtain consistent information. This is the first attempt to create fundamentally new objects, which assumes our further development of a number of heteroleptic β-diketonate metal(III) complexes by including not only 3d-, but also lanthanide ions. Thus, the creation of a single molecular platform will allow the development of new heterofunctional dendrimer metal complexes of polydentate N,O-ligands with controlled specified properties.
2. Results and Discussion
2.1. Synthesis of Compounds
β-Diketone F-DK-Br was synthesized by the Claisen condensation reaction [23] in a solution of anhydrous THF at a stoichiometric ratio of reagents 4′-fluoroacetophenone/ethyl 4-bromobenzoate of 1/2. The product was recrystallized from MeOH to obtain a light-yellow powder with a yield of 38%.
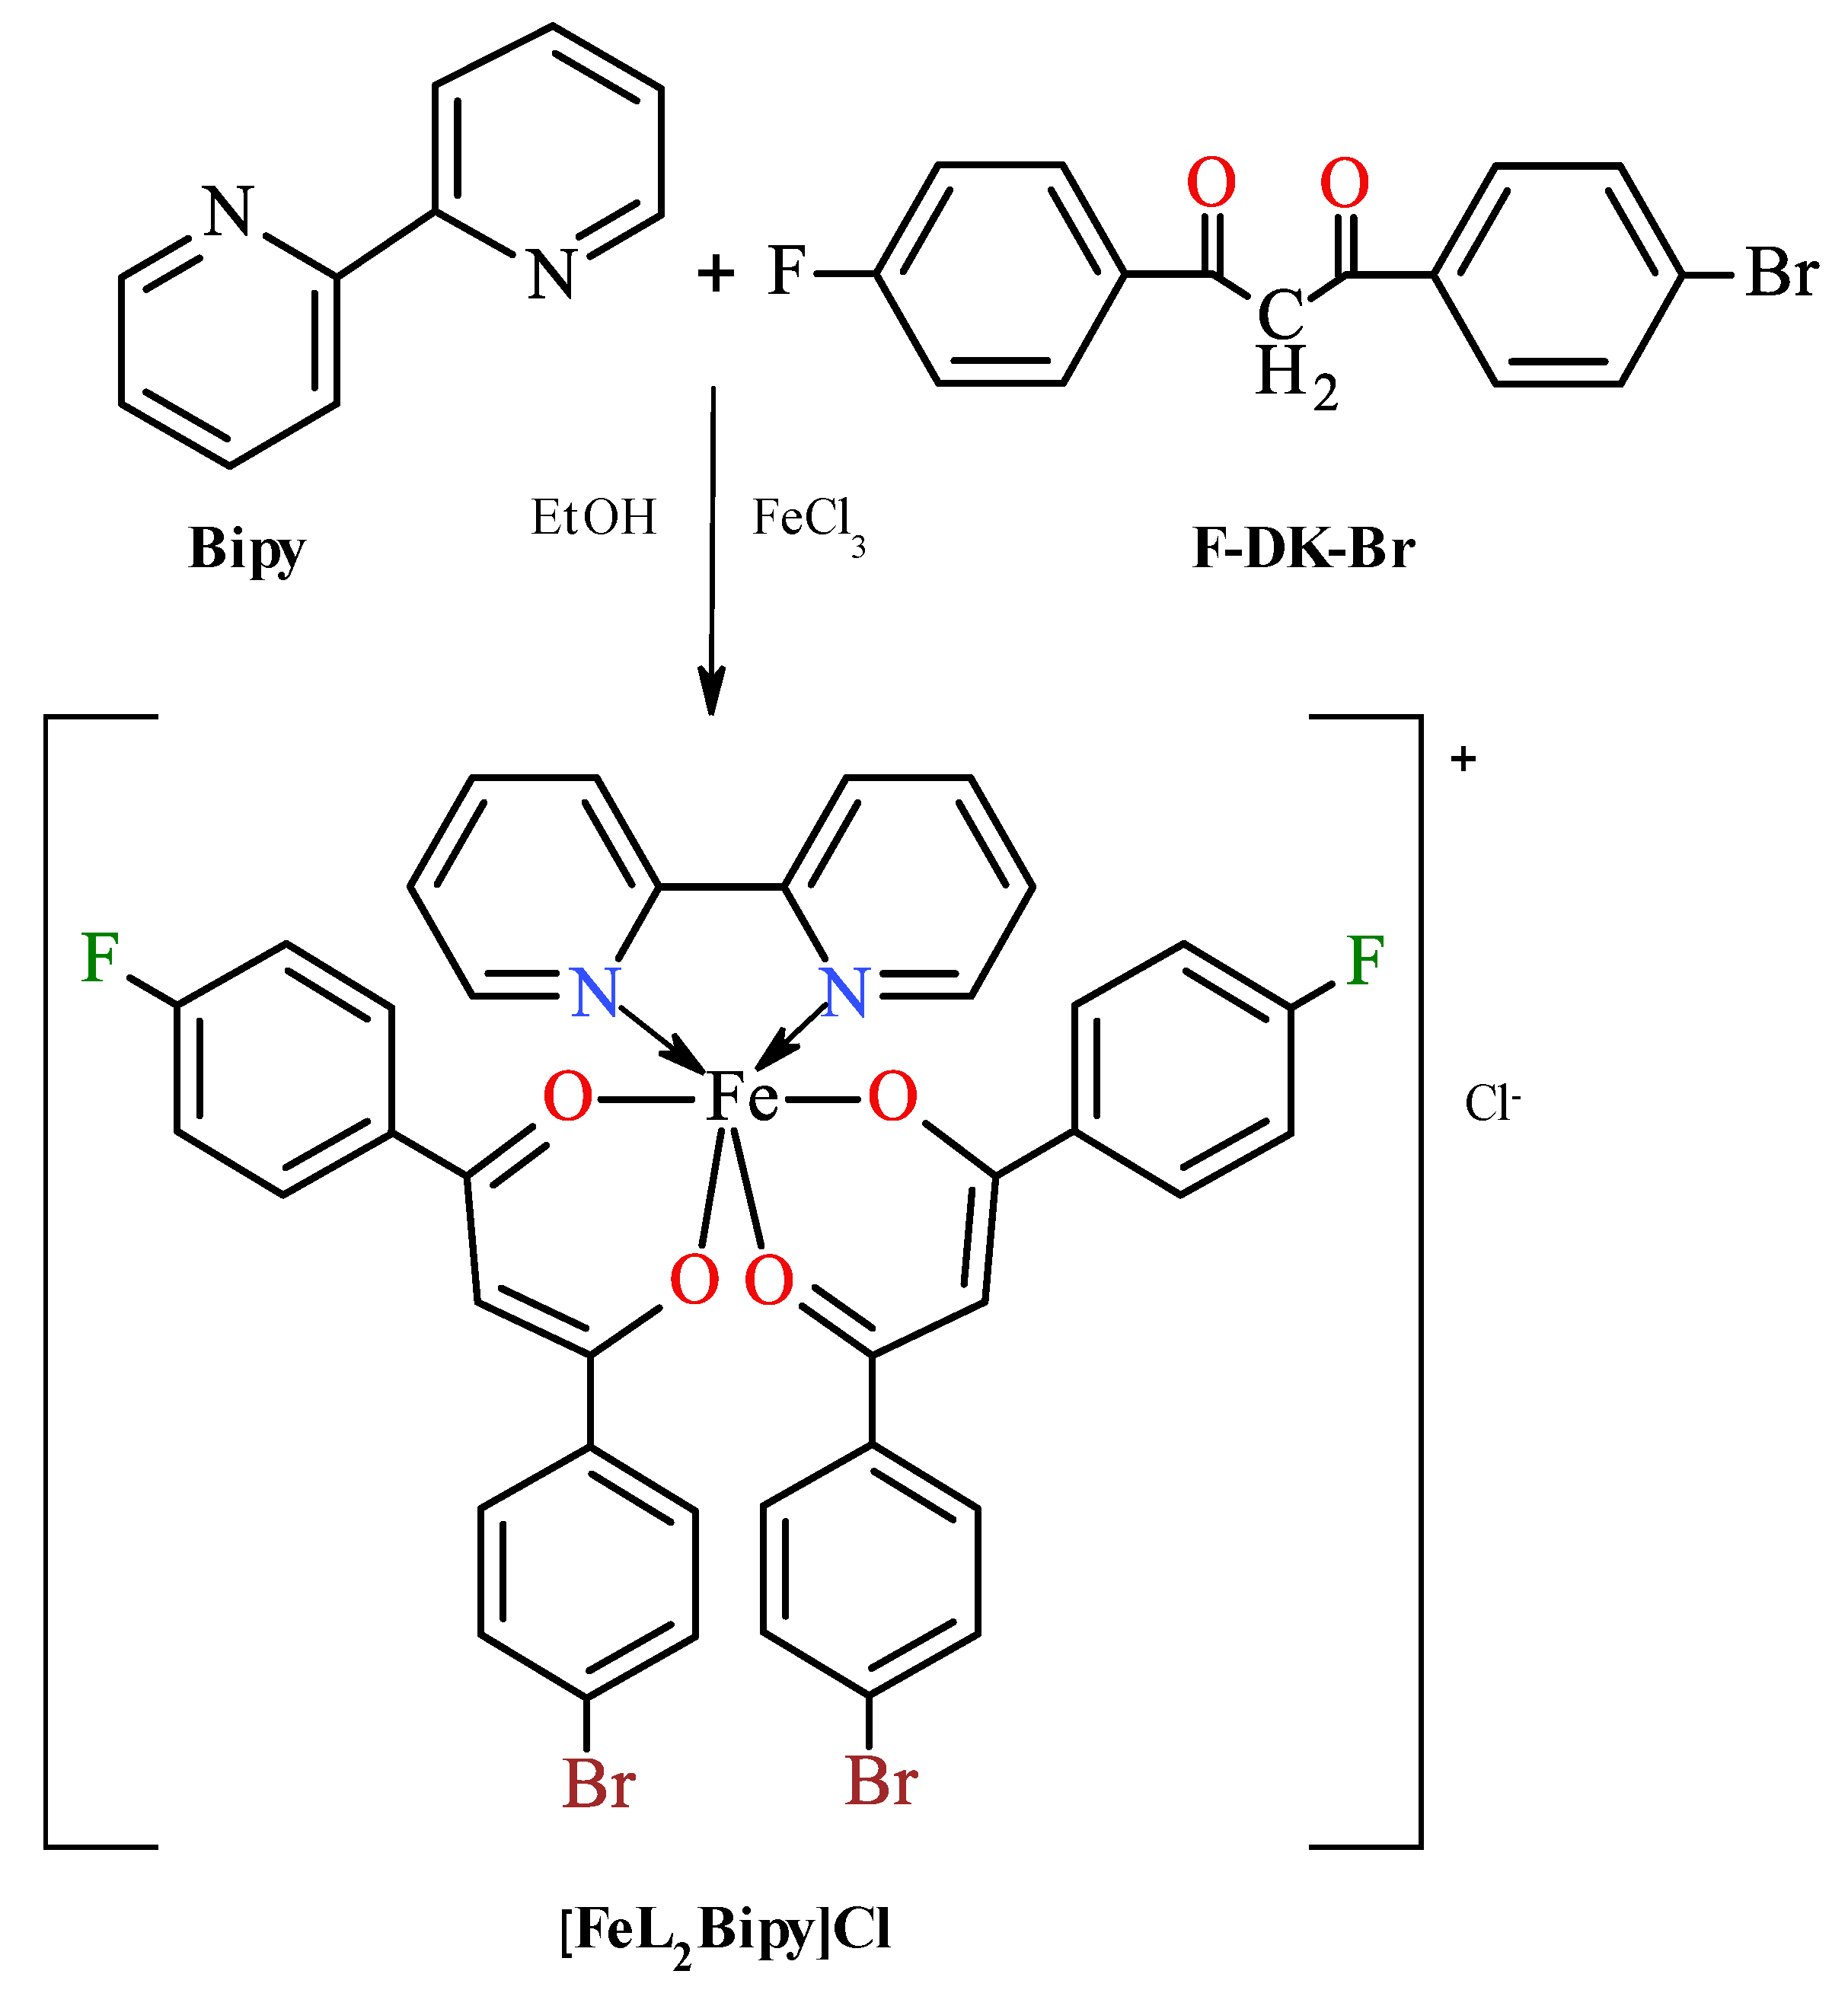
To obtain a complex based on F-DK-Br, Scheme 1, Fe(III) chloride acting as metal salt and 2,2′-bipyridine as a neutral ligand complementing the coordination sphere were used. Nitrogen-containing heterocycles of this type are strong bidentate ligands in which the N atoms are easily coordinated with the metal center, forming very stable complexes [24]. They are used due to their technological properties, such as photoactivity, high charge transfer capacity, bright luminescence and electroactivity, and are necessary for the modification of target complexes along the axial axis in order to improve their chromophoric and electron-optical properties [25].

Scheme 1.
Synthesis of iron(III) bis[1-(4-fluoro-phenyl)-3-(4-bromo-phenyl)propane-1,3-dionate](2,2′-bipyridine) chloride. Although β-diketone derivatives exist in solution in the form equilibrium mixture of enol and keto tautomers [26], for simplicity, only the keto structure is given.
Scheme 1.
Synthesis of iron(III) bis[1-(4-fluoro-phenyl)-3-(4-bromo-phenyl)propane-1,3-dionate](2,2′-bipyridine) chloride. Although β-diketone derivatives exist in solution in the form equilibrium mixture of enol and keto tautomers [26], for simplicity, only the keto structure is given.
2.2. Spectral Characteristics
Spectral characteristics of the [FeL2Bipy]Cl complex and their interpretation are given below. The presence of Fe, Cl and Br ions in the structure of the coordination compound was confirmed by X-ray fluorescence analysis (Figure S1). Based on this, the value of the cationic complex was included in the calculation of the mass spectrum.
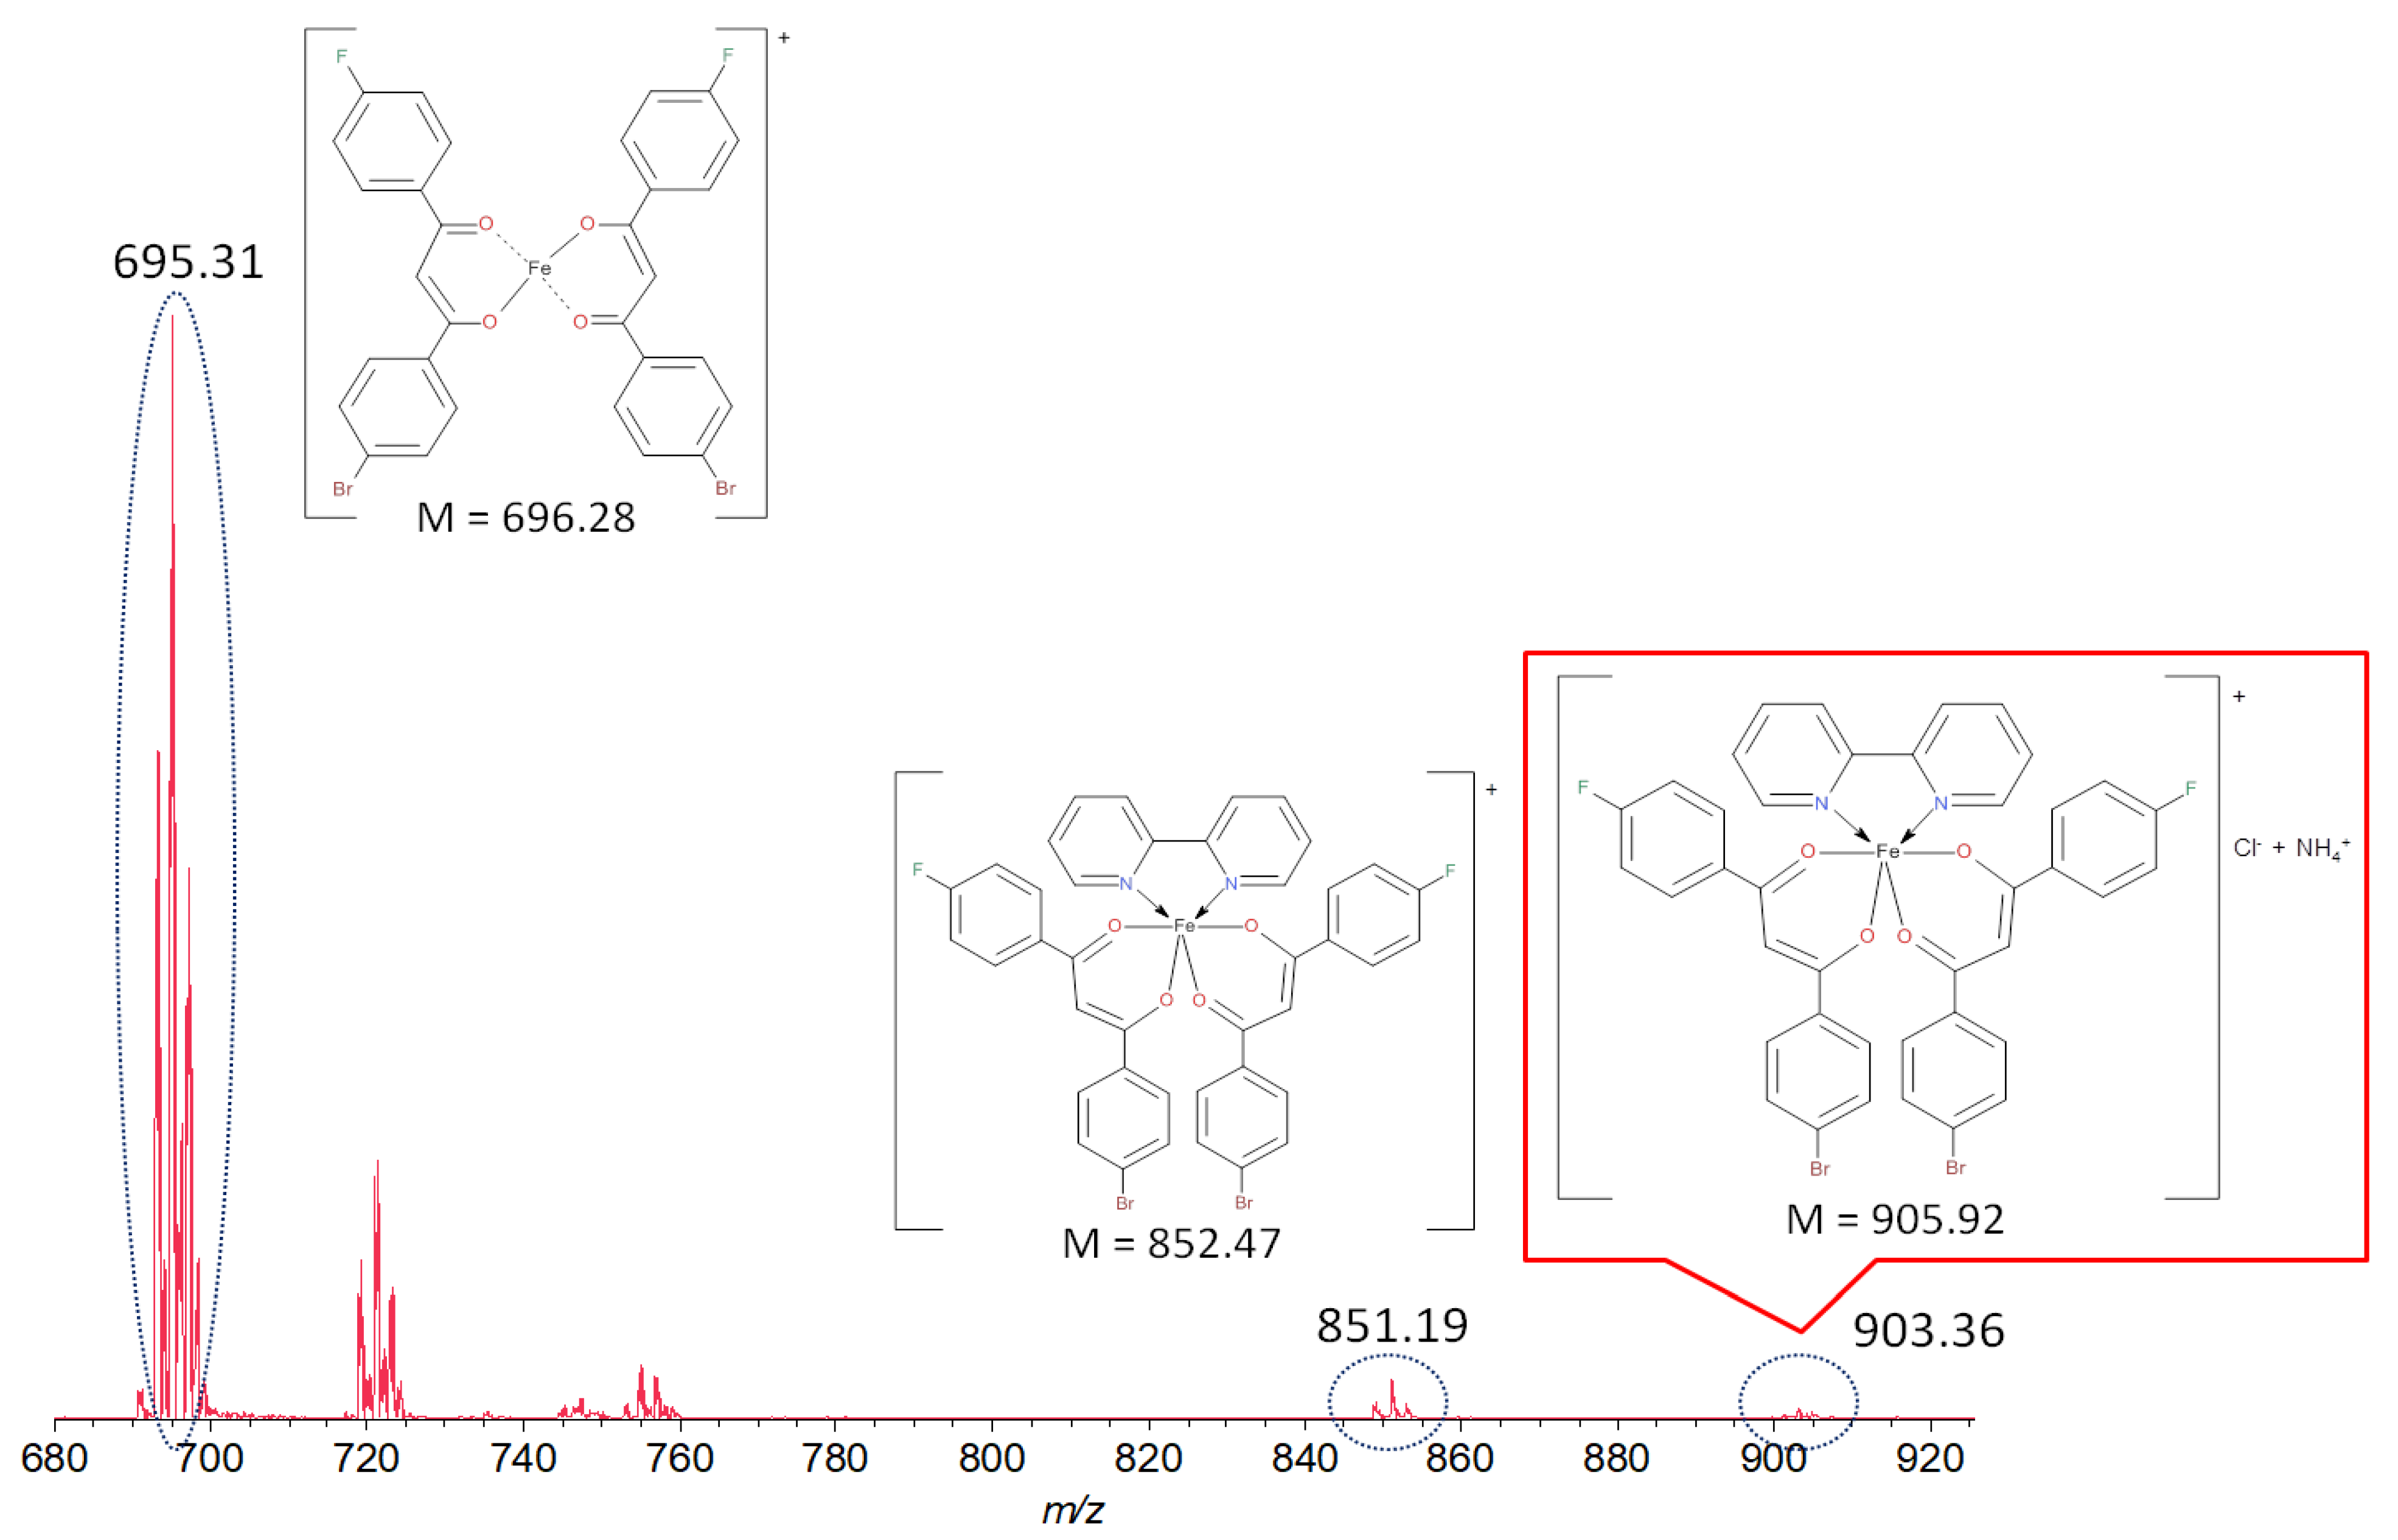
A MALDI-ToF mass spectrometry study showed the presence of the molecular ion peak with m/z 903.36 corresponding to the composition [FeL2Bipy]+Cl− stabilized by NH4+, as shown in Figure 1. The signals observed at smaller m/z values 851.19 (calc. 852.47) and 695.31 (calc. 696.28) refer to [FeL2Bipy]+ and [FeL2]+ fragments. Unfortunately, all attempts to obtain a sample suitable for single-crystal X-ray analysis were unsuccessful. The complex sedimented as a red powder in a mixture of solvents and at slow evaporation of the solvent from the concentrated solution of the compound.
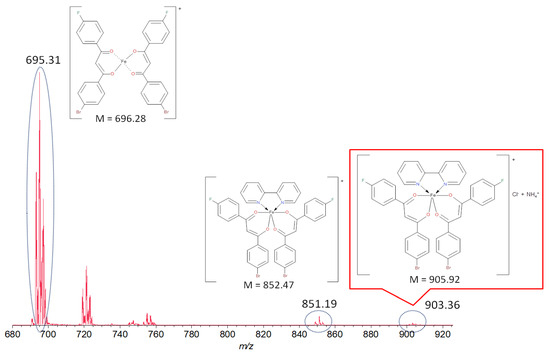
Figure 1.
Mass spectrum of iron(III) bis[1-(4-fluoro-phenyl)-3-(4-bromo-phenyl)propane-1,3-dionate](2,2′-bipyridine) chloride.
In the 1H NMR spectrum of [FeL2Bipy]Cl, a broadening of signals in the absence of multiplicity is observed, which indicates the paramagnetic nature of the sample due to the presence of Fe(III) ions.
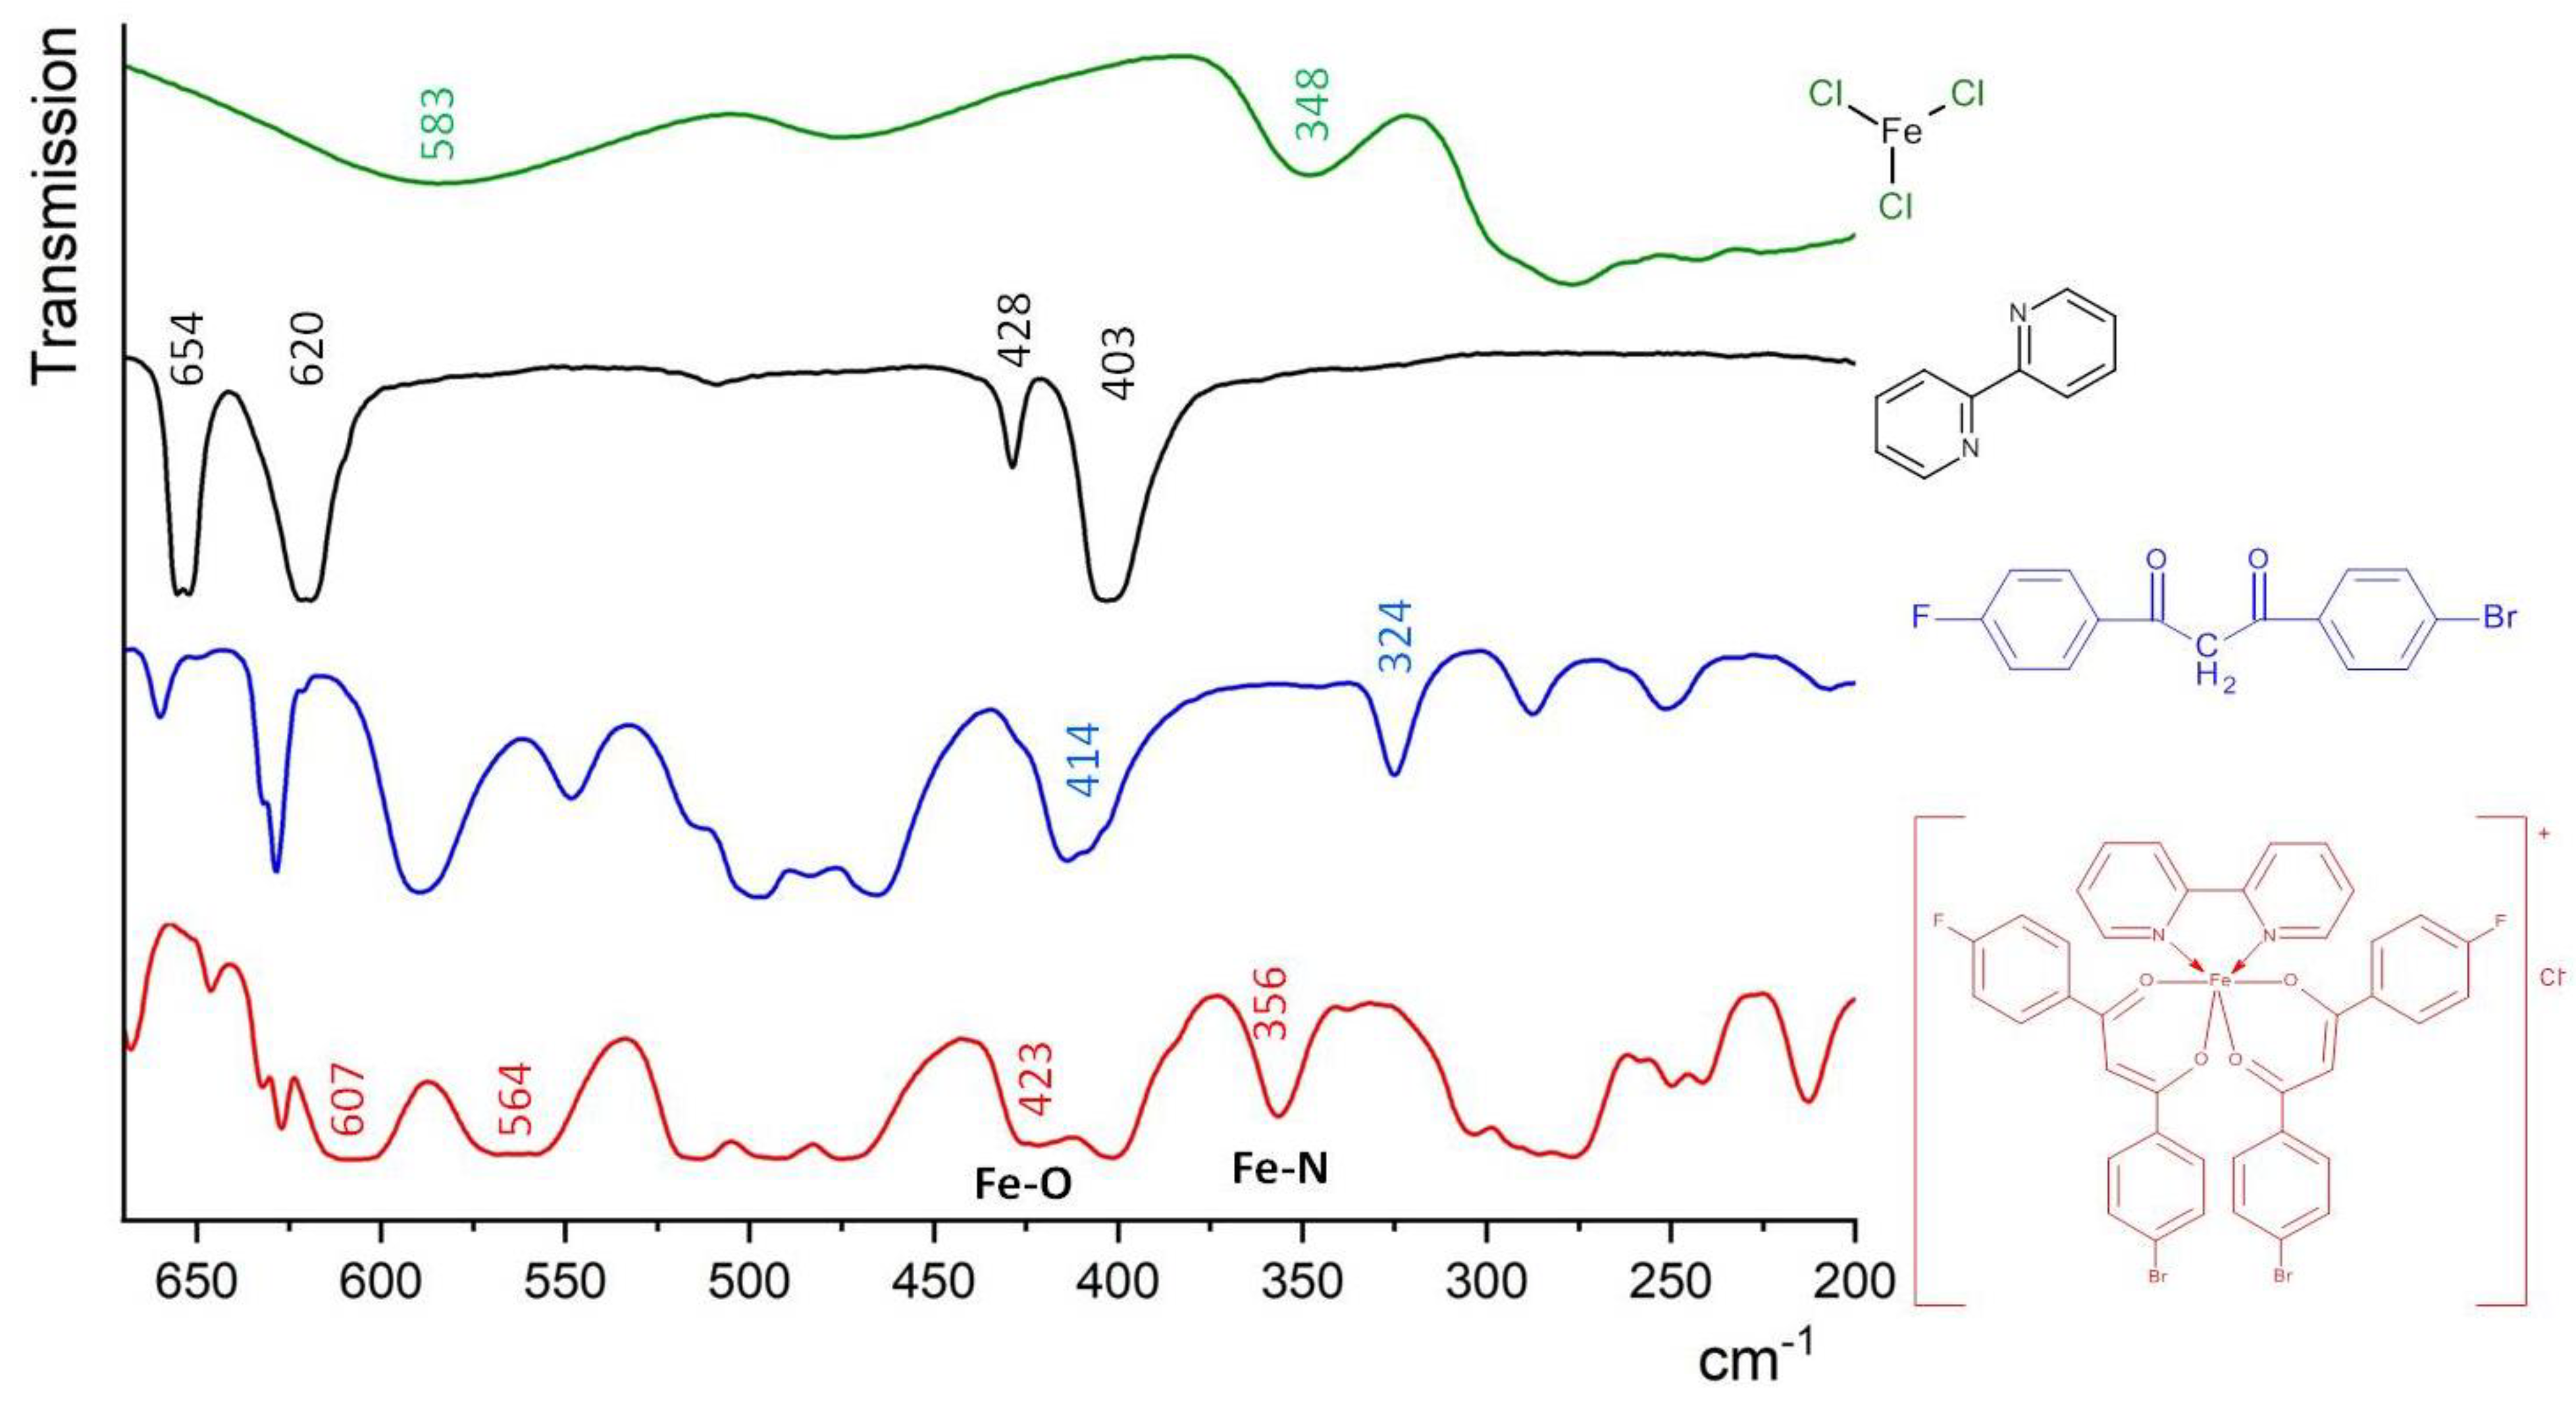
The distinctive infrared absorption bands of the free para-halogen substituted β-diketone and corresponding iron(III) ternary complex are presented below. The IR spectrum of the uncoordinated F-DK-Br ligand exhibited a broad absorption band at 3546–3416 cm−1, which can be attributed to the stretching vibration of the enolic O-H form (Figure S2). The intense peaks observed at 1607–1586 cm−1 and 1512–1477 cm−1 can be attributed to the stretching vibrations of the C=O and enolic C=C fragments, respectively. However, in the IR spectrum of the [FeL2Bipy]Cl complex, the enolic O-H form was not observed. The absorption bands attributed to the stretching vibrations of the C=O (1599–1587 cm−1) and enolic C=C (1498–1476 cm−1) bonds in the IR spectrum of complex exhibited a shift at 8–14 cm−1 in comparison to those observed in the corresponding β-diketone ligand (Figure S2). The results indicate that the coordination bands were formed between the β-diketone and the Fe(III) ion. In the meantime, the strong band at 1529 cm−1 in the complex is attributed to stretching vibrations of the C=N bond of the nitrogen heterocyclic ligand (Bipy). The new absorption bands at 423 cm−1 and 356 cm−1 in the spectrum of the complex, shown in Figure 2, were attributed to the stretching vibrations of the coordinated Fe–O and Fe–N, respectively [27]. These findings further corroborate the proposed conformation of the Fe(III) complex with the para-halogen-substituted β-diketone and nitrogen heterocyclic ligands.
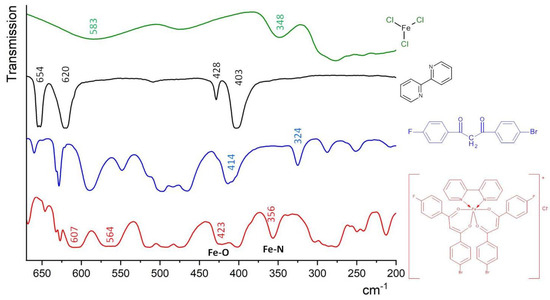
Figure 2.
Far infrared spectra of FeCl3, 2,2′-bipyridine, F-DK-Br ligand and the [FeL2Bipy]Cl complex, CsBr pellets.
Regarding temperature stability and phase behavior, it can be said that in contrast to the crystalline nature of β-diketone F-DK-Br, which is characterized by a melting point of 124 °C, the ternary complex obtained as a result of complexation is an amorphous compound with a decomposition temperature of 306.7 °C (Figure S3). During the heating cycle, the substance transitions to a glassy state at a temperature of 85.9 °C (Figure S4); no further phase transitions are observed.
2.3. Optical Properties
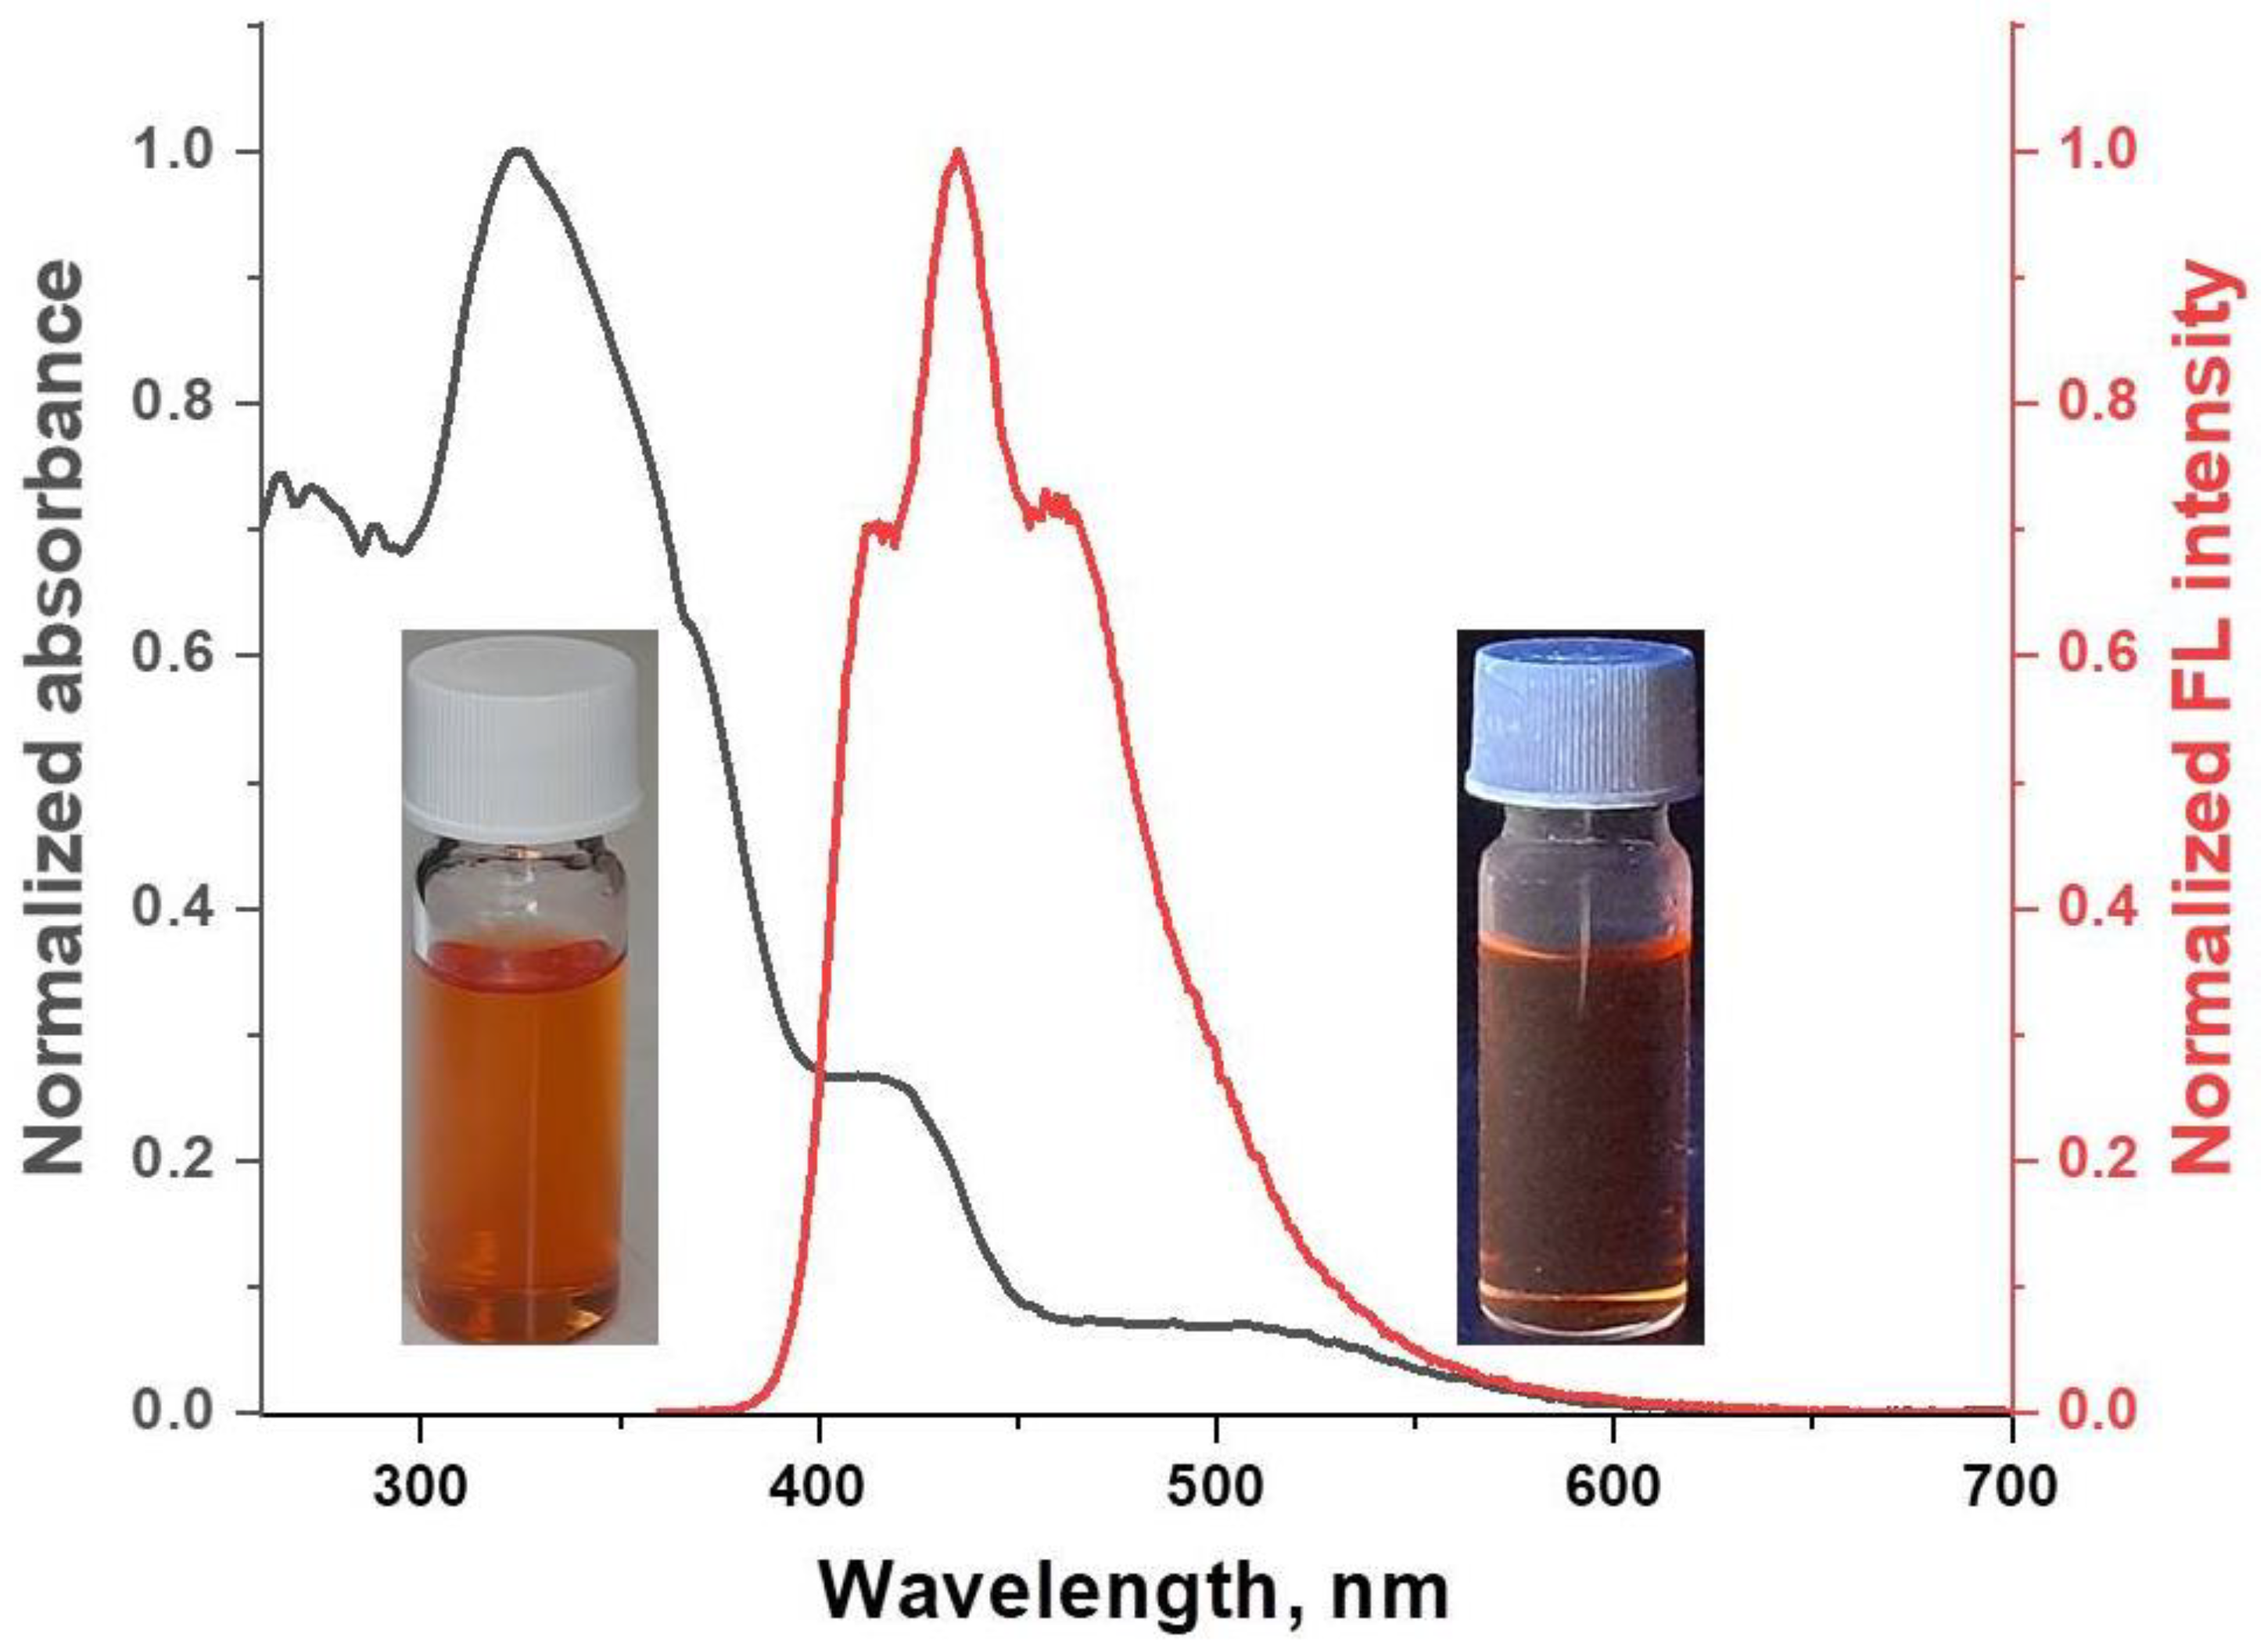
The optical properties of [FeL2Bipy]Cl were studied for dilute solutions in DCM (C = 10−6 mol/L). In the UV/vis spectrum of the solutions of [FeL2Bipy]Cl, two absorption bands of different intensities are observed at 271 nm and 325 nm (Figure 3). These bands arise from π-π* electronic transitions of the chelating β-diketonate and 2,2′-bipyridine ligands. Solutions of [FeL2Bipy]Cl in DCM exhibit very weak fluorescence (QYFL = 1%) with an emission maximum at 435 nm (Figure 3). The fluorescence decay curve for [FeL2Bipy]Cl is described by a biexponential model, with a fluorescence lifetime of 1.96 ns (Figure S5).
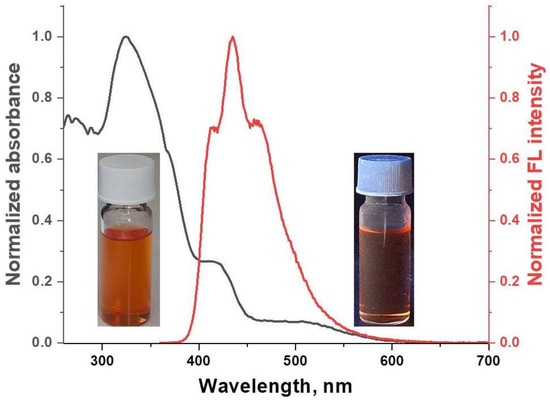
Figure 3.
Normalized UV/vis absorption and emission spectra of [FeL2Bipy]Cl in DCM solution.
2.4. DFT Calculations
In [FeL2Bipy]Cl, the central atom coordinates with two β-diketonate ligands and one 2,2′-bipyridine ligand, forming a distorted octahedral coordination geometry (Figure 4, Table S1). The average M–O and M–N coordination bond lengths are 1.884 Å and 1.971 Å, respectively (Table S2). The bite angles (O–M–O and N–M–N) are 91.3° and 81.4°, respectively (Table S2). Analysis of intramolecular interactions shows that the complex is characterized by the presence of C–H···Br interactions (3.844 Å) between the bromophenyl fragments of the β-diketonate ligands and weak C–H···π contacts (4.051 Å) between the fluoro-phenyl fragments of the β-diketonate ligands and the 2,2′-bipyridine ligand.
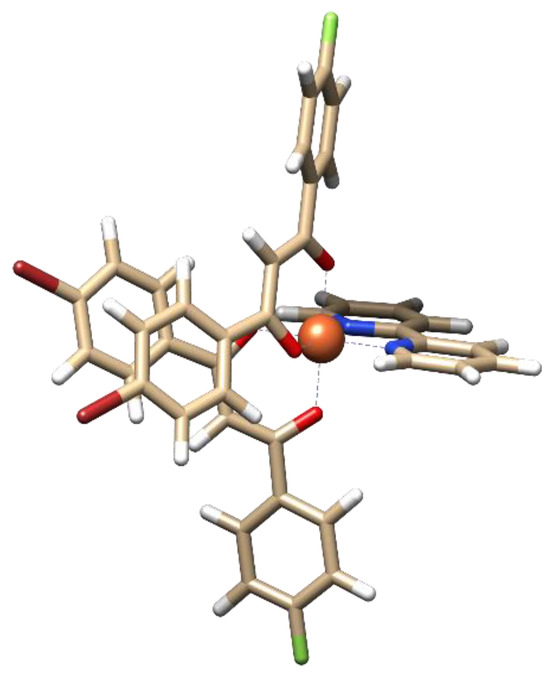
Figure 4.
Optimized structure of [FeL2Bipy]Cl.
An analysis of the electronic transition nature of [FeL2Bipy]Cl was performed using TDDFT. The results of the TDDFT analysis showed that the absorption spectrum of [FeL2Bipy]Cl (Figure S6) is characterized by five vertical excitations with oscillator strengths greater than 0.21. Among these, the most probable HOMO to LUMO electronic transition is associated with the process of charge transfer from the coordination center to 2,2′-bipyridine.
2.5. Magnetic and Resonance Properties
To study the magnetic properties of the complex, EPR and SQUID techniques were used, which made it possible to obtain consistent information and describe the temperature evolution of the magnetic states of the substance. SQUID is an integral magnetic method that allows one to observe the evolution of the total spin response, while EPR is a locally sensitive method that makes it possible to detect individual spin systems, for example, the HS and LS states of Fe(III) ions, and study their temperature dynamics, as well as analyze the influence of the environment on relaxation processes.
2.5.1. SQUID Magnetometry
Static magnetic susceptibility, χ(T), was measured on polycrystalline sample under heating regime using the zero-field cooled (ZFC) protocol. The temperature dependency of the χ in the form of the product χT is depicted in Figure 5. The χT value starts at 4.12 cm3 K/mol and reveals nearly temperature-independent behavior in the range of 90–300 K. The χT value at 300 K differs from the theoretical spin-only value of 4.375 cm3 K/mol, corresponding to 100% amount of HS Fe(III) ions (S = 5/2, g = 2.0). This means that the fully realized HS state is not reached and there is a contribution of LS states. Using the equation (χT)exp = γLS·(χT)LStheor + (1 − γLS)·(χT)HStheor [28], the molar contributions of LS and HS states at room temperature were estimated, which were γLS1 = 7% and γHS1 = 93%, respectively. Below 90 K, there is a gradual decrease in the magnetic moment with the inflection around 50 K, and then, it decreases continuously down to 2.05 cm3 K/mol. The slight increase in the range 30–90 K is most likely due to the occurrence of partial Fe(III) SCO transition (5/2↔1/2). The drastic decrease in the χT value observed at T < 20 K is characteristic of AFM interactions and/or zero-field splitting (ZFS).
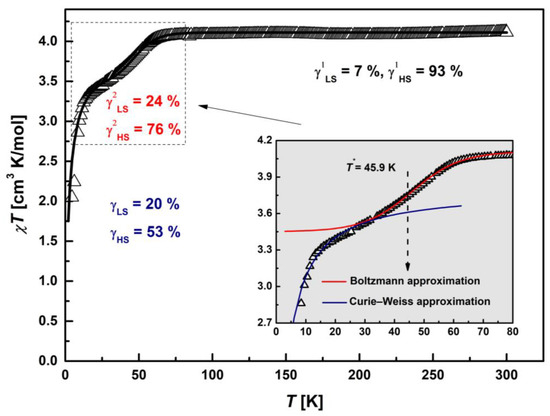
Figure 5.
Temperature dependence of the product, χT, of [FeL2Bipy]Cl. The solid black line is the best-fit (χT)theor curve for the theoretical model: Curie law at T > 75 K, partial spin-crossover transition with T* ≈ 46 K (dashed arrow) via Boltzmann activation mechanism in the range 30–75 K and Curie–Weiss approximation with θII = −2.34 K at T < 30 K. Inset: Detailed plot of the χT in the range 2–80 K (solid arrow). The solid lines correspond to individual contributions according to the proposed theoretical model: red line—(χT)SCO, blue line—(χT)C-W.
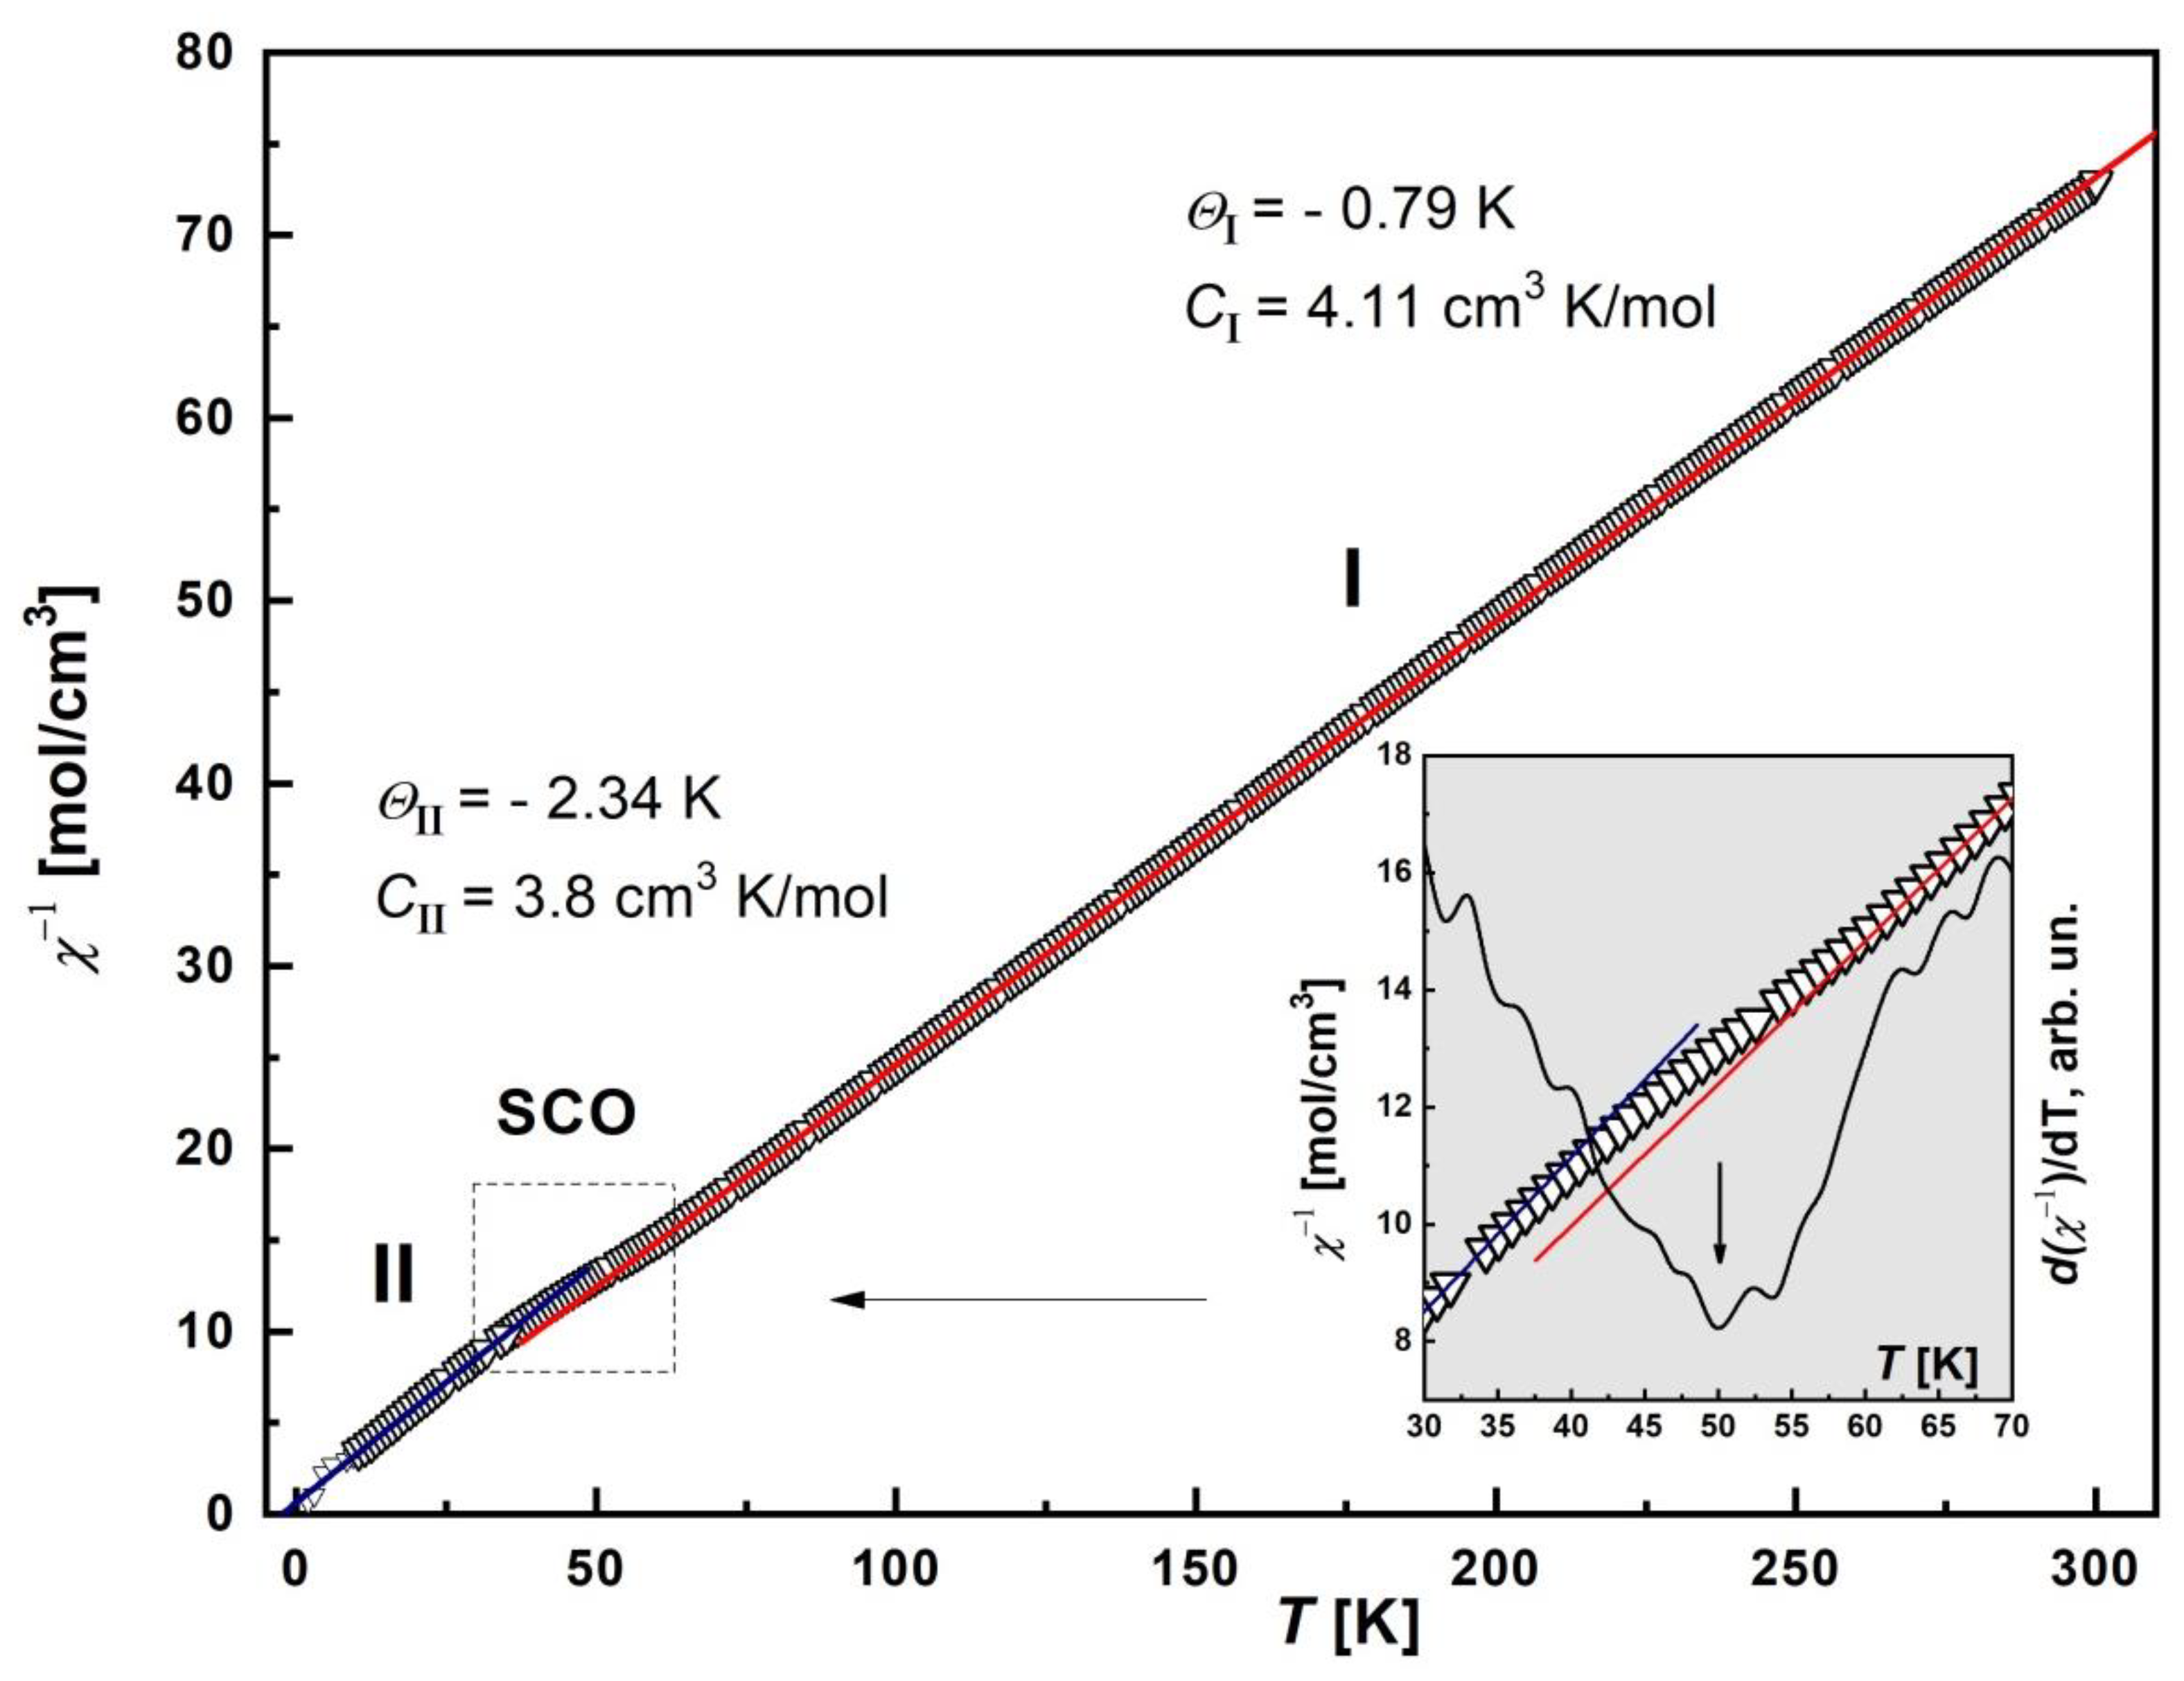
The temperature dependence of the inverse magnetic susceptibility, χ−1(T), was plotted and analyzed (Figure 6). It was found that the χ−1 curve is described by two Curie–Weiss approximations on different temperature ranges: I—90 < T < 300 K, II—10 < T < 35 K. The respective Weiss constants are ΘI = −0.79 K, CI = 4.11 cm3 K/mol; ΘII = −2.34 K, CII = 3.8 cm3 K/mol. This behavior of χ−1(T) indicates a partial SCO transition. To confirm this, the first derivative curve, d(χ−1)/dT, was plotted (inset in the Figure 6). For this purpose, the original χ−1(T) curve was used to smoothly interpolate the experimental data. The d(χ−1)/dT curve shows a pronounced minimum near the T = 50 K, which clearly indicates a transition.
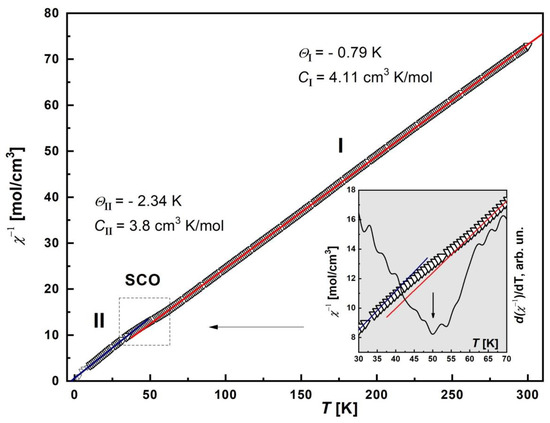
Figure 6.
Temperature dependence of the inverse magnetic susceptibility, χ−1, of [FeL2Bipy]Cl. The solid lines (red and blue) are Curie–Weiss approximations with corresponding Weiss temperature Θ: ΘI = −0.79 K (90–300 K), ΘII = −2.34 K (10–35 K). Inset: Detailed plot of the χ−1 in the vicinity of SCO transition in the range 30–70 K (arrow). The black solid line is the first derivative of inverse susceptibility, d(χ−1)/dT, with minimum nears of 50 K (arrow).
The negative sign of Θ indicates the presence of AFM interactions between Fe(III) cations. The contribution of the ZFS factor to the decrease in χT can be neglected, since the parameter D is small [29]. Thus, in the first temperature range, there are practically non-interacting Fe(III) ions (paramagnetic behavior), and in the second range, strong AFM correlations arise.
To describe the experimental dependence of the χT, three temperature intervals were identified, for each of which a magnetic state was proposed within the framework of a theoretical approach. The first region at T > 75 K corresponds to the paramagnetic Curie law, the second in the range 30–75 K is partial SCO, and the third at T < 30 K is AFM interactions in the Curie–Weiss approximation. SCO transition was modeled by replacing LS Fe3+ spin moments S = 1/2 to HS S = 5/2 via Boltzmann activation mechanism [30,31]. We used a symmetric Boltzmann distribution model to estimate a midpoint of the transition, T*. The upper limit of the (χT)SCO curve was set equal to the experimental level of only the Fe(III) HS states (γHS1 = 93%) χT(300 K) = 4.09 cm3 K/mol, which correspond to PM Curie law at T > 75 K. The fitting parameters were T* and the width of the transition at the levels ±1/2 of the midpoint, ΔT1/2. Thus, this procedure made it possible to estimate the lower limit of the (χT)SCO curve corresponding to the partial SCO transition and to determine new molar contributions of LS (γLS2) and HS (γHS2) states. The fitting of T* was carried out near T = 50 K, corresponding to the minimum on the d(χ−1)/dT curve. A best-fit (χT)SCO curve is shown in the inset of Figure 5 as a solid red line (include 0.03 cm3 K/mol from γLS1 = 7%). The SCO parameters were T* = 45.9 K and ΔT1/2 = 30 K. The lower limit of the (χT)SCO = 3.42 cm3 K/mol, which correspond to γLS2 = 24% and γHS2 = 76%. The continuous transition of the (χT)SCO curve allows to determine the mutual concentrations of the spin moments S = 1/2 and 5/2 of Fe(III) cations at any temperature in the SCO range. The lowest temperature segment at T< 30 K was fitted by a Curie–Weiss law (χT)C-W with ΘII = −2.34 K, CII = 3.8 cm3 K/mol (solid blue line), obtained from the approximation of the χ−1(T) curve (Figure 6). The solid black line in Figure 5 represents the resulting calculated (χT)theor = (χT)SCO + (χT)C-W curve that best fits the proposed theoretical model with the parameters described above.
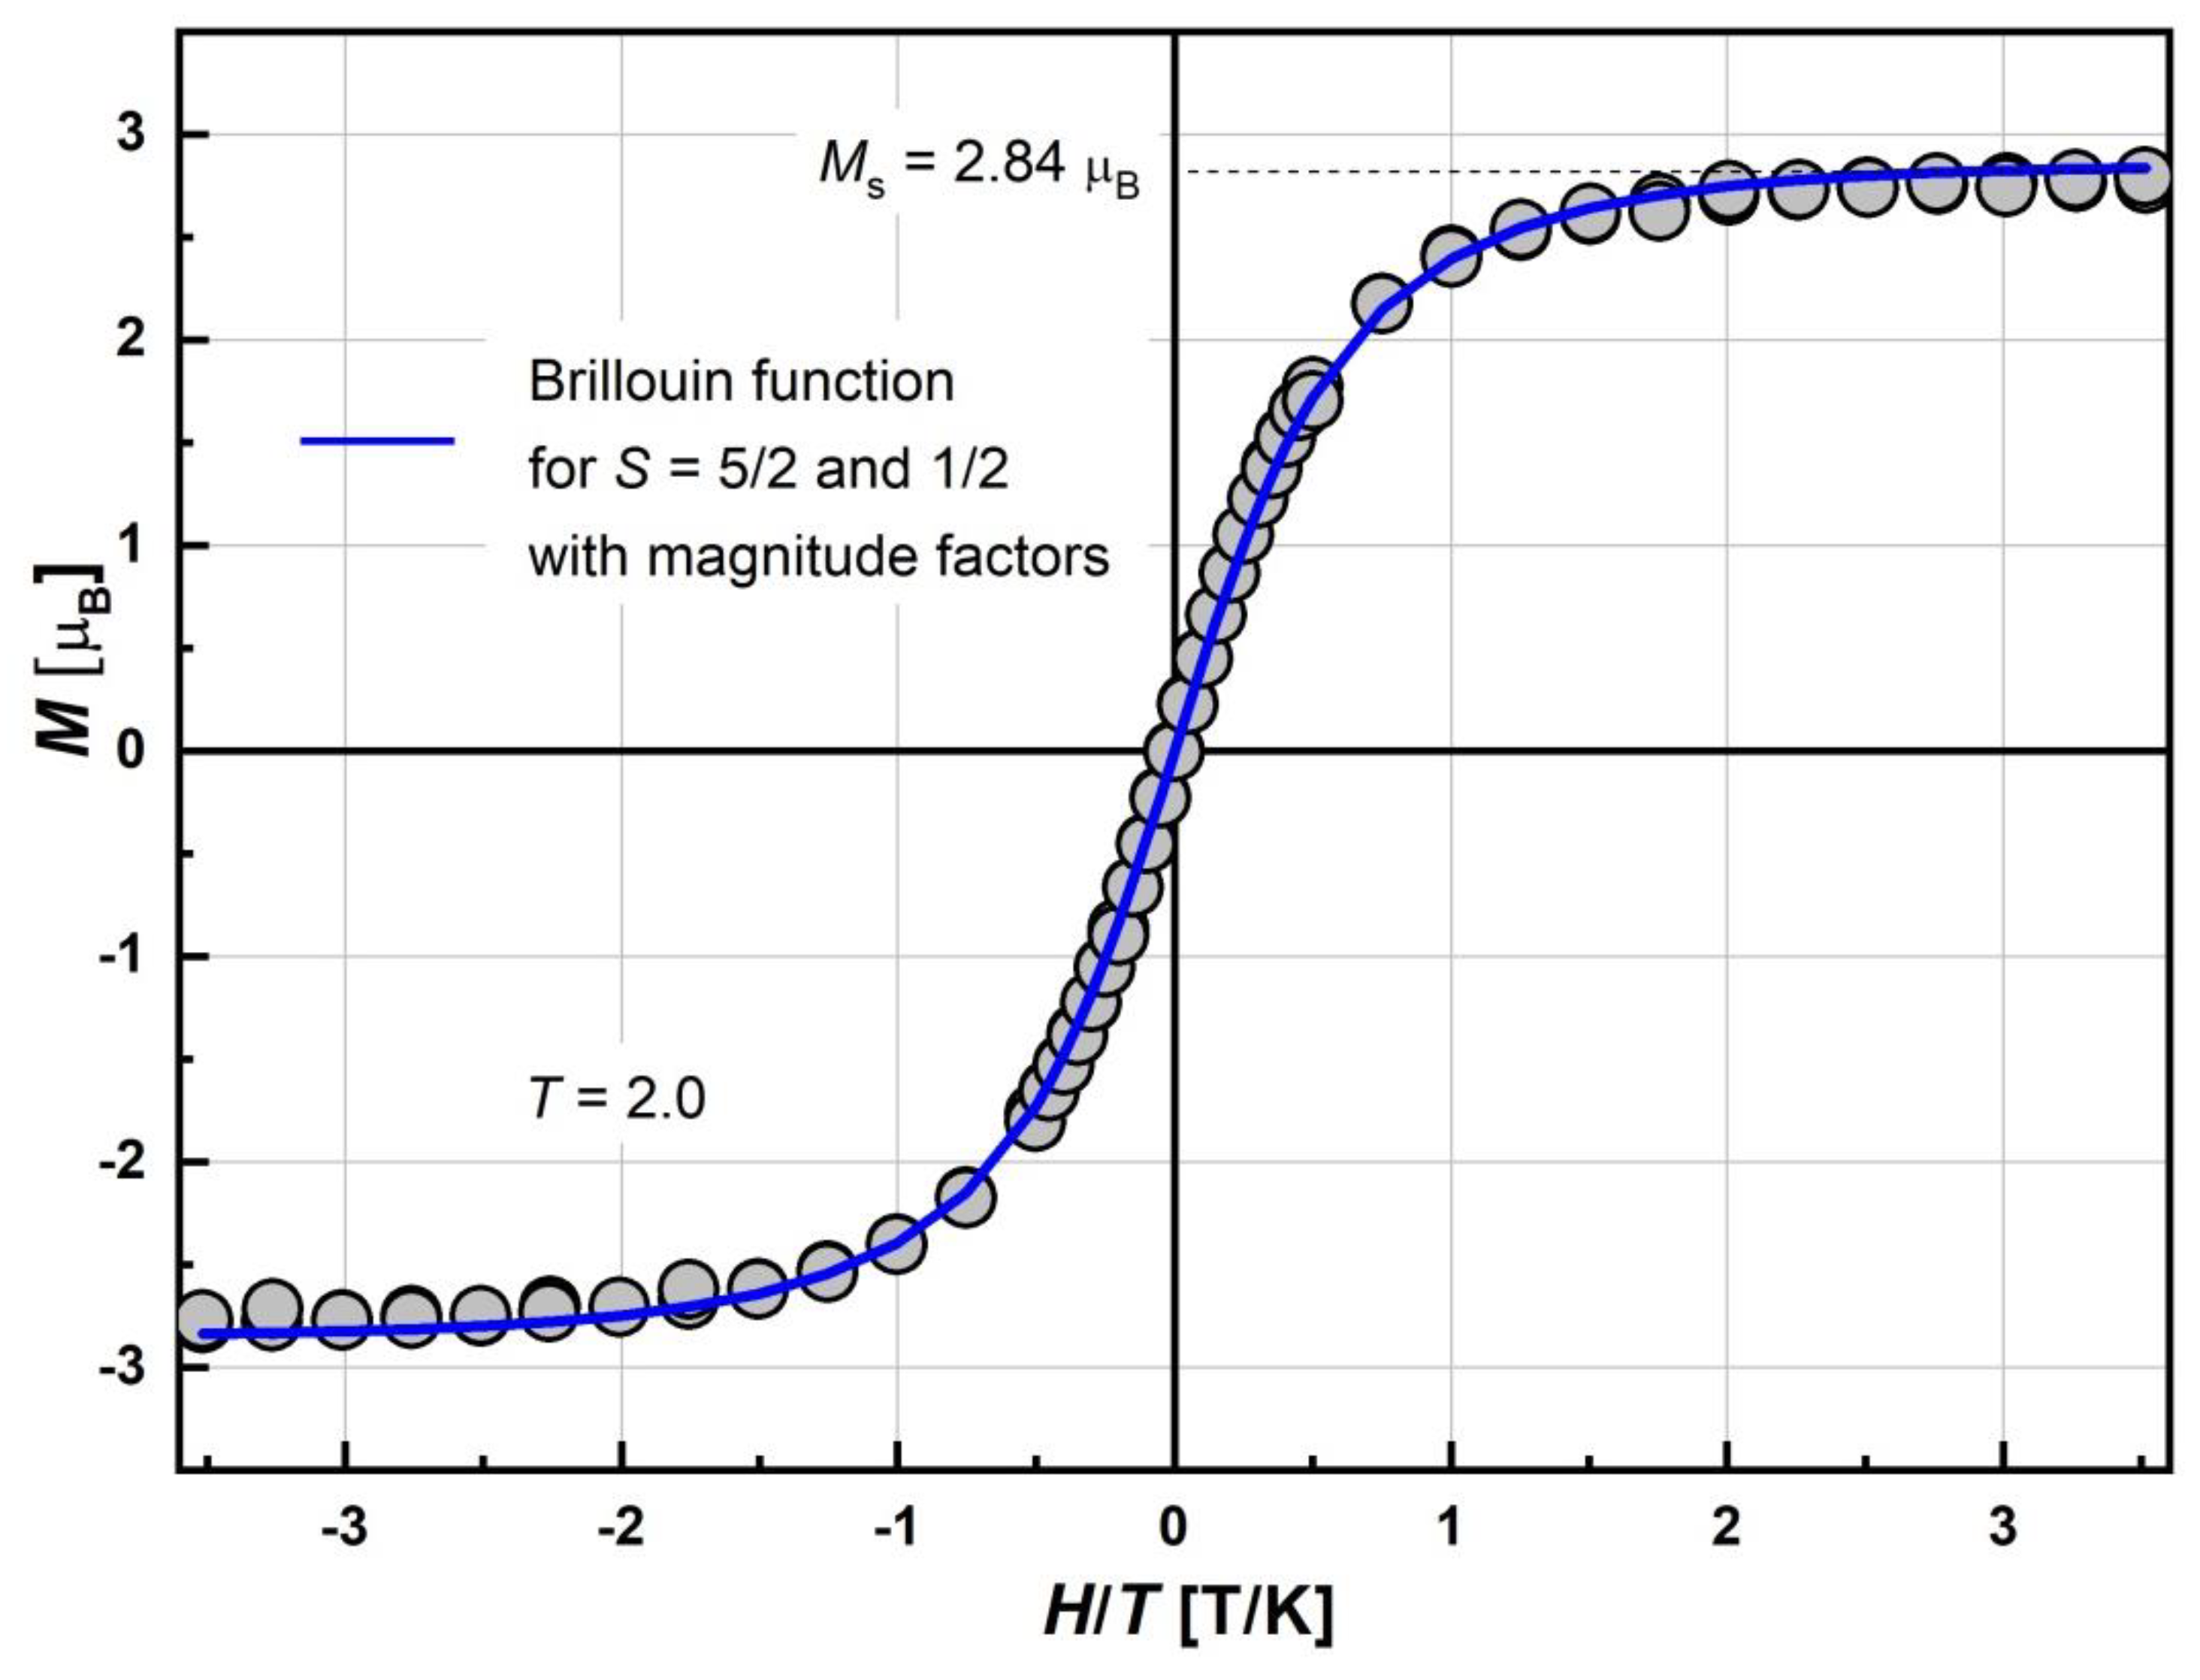
To determine the ground spin state, the field dependence of the magnetization, M(H), was measured at 2.0 K. The magnetization curve is presented in Figure 7. Saturation of Ms at the highest field was observed. Its value at 70 kOe reaches 2.84 μB. Field dependence was perfectly fitted by the superposition of Brillouin functions for S = 5/2 and 1/2 with the corresponding magnitude factors, γHS and γLS. The fitting curve is presented as a solid line. The basic magnetic characteristics and fitting M(H) parameters for complex at 2.0 K are given in Table 1. The Brillouin shape indicates that some of the Fe(III) spin moments remain in a PM non-interacting state. The magnitude factors γHS = 0.53 and γLS = 0.2 mean that 53% of HS and 20% of LS Fe(III) moments are effectively enough for the description of the χT curve at helium temperatures (Figure 5). Indeed, the χT value at 2.0 K, corresponding to γHS and γLS obtained from M(H) measurements, should be 2.3 cm3 K/mol, which is close to the experimentally observed value. The γHS = 53% indicates that a noticeable part of the HS Fe(III) moments “disappeared” (~27%) from the total magnetic response, which is a sign of AFM interactions. Moreover, the γLS ≈ γLS2 indicates that that most LS Fe(III) ions do not participate in exchange interactions, although a certain proportion can.
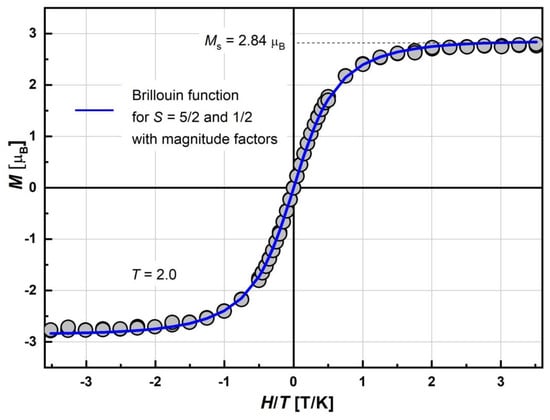
Figure 7.
Field dependence of magnetization, M, of [FeL2Bipy]Cl measured at T = 2.0 K and −7.0 < H < +7.0 T. Solid blue line is the best-fit curve corresponding to the superposition of Brillouin function for S = 5/2 and S = 1/2 with respective magnitude factors γHS and γLS, dashed line is saturation magnetization Ms (see Table 1).

Table 1.
Basic magnetic characteristics and fitting M(H) parameters of [FeL2Bipy]Cl at 2.0 K.
2.5.2. EPR Spectroscopy
EPR measurements of [FeL2Bipy]Cl were carried at 5.0 K < T < 300 K. The spectra contained three EPR signals: two high-spin (HS, S = 5/2) and one low-spin (LS, S = 1/2) centers. This result is completely consistent with the mixed LS+HS state obtained from magnetic measurements. The EPR spectra of HS Fe(III) centers are described by the spin Hamiltonian:
where D and E represent the fine structure parameters of the EPR spectrum, which quantify the axial (D) and rhombic (E) deviations from octahedral symmetry. The I-type HS centers (g = 4.4) correspond to high-spin HS Fe3+ ions subjected to strong low-symmetry crystal fields (D >> hν = 0.3 cm−1, E/D~1/3). In contrast, the broad signal at g~2 arises from high-spin Fe3+ ions in octahedral environments with weak distorted crystal field (D <<0.3 cm−1, E = 0), classified as II-type of HS centers. Meanwhile, the EPR spectra of low-spin Fe3+ centers (with 2T2g ground state) are characterized by the spin Hamiltonian exhibiting rhombic symmetry:
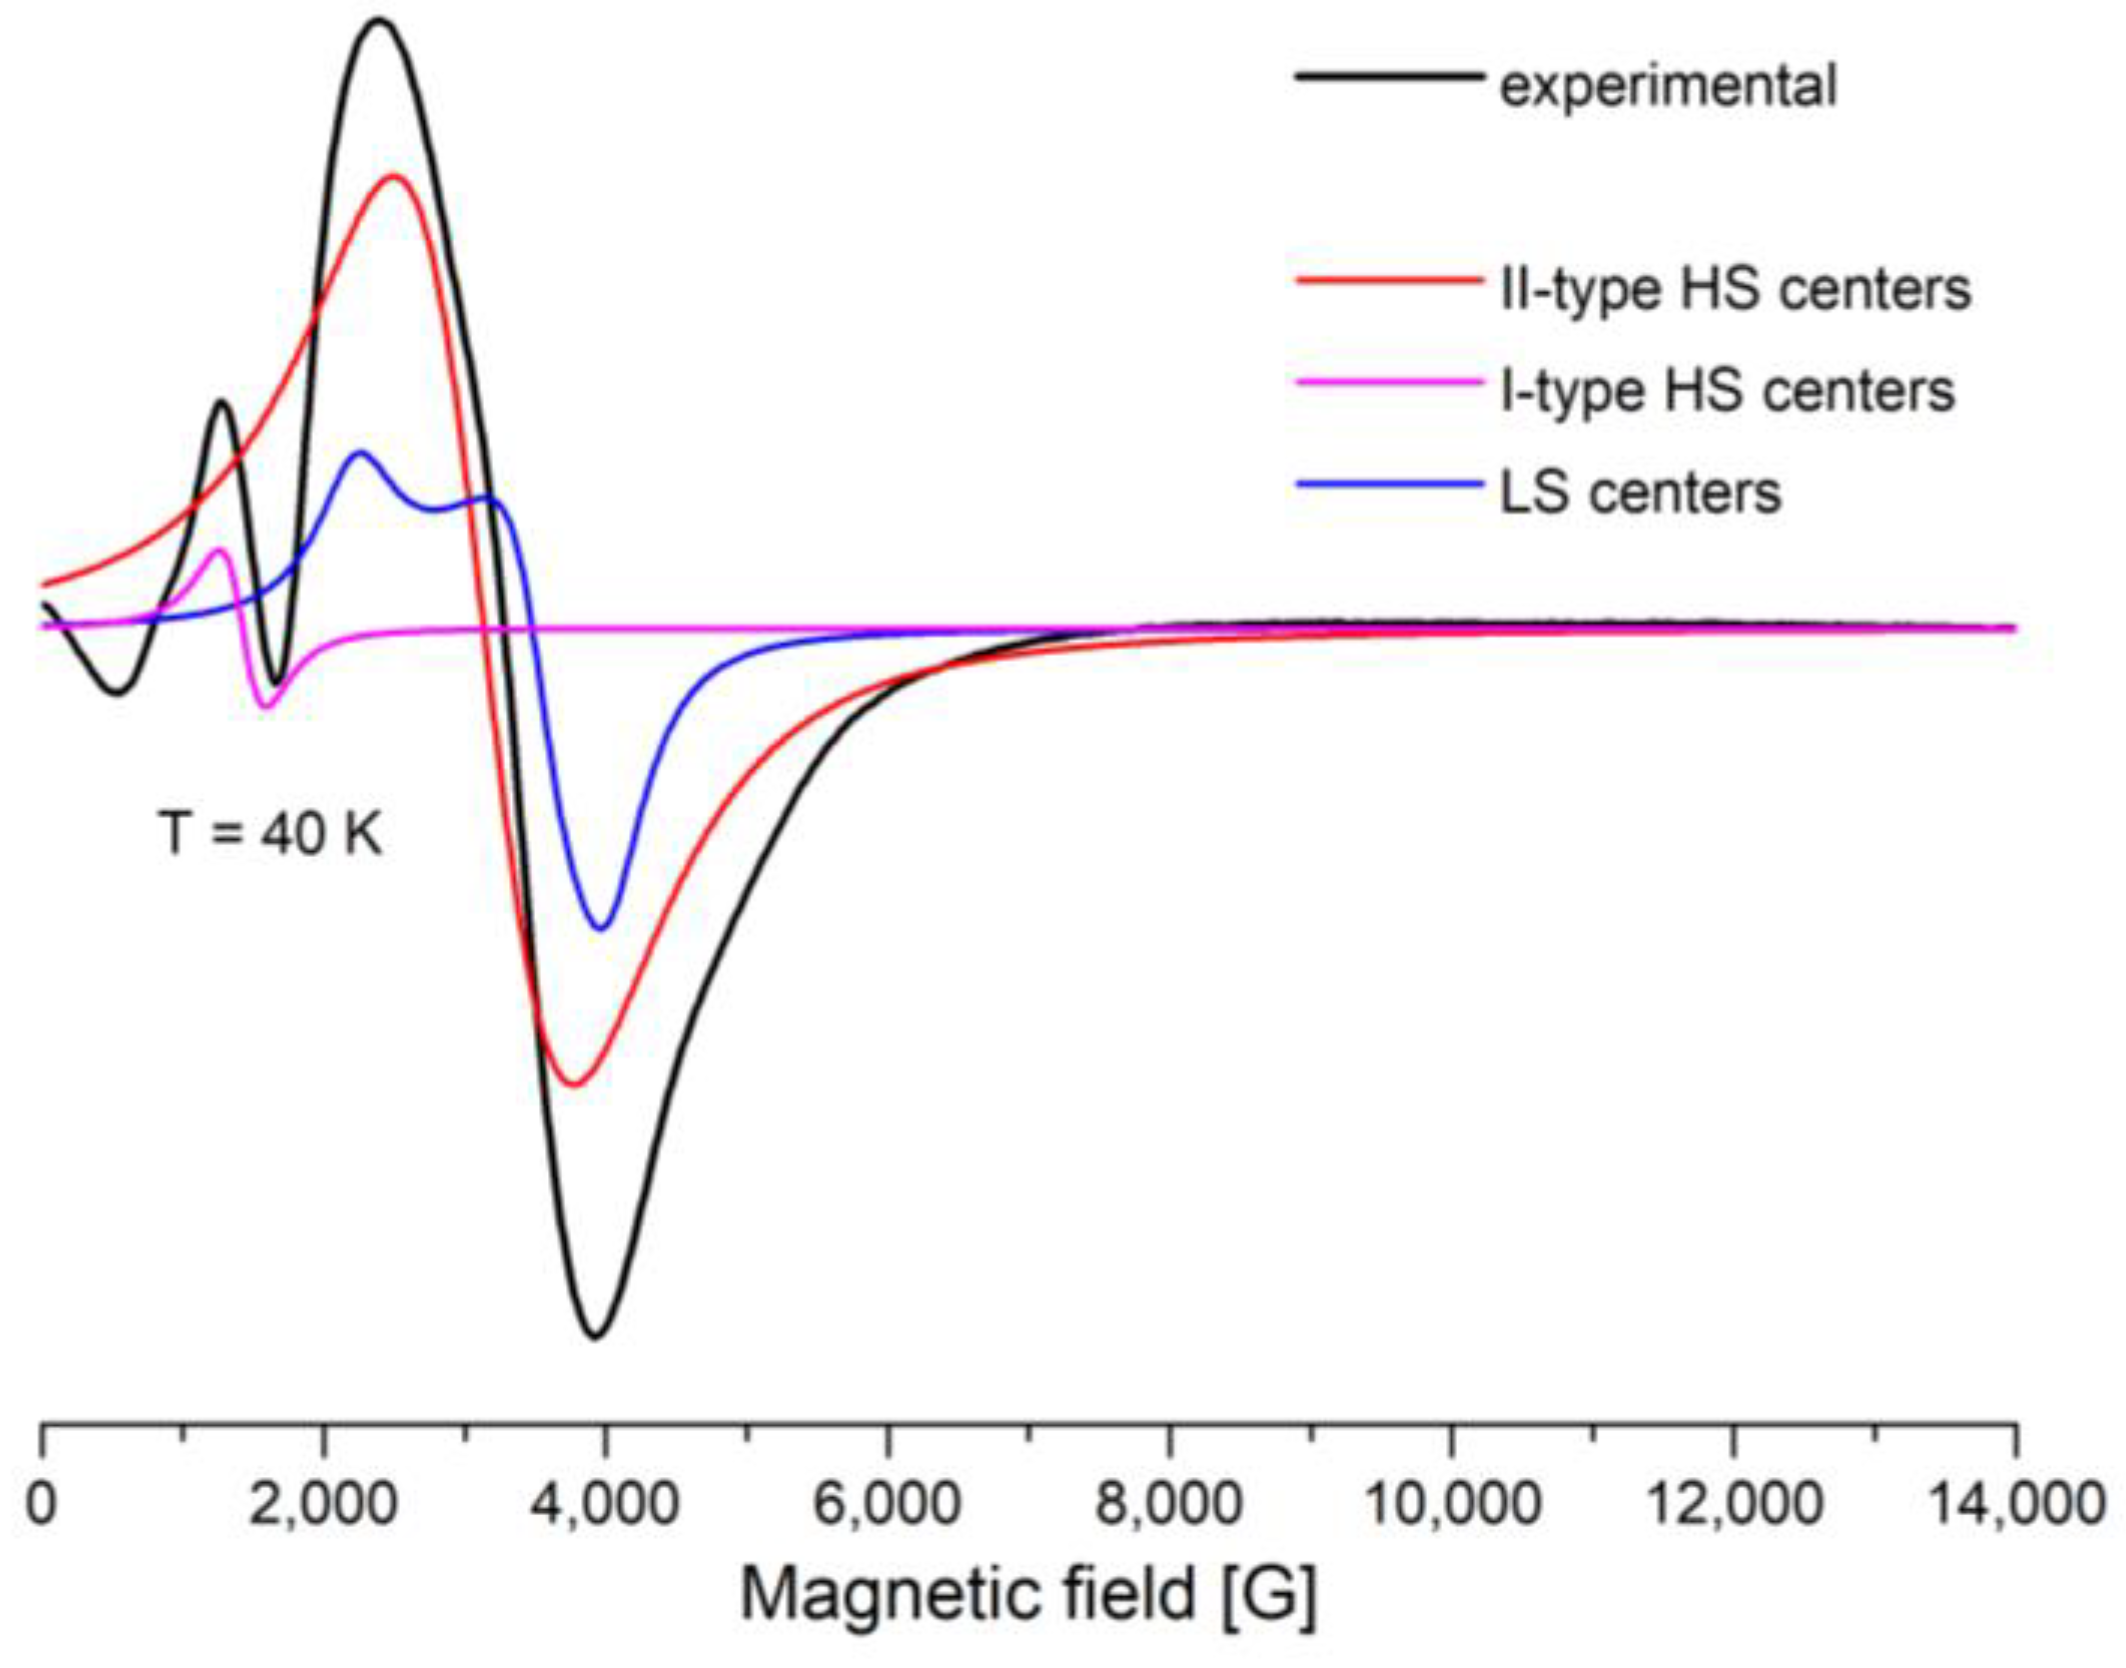
A Lorentzian line shape was used to simulate the EPR spectra through the EasySpin—5.2.36 MATLAB toolbox [32,33] (Figure 8 and Figure 9). The large line width, ΔH, from the II-type HS centers leads to inaccurate determination of the baseline. The signals from the II-type HS and LS centers overlap with each other, which makes it difficult to separate them. All this leads to errors in simulations of the spectra and analyses of the integrated intensities. The experimental and simulation spectra of [FeL2Bipy]Cl measured at T = 40 K are shown in Figure 9.

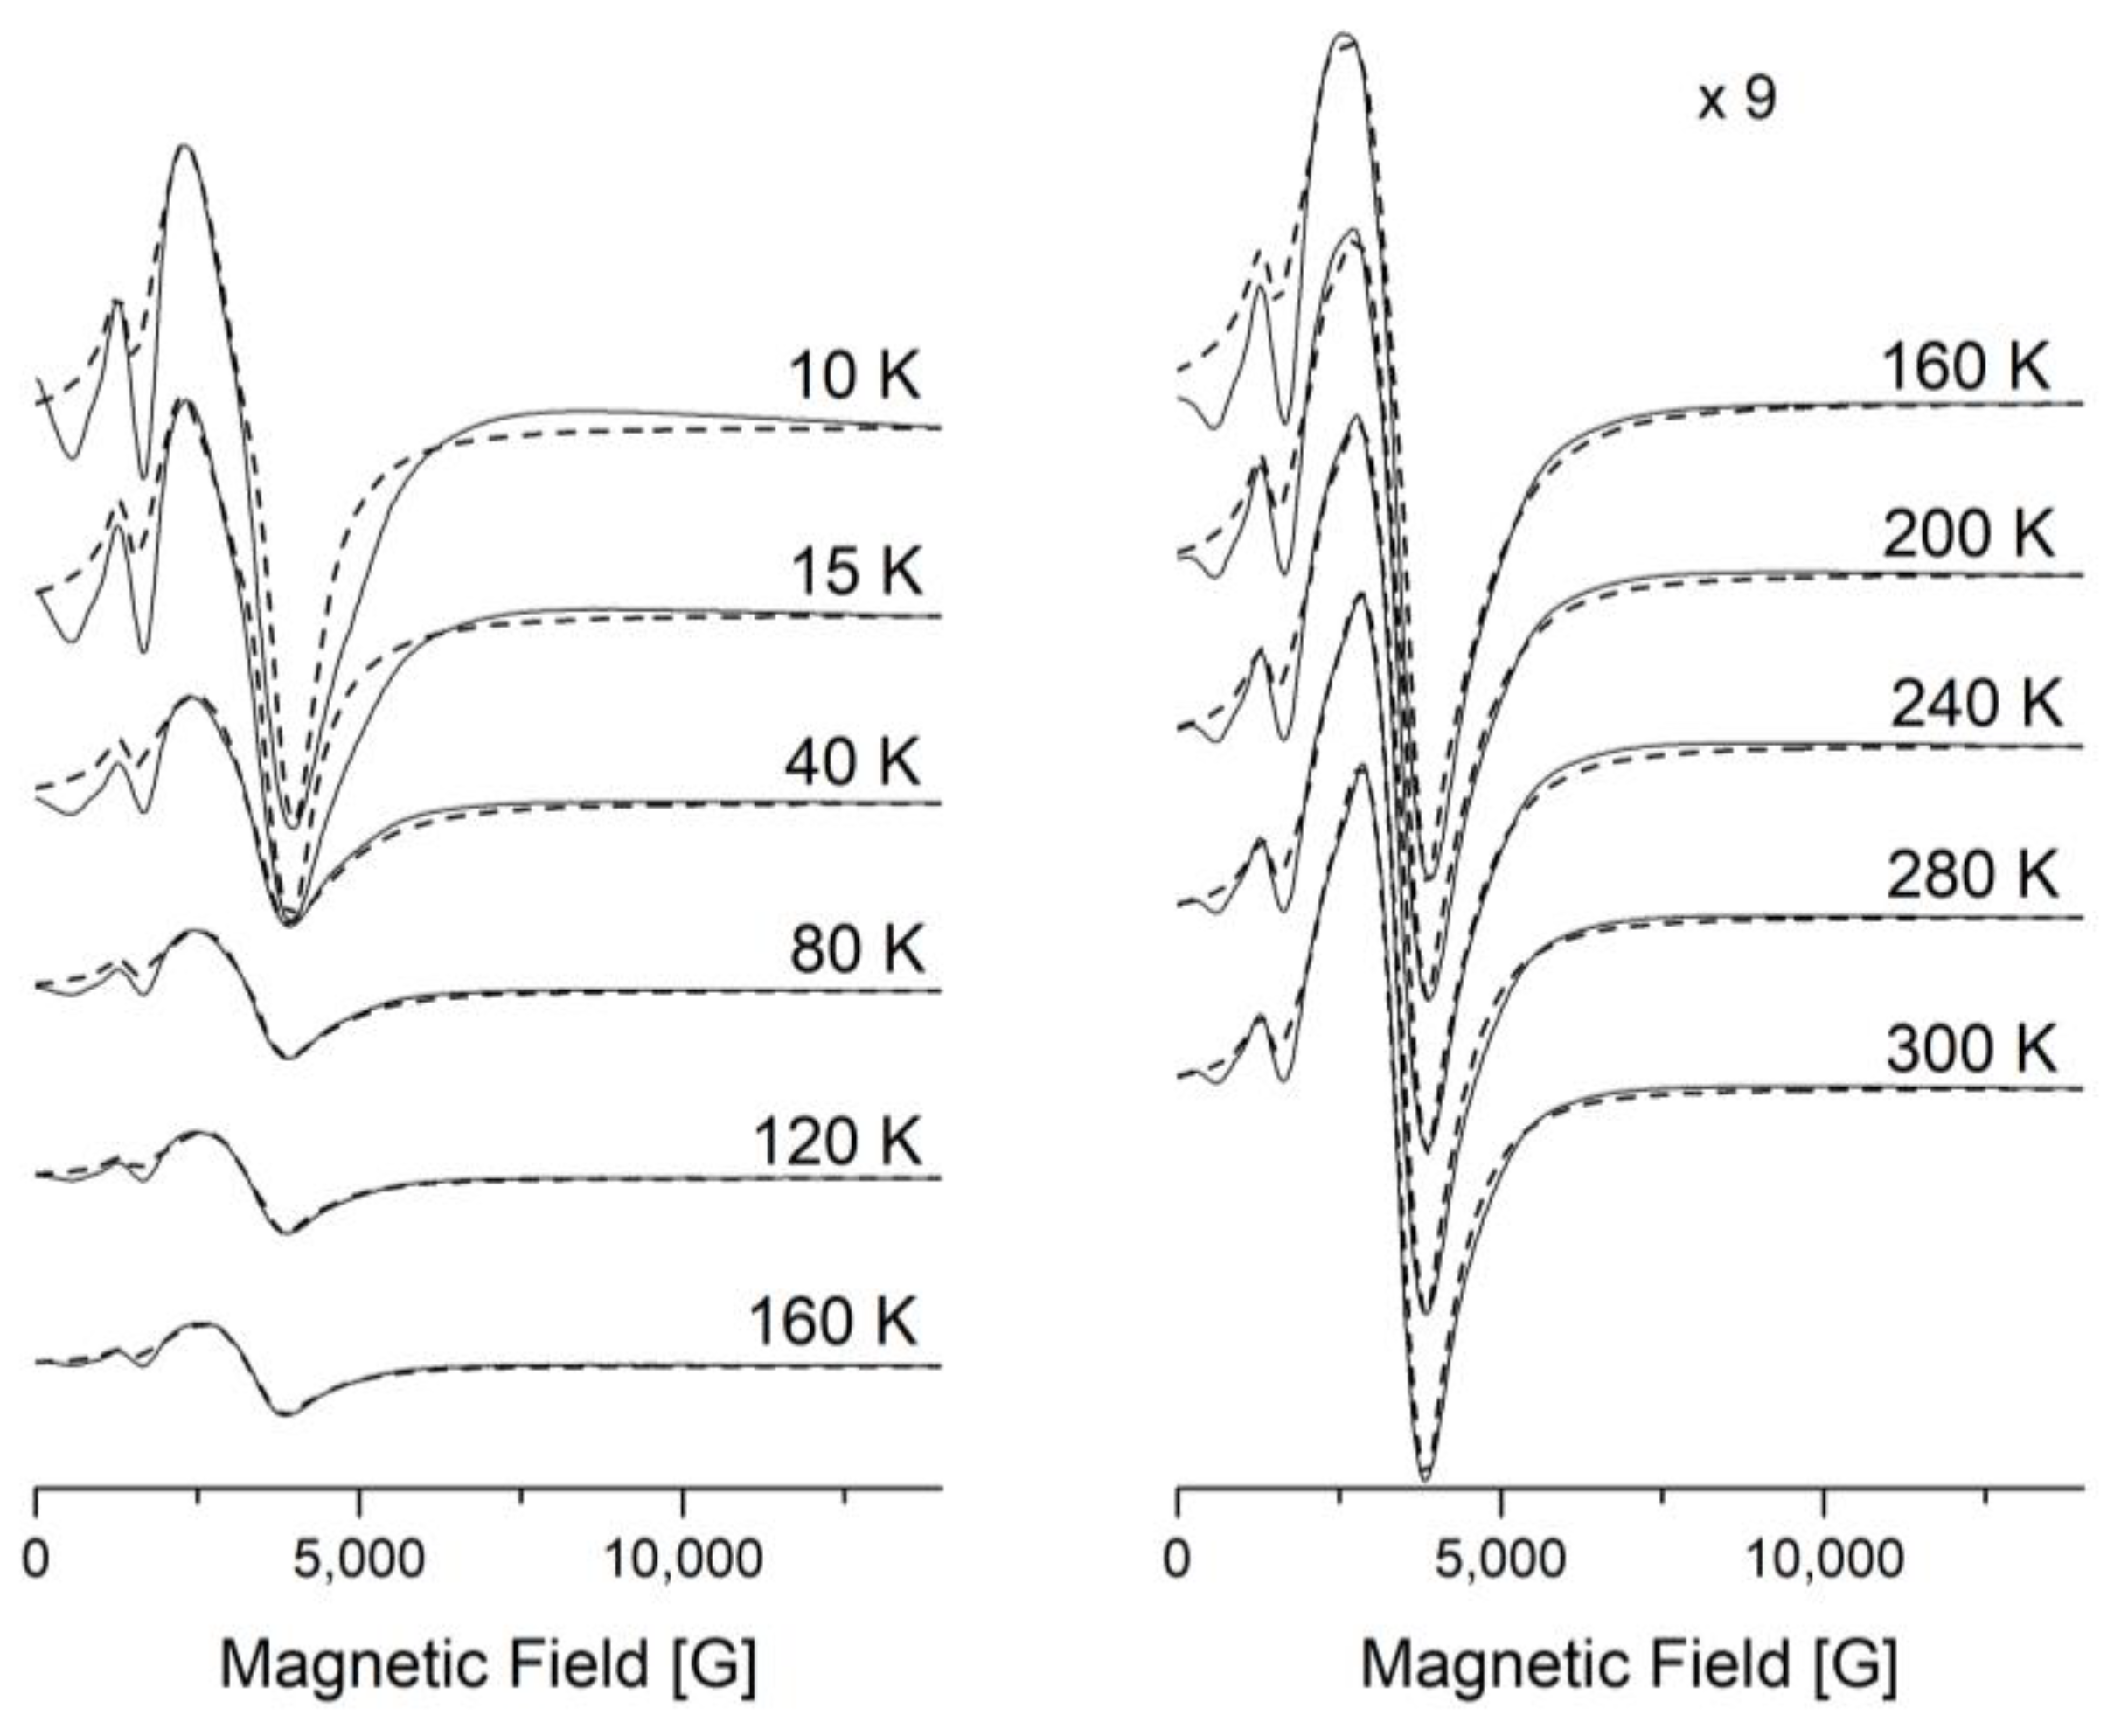
Figure 8.
Temperature evolution of the X-band EPR spectra of [FeL2Bipy]Cl (solid line—experimental, dashed line—simulated).

Figure 9.
X-band EPR spectra, measured at 40 K. Black line is experimental spectra, colored lines are simulated by Easyspin Matlab program (I and II-type HS, LS).
The experimental spectra were simulated using the following magneto-resonance parameters: g = 2, D = 0.42 cm−1, and E = 0.105 cm−1 (I-type HS Fe(III) centers), 2.02 < g < 2.25, D = 0.013 cm−1, and E = 0 cm−1 (II-type HS Fe(III) centers) and gx = 2.96, gy = 1.87, gz = 1.7 (LS Fe(III) centers).
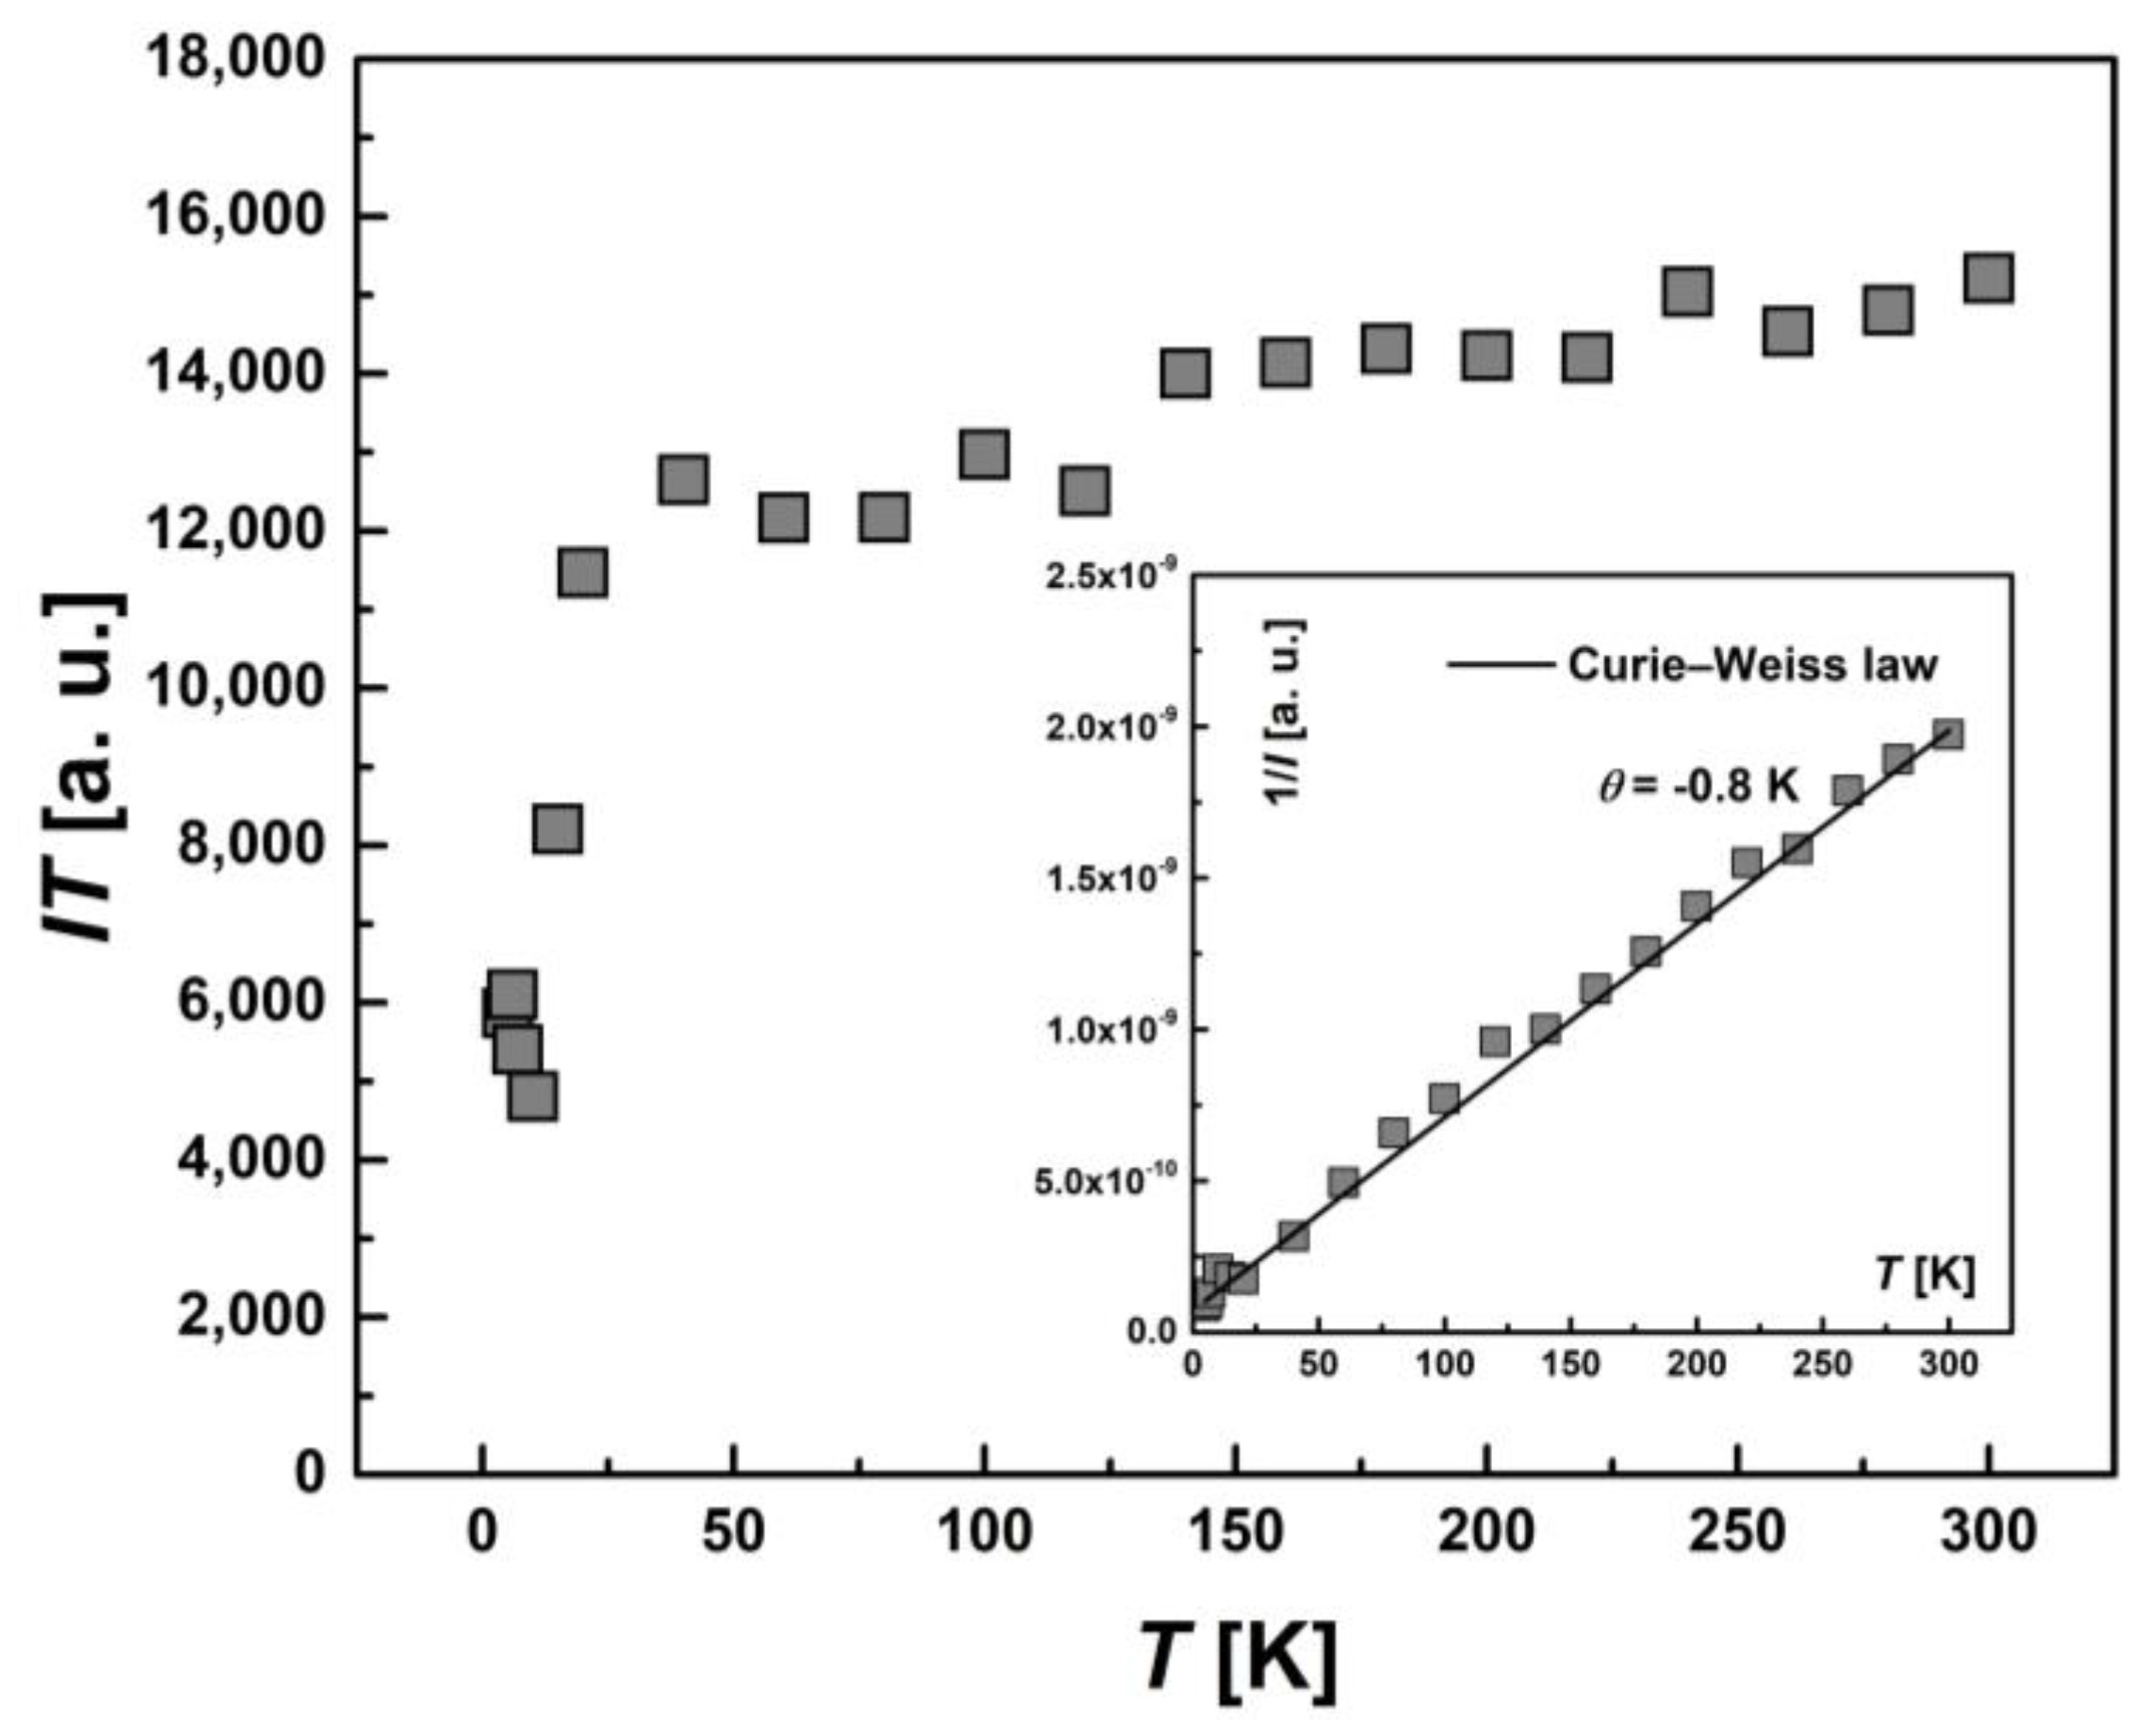
The temperature dependence of the integral intensity, I(T), in the form of the product I∙T for the whole EPR spectrum of [FeL2Bipy]Cl is shown in Figure 10. The inverse intensity, 1/I(T), (the inset) is described by the Curie–Weiss law with θ = −0.8 K. Comparing the temperature dependence of product χ·T (Figure 5) and I·T demonstrates a similarity in behavior. This is not surprising, since it is known that the integrated EPR intensity I(T) is proportional to the static magnetic susceptibility χ(T) of the spins participating in the resonance [34].
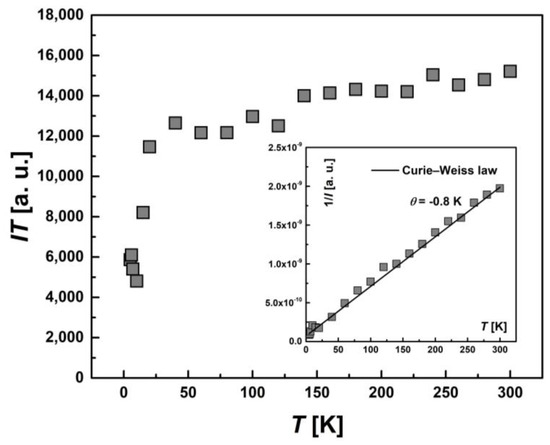
Figure 10.
Temperature-dependent behavior of the integrated intensity I(T) for entire EPR spectra presented as the product I·T. Inset: the temperature dependence of the inverse intensity (1/I(T)). The solid line represents calculations based on the Curie–Weiss law with θ = −0.8 K.
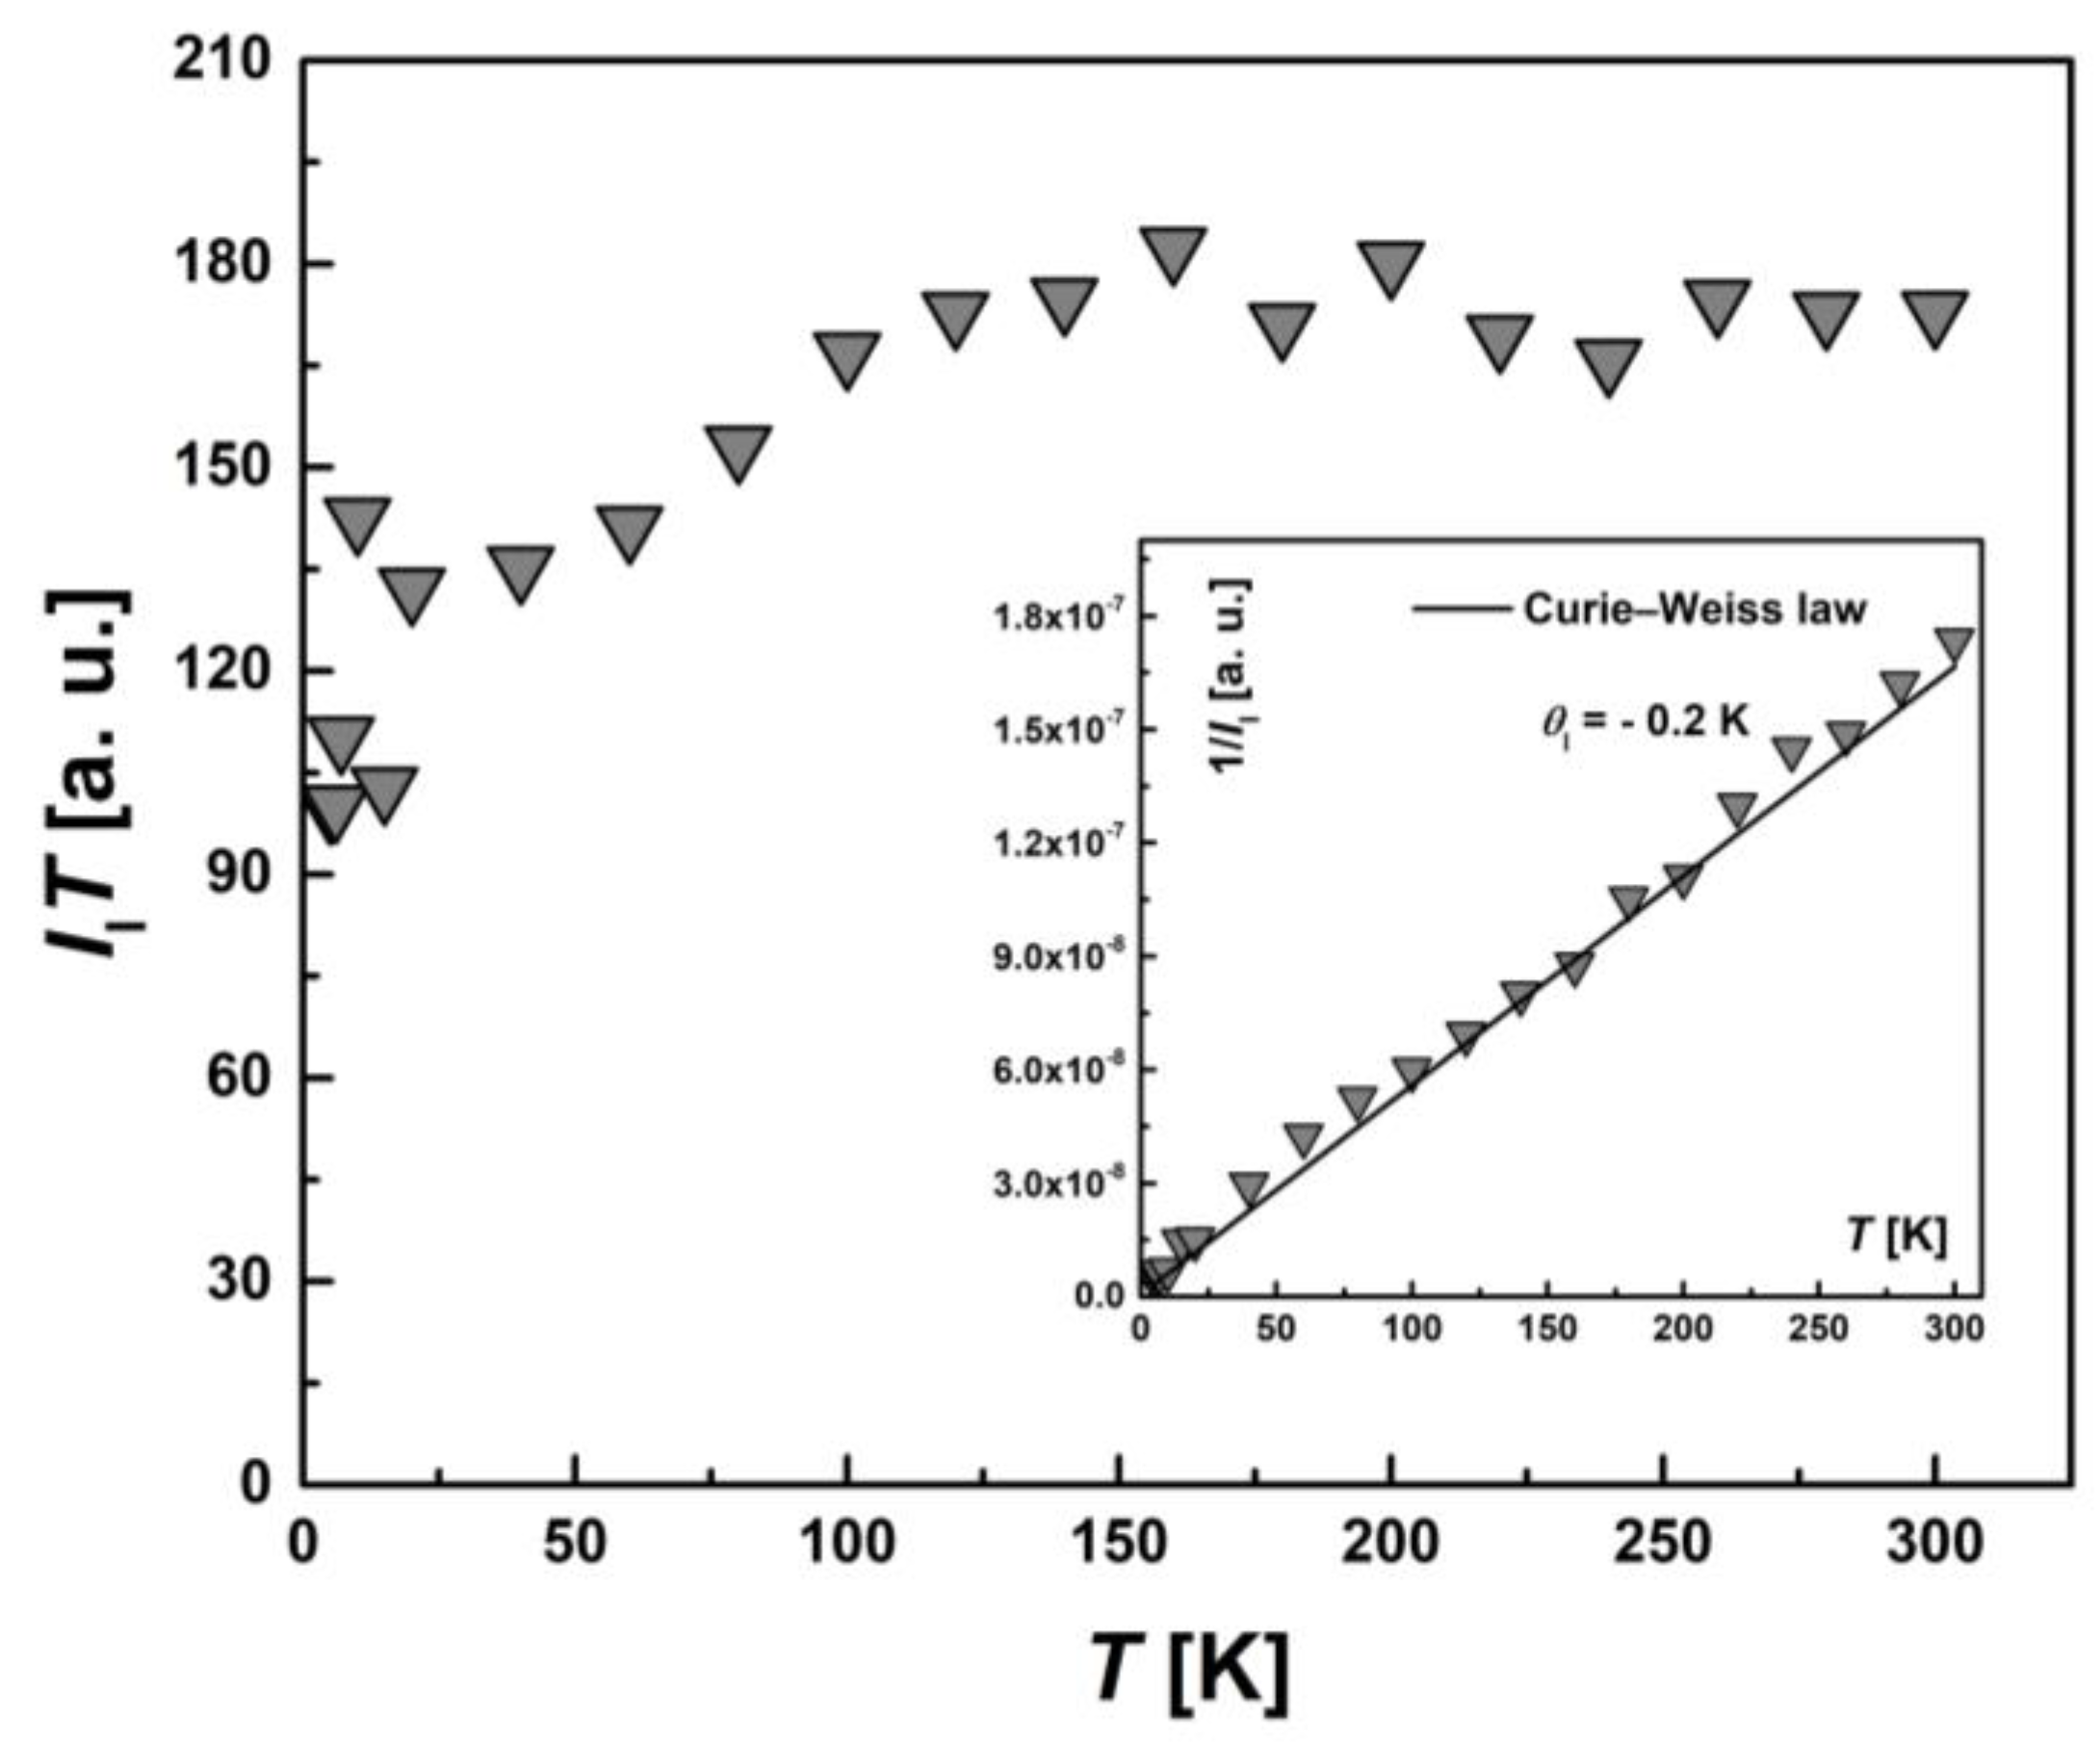
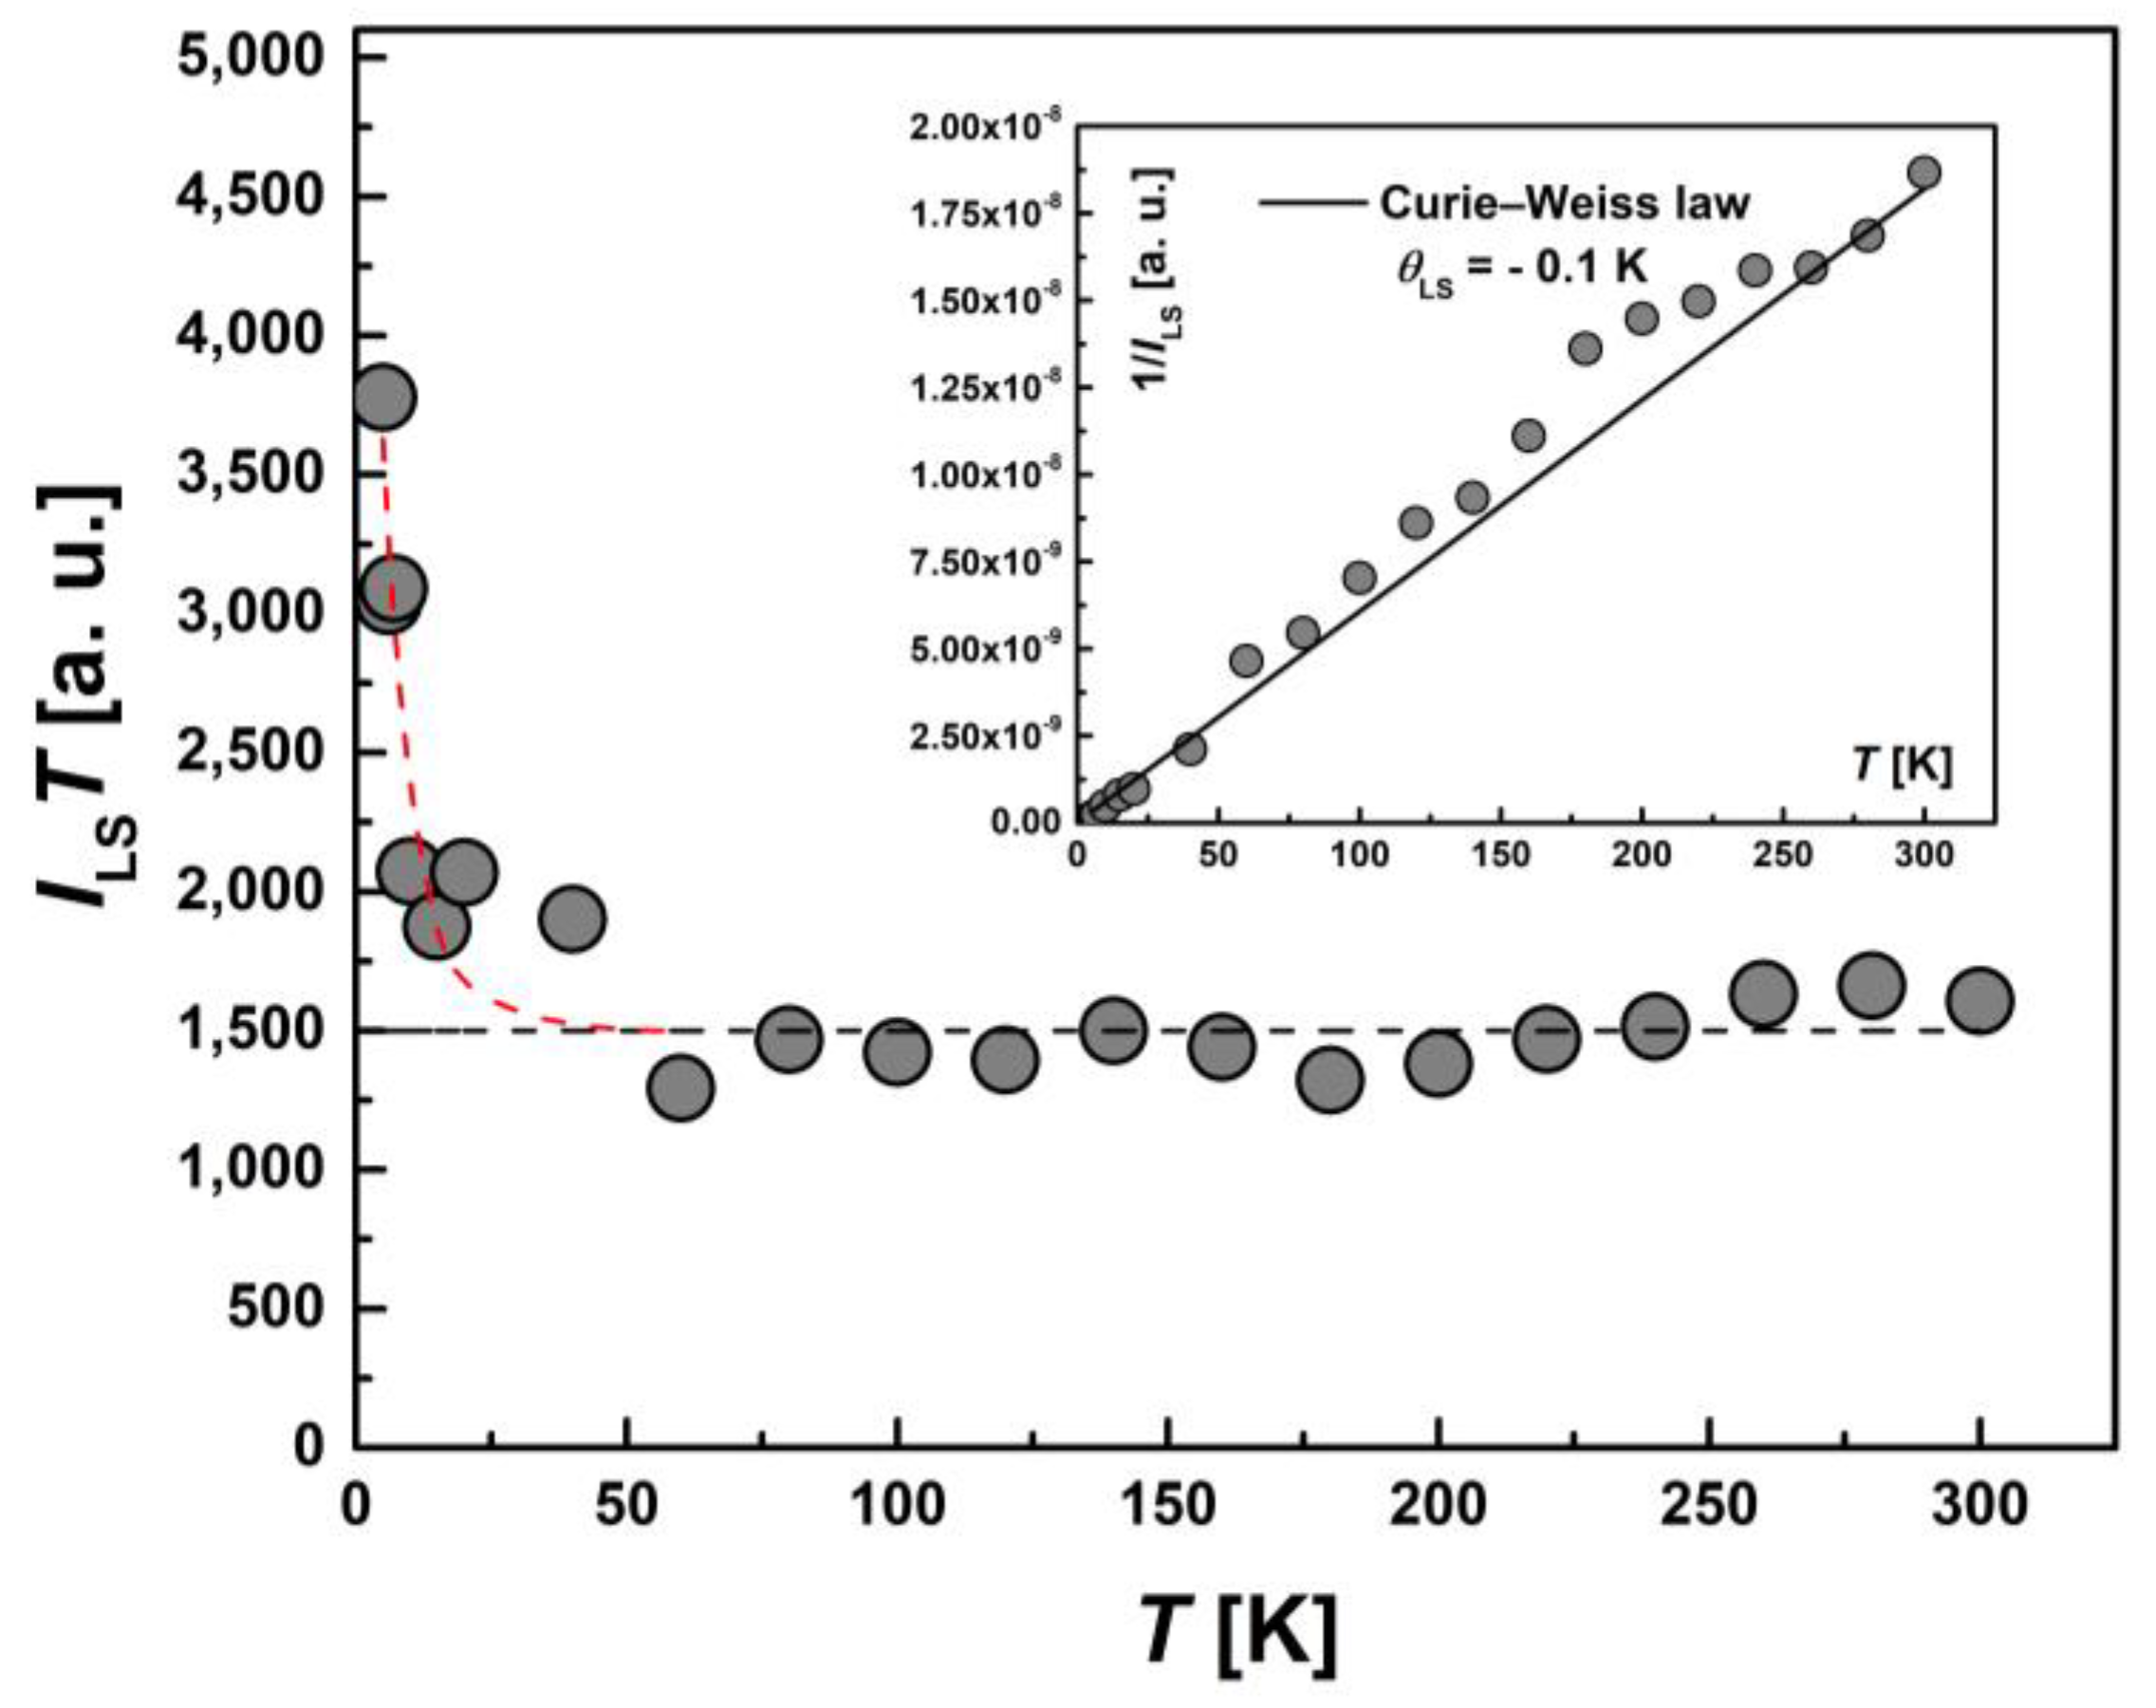
To examine the magnetic characteristics of individual contributions from HS (types I and II) and LS Fe(III) ions, the corresponding lines in the EPR spectrum were analyzed separately. The temperature dependence of the integral intensity, I(T), in the form of the product I∙T and 1/I (the inset) for I-type HS centers, II-type HS centers and LS Fe(III) centers are presented in Figure 11, Figure 12 and Figure 13, respectively. The temperature dependences of the inverse integral intensities 1/II, 1/III and 1/ILS obey the Curie–Weiss law with θI = −0.2 K, θII = −0.8 K and θLS = −0.1 K, respectively. As can be seen from the analysis of the individual contributions of HS (I and II-types) and LS Fe(III) ions, the main contribution is made by III(T). The contribution of I-type HS centers remains approximately the same over the entire temperature range and is about 1–2% of the total number of centers. The position, Hres(T), and the EPR line width, ΔH(T), of the signal from I-type HS centers remain unchanged with temperature. It can be assumed that this type of Fe(III) centers are paramagnetic, do not participate in the spin transition and probably belong to single-boundary Fe centers, while a partial spin transition is observed between II-type HS centers and LS centers at low temperatures. This is confirmed by the temperature dependence of the ILS∙T (Figure 13). At T < 50 K, a sharp increase in the ILS∙T value is observed, whereas at higher temperatures, it is constant. The contributions of LS and II-type HS states were estimated, which were γLS1 ≈ 9%, γHS1 ≈ 89% at 300 K and γLS2 ≈ 22%, γHS2 ≈ 71% at 20 K, respectively. These contributions from II-type HS centers and LS centers are in good agreement with those obtained using SQUID magnetometry (Figure 5). As in the case of I-type HS centers, the g-factor and ΔHLS(T) from LS centers remain constant with temperature. For this reason, and also in view of the close-to-zero θLS value, the LS Fe(III) spins can be treated as non-interacting. This validates the M(H) approximation (Figure 7), which indicates that the ground state of [FeL2Bipy] at 2.0 K can only be accurately described by assuming the contribution of LS Fe(III) ions remains temperture-independent following the spin-crossover transition—that is, LS states persist in a paramagnetic state.

Figure 11.
Temperature dependence of the EPR lines integrated intensity, II(T), for I-type HS Fe(III) centers in the form of the product, II∙T. Inset: the temperature dependence of the inverse intensity, 1/II(T). The solid line corresponds to calculations using the Curie–Weiss law with θI = −0.2 K.
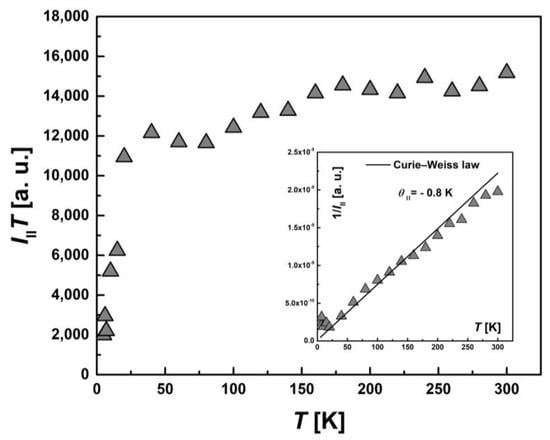
Figure 12.
Temperature dependence of the EPR lines integrated intensity, III(T), for II-type HS Fe(III) centers in the form of the product, III∙T. Inset: the temperature dependence of the inverse intensity, 1/III (T). The solid line corresponds to calculations using the Curie–Weiss law with θII = −0.8 K.
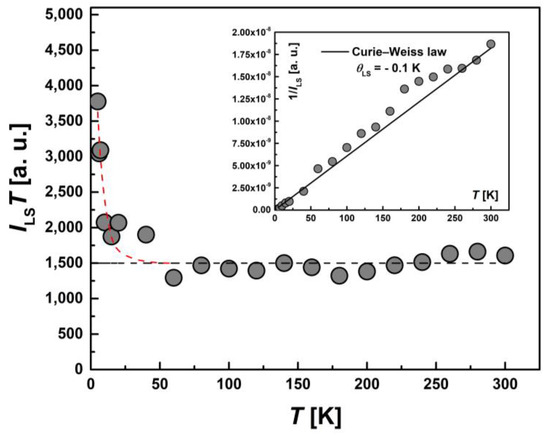
Figure 13.
Temperature dependence of the EPR lines integrated intensity, ILS(T), for LS Fe(III) centers in the form of the product, ILS∙T. The black line corresponds to the temperature-independent contribution of LS centers at high temperatures, and the red line corresponds to the increase in the number of LS centers due to the spin transition at T < 50 K. Inset: the temperature dependence of the inverse intensity, 1/ILS(T). The solid line corresponds to calculations using the Curie–Weiss law with θLS = −0.1 K.
In contrast to the above-discussed I-type HS and LS Fe(III) centers, Hres(T) and ΔH(T) for II-type HS centers, shown in Figure 14, demonstrate a significant temperature dependence. Both of these parameters change oppositely to each other: the line width increases and the resonance field decreases with decreasing temperature. Thus, the EPR results show that only the II-type HS Fe(III) sub-system is magnetically active. A partial SCO transition occurs in it and, probably, AFM-correlated dimers are formed due to π-π bonding of aromatic groups, while the I-type HS and LS centers are in PM state.
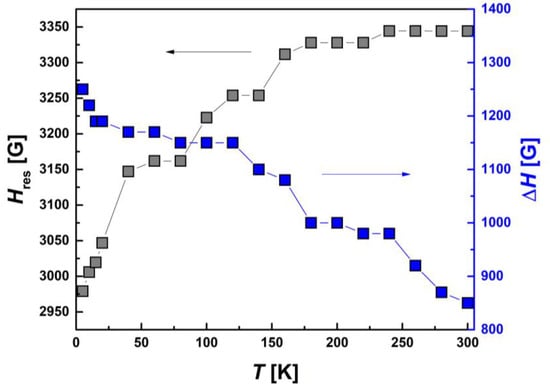
Figure 14.
Temperature dependences of the resonance magnetic field, Hres(T), and EPR line width, ΔH(T), for II-type HS Fe(III) centers.
3. Experimental Section
3.1. Materials
All commercially obtained reagents were of chemically pure grade and used as received. Organic solvents were freshly distilled before use.
3.2. Methods
FT-IR spectra were recorded on a Vertex 80V device (Bruker, Ettlingen, Germany) in range of 7500–210 cm−1 in KBr and CsBr pellets. 1H, 13C NMR spectral studies were carried out on Avance 500 (Bruker, Ettlingen, Germany) (500.13 MHz) in CDCl3 solvents with TMS as an internal standard. Gas chromatography was conducted on Maestro Alfa MS (Interlab, Moscow, Russia). Mass spectra were recorded on a time-of-flight mass spectrometer AXIMA Confidence (Shimadzu Biotech, Kyoto, Japan) with matrix-associated laser desorption; 2,5-dihydroxybenzoic acid was the matrix. The decomposition temperature was obtained on the TG 209 F1 analyzer (NETZCH, Selb, Germany) under argon flow at 10 K/min rate to 500 °C. Differential scanning calorimetry measurements were carried out on the DSC 204 F1 Phoenix device with μ-sensor (NETZCH, Selb, Germany). The scan rate at heating and cooling was 10 K/min in argon atmosphere. The presence of Fe, Br, Cl ions was determined by X-ray fluorescence spectrometer Clever C-31 (Eleran, Electrostal, Russia) in the following conditions: voltage—25 kV, current—600 μA, without filter, time—60 s, air, anode of x-ray tube—rhodium. The elemental analysis (CHN) was carried out using a FlashEA 1112 analyzer (Thermo Scientific, Waltham, MA, USA).
The steady-state absorption spectra of Fe(III) complex in DCM (CH2Cl2) solution were recorded using the CM 2203 spectrometer (SOLAR, Minsk, Belarus) within the molar concentration range of 10−7 to 10−5 M at T = 298 K. The steady-state fluorescence spectra of Fe(III) complex in DCM solution were measured with the FluoTime 300 (PicoQuant, Berlin, Germany), employing an excitation wavelength of 350 nm. The time-resolved fluorescence measurements were carried out by means of FluoTime 300 (PicoQuant, Berlin, Germany) spectrometer, with a LED at 290 nm (PicoQuant, Germany) as the excitation source. The fluorescence quantum yield (QYFL) of Fe(III) complex in DCM solution was determined on the FluoTime 300 (PicoQuant, Berlin, Germany), utilizing an integration sphere with an excitation wavelength of 350 nm.
The conformational screening was carried out for the cationic form Fe(III) complex by means of GFN2-xTB in the CREST package [35]. Subsequently, the geometry of the most stable conformer was optimized in the ground state using ωB97X-D/def2-SVP/def2-TZVPP (for Fe) [36,37] in the Gaussian 16 software package [38]. The absence of imaginary frequencies confirmed the energy minima of the optimized geometry. Additionally, TDDFT analysis was performed at the same level of theory, wherein the first 50 singlet excited states were calculated. The effect of chloroform on the spectral characteristics was taken into account in the SMD (solvation model based on density) model. The UCSF Chimera v. 1.15 [39] and ChemCraft 1.8 [40] were used to analyze the results and molecular graphics.
The magnetic properties were measured using MPMS XL7 SQUID magnetometry (Quantum Design, San Diego, CA, USA) at 2.0 < T< 300 K. Temperature dependency of the static magnetic susceptibility, χ, was measured using zero-field cooled (ZFC) protocols within the magnetic field H = 100 Oe. Field dependency of magnetization, M, was obtained at T = 2.0 K within the range of −70 kOe–+70 kOe.
The EPR properties were measured using a CW-EPR ER200 SRC (EMXplus), spectrometer (X-band, 9.41 GHz) (Bruker, Ettlingen, Germany) in the temperature range from 5.0 to 300 K using a cryostat ER 4112HV (Bruker, Ettlingen, Germany) and a digital temperature-control system ER 4131VT (Bruker, Ettlingen, Germany). The temperature dependence of the spin contribution to the magnetic susceptibility was estimated by the double integration of the EPR signal (Schumacher–Slichter method) provided that the sweep width δHsw > 5ΔH, where ΔH is the EPR linewidth.
3.3. Chemical Synthesis
3.3.1. Synthesis of 1-(4-Fluoro-phenyl)-3-(4-bromo-phenyl)-propane-1,3-dione, F-DK-Br (Ligand) [41]
A suspension of NaH (0.6 g) in mineral oil was brought to a boil in THF (20 mL). Solutions of 4′-fluoroacetophenone (3 g, 21.72 mmol) and ethyl 4-bromobenzoate (9.95 g, 43.44 mmol) were dissolved in THF (30 mL) and slowly added to the reaction mixture. The reaction was carried out at boiling for 4 h and then left at room temperature with stirring for 12 h. Then, the reaction mass was poured into 400 mL of distilled water and acidified with HCl up to pH = 2. The product was extracted with CH2Cl2, the organic layer was dried over anhydrous Na2SO4, and the solvent was distilled off. The yellow dry residue was recrystallized from MeOH. The product is a light-yellow powder. Yield: 2.7 g (38%). mp 124 °C. Anal.: Calculated (%): C 56.1, H 3.14, O 9.96. C15H10BrFO2. Found (%): C 56.09, H 3.15, O 10.01. FT-IR, v, cm−1: 3546–3416 (s br, ν(C–OH) of enol), 3102, 3056 (w, C-Har), 1607–1586 (s, C=O of enol). 1H NMR (CDCl3, δ, ppm): 16.79 (s br, 1H, OH of enol), 8.01–7.98 (m, 2H, Ar-H), 7.84–7.82 (d, 2H, Ar-H), 7.63–7.61 (d, 2H, Ar-H), 7.18–7.15 (t, 2H, Ar-H), 6.75 (s, 1H, C(OH)=CH–CO). 13C NMR (CDCl3, δC, ppm): 185.66 (C=O), 184.34 (C(OH)=CH–CO), 166.94 (Car–F), 134.57, 132.4, 130.11, 130.04, 128.99, 127.76 (Car–Br), 116.38, 116.21, 93.08 (C(OH)=CH–CO). MS, m/z: Calculated 321.14; found 321.1 [M+].
3.3.2. Synthesis of Iron(III) Bis[1-(4-fluoro-phenyl)-3-(4-bromo-phenyl)propane-1,3-dionate](2,2′-bipyridine) chloride,[FeL2Bipy]Cl
In a three-neck flask, a sample of 1-(4-fluoro-phenyl)-3-(4-bromo-phenyl)-propane-1,3-dione (0.52 g, 1.62 mmol) was dissolved in ethanol (20 mL) at reflux. A 1M NaOH solution (2 mL) was added dropwise. A powder form of 2,2′-bipyridine (0.13 g, 0.81 mmol) was added. Then, a solution of FeCl3 (0.13 g, 0.81 mmol) in ethanol was poured from a dropping funnel. The reaction was carried out with heating (80 °C) for 5 h and then at RT for 12 h. Then, the reaction mass was brought to a boil, filtered on a glass filter and washed with hot ethanol. The product was lyophilized from benzene. The product is a fine dark-red powder. Yield: 0.28 g (40%). Anal.: Calculated (%): C 54.11, H 2.95, N 3.15. C40H26Br2F2N2O4FeCl. Found (%): C 55.03, H 2.35, N 3.18. MS, m/z: Calculated 905.92; found 903.36 [M+NH4]+.
4. Conclusions
We reported syntheses and structure with physical properties (static magnetic susceptibility and magnetization, EPR and spectral characteristics) of the new Fe3+ β-diketonate complex, [FeL2Bipy]Cl. As demonstrated by differential scanning calorimetry data, the complex is characterized by an amorphous glassy phase devoid of a clearly defined melting point. Solutions of the Fe complex in dichloromethane exhibit weak fluorescence (QYFL = 1%) with an emission maximum at 435 nm. Furthermore, solid-state emission is exhibited by the substance when irradiated at a wavelength of 356 nm.
Magnetic measurements reveal that at T > 75 K, complex [FeL2Bipy]Cl is predominantly in the high-spin (HS, S = 5/2) state of Fe3+ ions with a small admixture of low-spin (LS, S = 1/2) state. The corresponding molar spin contributions are γHS1 = 93% and γLS1 = 7%. At T* ≈ 46 K, a partial spin-crossover transition (SCO, 5/2↔1/2) was detected. As a result of this process, the new magnetic state is realized with γHS2 = 76%, γLS2 = 24%. In the range 90 < T < 300 K, the complex exhibits weak AFM correlations between the neighboring Fe3+ ions with ΘI = −0.79 K; after partial SCO in the range 10 < T < 35 K, an increase in AFM interactions with θII = -2.3 K is observed. A theoretical model was proposed to describe χ(T). Analysis of the ground spin state at 2.0 K showed that most of the LS states of Fe3+ ions, as well as part of the HS states, the share of which is γHS ~53%, do not participate in exchange interactions.
It was proposed that π-π bonding of the aromatic groups of the neighboring SCO complexes is responsible for the formation of AFM-coupled HS Fe3+ dimers. It was shown that not all Fe3+ ions are involved in AFM interactions in the ground spin state at 2.0 K, as some of them (HS and LS) are in the paramagnetic state.
EPR studies confirmed the presence of LS and HS Fe3+ centers and allowed to distinguish I-type (strong low-symmetry field) and II-type HS centers (weak distorted octahedral field). Theoretical modeling of experimental spectra was carried out and the basic magneto-resonance parameters were obtained. The temperature dependences of the EPR intensities, I(T), of the HS and LS centers were analyzed. SCO was detected by a sharp change of the product ILS∙T. The temperature-independent behavior of the Hres(T) and ΔH(T) of the I-type HS centers, as well as their low concentration ~2%, allowed to assume that they belong to single-boundary Fe centers; as a result, they are paramagnetic and do not participate in the spin transition. Thus, only the II-type HS centers participate in SCO and AFM interactions.
Supplementary Materials
The following supporting information can be downloaded at: https://www.mdpi.com/article/10.3390/inorganics13050134/s1. Figure S1. XRF spectrum of iron(III) bis[1-(4-fluoro-phenyl)-3-(4-bromo-phenyl)propane-1,3-dionate](2,2′-bipyridine) chloride; Figure S2. MIR spectrum of iron(III) bis[1-(4-fluoro-phenyl)-3-(4-bromo-phenyl)propane-1,3-dionate](2,2′-bipyridine) chloride and both ligands; Figure S3. TG and DTG analysis data of iron(III) bis[1-(4-fluoro-phenyl)-3-(4-bromo-phenyl)propane-1,3-dionate](2,2′-bipyridine) chloride; Figure S4. DSC curve of iron(III) bis[1-(4-fluoro-phenyl)-3-(4-bromo-phenyl)propane-1,3-dionate](2,2′-bipyridine) chloride, heating cycle; Figure S5. Fluorescence decay of [FeL2Bipy]Cl; Figure S6. TDDFT spectrum of [FeL2Bipy]Cl; Table S1. The XYZ coordinates of optimized [FeL2Bipy]Cl; Table S2. Some structural parameters of [FeL2Bipy]Cl; Table S3. Results of TDDFT analysis of [FeL2Bipy]Cl.
Author Contributions
Conceptualization: D.V.S., V.E.V., M.S.G. and U.V.C.; methodology: D.V.S., V.E.V., M.S.G., U.V.C., A.A.K., A.S.V. and I.V.Y.; validation: D.V.S., V.E.V. and M.S.G.; formal analysis: D.V.S., V.E.V., M.S.G., U.V.C. and A.A.K.; resources: M.S.G.; data curation: M.S.G.; writing—original draft preparation: D.V.S., V.E.V., M.S.G., U.V.C. and A.A.K.; writing—review and editing: D.V.S., V.E.V., M.S.G. and U.V.C.; supervision: M.S.G.; funding acquisition: M.S.G.; visualization: M.S.G., A.S.V. and I.V.Y. All authors have read and agreed to the published version of the manuscript.
Funding
This work was supported by the Russian Science Foundation (Project number no. 23-13-00015).
Data Availability Statement
The original contributions presented in this study are included in the article/Supplementary Material. Further inquiries can be directed to the corresponding author.
Acknowledgments
Spectral and DSC research was conducted on the equipment of the Upper Volga region Centre of Physico-chemical Research. EPR measurements were carried out using the equipment of the Zavoisky Physical-Technical Institute, FRC Kazan Scientific Center of RAS.
Conflicts of Interest
The authors declare that they have no conflict of interest.
References
- Vigato, P.A.; Peruzzo, V.; Tamburini, S. The evolution of β-diketone or β-diketophenol ligands and related complexes. Coord. Chem. Rev. 2009, 253, 1099–1201. [Google Scholar] [CrossRef]
- Gaspar, R.D.L.; Fortes, P.R.; Mazali, I.O.; Sigoli, F.A.; Raimundo, I.M., Jr. Optical Temperature Sensors Based on Europium(III) Beta-Diketonate Complexes Chemically Bonded to Functionalized Polydimethylsiloxane. Chem. Sel. 2018, 3, 10491–10501. [Google Scholar] [CrossRef]
- Bezzubov, S.I.; Zharinova, I.S.; Khusyainova, A.A.; Kiselev, Y.M.; Taydakov, I.V.; Varaksina, E.A.; Metlin, M.T.; Tobohova, A.S.; Korshunov, V.M.; Kozyukhin, S.A.; et al. Aromatic β-Diketone as a Novel Anchoring Ligand in Iridium(III) Complexes for Dye-Sensitized Solar Cells. Eur. J. Inorg. Chem. 2020, 2020, 3277–3286. [Google Scholar] [CrossRef]
- Pousaneh, E.; Korb, M.; Assim, K.; Rüffer, T.; Dzhagan, V.; Noll, J.; Zahn, D.R.T.; Schulz, S.E.; Lang, H. Iron(III) β-diketonates: CVD precursors for iron oxide film formation. Inorg. Chim. Acta 2019, 487, 1–8. [Google Scholar] [CrossRef]
- Martins, J.P.; Martín-Ramos, P.; Coya, C.; Ramos Silva, M.; Eusebio, M.E.S.; de Andrés, A.; Álvarez, Á.L.; Martín-Gil, J. Highly luminescent pure-red-emitting fluorinated β-diketonate europium(III) complex for full solution-processed OLEDs. J. Lumin. 2015, 159, 17–25. [Google Scholar] [CrossRef]
- Wang, R.; Gao, H.; Yu, R.; Jia, H.; Ma, Z.; He, Z.; Zhang, Y.; Yang, J.; Zhang, L.; Tan, Z. β-Diketone Coordination Strategy for Highly Efficient and Stable Pb–Sn Mixed Perovskite Solar Cells. J. Phys. Chem. Lett. 2021, 12, 11772–11778. [Google Scholar] [CrossRef]
- Nehra, K.; Dalal, A.; Hooda, A.; Bhagwan, S.; Saini, R.K.; Mari, B.; Kumar, S.; Singh, D. Lanthanides β-diketonate complexes as energy-efficient emissive materials: A review. J. Mol. Struct. 2022, 1249, 131531. [Google Scholar] [CrossRef]
- Schwieger, S.; Herzog, R.; Wagner, C.; Steinborn, D. Platina-β-diketones as catalysts for hydrosilylation and their reactivity towards hydrosilanes. J. Organomet. Chem. 2009, 694, 3548–3558. [Google Scholar] [CrossRef]
- Wolf, L.; Butter, E.; Weinelt, H. Über die Darstellung höherer β-Diketonkomplexe des Eisens, Rutheniums und Rhodiums. Z. Anorg. Und allgemeine Chemie 1960, 306, 87–93. [Google Scholar] [CrossRef]
- Eng, S.J.; Motekaitis, R.J.; Martell, A.E. The effect of end-group substitutions and use of a mixed solvent system on β-diketones and their iron complexes. Inorg. Chim. Acta 1998, 278, 170–177. [Google Scholar] [CrossRef]
- Twigg, M.V.; Burgess, J. Iron. In Comprehensive Coordination Chemistry II. From Biology to Nanotechnology, Volume 5 (Transition Metal Groups 7 and 8); McCleverty, J.A., Meyer, T.J., Eds.; Elsevier: Amsterdam, The Netherlands, 2003; p. 500. [Google Scholar]
- Matsushita, M.M.; Yasuda, T.; Kawano, R.; Kawai, T.; Iyoda, T. Intramolecular Magnetic Interaction of Phenylene-Linked Bis-β-diketone Metal Complexes. Chem. Lett. 2000, 29, 812–813. [Google Scholar] [CrossRef]
- Guedes, G.P.; Florencio, A.S.; Carneiro, J.W.d.M.; Vaz, M.G.F. Mononuclear and dinuclear iron(III) compounds with β-diketonate ligands: Synthesis, magnetic behavior and DFT calculations. Solid State Sci. 2013, 18, 10–16. [Google Scholar] [CrossRef]
- Nihei, M.; Shiga, T.; Maeda, Y.; Oshio, H. Spin crossover iron(III) complexes. Coord. Chem. Rev. 2007, 251, 2606–2621. [Google Scholar] [CrossRef]
- Dey, B.; Mondal, A.; Konar, S. Effect of ligand field strength on the spin crossover behavior in 5-X-SalEen (X=Me, Br and OMe) based Fe(III) complexes. Chem. Asian J. 2020, 15, 1709–1721. [Google Scholar] [CrossRef]
- Kumar, K.S.; Bayeh, Y.; Gebretsadik, Y.; Elemo, F.; Gebrezgiabher, M.; Thomas, M.; Ruben, M. Spin-crossover in iron(II)-Schiff base complexes. Dalton Trans. 2019, 48, 15321–15337. [Google Scholar] [CrossRef]
- Gruzdev, M.S.; Domracheva, N.E.; Chervonova, U.V.; Kolker, A.M.; Golubeva, A.S. Bis-chelate Fe(III) complex of an azomethine at the focal point of a branched ester functionalized with cyclohexylbenzoic acid. J. Coord. Chem. 2012, 65, 1812–1820. [Google Scholar] [CrossRef]
- Muraškova, V.; Eigner, V.; Dušek, M.; Sedmidubsky, D. Iron(III) and cobalt(III) complexes with pentadentate pyridoxal Schiff base ligand—Structure, spectral, electrochemical, magnetic properties and DFT calculations. Polyhedron 2021, 197, 115019. [Google Scholar] [CrossRef]
- Gentili, D.; Cavallini, M. Wet-lithographic processing of coordination compounds. Coord. Chem. Rev. 2013, 257, 2456–2467. [Google Scholar] [CrossRef]
- Juráková, J.; Midlíková, J.D.; Hrubý, J.; Kliuikov, A.; Santana, V.T.; Pavlik, J.; Moncoľ, J.; Čižmár, E.; Orlita, M.; Mohelský, I.; et al. Pentacoordinate cobalt(II) single ion magnets with pendant alkyl chains: Shall we go for chloride or bromide? Inorg. Chem. Front. 2022, 9, 1179–1194. [Google Scholar] [CrossRef]
- Cavallini, M.; Gentili, D.; Greco, P.; Valle, F.; Biscarini, F. Micro- and nanopatterning by lithographically controlled wetting. Nat. Protoc. 2012, 7, 1668–1676. [Google Scholar] [CrossRef]
- Mallah, T.; Cavallini, M. Surfaces, thin films and patterning of spin crossover compounds. C. R. Chimie 2018, 21, 1270–1286. [Google Scholar] [CrossRef]
- Claisen, L. Uber die Einführung von Säureradicalen in Ketone. Ber. Dtsch. Chem. Ges. 1887, 20, 655–657. [Google Scholar] [CrossRef]
- Kaes, C.; Katz, A.; Hosseini, M.W. Bipyridine: The most widely used ligand. A review of molecules comprising at least two 2,2′-bipyridine units. Chem. Rev. 2000, 100, 3553–3590. [Google Scholar] [CrossRef] [PubMed]
- Starnovskaya, E.S.; Kopchuk, D.S.; Khasanov, A.F.; Tanya, O.S.; Santra, S.; Giri, K.; Rahman, M.; Kovalev, I.S.; Zyryanov, G.V.; Majee, A.; et al. Synthesis and photophysics of new unsymmetrically substituted 5,5′-diaryl-2,2′-bypiridine-based “push-pull” fluorophores. Dye. Pigment. 2019, 162, 324–330. [Google Scholar] [CrossRef]
- Chervonova, U.V.; Bichan, N.G.; Ksenofontov, A.A.; Gruzdev, M.S. Heterofunctional β-diketones incorporating ester linkages: Mesomorphism and solvatochromic effect. J. Mol. Liq. 2025, 417, 126572. [Google Scholar] [CrossRef]
- Nakamoto, K. Infrared and Raman Spectra of Inorganic and Coordination Compounds, Part B: Applications in Coordination, Organometallic, and Bioinorganic Chemistry, 6th ed; John Wiley & Sons, Inc.: Hoboken, NJ, USA, 2009; 424p. [Google Scholar]
- Halcrow, M.A. Spin-Crossover Materials: Properties and Applications; John Wiley & Sons, Ltd.: Chicheser, UK, 2013. [Google Scholar]
- Domracheva, N.; Vorobeva, V.; Pyataev, A.; Ivanova, A. Magnetic properties of novel dendrimeric iron(III) complexes of the first generation: EPR and Mössbauer study. Appl. Magn. Reson. 2016, 47, 903–913. [Google Scholar] [CrossRef]
- Kahn, O. Molecular Magnetism; Wiley-VCH: New York, NY, USA, 1993. [Google Scholar]
- Shvachko, Y.N.; Starichenko, D.V.; Korolyov, A.V.; Yagubskii, E.B.; Kotov, A.I.; Buravov, L.I.; Lyssenko, K.A.; Zverev, V.N.; Simonov, S.V.; Zorina, L.V. The Conducting Spin-Crossover Compound Combining Fe(II) Cation Complex with TCNQ in a Fractional Reduction State. Inorg. Chem. 2016, 55, 9121–9130. [Google Scholar] [CrossRef]
- Stoll, S.; Schweiger, A. EasySpin, a comprehensive software package for spectral simulation and analysis in EPR. J. Magn. Reson. 2006, 178, 42–55. [Google Scholar] [CrossRef]
- Stoll, S. Chapter Six—CW-EPR Spectral Simulations: Solid State. Methods Enzymol. 2015, 563, 121–142. [Google Scholar] [CrossRef]
- Poole, C.P., Jr. Electron Spin Resonance: A Comprehensive Treatise on Experimental Techniques; John Wiley & Sons, Ltd.: New York, NY, USA, 1983. [Google Scholar]
- Bannwarth, C.; Ehlert, S.; Grimme, S. GFN2-xTB—An Accurate and Broadly Parametrized Self-Consistent Tight-Binding Quantum Chemical Method with Multipole Electrostatics and Density-Dependent Dispersion Contributions. J. Chem. Theory Comput. 2019, 15, 1652–1671. [Google Scholar] [CrossRef]
- Schäfer, A.; Horn, H.; Ahlrichs, R. Fully optimized contracted Gaussian basis sets for atoms Li to Kr. J. Chem. Phys. 1992, 97, 2571–2577. [Google Scholar] [CrossRef]
- Chai, J.-D.; Head-Gordon, M. Long-range corrected hybrid density functionals with damped atom–atom dispersion corrections. Phys. Chem. Chem. Phys. 2008, 10, 6615–6620. [Google Scholar] [CrossRef] [PubMed]
- Frisch, M.J.; Trucks, G.W.; Schlegel, H.B.; Scuseria, G.E.; Robb, M.A.; Cheeseman, J.R.; Scalmani, G.; Barone, V.; Petersson, G.A.; Nakatsuji, H.; et al. Gaussian 16, Revision C.01; Gaussian, Inc.: Wallingford, CT, USA, 2016. [Google Scholar]
- Pettersen, E.F.; Goddard, T.D.; Huang, C.C.; Couch, G.S.; Greenblatt, D.M.; Meng, E.C.; Ferrin, T.E. UCSF Chimera—A visualization system for exploratory research and analysis. Comput. Chem. 2008, 25, 1605–1612. [Google Scholar] [CrossRef] [PubMed]
- Zhurko, G.A. Chemcraft—Graphical Program for Visualization of Quantum Chemistry Computations 2005, Version 1.8, Build 648. Available online: https://chemcraftprog.com (accessed on 21 April 2025).
- Chervonova, U.V.; Ksenofontov, A.A.; Gruzdev, M.S. Synthesis, Thermal, and Spectroscopic Properties of High-Temperature Photoactive Halogen-Substituted β-Boron Difluoride Diketonate. Russ. J. Phys. Chem. A 2024, 98, 3474–3480. [Google Scholar] [CrossRef]


Disclaimer/Publisher’s Note: The statements, opinions and data contained in all publications are solely those of the individual author(s) and contributor(s) and not of MDPI and/or the editor(s). MDPI and/or the editor(s) disclaim responsibility for any injury to people or property resulting from any ideas, methods, instructions or products referred to in the content. |
© 2025 by the authors. Licensee MDPI, Basel, Switzerland. This article is an open access article distributed under the terms and conditions of the Creative Commons Attribution (CC BY) license (https://creativecommons.org/licenses/by/4.0/).