Article

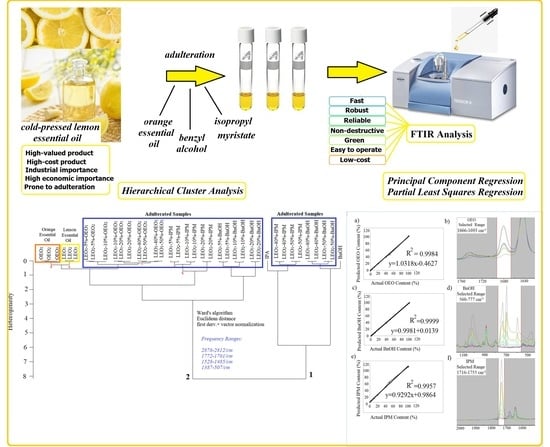
Detection of Orange Essential Oil, Isopropyl Myristate, and Benzyl Alcohol in Lemon Essential Oil by FTIR Spectroscopy Combined with Chemometrics

1
Department of Food Engineering, Faculty of Chemical and Metallurgical Engineering, Yıldız Technical University, 34210 İstanbul, Turkey
2
Department of Industrial Engineering, Faculty of Engineering, King Abdulaziz University, Jeddah 21589, Saudi Arabia
3
Department of Management Information Systems, College of Business Administration, Taibah University, Madinah 42353, Saudi Arabia
*
Author to whom correspondence should be addressed.
Foods 2021, 10(1), 27; https://doi.org/10.3390/foods10010027
Submission received: 21 November 2020 / Revised: 15 December 2020 / Accepted: 19 December 2020 / Published: 24 December 2020

Abstract

:
Essential oils are high-valued natural extracts that are involved in industries such as food, cosmetics, and pharmaceutics. The lemon essential oil (LEO) has high economic importance in the food and beverage industry because of its health-beneficial characteristics and desired flavor properties. LEO, similar to other natural extracts, is prone to being adulterated through economic motivations. Adulteration causes unfair competition between vendors, disruptions in national economies, and crucial risks for consumers worldwide. There is a need for cost-effective, rapid, reliable, robust, and eco-friendly analytical techniques to detect adulterants in essential oils. The current research developed chemometric models for the quantification of three adulterants (orange essential oil, benzyl alcohol, and isopropyl myristate) in cold-pressed LEOs by using hierarchical cluster analysis (HCA), principal component regression (PCR), and partial least squares regression (PLSR) based on FTIR spectra. The cold-pressed LEO was successfully distinguished from adulterants by robust HCA. PLSR and PCR showed high accuracy with high R2 values (0.99–1) and low standard error of cross-validation (SECV) values (0.58 and 5.21) for cross-validation results of the raw, first derivative, and second derivative FTIR spectra. The findings showed that FTIR spectroscopy combined with multivariate analyses has a considerable capability to detect and quantify adulterants in lemon essential oil.

Graphical Abstract

1. Introduction

Essential oils are natural lipidic substances extracted from fruits, vegetables, and spices, and they are used in many sectors throughout the whole world due to their unique pure and characteristic functional properties [1]. Flavor, fragrances, cosmetics, aromatherapy, and phytomedicine industries demand essential oils because of their unique characteristic properties [2]. Previous studies have shown that citrus essential oils have been used as natural preservatives, flavorings, antioxidants, antibacterial, and antifungal agents in various foods [3]. Citrus oils have found applications in the food sector throughout the world as flavoring agents in a wide variety of foodstuffs, such as beverages and confectionary, since they were announced as “generally recognized as safe” by food regulations.
Lemon essential oil is highly demanded in the food and beverage industry because of its health-beneficial characteristics (sedative, anxiolytic, antidepressant, and antispasmodic effects) and intrinsic flavor properties [4]. Lemon oil is used as an ingredient in body care products, cosmetics, and medications because of its desirable characteristic properties [5].
From an economic point of view, lemon essential oil as a high-value natural product has high economic importance worldwide with the exports and imports between countries. The price of authentic lemon essential oil is relatively high; thus, authentic lemon essential oil is prone to be adulterated through economic motivations. Adulteration causes unfair competition between vendors, disruptions in national economies, and crucial risks for consumers throughout the world [6]. Determination of the authenticity of essential oils such as lemon essential oil has crucial importance in terms of consumers, producers, importers, and exporters [7]. Previous studies showed that lemon essential oil was adulterated with cheaper sweet-orange oil and diluents such as benzyl alcohol, benzyl benzoate, isopropyl myristate, and phthalate esters, etc. [7,8]. The quality properties of lemon essential oil were defined by the international standard of lemon oil [9]. This standard defined the lemon essential oil as expression of the fresh fruit of Citrus limon without the aid of heat and with or without previous separation of the pulp and the pee [9]. Cold-pressed lemon oils are mainly used in cosmetic, perfume, pharmaceutical and food and beverage industries, and various cold-pressed extraction processes may be used for the production of lemon oil [10]. According to the standard, the quality of lemon oil was determined by the assessment of a lot of parameters such as appearance, color, odor, relative density, refractive index, optical rotation, acid value, carbonyl value and chromatographic profile. However, there is a need for rapid, strong, effective and reliable methodologies for the determination of the authenticity or adulteration of lemon essential oil. So far, researchers have performed quite limited studies on the adulteration of lemon essential oil. Adulteration of lemon essential oil was evaluated by using gas chromatography–combustion–isotope ratio mass spectrometry (GC–C–IRMS) and Gas Chromatography techniques in previous studies [8,10,11]. As an alternative technique, FTIR (Fourier transform infrared spectroscopy) can be used for the determination of the adulteration of lemon essential oil. Fourier transform infrared spectroscopy is known as a rapid, non-destructive, reliable, effective, and low-cost analytical technique that provides fingerprint information about the chemical structure of materials [12]. Up to now, FTIR spectroscopy combined with chemometrics has been used for the determination of adulterants in various food matrixes [13]. In addition, chemical composition or components of various essential oils were effectively evaluated by using FTIR spectroscopy [14,15,16,17]
The aim of this research was to detect three different adulterants in cold-pressed lemon essential oil by using FTIR spectroscopy in combination with chemometrics of HCA (hierarchical cluster analysis), PLSR (partial least squares regression), and PCR (principal component regression). To the best of our knowledge, this study is the first attempt for the determination of sweet orange oil, BnOH (benzyl alcohol), and IPM (isopropyl myristate) adulteration in a lemon essential oil utilizing FTIR technique combined with multivariate statistics. The safety assessment of benzyl alcohol and isopropyl myristate was reported in previous publications; isopropyl myristate and benzyl alcohol were reported to be safe as cosmetic ingredients [18,19]. However, detection of the dilution of lemon essential oil by IPM and BnOH is an important issue in terms of the authenticity of lemon essential oil.

2. Materials and Methods

2.1. Equipment

FTIR spectra were obtained by using Bruker Tensor 27 FTIR spectrometer (Bruker-Germany) in the spectral range of 400–4000 cm−1. FTIR spectrometer had an ATR (attenuated total reflectance) accessory with a diamond crystal. The commercial spectral library of Bruker (ATR FTIR Complete Library, composed of more than 20,000 reference spectra) was used for identity confirmation of used chemicals.

2.2. Essential Oils and Chemicals

The original cold-pressed lemon essential oils (n = 3) and cold-pressed orange essential oils (n = 3) were purchased from reliable (well-known) producer companies in Turkey. Benzyl alcohol (BnOH) and isopropyl myristate (IPM), with purity higher than 99%, were obtained from Zag Industrial chemicals (Turkey). Ethyl alcohol (Schuchardt, FRG, GC Merck > 98%) was used for cleaning diamond ATR crystal. Essential oils were stored at 4 °C prior to the FTIR analyses.

2.3. Sample Preparation

Three different cold-pressed lemon essential oils were coded as LEO1, LEO2, and LEO3. Three different cold-pressed orange essential oils were coded as OEO1, OEO2, and OEO3. Abbreviations of BnOH and IPM were used for benzyl alcohol and isopropyl myristate, respectively. LEO1, LEO2, and LEO3 were spiked with OEO1, OEO2, and OEO3, respectively, at the adulteration levels of 1%, 5%, 10%, 20%, 40%, and 50%. Additionally, three cold-pressed lemon essential oils (LEO1, LEO2, and LEO3) were spiked with BnOH and IPM at the concentrations of 1%, 5%, 10%, 20%, 40%, and 50%. In total, fifty-four adulterated samples were prepared for FTIR analyses. Samples were stored in amber glass vials (1.5 mL) prior to the spectral measurements. Additionally, an authentic cold-pressed lemon essential oil was purchased from the producer and separately spiked with OEO1, BnOH and IPM at the concentration of 1%, 4%, 8%, 16% and 32% (v/v) to test calibration models.

2.4. FTIR Measurements

All samples were kept at room temperature (25 °C) for 30 min prior to the FTIR analyses. An ATR accessory (single bounce) was used in all spectral acquisition. Spectral measurement parameters of resolution and accumulation were selected as 4 cm−1 and 16 scans, respectively. OPUS program Version 7.2 (Bruker Gmbh) was used for instrument control and data acquisition. Each sample was placed on a diamond ATR crystal with the help of a Pasteur pipette. The ATR crystal was cleaned with ethanol (80% v/v) prior to each spectral acquisition. The background air spectrum was scanned before each acquisition.

2.5. Chemometrics

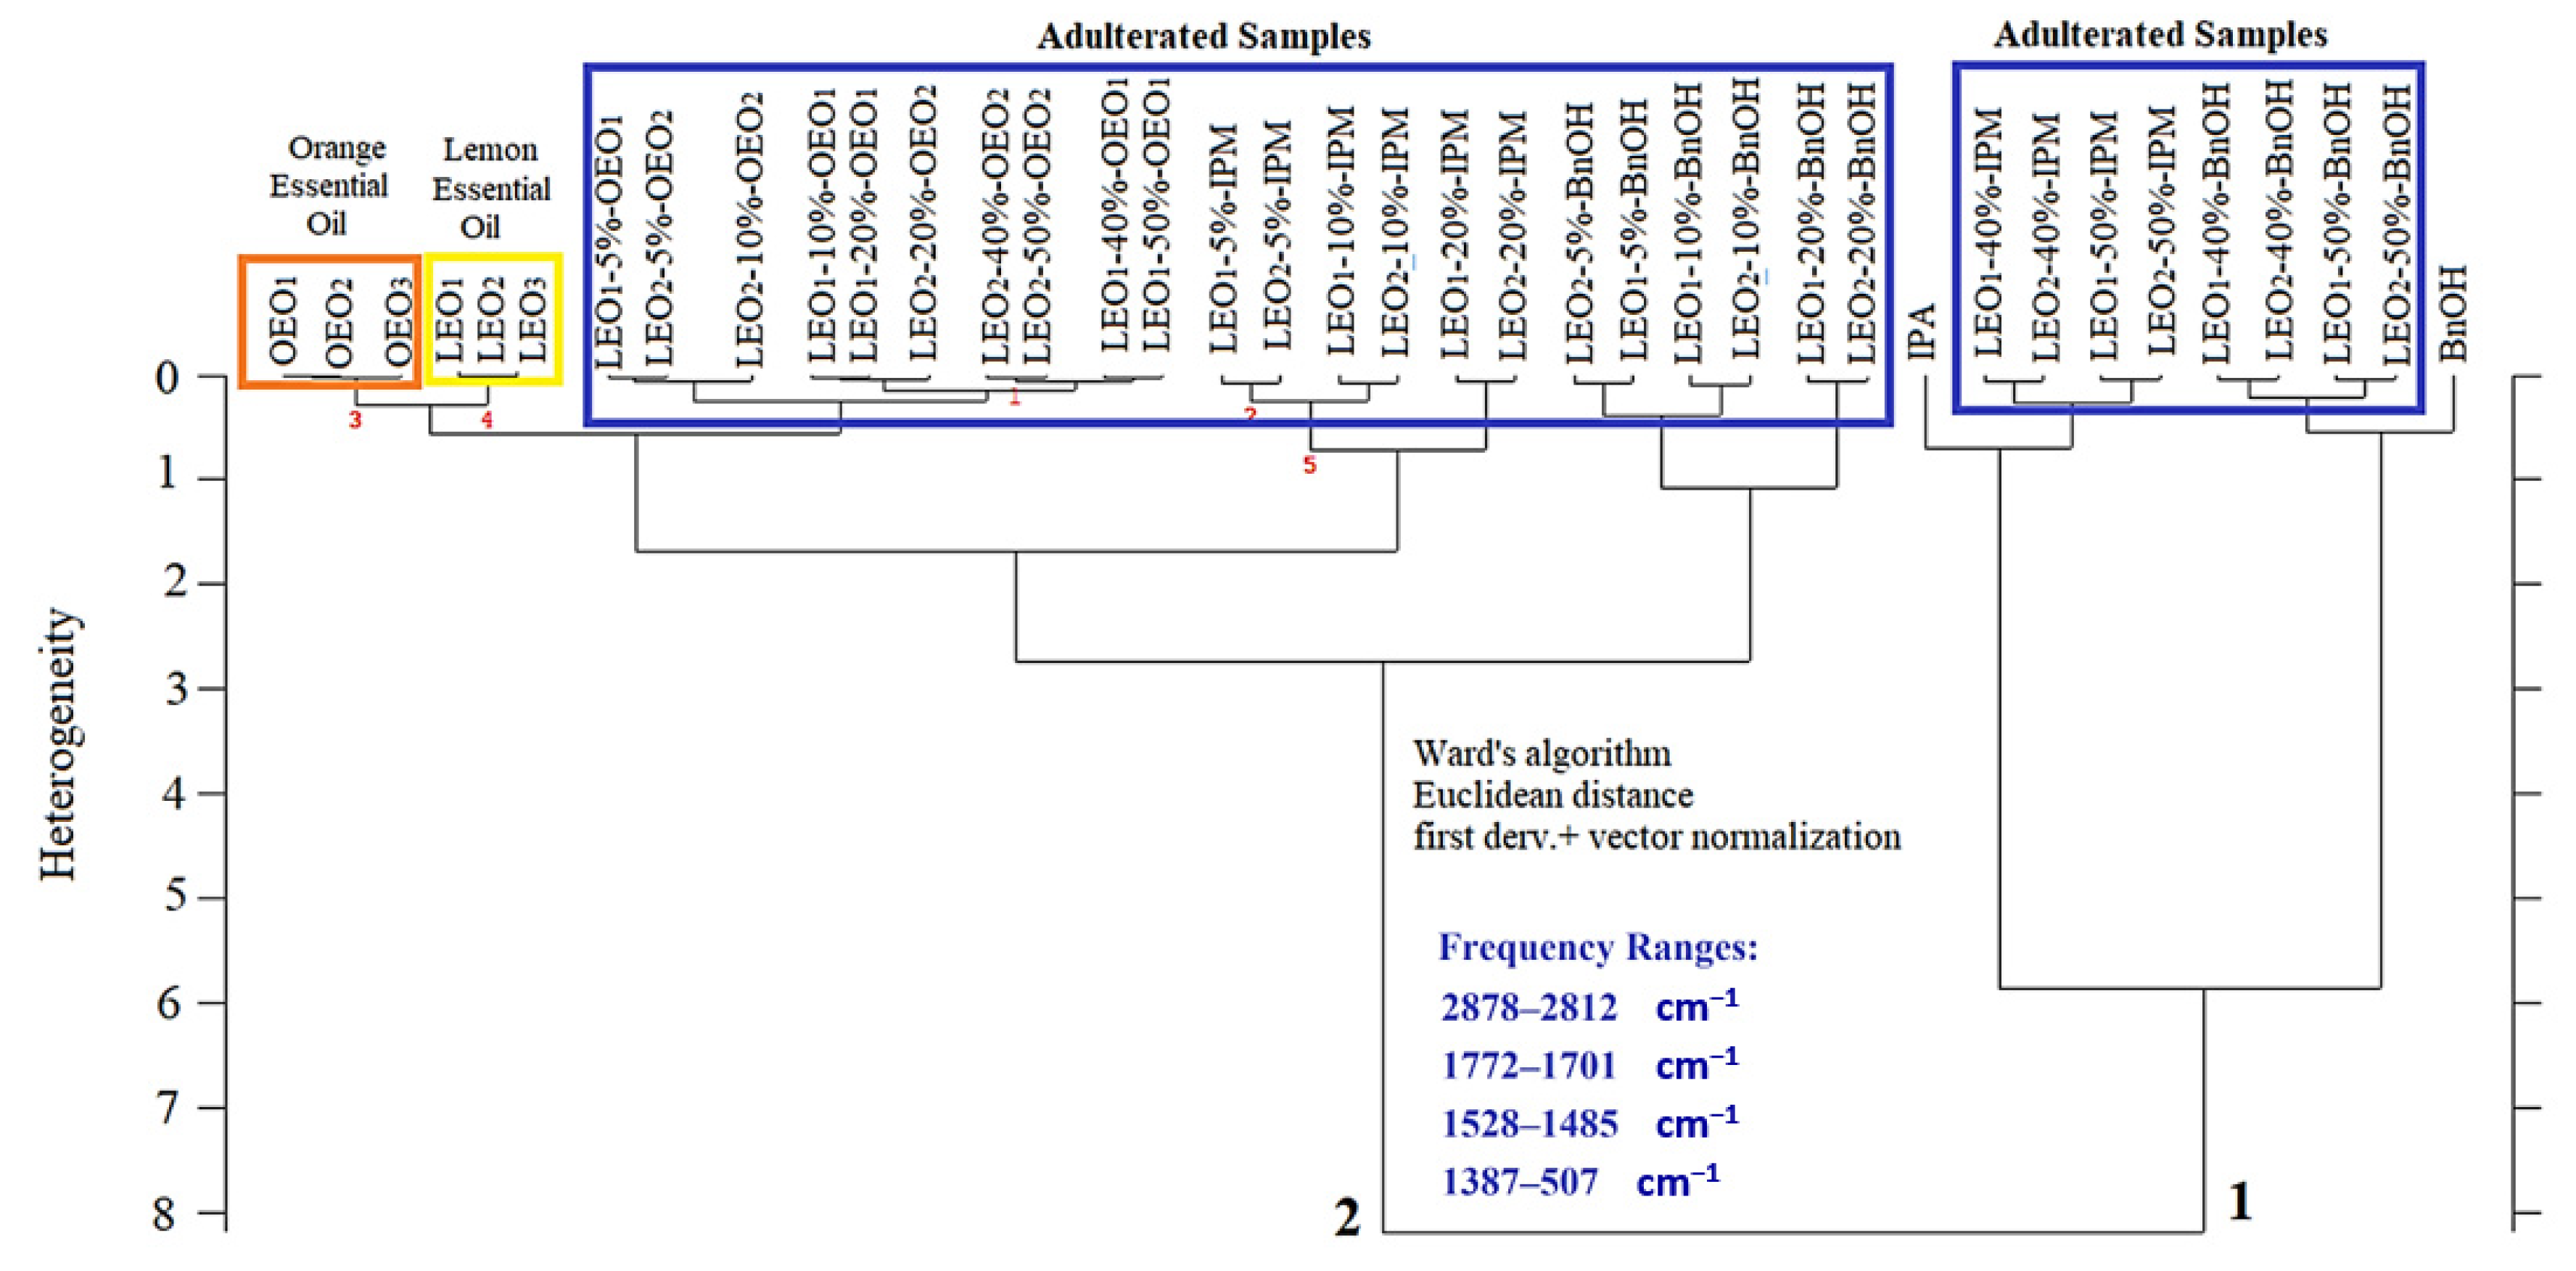
2.5.1. Hierarchical Cluster Analyses

Original cold-pressed lemon essential oils were discriminated from adulterated samples, orange essential oils, and chemicals on the basis of their FTIR spectra by using chemometrics of hierarchical cluster analysis. HCA analysis was conducted by using the chemometrics software OPUS Version 7.2 (Bruker, Germany). First derivative spectra of all samples were used for HCA through Ward’s algorithm and Euclidean distance. Spectral ranges of 1387–507 cm−1, 1528–1485 cm−1, 1772–1701 cm−1, and 2878–2812 cm−1 were selected to discriminate original lemon essential oils from other samples in hierarchical cluster analysis.

2.5.2. Quantification of Adulterants in the Lemon Essential Oils

The quantities of adulterants (orange essential oil, BnOH, and IPM) in the composition of lemon essential oil were predicted by the employment of the Grams IQ (Galactic Industries Corp, Salem, NH, USA) software for the adulteration levels of 1%, 5%, 10%, 20%, 40%, and 50%.
The first derivative and second derivative spectra were included in the PLSR (partial least squares regression) and PCR (principal component regression) multivariate analysis. Cross-validation curves were built at the concentration range of 0% and 100% for each adulterant. Cross-validation curves were built on the basis of selected spectral ranges of FTIR spectra. The spectral range should include information describing the concentration variation of the analyte or other matrix constituents [20]. In the present research, spectral ranges of 1666–1693 cm−1, 560–777 cm−1, and 1716–1755 cm−1 were selected for OEO, BnOH, and IPM, respectively.

3. Results

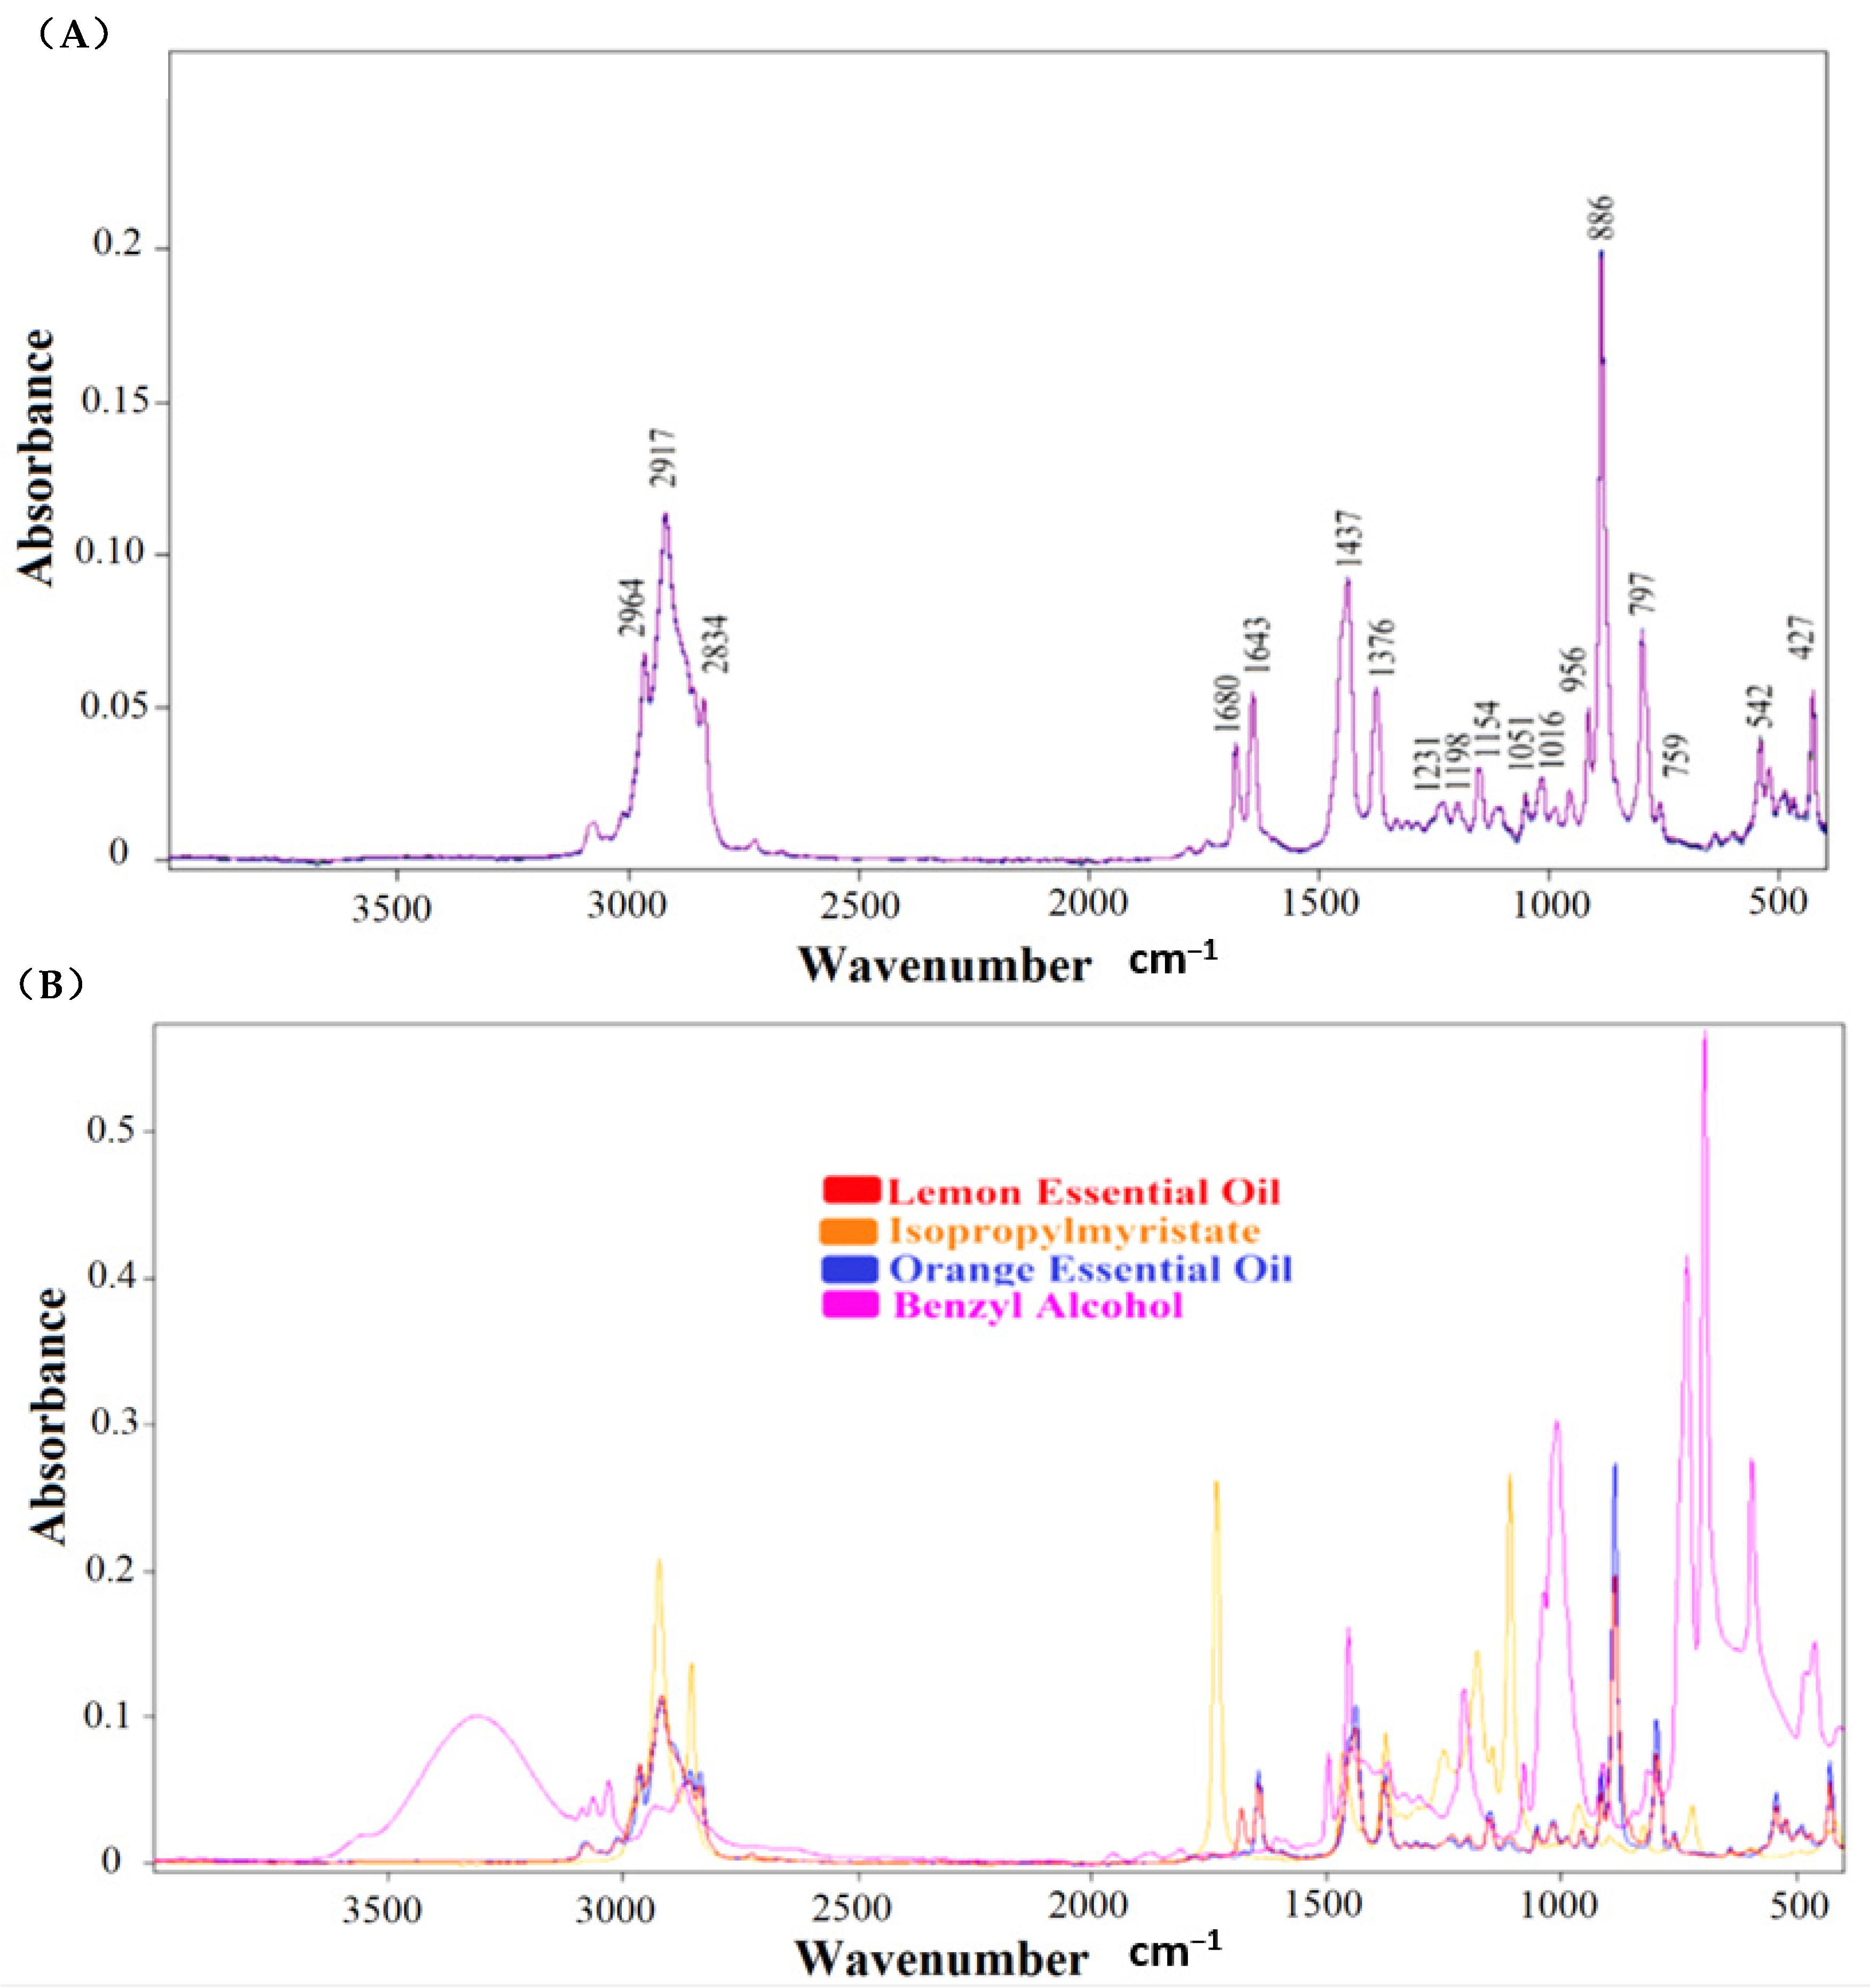
3.1. Characterization of Lemon Essential Oils by FTIR Spectroscopy

Overlapped FTIR spectra of cold-pressed lemon essential oils (LEO1, LEO2, and LO3) are presented in Figure 1A. FTIR spectrum of material includes the “fingerprint” chemical information, which is specific to investigated material [21]. In this way, the authenticity of materials could be determined by using the unique FTIR spectral data. Lemon essential oil is composed of terpenes (about 94% mainly (+)- limonene), sesquiterpenes, and aldehydes [22]. Identical spectral features were observed in the FTIR spectra of three cold-pressed lemon essentials, as can be seen in Figure 1A. Main peaks were observed at 2964, 2917, 2843, 1680, 1643, 1437, 1376, 1231, 1198, 1154, 1051, 1016, 956, 886, 797, 542 and 427 cm−1. The vibrational bands around ~2900 cm−1, ~1700 cm−1, and ~1100 cm−1 may include spectral features arising from C-H, C=O, and C-O stretching vibrations of terpenoid components, respectively [23]. The peak around 2964 cm−1 corresponds to the –CH3 asymmetric and symmetric stretching vibrations [14]. The peaks at 2917 cm−1, 1680 cm−1, 1643 cm−1, 1437 cm−1, 1376 cm−1, 1154 cm−1, 886 cm−1, and 797 cm−1 correspond to the C-H stretching vibrations of alkanes, C=O stretching vibrations, C=C stretching vibrations of alkanes, C-H bending vibrations of alkanes, O.H. bending vibrations of phenols, C-O stretching vibrations of tertiary alcohols, C-H stretching vibrations of aromatics and C=C bending vibrations of alkanes, respectively [14,24]. Overlapped FTIR spectra of cold-pressed lemon essential oil, cold-pressed orange essential oil, isopropyl myristate, and benzyl alcohol are presented in Figure 1B. As can be seen, OEO and LEO have similar spectral properties when compared to chemicals of isopropyl myristate and benzyl alcohol. BnOH and IPM have significantly distinct spectral properties at the spectral range of 400–4000 cm−1.

3.2. Determination of Authentic Lemon Essential Oil by Hierarchical Cluster Analysis

Hierarchical cluster analysis (HCA) was performed for discrimination of authentic cold-pressed lemon essential oils from cold-pressed OEOs, adulterated samples (OEOs, BnOH, and IPM), BnOH, and IPM. HCA provides an opportunity for visualization of the hidden relationship between investigated samples by using 2-D plots (dendrograms), which presents a cluster pattern of investigated elements [25]. HCA was performed by using selected spectral ranges of 2878–2812 cm−1, 1772–1701 cm−1, 1528–1485 cm−1 and 1387–507 cm−1. First derivative spectra were processed through Ward’s algorithm and Euclidian distance. The euclidian distance was used for the calculation of spectral distances. Ward’s algorithm (minimum variance agglomeration) has a strong capability to obtain clear classification patterns; thus, Ward’s algorithm was used for lightening a lot of challenging adulteration and authenticity problems in previous studies [26,27,28,29,30]. The output of the hierarchical cluster analyses, a 2-D dendrogram, is presented in Figure 2. The whole sample set was initially clustered in “two” classes. LEO (n = 3) and OEO (n = 3) samples were significantly discriminated from other samples on the dendrogram. LEO and OEO samples were marked by using a yellow rectangle and a red rectangle, respectively. Although OEO and LEO samples have similar FTIR spectra, a clear classification of these samples was obtained without any false agglomeration. Additionally, chemicals of IPM and BnOH were classified distinctly from essential oils and adulterated samples on the right side of the HCA dendrogram. As can be seen, the highest BnOH and IPM spiked samples (40% and 50%) were classified closer to the IPM and BnOH samples. Overall, it can be concluded from the dendrogram that authentic cold-pressed lemon essential oil samples could be accurately distinguished from cold-pressed orange essential oil, adulterated samples, BnOH, and IPM.

3.3. Quantification of OEO, BnOH, and IPM in LEO by Using PLSR and PCR Models

Chemometrics of partial least squares regression (PLSR) and principal component regression (PCR) were used for quantification of cold-pressed OEO, BnOH, and IPM in cold-pressed lemon essential oil. Multivariate calibration methods are used to extract interesting information from high throughput analytical data [31]. PLSR and PCR models are used to obtain a linear relationship between the concentration and measured intensity of investigated compounds (constituents) by using instrumental data [32]. PLSR and PCR techniques are widely used in combination with vibrational spectroscopy for the determination of adulteration with high accuracy with the help of selection concentration-related spectral regions [33]. Basically, in the PLSR, the spectral information in the thousands of infrared frequency is reduced to several “latent variables”, which is crucial to explain the model’s variation [34]. Similarly, PCR is used with the aim of building calibration curves that correlate the concentration levels and the absorbance intensity of investigated constituents. PCR has been known as a practical approach; response variables are regressed with respect to the principal components of covariates [35].
PLSR and PCR, robust multivariate techniques, were successfully employed for quantification of various adulterants in complex food-related matrices in terms of evaluation of food authenticity and traceability [36]. PLSR and PCR analyses were performed by using raw, first-derivative, and second-derivative FTIR spectra of all samples. The different spectral range was selected for each adulterant type (OEO, BnOH, and IPM). Cross-validation curves (PLSR) and selected spectral ranges are presented in Figure 3. The spectral ranges of 1666–1693 cm−1, 560–777 cm−1, and 1716–1755 cm−1 were selected for the quantification of the adulterants OEO, BnOH, and IPM, respectively. Concentration levels were 0%, 1%, 5%, 10%, 20%, 40% and 50% (v/v) for each adulterant. The spectral range should include information describing the concentration variation of the analyte or other matrix constituents [20]. In the current study, the spectral region in which concentration change was clearly observed was selected for each adulterant. One can observe from the FTIR spectra that the intensities of concentration-related bands in the selected spectral regions clearly increased with the rising concentration of adulterants. Calibration and cross-validation equations, R2, LOGPress, SECV (standard error of cross-validation), and bias are presented in Table 1. The prediction ability of developed PLS and PCR models are evaluated on the basis of especially R2 and SECV values; the model that has the highest R2 values and lowest SECV values has the highest ability to describe the relationship between actual adulterant concentration and predicted adulterant concentration. The SEC is defined as the standard error of calibration and SEC is formulated as the square root of the residual variance divided by the number of degrees of freedom. The SECV value is defined as the standard error of cross-validation (prediction) [37]. In the present study, three latent variables were used for each model. Best SECV values were obtained when three latent variables were used.
Bias could be defined as the systematic error of the calibration or cross-validation and calculated as the average difference between the reference and predicted values [38]. As it can be seen in Table 1, quite fair R2 values were obtained in all cross-validation models. The determination coefficient (R2) changed at the range of 0.9902–1 and 0.9906–0.9999 in the calibration models and cross-validation models of the raw, first derivative, and second derivative FTIR spectra of samples, respectively. The determination coefficient (R2) normally changes between “0” and “1”. The closeness of the (R2) value to the “1” supports the reliability of the model since (R2) is a statistical measure of how close the data are to the fitted regression line. Additionally, calibration and cross-validation model equations are presented in Table 1; one can observe that the slope of the equations changes around “0.9” and “1”, this means that the obtained equations are quite similar to the equation of y = x. In a regression model, the predicted concentration of adulterant (y) is equal to the actual concentration (x) of adulterant when y = x; in other words, the regression model has the ability to predict adulteration concentration with 100% accuracy on the basis of FTIR spectral data. Additionally, SECV ranged between 0.58 and 5.21. The systematic error of cross-validation models altered around 0.27 and 4.85. All calibration and cross-validation models showed high accuracy when they were evaluated in terms of R2, SECV, and bias values. Results from the current research showed that developed PLSR and PCR models could be effectively used for the prediction of cold-pressed OEO, IPM, and BnOH adulteration in cold-pressed LEOs. Additionally, an authentic cold-pressed lemon essential oil was purchased from the producer and separately spiked with OEO1, BnOH and IPM at concentrations of 1%, 4%, 8%, 16% and 32% (v/v). Developed FTIR-PLSR and PCR models (raw spectra) were used for the quantification of adulterants. OEO1 concentrations were determined as 1.15%, 4.18%, 8.22%, 16.15% and 32.25% (v/v) by the PLSR model. BnOH concentrations were determined as 1.08%, 4.10%, 8.08%, 16.12% and 32.05% (v/v) by the PLSR model. IPM concentrations were determined as 1.18%, 4.31%, 8.14%, 16.22% and 32.16% (v/v) by the PLSR model. In addition, adulterant concentrations were quantified as 0% for authentic cold-pressed lemon essential oil by the PLSR model. Quite similar results were obtained by using the PCR models. These results showed the efficiency of FTIR spectroscopy in combination with chemometrics models of PLSR and PCR.

4. Discussion

In the current research, PLSR and PCR techniques were successfully employed for quantification OEO, BnOH, and IPM by using a robust vibrational technique, FTIR spectroscopy. To the best of our knowledge, this study is the first attempt for quantification of adulterants in LEO by using FTIR spectroscopy combined chemometrics of PLSR and PCR. Previous studies presented valuable results for the characterization of citrus essential oils such as lemon and orange oil [39]. In the present research, highest intensity was observed for the spectral band at 886 cm−1 and similar spectral properties were observed in the FTIR spectrum of lemon essential oil in previous research [39]. Additionally, quite limited studies were performed for the detection of adulteration in cold-pressed lemon essential oil. Schipilliti et al. (2012) utilized gas chromatography–combustion–isotope ratio mass spectrometry for the determination of the authenticity of cold-pressed lemon essential oils. They proved the effectiveness of stable isotope ratio analysis for the detection of genuine LEOs [8]. In another study, Lifshitz and Stepak (1969) determined the addition of orange oil, d-limonene, and commercial terpenes to the Israel lemon oil by using gas–liquid chromatography, and they detected the adulterants with a detection limit of 10% [11]. A previous study used the HPLC technique for the detection of low-quality lemon essential oil in cold-pressed LEO, and they detected adulteration concealer compounds in the investigated LEOs [40]. Techniques are reliable, robust, and widely used though they are generally arduous, time-consuming, and require toxic chemicals and expert operators. In this respect, FTIR spectroscopy can be chosen as an appealing alternative since it is a cost-effective, rapid, reliable, robust, eco-friendly analytical technique and has the capability to obtain the chemical fingerprint of materials in just a few minutes [41]. Previous contributions proved the effectiveness of vibrational spectroscopy techniques such as FTIR and Raman spectroscopy for the determination of the authenticity of essential oils [15,17,42,43,44]. Additionally, previous applications of FTIR spectroscopy in combination with chemometrics shed light on the quality and purity evaluation of essential oils [45]. No previous study has investigated the adulteration of LEOs. In this research, FTIR spectroscopy, in combination with multivariate statistics of PLSR and PCR, was effectively used for prediction of the adulteration levels of OEO, BnOH, and IPM adulterants in a few minutes with minimum sample preparation.

5. Conclusions

The current research presented an application of FTIR spectroscopy combined with chemometrics for quantification of adulterants (OEO, BnOH, and IPM) in LEOs. Results showed that adulterants were successfully quantified at the concentration range of 0–50% (v/v) by using PLSR and PCR. Additionally, HCA was effectively employed for discrimination of LEOs from adulterated samples by the 2-D plots (dendrograms) in which separate clusters and sub-clusters were clearly visualized on the basis of FTIR spectra. PLSR and PCR showed high accuracy with high R2 values (0.99–1) and low SECV values (0.58 and 5.21) for cross-validation results of the raw, first derivative, and second derivative FTIR spectra. Essential oils as natural extracts are prone to be adulterated through economic motivations. There is a need for cost-effective, rapid, reliable, robust, and easy-to-operate methodologies to maintain the quality of essential oils and tremendous products in which they involved. FTIR spectroscopy, in combination with multivariate analyses of PLSR, PCR, and HCA, showed high potential for detection of investigated adulterants and discrimination of natural cold-pressed lemon essential oil. Additionally, integration of the developed methodology to the hand-held FTIR spectrometers may help detection of frauds in the essential oil industry and whole supply chain. The findings from the current research may shed light on various adulteration incidents in which essential oils, foods, natural extracts, and high-value products are deteriorated.

Author Contributions

Conceptualization, O.S. and N.C.; methodology, N.C.; software, N.C.; validation, N.C., O.T. and O.S.; investigation, N.C.; resources, N.C., O.T., M.A. and O.S.; data curation, N.C.; writing—original draft preparation, N.C., M.A. and O.S.; writing—review and editing, N.C., O.T., M.A. and O.S.; visualization, N.C.; supervision, N.C.; project administration, N.C., O.T. and O.S. All authors have read and agreed to the published version of the manuscript.

Funding

This project was funded by the Deanship of Scientific Research (DSR) at King Abdulaziz University, Jeddah, under grant no. (FP-57-42).

Acknowledgments

The authors, therefore, give thanks to DSR’s technical and financial support.

Conflicts of Interest

The authors declare that they have no known competing financial interest or personal relationships that could have appeared to influence the work reported in this paper.

References

  1. Perdones, A.; Sánchez-González, L.; Chiralt, A.; Vargas, M. Effect of chitosan-lemon essential oil coatings on storage-keeping quality of strawberry. Postharvest Biol. Technol. 2012, 70, 32–41. [Google Scholar] [CrossRef]
  2. Boren, K.E.; Young, D.G.; Wooley, C.L.; Smith, B.L.; Carlson, R.E. Detecting essential oil adulteration. J. Environ. Anal. Chem. 2015, 2, 1–4. [Google Scholar]
  3. Mustafa, N. Citrus Essential Oils: Current and prospective uses in the food industry. Recent Pat. Food. Nutr. Agric. 2015, 7, 115–127. [Google Scholar] [CrossRef] [PubMed]
  4. Hao, C.W.; Lai, W.S.; Ho, C.T.; Sheen, L.Y. Antidepressant-like effect of lemon essential oil is through a modulation in the levels of norepinephrine, dopamine, and serotonin in mice: Use of the tail suspension test. J. Funct. Foods 2013, 5, 370–379. [Google Scholar] [CrossRef]
  5. Huynh, T.V.; Caffin, N.; Dykes, G.; Bhandari, B. Optimization of the microencapsulation of lemon myrtle oil using response surface methodology. Dry. Technol. 2008, 26, 357–368. [Google Scholar] [CrossRef]
  6. Do, T.K.T.; Hadji-Minaglou, F.; Antoniotti, S.; Fernandez, X. Authenticity of essential oils. TrAC Trends Anal. Chem. 2015, 66, 146–157. [Google Scholar] [CrossRef]
  7. Tony, C.; Oct, B.; Adulteration, O.; Organisation, I.S.; Which, H.; Trade, T.P.; Pharmacopoeia, B.; Uk, M.C.; Pharmacopoeia, E.; Pharmacopoeia, U.S.; et al. The adulteration of essential oils-and the consequences to aromatherapy & natural perfumery practice. By Tony Burfield October 2003. In Proceedings of the the International Federation of Aromatherapists Annual AGM, London, UK, 11 October 2003. [Google Scholar]
  8. Schipilliti, L.; Dugo, P.; Bonaccorsi, I.; Mondello, L. Authenticity control on lemon essential oils employing Gas Chromatography-Combustion-Isotope Ratio Mass Spectrometry (GC-C-IRMS). Food Chem. 2012, 131, 1523–1530. [Google Scholar] [CrossRef]
  9. International Standard ISO 855:2003 Oil of Lemon [Citrus limon (L.) Burm. f.], Obtained by Expression; ISO: Geneva, Switzerland, 2003; Available online: https://www.iso.org/standard/32042.html (accessed on 10 December 2020).
  10. Mehl, F.; Marti, G.; Boccard, J.; Debrus, B.; Merle, P.; Delort, E.; Baroux, L.; Raymo, V.; Velazco, M.I.; Sommer, H.; et al. Differentiation of lemon essential oil based on volatile and non-volatile fractions with various analytical techniques: A metabolomic approach. Food Chem. 2014, 143, 325–335. [Google Scholar] [CrossRef]
  11. Lifshitz, A.; Stepak, Y.; Basker, H.B. Characterization of Israel Lemon Oil and Detection of its Adulteration. J. Food Sci. 1969, 34, 254–257. [Google Scholar] [CrossRef]
  12. Alvarez-Ordonez, A.; Prieto, M. Fourier Transform Infrared Spectroscopy in Food Microbiology; Hartel, R.W., Clark, J.P., Rodriguez-Lazaro, D., Topping, D., Eds.; Springer: New York, NY, USA, 2012; ISBN 9781461438120. [Google Scholar]
  13. Rodriguez-Saona, L.E.; Allendorf, M.E. Use of FTIR for rapid authentication and detection of adulteration of food. Annu. Rev. Food Sci. Technol. 2011, 2, 467–483. [Google Scholar] [CrossRef]
  14. Berechet, M.D.; Calinescu, I.; Stelescu, M.D.; Manaila, E.; Craciun, G.; Purcareanu, B.; Mihaiescu, D.E.; Rosca, S.; Fudulu, A.; Niculescu-Aron, I.G.; et al. Composition of the essential oil of Rosa damascena Mill. cultivated in Romania. Rev. Chim. 2015, 66, 1986–1991. [Google Scholar]
  15. Li, S.; Zhu, X.; Zhang, J.; Li, G.; Su, D.; Shan, Y. Authentication of Pure Camellia Oil by Using Near Infrared Spectroscopy and Pattern Recognition Techniques. J. Food Sci. 2012, 77, 374–380. [Google Scholar] [CrossRef] [PubMed]
  16. Minteguiaga, M.; Dellacassa, E.; Iramain, M.A.; Catalán, C.A.N.; Brandán, S.A. FT-IR, FT-Raman, UV–Vis, NMR and structural studies of carquejyl acetate, a distinctive component of the essential oil from Baccharis trimera (less.) DC. (Asteraceae). J. Mol. Struct. 2019, 1177, 499–510. [Google Scholar] [CrossRef]
  17. Bombarda, I.; Dupuy NJ, P.D.; Le Van Da, J.P.; Gaydou, E.M. Comparative chemometric analyses of geographic origins and compositions of lavandin var. Grosso essential oils by mid infrared spectroscopy and gas chromatography. Anal. Chim. Acta 2008, 613, 31–39. [Google Scholar] [CrossRef] [PubMed]
  18. Andersen, F.A. Final report on the safety assessment of Benzyl Alcohol, Benzoic Acid, and Sodium Benzoate. Int. J. Toxicol. 2001, 20, 23–50. [Google Scholar]
  19. Myristate, M.; Myristate, I. Final report on the safety assessment of myristyl myristate and isopropyl myristate. Int. J. Toxicol. 1982, 1, 55–80. [Google Scholar]
  20. Sivakesava, S.; Irudayaraj, J. Detection of inverted beet sugar adulteration of honey by FTIR spectroscopy. J. Sci. Food Agric. 2001, 81, 683–690. [Google Scholar] [CrossRef]
  21. Rohman, A.; Man, Y.B.C. Application of Fourier transform infrared spectroscopy for authentication of functional food oils. Appl. Spectrosc. Rev. 2012, 47, 1–13. [Google Scholar] [CrossRef]
  22. Boughendjioua, H. Fourier transformed infrared spectroscopy analysis of constituents of lemon essential oils from Algeria. Am. J. Opt. Photonics 2017, 5, 30. [Google Scholar] [CrossRef] [Green Version]
  23. Hasani, S.; Ojagh, S.M.; Ghorbani, M. Nanoencapsulation of lemon essential oil in Chitosan-Hicap system. Part 1: Study on its physical and structural characteristics. Int. J. Biol. Macromol. 2018, 115, 143–151. [Google Scholar] [CrossRef]
  24. Benoudjit, F.; Maameri, L.; Ouared, K.; History, A. Evaluation of the quality and composition of lemon (Citrus limon) peel essential oil from an Algerian fruit juice industry ARTICLE INFO ABSTRACT/RESUME. Alger. J. Environ. Sci. Technol. Dec. Ed. 2020, 6, 1575–1581. [Google Scholar]
  25. Taylan, O.; Cebi, N.; Tahsin Yilmaz, M.; Sagdic, O.; Bakhsh, A.A. Detection of lard in butter using Raman spectroscopy combined with chemometrics. Food Chem. 2020, 332, 127344. [Google Scholar] [CrossRef] [PubMed]
  26. Cebi, N.; Yilmaz, M.T.; Sagdic, O. A rapid ATR-FTIR spectroscopic method for detection of sibutramine adulteration in tea and coffee based on hierarchical cluster and principal component analyses. Food Chem. 2017, 229, 517–526. [Google Scholar] [CrossRef] [PubMed]
  27. Gok, S.; Severcan, M.; Goormaghtigh, E.; Kandemir, I.; Severcan, F. Differentiation of Anatolian honey samples from different botanical origins by ATR-FTIR spectroscopy using multivariate analysis. Food Chem. 2015, 170, 234–240. [Google Scholar] [CrossRef] [PubMed]
  28. Cebi, N.; Durak, M.Z.; Toker, O.S.; Sagdic, O.; Arici, M. An evaluation of Fourier transforms infrared spectroscopy method for the classification and discrimination of bovine, porcine and fish gelatins. Food Chem. 2016, 190, 1109–1115. [Google Scholar] [CrossRef] [PubMed]
  29. Ropodi, A.I.; Pavlidis, D.E.; Mohareb, F.; Panagou, E.Z.; Nychas, G.J.E. Multispectral image analysis approach to detect adulteration of beef and pork in raw meats. Food Res. Int. 2015, 67, 12–18. [Google Scholar] [CrossRef]
  30. Schulz, H.; Özkan, G.; Baranska, M.; Krüger, H.; Özcan, M. Characterisation of essential oil plants from Turkey by IR and Raman spectroscopy. Vib. Spectrosc. 2005, 39, 249–256. [Google Scholar] [CrossRef]
  31. Liu, W.; Zhang, B.; Xin, Z.; Ren, D.; Yi, L. GC-MS fingerprinting combined with chemometric methods reveals key bioactive components in Acori tatarinowii rhizoma. Int. J. Mol. Sci. 2017, 18. [Google Scholar] [CrossRef]
  32. Wu, D.; Nie, P.; Cuello, J.; He, Y.; Wang, Z.; Wu, H. Application of visible and near infrared spectroscopy for rapid and non-invasive quantification of common adulterants in Spirulina powder. J. Food Eng. 2011, 102, 278–286. [Google Scholar] [CrossRef]
  33. Das, R.S.; Agrawal, Y.K. Raman spectroscopy: Recent advancements, techniques and applications. Vib. Spectrosc. 2011, 57, 163–176. [Google Scholar] [CrossRef]
  34. Rodriguez-Saona, L.E.; Pujolras, M.P.; Giusti, M.M. Targeted and Non-Targeted Analysis. In Analytical Separation Science; Wiley-VCH: Weinheim, Germany, 2015; pp. 1401–1436. [Google Scholar]
  35. Agarwal, A.; Shah, D.; Shen, D.; Song, D. On robustness of principal component regression. arXiv 2019, arXiv:1902.10920. [Google Scholar]
  36. Benson, I.B. Food Authenticity and Traceability; Woodhead Publishing Limited: Cambridge, UK, 2003; ISBN 9781855735262. [Google Scholar]
  37. Chen, G.; Kocaoglu-Vurma, N.A.; Harper, W.J.; Rodriguez-Saona, L.E. Application of infrared microspectroscopy and multivariate analysis for monitoring the effect of adjunct cultures during Swiss cheese ripening. J. Dairy Sci. 2009, 92, 3575–3584. [Google Scholar] [CrossRef] [PubMed]
  38. Hoon, A. The Evaluation of Fourier Transform Infrared (FT-IR) Spectroscopy and Multivariate Data Analysis Techniques for Quality Control at an Industrial Cellar; Stellenbosch University: Stellenbosch, South Africa, 2015; pp. 25–26. [Google Scholar]
  39. Schulz, H.; Schrader, B.; Quilitzsch, R.; Steuer, B. Quantitative analysis of various citrus oils by ATR/FT-IR and NIR-FT Raman spectroscopy. Appl. Spectrosc. 2002, 56, 117–124. [Google Scholar] [CrossRef]
  40. McHale, D.; Sheridan, J.B. Detection of adulteration of cold-pressed lemon oil. Flavour Fragr. J. 1988, 3, 127–133. [Google Scholar] [CrossRef]
  41. Sivakesava, S.; Irudayaraj, J. Prediction of inverted cane sugar adulteration of honey by Fourier transform infrared spectroscopy. J. Food Sci. 2001, 66, 972–978. [Google Scholar] [CrossRef]
  42. Jentzsch, P.; Ramos, L.; Ciobotă, V. Handheld Raman Spectroscopy for the Distinction of Essential Oils Used in the Cosmetics Industry. Cosmetics 2015, 2, 162–176. [Google Scholar] [CrossRef] [Green Version]
  43. Sandasi, M.; Kamatou, G.P.P.; Gavaghan, C.; Baranska, M.; Viljoen, A.M. A quality control method for geranium oil based on vibrational spectroscopy and chemometric data analysis. Vib. Spectrosc. 2011, 57, 242–247. [Google Scholar] [CrossRef]
  44. Schulz, H.; Quilitzsch, R.; Krüger, H. Rapid evaluation and quantitative analysis of thyme, origano and chamomile essential oils by ATR-IR and NIR spectroscopy. J. Mol. Struct. 2003, 661–662, 299–306. [Google Scholar] [CrossRef]
  45. Agatonovic-Kustrin, S.; Ristivojevic, P.; Gegechkori, V.; Litvinova, T.M.; Morton, D.W. Essential Oil Quality and Purity Evaluation via FT-IR Spectroscopy and Pattern Recognition Techniques. Appl. Sci. 2020, 10, 7294. [Google Scholar] [CrossRef]
Figure 1. Overlapped FTIR spectra of cold-pressed lemon essential oils at the mid-infrared region (400–4000 cm−1) (A); FTIR spectra of lemon essential oil, orange essential oil, isopropylmyristate and benzyl alcohol (B).
Foods 10 00027 g001
Figure 2. Two-dimensional hierarchical cluster analysis (HCA) plot of FTIR measurements from cold-pressed lemon essential oil, cold-pressed orange essential oil, adulterated samples, isopropyl myristate (IPM) and benzyl alcohol (BnOH).
Foods 10 00027 g002
Figure 3. Cross-validation r (partial least squares regression (PLSR)—raw spectra): actual versus predicted values and selected calibration ranges (a) OEO adulteration in LEO, (b) selected calibration range for OEO adulteration in LEO, (c) BnOH adulteration in LEO, (d) selected calibration range for BnOH adulteration in LEO, (e) IPM adulteration in LEO, (f) selected calibration range for IPM adulteration in LEO.
Foods 10 00027 g003
Table 1. PLSR and PCR results of calibration and cross-validation results of raw, first and second derivative FTIR spectra of adulterated lemon essential oils.
SamplesCalibration
Technique
SpectraEquationR2LOGPressSECVBias
CalibrationValidationCalibrationValidation
OE1LEO1
(OEO1 adulterated LEO1)
PLSRRawy = 0.9996x + 0.0123y = 1.0318x − 0.4627R² = 0.9996R² = 0.99842.144.141.37
First derivative.y = 0.9995x + 0.0139y = 0.9676x + 0.4399R² = 0.9995R² = 0.99502.204.441.50
Second derivative.y = 0.9992x + 0.0222y = 0.9659x + 0.4985R² = 0.9992R² = 0.99702.404.901.62
PCRRawy = 0.9995x + 0.0129y = 1.0161x − 0.2343R² = 0.9995R² = 0.99882.134.090.75
First derivative.y = 0.9988x + 0.0337y = 0.9672x + 0.445R² = 0.9988R² = 0.99502.194.421.52
Second derivative.y = 0.9995x + 0.0143y = 0.9761x + 0.1554R² = 0.9995R² = 0.99850.620.720.38
OE2LEO2
(OEO2 adulterated LEO2)
PLSRRawy = 0.9995x + 0.0152y = 1.0049x + 0.0012R² = 0.9995R² = 0.99381.582.181.80
First derivative.y = 0.9995x + 0.0149y = 0.9968x + 0.0991R² = 0.9995R² = 0.99771.602.221.17
Second derivative.y = 0.9985x + 0.0434y = 0.9953x + 0.13R² = 0.9985R² = 0.99711.832.921.32
PCRRawy = 0.9993x + 0.0194y = 1.0049x + 0.0005R² = 0.9993R² = 0.99381.471.921.80
First derivative.y = 0.9986x + 0.0399y = 0.9968x + 0.0972R² = 0.9986R² = 0.99771.542.091.17
Second derivative.y = 0.9983x + 0.0492y = 0.9953x + 0.1275R² = 0.9983R² = 0.99711.612.261.32
OEO3LEO3
(OEO3 adulterated LEO3)
PLSRRawy = 0.9995x + 0.013y = 0.9942x + 0.1032R² = 0.9995R² = 0.99691.923.210.81
First derivative.y = 0.9996x + 0.0123y = 0.9758x + 0.3435R² = 0.9996R² = 0.99641.822.871.13
Second derivative.y = 0.9993x + 0.0193y = 0.9869x + 0.1531R² = 0.9993R² = 0.9981.371.700.74
PCR Rawy = 0.9979x + 0.0601y = 0.9942x + 0.1031R² = 0.9979R² = 0.99691.973.400.81
First derivative.y = 0.998x + 0.0564y = 0.9757x + 0.344R² = 0.998R² = 0.99641.542.081.14
Second derivative.y = 0.9979x + 0.0591y = 0.9669x + 0.4802R² = 0.9979R² = 0.99491.672.431.53
BA1LEO1
(Benzylalcohol
adulterated LEO1)
PLSRRawy = 0.9999x + 0.0024y = 0.9981x + 0.0139R² = 0.9999R² = 0.99991.240.920.27
First derivative.y = 0.9999x + 0.0035y = 0.9464x + 0.9899R² = 0.9999R² = 0.99851.562.141.90
Second derivative.y = 0.9998x + 0.0044y = 0.9192x + 1.1921R² = 0.9998R² = 0.99531.842.943.15
PCRRawy = 0.9999x + 0.0024y = 0.9965x + 0.0367R² = 0.9999R² = 0.99990.430.580.27
First derivative.y = 0.9998x + 0.0043y = 0.9396x + 1.0674R² = 0.9998R² = 0.99811.672.422.17
Second derivative.y = 0.9998x + 0.0056y = 0.9228x + 1.2914R² = 0.9998R² = 0.99681.893.122.84
BA1LEO2
(Benzylalcohol
adulterated LEO)
PLSRRawy = 0.9999x + 0.0028y = 1.0079x − 0.1288R² = 0.9999R² = 0.99981.121.280.33
First derivative.y = 0.9999x + 0.0032y = 0.9646x + 0.6987R² = 0.9999R² = 0.99931.221.441.52
Second derivative.y = 0.9999x + 0.0036y = 0.9486x + 0.9728R² = 0.9999R² = 0.99861.532.051.80
PCRRawy = 0.9999x + 0.0028y = 1.0058x − 0.0992R² = 0.9999R² = 0.99980.951.060.31
First derivative.y = 0.9999x + 0.0037y = 0.9578x + 0.806R² = 0.9999R² = 0.99901.361.701.47
Second derivative.y = 0.9998x + 0.0043y = 0.9442x + 0.9984R² = 0.9998R² = 0.99841.602.242.00
BA1LEO3
(Benzylalcohol
adulterated LEO3)
PLSRRawy = 0.9999x + 0.0030y = 1.0054x − 0.085R² = 0.9999R² = 0.99981.131.300.29
First derivative.y = 0.9999x + 0.0028y = 0.9671x + 0.6537R² = 0.9999R² = 0.99941.151.331.12
Second derivative.y = 0.9999x + 0.0025y = 0.9394x + 0.8944R² = 0.9999R² = 0.99741.532.052.35
PCRRawy = 0.9999x + 0.0023y = 1.0027x − 0.0473R² = 0.9999R² = 0.99981.011.130.29
First derivative.y = 0.9999x + 0.0031y = 0.9621x + 0.7607R² = 0.9999R² = 0.99921.271.521.29
Second derivative.y = 0.9999x + 0.0028y = 0.9467x + 0.963R² = 0.9999R² = 0.99871.552.111.89
IPM1LEO1
(isopropylmyristate
adulterated LEO1)
PLSRRawy = 0.9997x + 0.009y = 0.9292x + 0.9864R² = 0.9997R² = 0.99571.983.472.87
First derivative.y = 0.9999x + 0.0034y = 0.9055x + 1.4095R² = 0.9999R² = 0.99232.083.903.78
Second derivative.y = 0.9996x + 0.0108y = 0.9524x + 0.8724R² = 0.9996R² = 0.99942.003.542.35
PCRRawy = 0.9997x + 0.009y = 0.9307x + 0.9623R² = 0.9997R² = 0.99591.993.492.82
First derivative.y = 0.9994x + 0.0162y = 0.9052x + 1.4117R² = 0.9994R² = 0.99232.114.013.79
Second derivative.y = 0.999x + 0.0281y = 0.8821x + 1.7718R² = 0.999R² = 0.99712.335.214.72
IPM1LEO2
(isopropylmyristate
adulterated LEO2)
PLSRRawy = 0.9997x + 0.0086y = 0.9328x + 0.9419R² = 0.9997R² = 0.99611.923.212.73
First derivative.y = 0.9999x + 0.0031y = 0.9132x + 1.3R² = 0.9999R² = 0.99362.023.623.47
Second derivative.y = 1x + 0.0008y = 0.8924x + 1.6224R² = 1R² = 0.99942.234.634.31
PCRRawy = 0.9997x + 0.0086y = 0.9339x + 0.9249R² = 0.9997R² = 0.99621.923.232.70
First derivative.y = 0.9995x + 0.0142y = 0.913x + 1.3013R² = 0.9995R² = 0.99352.043.733.48
Second derivative.y = 0.9992x + 0.0238y = 0.8923x + 1.6221R² = 0.9992R² = 0.99942.274.804.31
IPM1LEO3
(isopropylmyristate
adulterated LEO3)
PLSRRawy = 0.9995x + 0.0148y = 0.9171x + 1.1763R² = 0.9995R² = 0.99372.154.203.73
First derivative.y = 0.9997x + 0.0075y = 0.8987x + 1.5123R² = 0.9906 R² = 0.99972.154.214.06
Second derivative.y = 0.9998x + 0.0049y = 0.8795x + 1.8146R² = 0.9998R² = 0.99602.335.154.84
PCRRawy = 0.9995x + 0.0149y = 0.918x + 1.1602R² = 0.9938R² = 0.99952.093.923.34
First derivative.y = 0.9992x + 0.0215y = 0.8984x + 1.5149R² = 0.9992R² = 0.99062.164.284.08
Second derivative.y = 0.9993x + 0.0194y = 0.8794x + 1.8155R² = 0.9993R² = 0.99592.335.214.85
Publisher’s Note: MDPI stays neutral with regard to jurisdictional claims in published maps and institutional affiliations.

