Article

Rheological and Pipe Flow Properties of Chocolate Masses at Different Temperatures

1
Department of Technology and Automobile Transport (Section Physics), Faculty of AgriSciences, Mendel University in Brno, Zemědělská 1, 613 00 Brno, Czech Republic
2
Department of Food Technology, Faculty of AgriSciences, Mendel University in Brno, Zemědělská 1, 613 00 Brno, Czech Republic
*
Author to whom correspondence should be addressed.
Foods 2021, 10(11), 2519; https://doi.org/10.3390/foods10112519
Submission received: 7 September 2021 / Revised: 8 October 2021 / Accepted: 19 October 2021 / Published: 20 October 2021

Abstract

:
Chocolate masses are one of the basic raw materials for the production of confectionery. Knowledge of their rheological and flow behaviour at different temperatures is absolutely necessary for the selection of a suitable technological process in their production and subsequent processing. In this article, the rheological properties (the effect of the shear strain rate on the shear stress or viscosity) of five different chocolate masses were determined—extra dark chocolate (EDC), dark chocolate (DC), milk chocolate (MC), white chocolate (WC), and ruby chocolate (RC). These chocolate masses showed thixotropic and plastic behaviour in the selected range of shear rates from 1 to 500 s−1 and at the specified temperatures of 36, 38, 40, 42, and 44 °C. The degree of thixotropic behaviour was evaluated by the size of the hysteresis area, and flow curves were constructed using the Bingham, Herschel–Bulkley and Casson models with respect to the plastic behaviour of the chocolate masses. According to the values of the coefficients of determination R2 and the sum of the squared estimate of errors (SSE), the models were chosen appropriately. The most suitable models are the Herschel–Bulkley and Casson models, which also model the shear thinning property of the liquids (pseudoplastic with a yield stress value). Using the coefficients of the rheological models and modified equations for the flow velocity of technical and biological fluids in standard piping, the 2D and 3D velocity profiles of the chocolate masses were further successfully modelled. The obtained values of coefficients and models can be used in conventional technical practice in the design of technological equipment structures and in current trends in the food industry, such as 3D food printing.

1. Introduction

Chocolate is generally very popular worldwide and consumed across all generations. Its popularity is closely related to its overall sensory properties [1]. In order for chocolate to be called chocolate, it must meet legislative requirements for each type of chocolate. Dark chocolate contains at least 18% by weight of cocoa butter, 14% fat-free cocoa components, and the total content of cocoa components should be at least 35%. Milk chocolate means a product containing at least 25% of total cocoa components, at least 14% of milk solids, at least 2.5% of fat-free cocoa components, at least 3.5% of milk fat, and at least 25% of total fat, which is the sum of the cocoa butter and milk fat [2]. White chocolate is made from cocoa butter, milk or dairy products, sweeteners, or other ingredients [3,4]. According to the current legislation, white chocolate must contain at least 20% cocoa butter, at least 14% milk solids, with at least 3.5% milk fat [2]. Recipe choice of dairy ingredient affects the strength of the finished product [5]. In contrast to the above-mentioned types of chocolates, there is also ruby chocolate. The Belgian-Swiss company Barry Callebaut brought ruby chocolate to the world market in 2017. The exact technological process of production is not known, it is the know-how of the above-mentioned company, which patented ruby chocolate in 2012 [6,7]. However, the standard for chocolate and chocolate products has not yet officially recognised ruby chocolate as the fourth type of chocolate [8]. Although this type of chocolate is not yet covered by European legislation, it can be called chocolate because, according to the information on the packaging, it contains at least 47% cocoa components and at least 26% milk solids. The basic component of quality chocolate is cocoa butter, in which the other components are dispersed, which differ according to the type of chocolate. Cocoa butter forms a so-called continuous phase in chocolate, which forms a network structure for the spatial retention of the dispersed components. Cocoa butter can crystallise in a number of polymorphic forms as a function of triglyceride composition, with fatty acid composition influencing how liquid fat solidifies. Cocoa butter has six polymorphic forms (I–VI), the principals being α, β, and β′. Form V, a β polymorph, is the most desirable form (in general) in well-tempered chocolate, giving a glossy appearance, good snap, contraction, and resistance to bloom. If chocolate is poorly tempered, the outcome is the β Form IV, which rapidly transforms into Form V. This influences colour as reflected light is disoriented by unstable, disorganised crystal growth. Untempered chocolate is soft and not effectively demoulded. In cocoa butter, Forms V and VI are the most stable forms. Form VI is difficult to generate although it is formed by lengthy storage of tempered chocolate accompanied by fat bloom. In addition, Form VI has a high melting temperature (36 °C) and crystals that are large and gritty on the tongue. The unstable Form I has a melting point of 17 °C and is rapidly converted into Form II that transforms more slowly into III and IV. Tempering has four key steps: melting to completion (at 50 °C), cooling to point of crystallisation (at 32 °C), crystallisation (at 27 °C), and conversion of any unstable crystals (at 29–31 °C). For chocolate to be in an appropriate polymorphic form, tempering is crucial, influencing final quality characteristics such as colour, hardness, handling, finish, and shelf-life characteristics [3]. Thus, liquid chocolate is a complex polydisperse system and the relationships between the individual components determine the physical and rheological properties of the chocolate [4,9,10]. As the shear rate increases, the chocolate becomes more fluid, i.e., has a lower viscosity, due to the disintegration of the polydisperse chocolate system [3,11,12]. The rheological and textural properties of the chocolate are affected by its specific composition, especially the content of the fats, sugars, milk, other milk components, and surfactants. The fat content of chocolates is usually in the range of 25–35% [3]. The fat content has a significant effect on changes in the plastic viscosity. If chocolate contains a 28–32% fat content, these changes are more pronounced than for chocolates with a fat content above 32% [12]. Melted chocolate exhibits non-Newtonian plastic fluid behaviour, with shear thinning when the yield stress is exceeded [3]. The magnitude of this shear stress depends on the temperature of the chocolate, in this case, an indirect ratio applies, so the more the chocolate is heated, the less shear stress is needed to initiate the flow, the so-called yield stress [13]. Rheological models according to Herschel–Bulkley and Casson are widely used to model flow curves, respectively, to model the behaviour of non-ideal plastic liquids, so they could be useful for chocolate materials.
Based on the introductory literature review, the following two scientific hypotheses were established. These hypotheses are not completely verifiable in the contemporary literature, so they are given due attention in this article.
  • Chocolate masses have a plastic property with shear thinning behaviour (pseudoplastic with a yield stress).
  • With an increasing temperature, the plastic viscosity or the consistency (depends on used rheological model) and thixotropy of the chocolate masses decreases.

2. Materials and Methods

2.1. Samples of Chocolate Masses

This research includes and describes the behaviour of chocolate masses that do not contain cocoa butter substitutes. Five chocolate masses were used for the experiments—extra dark chocolate (EDC), dark chocolate (DC), milk chocolate (MC), white chocolate (WC), and ruby chocolate (RC).
The EDC (Domori, Italy) contains 100% cocoa components (Morogoro, Tanzania). The DC, MC, and WC (Belcolade, Switzerland) contain 55.5%, 36.5%, and 28% cocoa components. The RC (Callebaut, Belgium) contains 47.3% cocoa components. Further characteristics (nutritional data) of the chocolate masses are given in Table 1.
The individual chocolate masses were tempered (by the manufacturer) before distribution and used in this research in the form of chocolate drops. For completeness of sample characteristics, the specific tempering curves of chocolate masses are given in Table 2.
The chocolate masses were approximately the same age (difference of 2 weeks in the maximum between the productions of individual masses). Prior to analysis, the masses were stored under the same conditions in a single warehouse at 12 °C.

2.2. Rheological Measurements

The rheological properties of the chocolate masses were measured using an RST CC rotary rheometer (AMATEK Brookfield, Middleboro, MA, USA) with a cone-plate measuring geometry. The diameter of the cone was 50 mm with an angle of 2° (the standard designation is RCT-50-2). The gap between the cone and the plate was set to 0.05 mm at the narrowest point (at the tip of the cone), the gap was 0.923 mm at the edge of the cone. The measurement methodology was set appropriately, as the maximum size of the solid particles in the chocolate masses is 25 μm [14,15]. The measurements of the chocolate masses were performed at five different temperatures of 36, 38, 40, 42, and 44 °C. Each measurement was repeated three times at an increasing shear strain rate (from 1 to 500 s−1) and three times at a decreasing shear strain rate (from 500 to 1 s−1) each time for 60 s. The average values of the shear stress were then used for the mathematical modelling.

2.3. Hysteresis Loop Test

Thixotropic behaviour of five different chocolate masses was characterize by hysteresis loop test [16]: Shear rate was increased logarithmically from 1 to 500 s−1 in 1 min, held constant at 500 s−1 in 10 s, and decreased logarithmically from 500 to 1 s−1 in 1 min. The flow measurements were performed by RST CC rotary rheometer (AMATEK Brookfield, Middleboro, MA, USA) with cone-plate geometry equipped with an RCT-50-2 spindle (diameter of the cone was 50 mm with an angle of 2°) at the temperatures of 36, 38, 40, 42, and 44 °C. The hysteresis area was calculated with the use the corporate software, Rheo3000 (AMATEK Brookfield, Middleboro, MA, USA).

2.4. Mathematical Modelling

The dependence of the shear stress on the shear strain rate was described by three non-Newtonian (plastic) mathematical models. The first model was the Bingham rheological model [17]:
τ = τ 0 + η B γ ˙
The second model was the Herschel–Bulkley rheological model [18]:
τ = τ 0 + K γ ˙ n
And the third model was the Casson rheological model [19]:
τ = τ 0 + η C γ ˙
which can also be expressed as:
τ = τ 0 + 2 τ 0 η C γ ˙ + η C γ ˙
where τ is the shear stress [Pa], τ 0 is the yield stress [Pa], η B is the Bingham plastic viscosity [Pa·s], γ ˙ is the shear strain rate [s−1], K is the consistency factor [Pa·sn], n is the flow index [–], and η C is the Casson plastic viscosity [Pa·s].

2.5. Statistical Analysis

The experimental data were processed by MATLAB R2018b (MathWorks, Natick, MA, USA) and Statistica 12 (StatSoft, Tulsa, OK, USA). To determine a statistically significant difference between the measured values of the shear stress and dynamic viscosity at the selected temperatures of the individual chocolate masses, an ANOVA (analysis of variance) test was performed followed by multiple comparisons using Tukey’s HSD (honestly significant difference) test (at the significance level of p < 0.05).
The normality and homogeneity of the data were evaluated according to a critique of the regression triplet data, which examines the quality of the data for the proposed model. The evaluation was performed by means of a graphical (using rankit Q-Q graphs of residues and index graphs) and numerical statistical analysis of the residues.
The degree of accuracy and suitability of the rheological models were evaluated using the coefficient of determination R2 and the sum of squared estimate of errors (SSE). The SSE is the sum of squares of the deviations of the data values from the predicted values (typically predicted from a Least Squares Analysis) using the general formula:
S S E = i = 1 n [ y i f ( x i ) ] 2
where y i is the ith value of the variable to be predicted, x i is the ith value of the explanatory variable, and f ( x i ) is the predicted value of y i .

3. Results and Discussion

3.1. Rheological Properties

In the first phase, the mathematical description of the shear stress and shear strain rate dependence was carried out. For this purpose, the Bingham (B), Herschel–Bulkley (H–B), and Casson (C) model were used. The results of the mathematical modelling are given in Table 3 and Table 4.
From the coefficients of rheological models, it is evident that with an increasing shear deformation rate, the chocolate masses reach higher values of plastic viscosity ( η B , η C ), resp. coefficient of consistency (K) than with the decreasing shear strain rate. With the increasing temperature for the individual samples, these values decrease [20].
All three rheological models used confirmed the plasticity of the chocolate masses, respectively, the samples showed a certain (non-negligible) flow limit [17,20], with the highest values of this limit being reached by DC and the lowest by RC. This may be due to the different proportions of non-fat and milk components [3,21].
The flow index (n) in the Herschel–Bulkley model confirmed the shear thinning (with the yield stress value) behaviour (n < 1) of the chocolate masses, which were not significantly affected by the temperature. With a decreasing shear strain rate, the shear thinning behaviour, especially in the MC, WC, and RC samples, was insignificant.
As the high values of the coefficient of determination R2 and low values of the sum of the squared estimate of errors SSE (Equation (5)) prove, the used rheological models are very suitable. The Herschel–Bulkley rheological model [22] seems to be the most suitable (based on the R2 and SSE values) for the chocolate masses, although the Casson model is also used for chocolate masses in the literature [19,20,21,23]. The values of the statistical indicators R2 and SSE are given in Table 5.

3.2. Hysteresis Area

Subsequently with rheological measurements, the hysteresis areas were calculated [16]. The highest values of the hysteresis area were reached by the MC and WC masses at a temperature of 36 °C; on the contrary, the lowest values were reached in the RC sample. All the area values are detailed in Table 6.
The magnitude of the hysteresis area was significantly affected by the temperature; with an increasing temperature, the value of area decreased and, thus, the degree of thixotropic behaviour of the chocolate masses. With an increasing temperature, the chocolate masses, with the exception of the RC masses, took less time to reaggregate their original structure [24]. An increase in the hysteresis area at 44 °C was observed for the EDC and DC masses, due to the different structure of these high cocoa and low-fat masses [25].

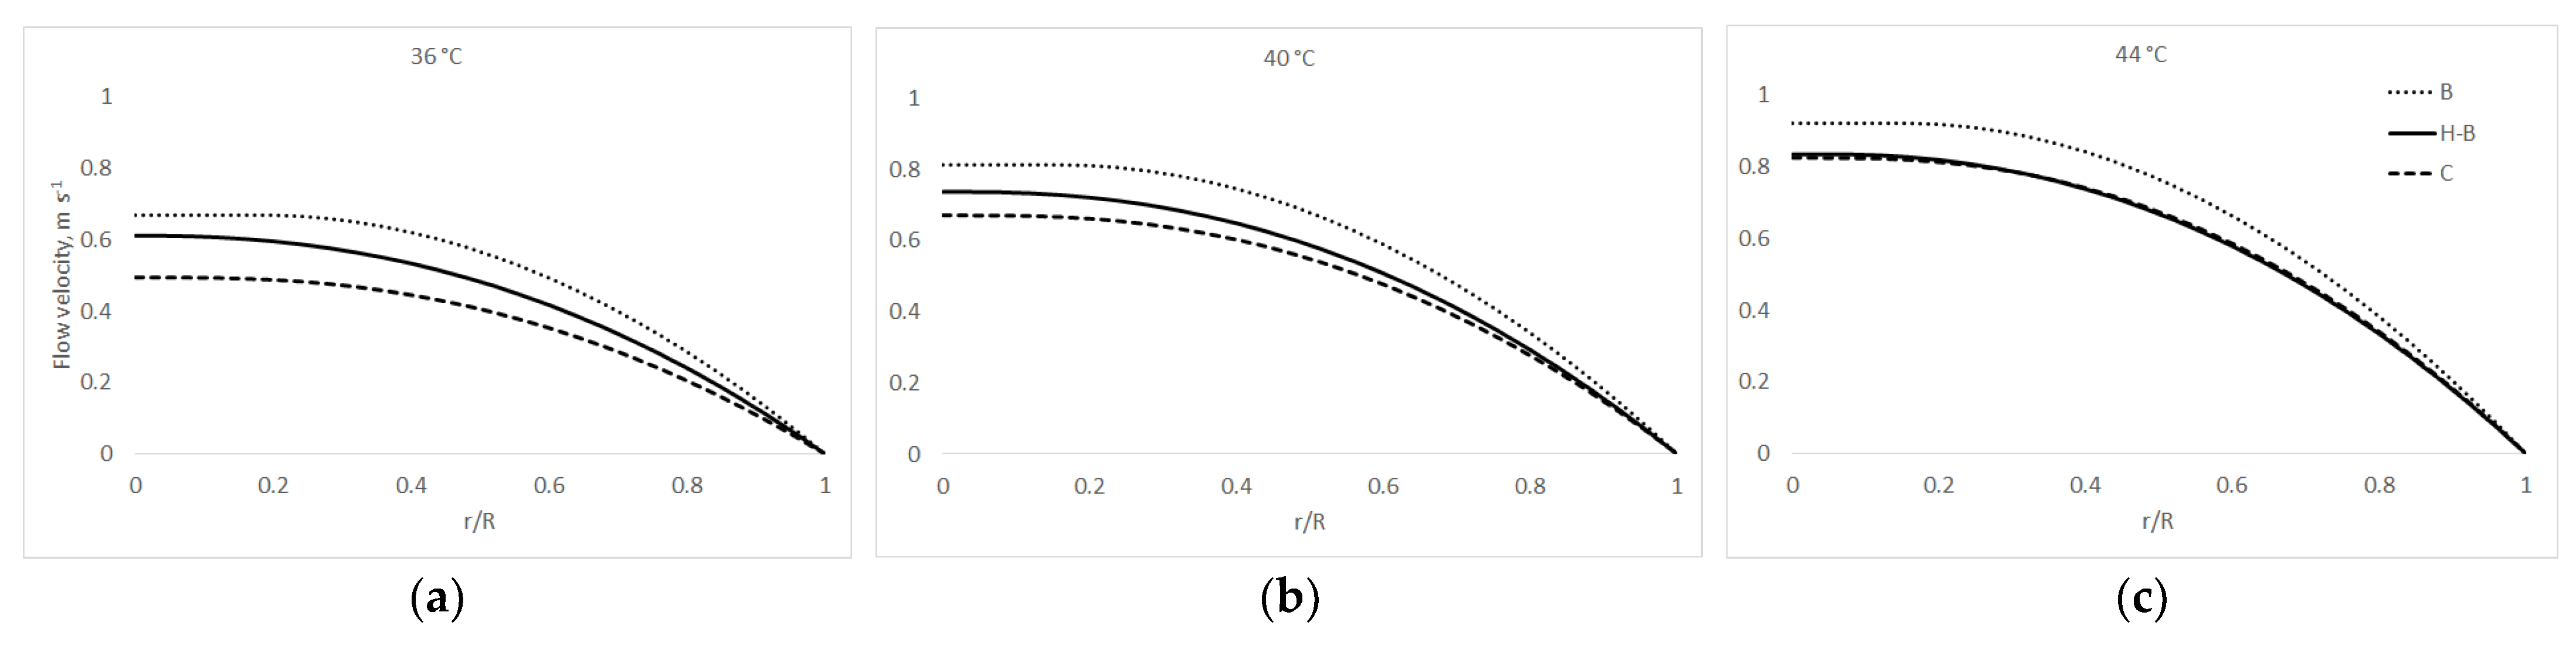
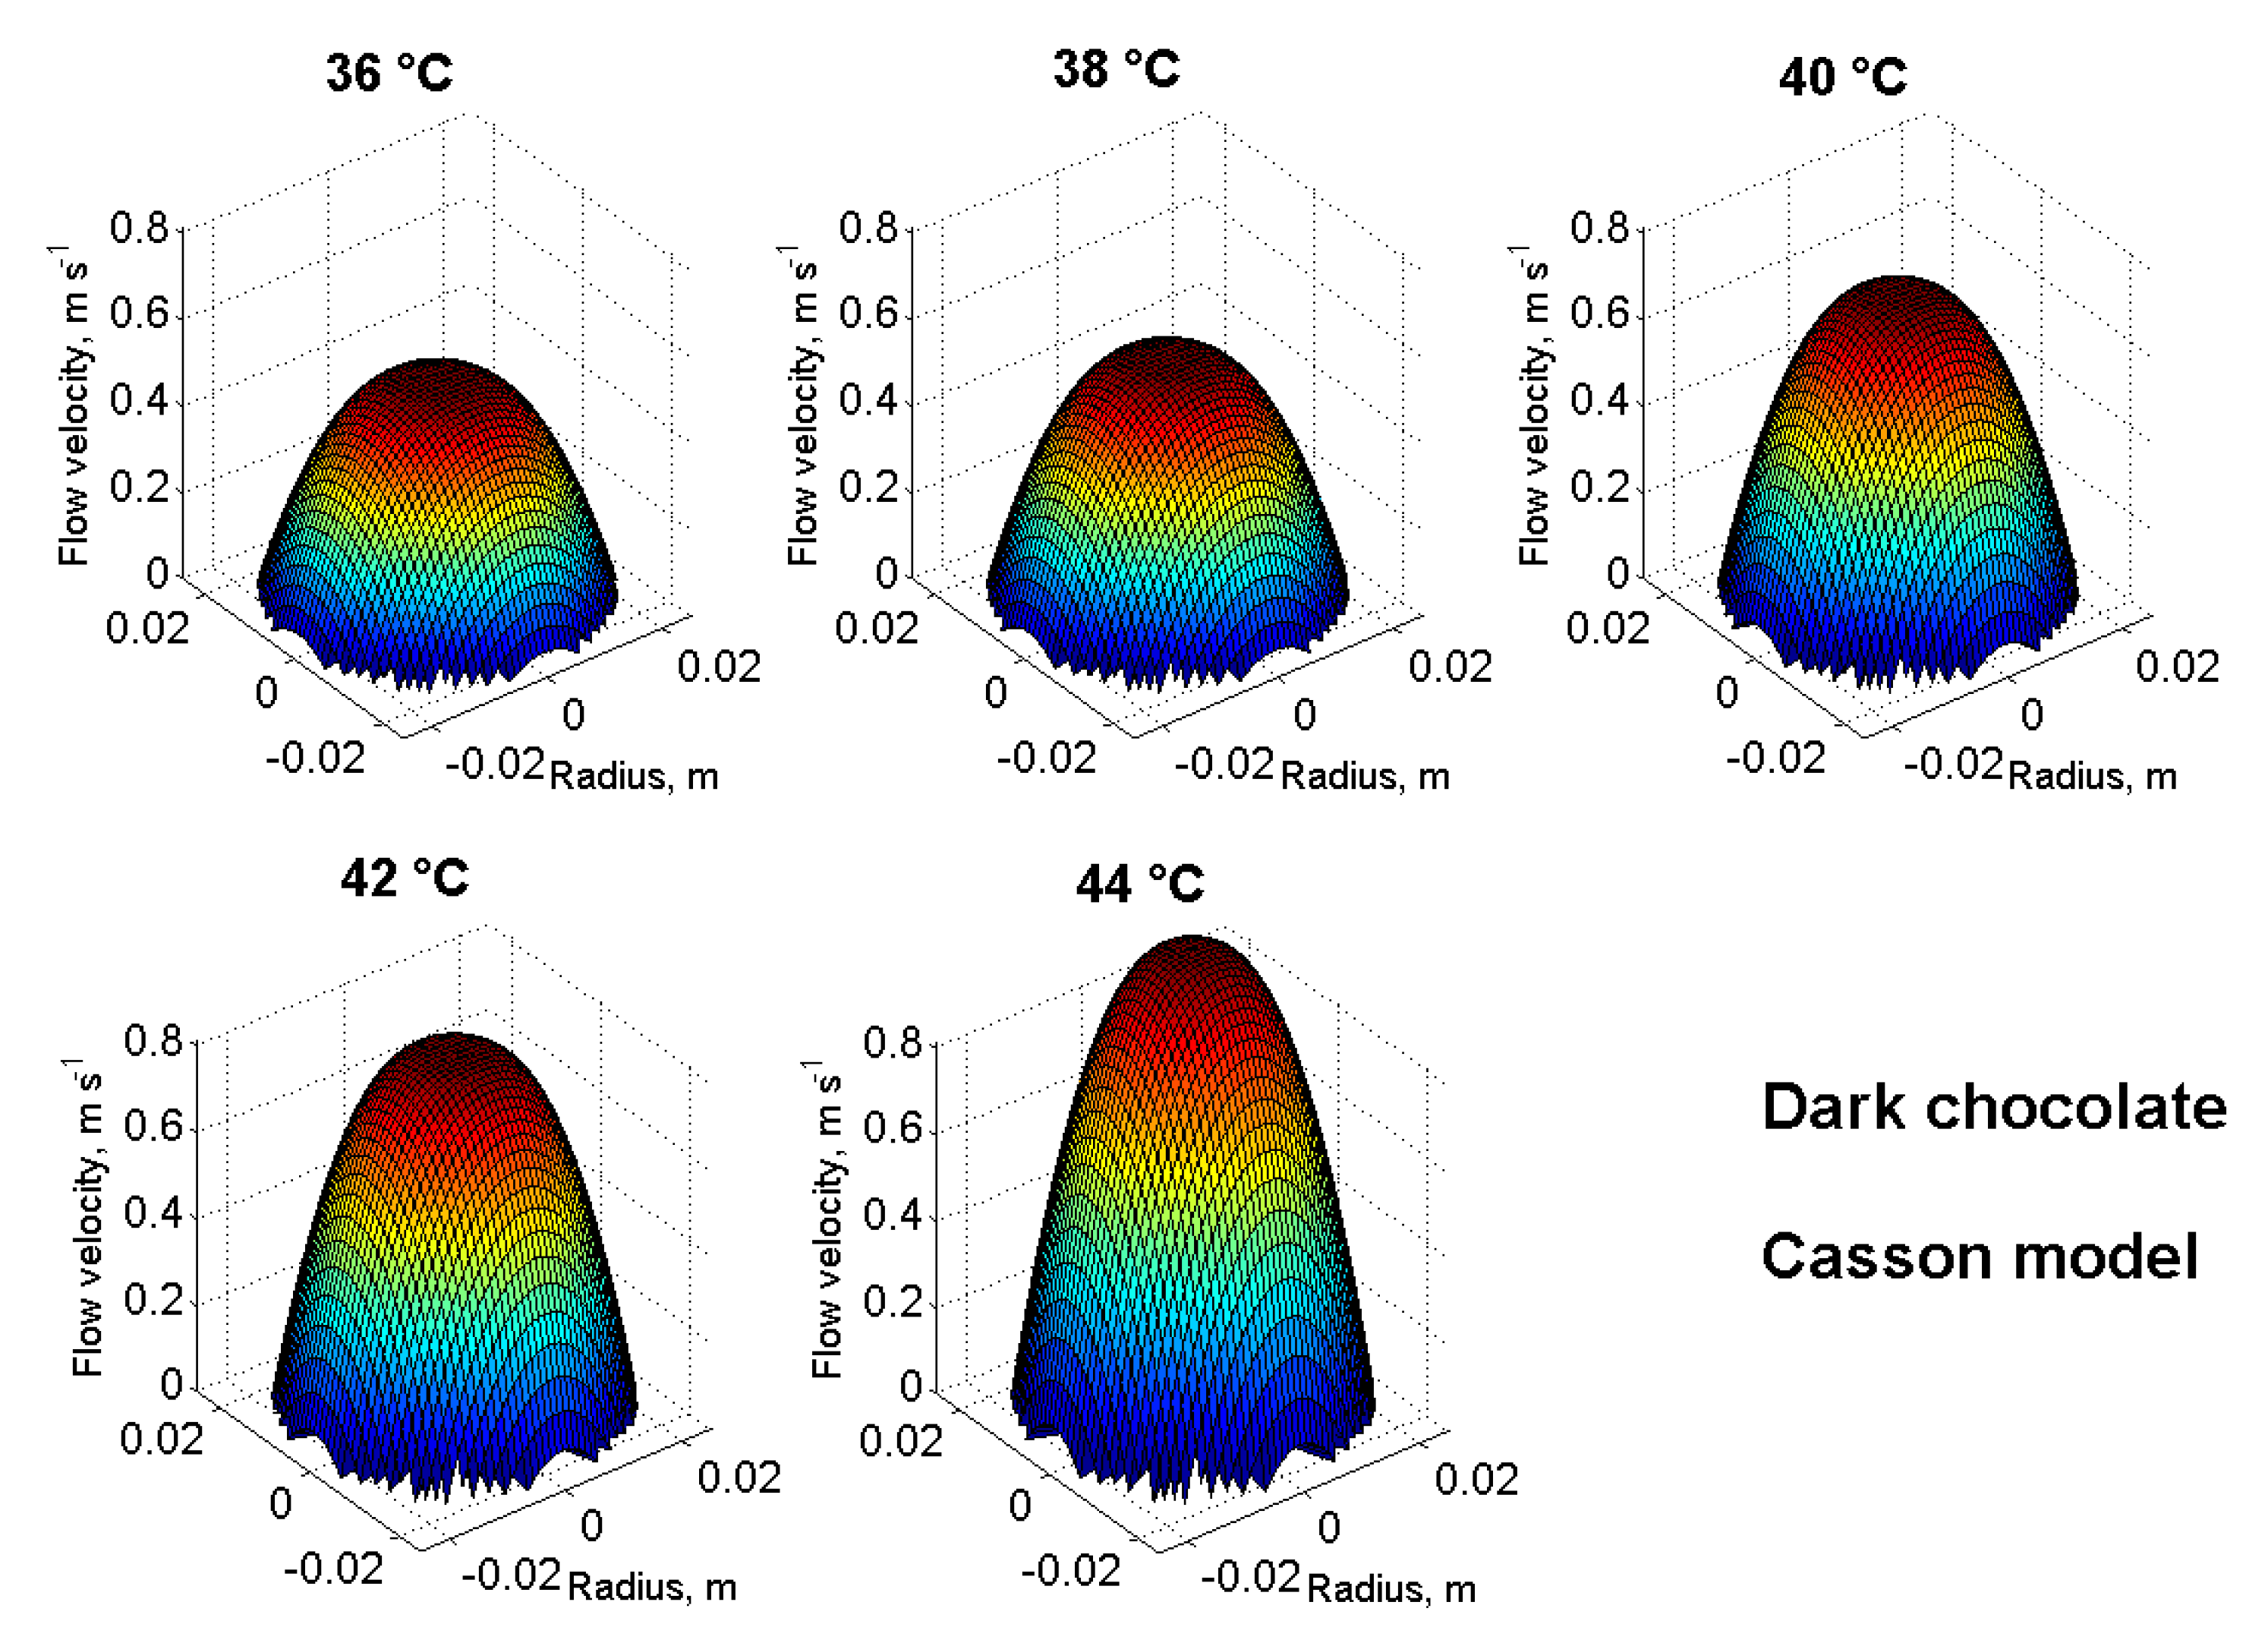
3.3. Pipe Flow Properties

The compilation of the flow curves using the rheological models not only serves to determine the flow behaviour of liquids, but the values of the coefficients can be further used to model the physical-mechanical states of liquids, e.g., during their flow [26,27]. It is possible to calculate using the coefficients of the rheological models, for example, the mean and maximum flow velocity, volume and mass flow, coefficients of friction at the wall-liquid interface, and Reynolds number, which can be used to distinguish laminar, transient, and turbulent flow, etc. [28]. Modelling the velocity profiles of a liquid after stabilisation of both two-dimensional and three-dimensional flow seems to be the most beneficial for technical practice. For Newtonian fluids, for which the viscosity does not change with an increasing shear strain rate, such modelling is quite common and simple [29,30,31,32], but for non-Newtonian models, it is more difficult [33,34].
During tempering and other methods of processing, chocolate masses are often transported by pipelines, where the velocity profiles can be modelled using modified relationships for non-Newtonian fluids.
For Newtonian fluids, the flow velocity at any point in the pipeline can be calculated according to:
v = p 4   η   L   ( R 2 r 2 )
where v is the flow velocity, p is the pressure drop in the pipe, η is the dynamic viscosity, L is the length of the pipe, R is the radius of the pipe, and r is the distance from the pipe axis.
By modifying Equation (6), it is possible to obtain the following Equations (7)–(9), which are not widely used in the FoodTech sciences, but rather in construction materials [35], medicine and pharmaceuticals [36], the chemical industry [37], and specific polymeric materials [38]. However, as demonstrated above, these relationships are also applicable for the purpose of modelling the flow behaviour of foods and food raw materials.
To calculate the flow velocity of Bingham fluids, it is necessary to adjust the relationship and introduce the appropriate coefficients of the model [39]:
v = p   R 2 4   L   η B [ 1 ( r R ) 2 ] r   τ 0 η B ( 1 r R )
where η B is the Bingham plastic viscosity and τ 0 is the yield stress (using Bingham rheological model).
To calculate the flow velocity of liquids described by the Herschel–Bulkley rheological model, it is necessary to adjust the relationship and introduce the appropriate coefficients of the model [40]:
v = n 1 + n ( p L   K ) 1 n [ ( R R * ) n + 1 n ( r R * ) n + 1 n ]
where the plug radius R * = 2   L   τ 0 Δ p , n is the flow index, K is the consistency coefficient, and τ 0 is the yield stress (using Herschel–Bulkley rheological model).
To calculate the flow velocity of liquids described by Casson’s rheological model, it is necessary to adjust the relationship and introduce the appropriate coefficients of the model [41]:
v = R   τ w 2   η C 2 { [ 1 ( r R ) 2 ] 8 3 ( τ 0 τ w ) 1 2 [ 1 ( r R ) 3 2 ] + 2 τ 0 τ w ( 1 r R ) }
where the wall stress τ w = Δ p   R 2   L , η C is the Casson plastic viscosity, and τ 0 is the yield stress (using Bingham rheological model).
Using coefficients of the rheological models (Equations (1)–(4)) and formulas above (Equations (7)–(9)), it is possible to model the 2D velocity profiles. If we consider the standard diameter of the pipe, D = 50 mm; the length of the pipe, L = 1 m; and the pressure drop, Δp = 10 kPa, the different flow behaviours of chocolate masses can be seen from Figure 1, Figure 2 and Figure 3. The x-axis on Figure 1, Figure 2, Figure 3, Figure 4 and Figure 5 shows r/R, which is the dimensionless ratio of the distance from the pipeline axis to the fixed radius of the pipeline (D/2). It is certain that in the axis of the pipeline, the highest flow velocity is always the highest for real liquids.
Figure 1 models the EDC sample flow velocity using all three rheology models (1)–(3) and Equations (6)–(8) used above at temperatures of 36, 40, and 44 °C.
Figure 2 models the flow velocity of the MC sample using the Herschel–Bulkley model (Equation (2)) coefficients and Equation (8). The figure shows the temperature dependence of this chocolate mass, when the mass flows the fastest and vice versa at the highest temperature (44 °C) [20,21,42].
Figure 3 illustrates the different flow velocities of all five chocolate masses at a comparative temperature of 40 °C. In this case, Casson model (Equations (3) and (9)) were used.
In the above figures, the non-Newtonian behaviour of the chocolate masses can be seen, where the flow front is typically flattened, as reported by, for example [40,43]. This can, of course, cause complications in real technical practice—e.g., turbulence [44], even when using the current trends in the food industry, such as 3D food printing, where problems may occur with the supply of the liquid or semi-liquid raw material to the nozzle, clogging of the nozzle itself, etc. [45,46].
For a realistic idea and comparison of the flow properties of the samples, it is appropriate to supplement the modelling with three-dimensional velocity profiles of flowing chocolate masses. Figure 4 and Figure 5 were created by rotating Equations (7)–(9) around the pipeline axis using Matlab. Figure 4 shows the velocity profiles of all five chocolate masses used at a reference temperature of 38 °C and using the Casson model (Equations (3), (4) and (9)). Under the same conditions (temperature, length and diameter of the pipeline, and pressure drop), the chocolate masses show different flow velocities and partly also the shapes of the 3D velocity profile. In Figure 5, the DC velocity profiles at temperatures from 36 °C to 44 °C are modelled as an example using the Casson model (Equations (3), (4) and (9)). It can be seen from the figure that with an increasing temperature, the DC flow velocity also increased and the velocity profile approached a Newtonian liquid in shape.
If the flow front in Figure 4 and Figure 5 is flattened, it is a non-Newtonian behaviour, or transient or turbulent [47] flow may also occur. This would then be interesting for further research, such as the calculation of the Reynolds number. However, this is also possible using the coefficients of rheological models, see [28].

4. Conclusions

Based on the obtained experimental and calculated results and their discussion, it can be stated that both hypotheses were confirmed.
With an increasing temperature, the plastic viscosity or the consistency (depend on rheological model) of the chocolate masses also resulted in an increase in the flow velocity of the chocolate masses in the pipe. The size of the hysteresis area decreased with an increasing temperature and, thus, the degree of the thixotropic behaviour of the chocolate masses. Thus, with an increasing temperature, the chocolate masses, with the exception of the RC masses, needed less time to reaggregate their structure.
The Bingham, Herschel–Bulkley and Casson rheological models can be successfully used to construct the flow curves of the chocolate masses. According to statistical preachers (R2, SSE), the Herschel–Bulkley and Casson rheological models appear to be the most suitable. The coefficients of the rheological models can be used for further modelling. For example, the 2D and 3D velocity profiles that are very well applicable in practice. The technical equations used to model the flow velocity of liquids at any point between the axis and the pipeline wall can be successfully used to model other foods and food raw materials with plastic or pseudoplastic rheological behaviour.
The results of modelling the flow behaviour of the food and food raw materials can be used in conventional technical practice in the design of technological equipment structures and in current trends in the food industry, such as 3D food printing.

Author Contributions

Conceptualization: V.K. (Vojtěch Kumbár) and L.H.; methodology: V.K. (Vojtěch Kumbár), J.V. and L.H.; validation: V.K. (Vojtěch Kumbár), V.K. (Veronika Kouřilová) and L.H.; formal analysis: V.K. (Vojtěch Kumbár), V.K. (Veronika Kouřilová), R.D. and L.H.; investigation: V.K. (Vojtěch Kumbár), V.K. (Veronika Kouřilová), R.D., J.V. and L.H.; data curation: V.K. (Vojtěch Kumbár); re-sources: V.K. (Vojtěch Kumbár) and L.H.; writing—original draft preparation: V.K. (Vojtěch Kumbár), V.K. (Veronika Kouřilová) and R.D.; project ad-ministration: V.K. (Vojtěch Kumbár); funding acquisition: V.K. (Vojtěch Kumbár). All authors have read and agreed to the published version of the manuscript.

Funding

This research was funded by the Internal Grant Agency of the Faculty of AgriSciences no. AF-IGA-2020-TP006 “Modelling of rheological properties of liquid and semi-liquid food raw materials and foods showing non-Newtonian behaviour”.

Institutional Review Board Statement

Not applicable.

Informed Consent Statement

Not applicable.

Data Availability Statement

The data presented in this study are available on request from the corresponding author.

Conflicts of Interest

The authors declare no conflict of interest. The funders had no role in the design of the study; in the collection, analyses, or interpretation of data; in the writing of the manuscript; or in the decision to publish the results.

References

  1. Selvasekaran, P.; Chidambaram, R. Advances in formulation for the production of low-fat, fat-free, low-sugar, and sugar-free chocolates: An overview of the past decade. Trends Food Sci. Technol. 2021, 113, 315–334. [Google Scholar] [CrossRef]
  2. Directive (EC) No 36/2000 of the European parliament and of the council of 23 June 2000 relating to cocoa and chocolate products intended for human consumption. OJ L 197 2000, 3, 19.
  3. Afoakwa, E.O. Chocolate Science and Technology, 1st ed.; Willey Blackwell: York, UK, 2010; 275p. [Google Scholar]
  4. Glicerina, V.; Balestra, F.; Dalla Rosa, M.; Romani, S. Microstructural and rheological characteristics of dark, milk and white chocolate. J. Food Eng. 2016, 169, 165–171. [Google Scholar] [CrossRef]
  5. Martinez-Inchausti, A. Legal aspects of chocolate manufacture. In Industrial Chocolate Manufacture and Use, 4th ed.; Beckett, S.T., Ed.; Wiley Online Library: Hoboken, NJ, USA, 2009; pp. 576–594. [Google Scholar] [CrossRef]
  6. Dumarche, A.; Troplin, P.; Bernaert, H.; Lechevalier, P.; Beerens, H.; Landuyt, A. Process for Producing Cocoa-Derived Material. European Patent EP2237677B1, 13 June 2012. [Google Scholar]
  7. Tuenter, E.; Sakavitsi, M.E.; Rivera-Mondragon, A.; Hermans, N.; Foubert, K.; Halabalaki, M.; Pieters, L. Ruby chocolate: A study of its phytochemical composition and quantitative comparison with dark, milk and white chocolate. Food Chem. 2021, 343, 1–12. [Google Scholar] [CrossRef] [PubMed]
  8. Montoya, C.C.; Valencia, W.G.; Sierra, J.A.; Penagos, L. Enhanced pink-red hues in processed powders from unfermented cacao beans. LWT 2021, 138, 110671. [Google Scholar] [CrossRef]
  9. Lillah, A.; Asghar, I.; Pasha, G.; Murtaza, M.A. Improving heat stability along with quality of compound dark chocolate by adding optimized cocoa butter substitute (hydrogenated palm kernel stearin) emulsion. LWT-Food Sci. Technol. 2017, 80, 531–536. [Google Scholar] [CrossRef]
  10. Żyżelewicz, D.; Budryn, G.; Oracz, J.; Antolak, H.; Kręgiel, D.; Kaczmarska, M. The effect on bioactive components and characteristics of chocolate by functionalization with raw cocoa beans. Food Res. Int. 2018, 113, 234–244. [Google Scholar] [CrossRef]
  11. Juszczak, L.; Witczak, M.; Fortuna, T.; Banys, A. Rheological properties of commercial mustards. J. Food Eng. 2004, 63, 209–271. [Google Scholar] [CrossRef]
  12. Beckett, S.T. The Science of Chocolate, 1st ed.; Royal Society of Chemistry Paperbacks: London, UK, 2000; 175p. [Google Scholar]
  13. Balmforth, N.J.; Frigaard, I.A.; Ovarlez, G. Yielding to Stress: Recent Developments in Viscoplastic Fluid Mechanics. Annu. Rev. Fluid Mech. 2014, 46, 121–146. [Google Scholar] [CrossRef]
  14. Tran, P.D.; Van Durme, J.; Van de Walle, D.; de Winne, A.; Delbaere, C.; de Clercq, N.; Dewettinck, K. Quality attributes of dark chocolate produced from vietnamese cocoa liquors. J. Food Qual. 2016, 39, 311–322. [Google Scholar] [CrossRef]
  15. Hinneh, M.; Van de Walle, D.; Haeck, J.; Abotsi, E.E.; De Winne, A.; Saputro, A.D.; Dewettinck, K. Applicability of the melanger for chocolate refining and stephan mixer for conching as small-scale alternative chocolate production techniques. J. Food Eng. 2019, 253, 59–71. [Google Scholar] [CrossRef]
  16. Přidal, A.; Trávníček, P.; Kudělka, J.; Nedomová, Š.; Ondrušíková, S.; Trost, D.; Kumbár, V. A rheological analysis of biomaterial behaviour as a tool to detect the dilution of heather honey. Materials 2021, 14, 2472. [Google Scholar] [CrossRef]
  17. Bergemann, N.; Heil, M.; Smith, B.; Juel, A. From elastic deformation to flow in tempered chocolate. J. Rheol. 2018, 62, 1187–1195. [Google Scholar] [CrossRef]
  18. Kumbár, V.; Nedomová, Š.; Trnka, J.; Buchar, J.; Pytel, R. Effect of storage duration on the rheological properties of goose liquid egg products and eggshell membranes. Poult. Sci. 2016, 95, 1693–1701. [Google Scholar] [CrossRef] [PubMed]
  19. Lannes, S.C.S.; Medeiros, M.L.; Gioielli, L.A. Rheological properties of cupuassu and cocoa fats. Grasas Y Aceites 2004, 55, 115–121. [Google Scholar] [CrossRef]
  20. Fernandes, V.A.; Müller, A.J.; Sandoval, A.J. Thermal, structural and rheological characteristics of dark chocolate with different compositions. J. Food Eng. 2013, 116, 97–108. [Google Scholar] [CrossRef]
  21. Hřivna, L.; Machálková, L.; Burešová, I.; Nedomová, Š.; Gregor, T. Texture, color, and sensory changes occurring in chocolate bars with filling during storage. Food Sci. Nutr. 2021, 9, 4863–4873. [Google Scholar] [CrossRef]
  22. de Jesus Silva, G.; Gonçalves, B.R.F.; de Jesus, J.C.; Vidigal, M.C.T.R.; Minim, L.A.; Ferreira, S.O.; Ferrão, S.P.B. Study of the structural properties of goat′s milk chocolates with different concentrations of cocoa mass. J. Texture Stud. 2019, 50, 547–555. [Google Scholar] [CrossRef]
  23. Eduardo, M.F.; Correa De Mello, K.G.P.; Polakiewicz, B.; Da Silva Lannes, S.C. Evaluation of chocolate milk beverage formulated with modified chitosan. J. Agric. Sci. Technol. 2014, 16, 1301–1312. [Google Scholar]
  24. Sikora, M.; Adamczyk, G.; Krystyjan, M. Thixotropy as a measure of liquid food producs. Food Sci. Technol. Qual. 2011, 18, 5–14. [Google Scholar] [CrossRef]
  25. Servais, C.; Ranc, H.; Roberts, I.D. Determination of chocolate viscosity. J. Texture Stud. 2003, 34, 467–497. [Google Scholar] [CrossRef]
  26. Vlaev, S.D.; Staykov, P.; Popov, R. Pressure distribution at impeller blades of some radial flow impellers in saccharose and xanthan gum solutions: A CFD visualization approach. Food Bioprod. Process. 2004, 82, 13–20. [Google Scholar] [CrossRef]
  27. Žitný, R.; Landfeld, A.; Skočilas, J.; Štancl, J.; Flegl, V.; Zachariášová, M.; Houška, M. Hydraulic characteristic of collagen. Czech J. Food Sci. 2015, 33, 479–485. [Google Scholar] [CrossRef] [Green Version]
  28. Kumbár, V.; Strnková, J.; Nedomová, Š.; Buchar, J. Fluid dynamics of liquid egg products. J. Biol. Phys. 2015, 41, 303–311. [Google Scholar] [CrossRef] [PubMed] [Green Version]
  29. Kumbár, V.; Polcar, A.; Votava, J. Physical and mechanical properties of bioethanol and gasoline blends. Listy Cukrov. A Reparske 2015, 131, 112–115. [Google Scholar]
  30. Devakar, M.; Raje, A. Modelling and analysis of the unsteady flow and heat transfer of immiscible micropolar and newtonian fluids through a pipe of circular cross section. J. Braz. Soc. Mech. Sci. Eng. 2018, 40, 1–18. [Google Scholar] [CrossRef]
  31. Arosemena, A.A.; Andersson, H.I.; Solsvik, J. Turbulent channel flow of generalized newtonian fluids at a low reynolds number. J. Fluid Mech. 2021, 908, A43. [Google Scholar] [CrossRef]
  32. Nedomová, Š.; Kumbár, V.; Pytel, R.; Buchar, J. Mechanical properties of sugar beet root during storage. Int. Agrophys. 2017, 31, 507–513. [Google Scholar] [CrossRef] [Green Version]
  33. Mehta, D.; Radhakrishnan, A.K.T.; van Lier, J.; Clemens, F. A wall boundary condition for the simulation of a turbulent non-newtonian domestic slurry in pipes. Water 2018, 10, 124. [Google Scholar] [CrossRef] [Green Version]
  34. Baranovskii, E.S. A novel 3D model for non-newtonian fluid flows in a pipe network. Math. Methods Appl. Sci. 2021, 44, 3827–3839. [Google Scholar] [CrossRef]
  35. Clauss, J. Taming turbulent piping-system flow. HPAC Heat. Pip. AirCond. Eng. 2009, 81, 36–43. [Google Scholar]
  36. Xue, H.; Fung, Y.C. Persistence of asymmetry in nonaxisymmetric entry flow in a circular cylindrical tube and its relevance to arterial pulse wave diagnosis. J. Biomech. Eng. 1989, 111, 37–41. [Google Scholar] [CrossRef]
  37. Jirkovsky, L.; Boot, L.M. Numerical tests of a new molecule-dependent momentum transport equation. Phys. A Stat. Mech. Appl. 2008, 387, 5012–5016. [Google Scholar] [CrossRef]
  38. Edomwonyi-Otu, L.C. Distortion of velocity profiles of water flow with heavy molecular weight polymers. Defect Diffus. Forum 2019, 392, 228–238. [Google Scholar] [CrossRef]
  39. Simpson, M.M.; Janna, W.S. Newtonian and non-newtonian fluids: Velocity profiles, viscosity data, and laminar flow friction factor equations for flow in a circular duct. In Proceedings of the ASME International Mechanical Engineering Congress and Exposition, Lake Buena Vista, FL, USA, 13–19 November 2009; Volume 9, pp. 173–180. [Google Scholar] [CrossRef]
  40. Wiklund, J.; Stading, M.; Trägårdh, C. Monitoring liquid displacement of model and industrial fluids in pipes by in-line ultrasonic rheometry. J. Food Eng. 2010, 99, 330–337. [Google Scholar] [CrossRef]
  41. Das, B.; Bishop, J.J.; Kim, S.; Meiselman, H.J.; Johnson, P.C.; Popel, A.S. Red blood cell velocity profiles in skeletal muscle venules at low flow rates are described by the casson model. Clin. Hemorheol. Microcirc. 2007, 36, 217–233. [Google Scholar]
  42. Ardakani, H.A.; Mitsoulis, E.; Hatzikiriakos, S.G. Capillary flow of milk chocolate. J. Non-Newton. Fluid Mech. 2014, 210, 56–65. [Google Scholar] [CrossRef]
  43. Pegoraro, P.R.; Marangoni, M.; Gut, J.A.W. Residence time distribution models derived from non-ideal laminar velocity profiles in tubes. Chem. Eng. Technol. 2012, 35, 1593–1603. [Google Scholar] [CrossRef]
  44. Song, K.; Al-Salaymeh, A.; Jovanovic, J.; Rauh, C.; Delgado, A. Experimental in situ investigations of turbulence under high pressure. Ann. N. Y. Acad. Sci. 2010, 1189, 24–33. [Google Scholar] [CrossRef] [PubMed]
  45. Zelený, P.; Růžička, V. The design of the 3D printer for use in gastronomy. Mod. Mach.(MM) Sci. J. 2017, 1744–1747. [Google Scholar] [CrossRef]
  46. Rando, P.; Ramaioli, M. Food 3D printing: Effect of heat transfer on print stability of chocolate. J. Food Eng. 2021, 294, 110415. [Google Scholar] [CrossRef]
  47. Walker, J.H. Bulk chocolate handling. In Industrial Chocolate Manufacture and Use, 4th ed.; Beckett, S.T., Ed.; Wiley Online Library: Hoboken, NJ, USA, 2009; pp. 247–260. [Google Scholar] [CrossRef]
Figure 1. EDC velocity profiles: at (a) 36 °C; at (b) 40 °C; and at (c) 44 °C.
Foods 10 02519 g001
Figure 2. MC velocity profiles at temperatures of 36–44 °C using the H–B model.
Foods 10 02519 g002
Figure 3. 2D velocity profiles of the chocolate masses at 40 °C using the Casson model.
Foods 10 02519 g003
Figure 4. 3D velocity profiles of the chocolate masses at 38 °C using the Casson model.
Foods 10 02519 g004
Figure 5. 3D velocity profiles at 36–44 °C of DC using the Casson model.
Foods 10 02519 g005
Table 1. Nutritional data of the chocolate masses.
Chocolate MassNutritional Information Per 100 gComposition
Energy ValueFatsCarbohydratesProteinsSalt
Of Which Saturated Fatty AcidsOf Which Sugars
EDC2576.0 kJ53.0 g14.6 g15.0 g0.2 g100% cocoa components
20.0 g1.0 g
DC2264.6 kJ35.0 g46.9 g5.7 g<0.005 g55.5% cocoa components, sugar, cocoa butter (35.0%), emulsifier: soy lecithin (E322), aroma: natural vanilla
21.6 g44.0 g
MC2297.2 kJ33.3 g55.6 g5.8 g0.206 g36.5% cocoa components, sugar, cocoa butter (29.0%), whole milk powder, lactose, whey powder, emulsifier: soy lecithin (E322), aroma: natural vanilla
20.4 g54.7 g
WC2360.5 kJ35.1 g56.1 g6.4 g0.234 g28% cocoa components, sugar, cocoa butter (28%), whole milk powder, emulsifier: soy lecithin (E322), aroma: natural vanilla
21.3 g56.1 g
RC2356.0 kJ35.9 g49.6 g9.3 g0.270 g47.3% cocoa components, sugar, cocoa butter, whole milk powder, emulsifier: soy lecithin (E322), acidity regulator: citric acid, aroma: natural vanilla
21.5 g48.5 g
EDC—extra dark chocolate, DC—dark chocolate, MC—milk chocolate, WC—white chocolate, RB—ruby chocolate.
Table 2. Specific tempering temperatures of chocolate masses.
Melting Temperature, °CCooling Temperature, °CWorking Temperature, °C
EDC5528.5–29.529.5–30.5
DC45–5028–2931–32
MC40–4527–2830–31
WC40–4225–2628–29
RC452728.5–29.5
Table 3. Coefficients of the rheological models with an increasing shear strain rate (n = 3).
1→500 s−1T, °CBingham ModelHerschel–Bulkley ModelCasson Model
τ0 (Pa)ηB (Pa·s)SSER2τ0 (Pa)K (Pa·sn)n (−)SSER2τ0 (Pa)ηC (Pa·s)SSER2
EDC3622.271.57219,3400.99140.8704.6880.818514150.99945.8651.27660450.9973
3823.211.45617,4600.99093.0024.4150.815815060.99926.7041.16853140.9972
4019.791.36010,6400.99374.3063.4980.84298250.99955.3551.11528440.9983
4218.221.29180900.99464.6843.1220.85314870.99974.8861.06818880.9987
4418.621.22574020.99465.8202.9510.85375870.99965.2971.00617680.9987
DC3632.921.46252720.997322.282.7880.89253190.99989.9591.13310120.9995
3831.681.38957440.996720.482.8140.88253220.999810.0501.0758860.9995
4027.731.25727310.998120.292.1500.91052250.99988.6950.98910070.9993
4222.681.03517000.998217.961.5810.92936260.99947.5430.82717050.9982
4430.081.10137280.996620.862.2840.87851440.999911.8910.8353000.9997
MC3626.292.01840580.998918.292.9270.938010010.99973.7241.71825050.9993
3821.511.7028350.999718.482.0260.97093730.99992.9451.47826440.9990
4021.261.61211160.999517.402.0320.96143710.99983.2771.38722250.9990
4224.841.48610220.999520.591.9540.95441480.99995.1991.23320540.9990
4422.071.4299790.999519.801.6700.97407180.99964.1371.21032460.9982
WC3622.951.80247490.998413.172.9610.91733380.99993.8021.5289300.9997
3821.041.60631250.998713.292.5090.92563140.99993.7431.3649150.9996
4018.431.26415410.999013.881.7760.94334500.99973.9371.07212660.9991
4224.241.47261220.996912.672.9360.88513100.99986.0331.1997360.9996
4424.271.39337620.997915.842.4100.90875620.99976.1411.1359510.9995
RB3616.071.38515430.999111.051.9510.94293230.99982.7091.2058530.9995
3814.401.2585640.999611.321.5930.9606960.99992.4101.1047030.9995
4011.681.1233680.99979.801.3230.97261900.99981.8481.0027840.9993
4214.211.0713120.999712.071.3020.9675830.99992.9440.9298080.9992
4416.211.0202370.999714.981.1490.98011590.99983.8570.86815790.9983
Table 4. Coefficients of the rheological models at a decreasing shear strain rate (n = 3).
500→1 s−1T, °CBingham ModelHerschel–Bulkley ModelCasson Model
τ0 (Pa)ηB (Pa·s)SSER2τ0 (Pa)K (Pa·sn)n (−)SSER2τ0 (Pa)ηC (Pa·s)SSER2
EDC3617.981.49115,1200.992504.0710.833013100.99944.4771.23950040.9975
3819.461.40680480.99558.2582.8270.883724160.99864.4281.17537090.9979
4018.121.31964490.99598.7502.4800.894924100.99854.1101.11034810.9978
4213.431.27953380.99643.0922.5940.88236230.99962.8821.10216600.9989
4415.841.20143320.99679.8941.8960.923825920.99803.3441.02935940.9972
DC3621.941.46220870.998915.462.2100.93121280.99994.5631.2247060.9996
3821.261.38025990.998514.182.2130.92132790.99984.8011.1497610.9996
4015.861.27644570.99707.972.2310.906917760.99883.5411.08613340.9991
4220.851.01613420.998618.841.2320.968011340.99886.2250.83032540.9965
4418.381.09811600.998913.541.6550.9316630.99994.9380.9135030.9995
MC3619.301.85426250.999216.412.1610.974422130.99932.0771.64435700.9988
3815.281.6652190.999915.551.6381.00302160.99991.3091.51624610.9990
4017.221.5832780.999917.281.5771.00102780.99991.8141.41932770.9985
4218.931.46115280.999222.001.1701.03709970.99952.1341.30372790.9962
4411.851.43624910.99878.951.7480.967220860.99891.4151.29620110.9989
WC3617.601.65819430.999216.171.8060.985718400.99931.9531.47737570.9985
3811.471.57523140.99906.762.0950.952412740.99941.2761.4279560.9996
4012.441.2311780.999911.131.3670.9824910.99991.7371.1028540.9994
4214.971.4404080.999812.631.6880.97351340.99991.9501.28111070.9994
4410.921.38523120.99876.881.8320.953315420.99911.4181.24812800.9993
RB3612.6301.37310290.999412.3011.4070.995910230.99941.2331.25427680.9984
389.3641.2551570.99999.0671.2850.99601520.99990.8561.1628950.9994
409.1581.108610.99998.8591.1380.9955560.99991.0351.0187550.9993
429.2871.067770.99999.3551.0601.0010770.99991.1090.9798760.9991
449.3911.017350.99999.5611.0011.0030330.99991.2310.9298620.9991
Table 5. Values of the statistical indicators of the rheological models (n = 50).
ModelCoefficient of Determination R2Sum of Squared Estimate of Errors SSE
MeanMedianMINMAXSDMeanMedianMINMAXSD
Bingham0.99800.99890.99090.99990.0023358122003519,3404318
Herschel–Bulkley0.99960.99980.99800.99990.0004733372332592729
Casson0.99880.99910.99620.99970.00082034145730072791547
MIN—minimal value, MAX—maximal value, SD—standard deviation, H–B—Herschel–Bulkley model.
Table 6. Hysteresis values of the chocolate masses (n = 3).
Temperature, °CEDC, (Pa·s−1)DC, (Pa·s−1)MC, (Pa·s−1)WC, (Pa·s−1)RC, (Pa·s−1)
3612 814752125 78721 6943625
3895316771795388173147
4065543705615676573266
4239013446689290633238
4449246318450183633952
Publisher’s Note: MDPI stays neutral with regard to jurisdictional claims in published maps and institutional affiliations.

