
Handheld Devices for Food Authentication and Their Applications: A Review


Abstract
:1. Introduction
2. Generic Characteristics of Handheld Devices
2.1. Technologies Available in Miniaturised Form
2.1.1. Optical Sensors
2.1.2. Imaging Sensors
2.1.3. NMR
2.1.4. Sensor Arrays (Electronic Nose and Tongue)
2.2. Design and Mode of Operation of Commercially Available Handheld Devices
2.3. Data Handling and Output of the Handheld Devices
3. Current Applications of Handheld Devices for Food Authentication
3.1. Food Products of Animal Origin
3.1.1. Meat, Meat Products, and Offal
3.1.2. Milk and Milk Products
3.1.3. Fish and Seafood
3.1.4. Other Food Products of Animal Origin
3.2. Food Products of Plant Origin
3.2.1. Fresh and Dried Food Products of Plant Origin
3.2.2. Processed Food Products of Plant Origin
4. Handheld Applications: Type of Commodity versus Technology
5. Outlook
5.1. Issues Inhibiting Progress
5.2. Potential Solutions
Supplementary Materials
Author Contributions
Funding
Acknowledgments
Conflicts of Interest
References
- DEFRA. Elliott Review into the Integrity and Assurance of Food Supply Networks-Final Report. A National Food Crime Prevention Framework. Ref: PB14089. Available online: https://www.gov.uk/government/uploads/system/uploads/attachment_data/file/350726/elliot-review-final-report-july2014.pdf (accessed on 21 June 2021).
- Spink, J.; Bedard, B.; Keogh, J.; Moyer, D.C.; Scimeca, J.; Vasan, A. International Survey of Food Fraud and Related Terminology: Preliminary Results and Discussion. J. Food Sci. 2019, 84, 2705–2718. [Google Scholar] [CrossRef] [PubMed]
- EFSA Panel on Contaminants in the Food Chain (CONTAM); EFSA Panel on Food Contact Materials, Enzymes, Flavourings and Processing Aids (CEF). Flavourings and Processing Aids (CEF) Scientific Opinion on Melamine in Food and Feed. EFSA J. 2010, 8, 1573. [Google Scholar] [CrossRef]
- He, N.X.; Bayen, S. An overview of chemical contaminants and other undesirable chemicals in alcoholic beverages and strategies for analysis. Compr. Rev. Food Sci. Food Saf. 2020, 19, 3916–3950. [Google Scholar] [CrossRef]
- Yan, J.; Erasmus, S.W.; Aguilera Toro, M.; Huang, H.; van Ruth, S.M. Food fraud: Assessing fraud vulnerability in the extra virgin olive oil supply chain. Food Control 2020, 111, 107081. [Google Scholar] [CrossRef]
- Oliveira, M.M.; Cruz-Tirado, J.P.; Barbin, D.F. Nontargeted Analytical Methods as a Powerful Tool for the Authentication of Spices and Herbs: A Review. Compr. Rev. Food Sci. Food Saf. 2019, 18, 670–689. [Google Scholar] [CrossRef] [Green Version]
- McGrath, T.F.; Haughey, S.A.; Patterson, J.; Fauhl-Hassek, C.; Donarski, J.; Alewijn, M.; van Ruth, S.; Elliott, C.T. What are the scientific challenges in moving from targeted to non-targeted methods for food fraud testing and how can they be addressed?—Spectroscopy case study. Trends Food Sci. Technol. 2018, 76, 38–55. [Google Scholar] [CrossRef]
- Abasi, S.; Minaei, S.; Jamshidi, B.; Fathi, D. Dedicated non-destructive devices for food quality measurement: A review. Trends Food Sci. Technol. 2018, 78, 197–205. [Google Scholar] [CrossRef]
- Petronijević, R.B.; Velebit, B.; Baltić, T. Shedding light on food fraud: Spectrophotometric and spectroscopic methods as a tool against economically motivated adulteration of food. IOP Conf. Ser. Earth Environ. Sci. 2017, 85, 012024. [Google Scholar] [CrossRef] [Green Version]
- Xiaobo, Z.; Xiaowei, H.; Povey, M. Non-invasive sensing for food reassurance. Analyst 2016, 141, 1587–1610. [Google Scholar] [CrossRef] [Green Version]
- Rateni, G.; Dario, P.; Cavallo, F. Smartphone-Based Food Diagnostic Technologies: A Review. Sensors 2017, 17, 1453. [Google Scholar] [CrossRef]
- Kademi, H.I.; Ulusoy, B.H.; Hecer, C. Applications of miniaturized and portable near infrared spectroscopy (NIRS) for inspection and control of meat and meat products. Food Rev. Int. 2018, 35, 201–220. [Google Scholar] [CrossRef]
- Beganovic, A.; Hawthorne, L.M.; Bach, K.; Huck, C.W. Critical Review on the Utilization of Handheld and Portable Raman Spectrometry in Meat Science. Foods 2019, 8, 49. [Google Scholar] [CrossRef] [PubMed] [Green Version]
- Nascimento, C.F.; Santos, P.M.; Pereira-Filho, E.R.; Rocha, F.R.P. Recent advances on determination of milk adulterants. Food Chem. 2017, 221, 1232–1244. [Google Scholar] [CrossRef] [PubMed]
- Naila, A.; Flint, S.H.; Sulaiman, A.Z.; Ajit, A.; Weeds, Z. Classical and novel approaches to the analysis of honey and detection of adulterants. Food Control 2018, 90, 152–165. [Google Scholar] [CrossRef]
- dos Santos, C.A.; Lopo, M.; Pascoa, R.N.; Lopes, J.A. A review on the applications of portable near-infrared spectrometers in the agro-food industry. Appl. Spectrosc. 2013, 67, 1215–1233. [Google Scholar] [CrossRef]
- Crocombe, R.A. Portable Spectroscopy. Appl. Spectrosc. 2018, 72, 1701–1751. [Google Scholar] [CrossRef]
- Sikorska, E.; Khmelinskii, I.; Sikorski, M. Fluorescence spectroscopy and imaging instruments for food quality evaluation. In Evaluation Technologies for Food Quality; Zhong, J., Wang, X., Eds.; Woodhead Publishing: Cambridge, UK, 2019; pp. 491–533. [Google Scholar]
- Das, A.J.; Wahi, A.; Kothari, I.; Raskar, R. Ultra-portable, wireless smartphone spectrometer for rapid, non-destructive testing of fruit ripeness. Sci. Rep. 2016, 6, 32504. [Google Scholar] [CrossRef] [Green Version]
- Rodriguez-Saona, L.; Aykas, D.P.; Borba, K.R.; Urtubia, A. Miniaturization of optical sensors and their potential for high-throughput screening of foods. Curr. Opin. Food Sci. 2020, 31, 136–150. [Google Scholar] [CrossRef]
- Limm, W.; Karunathilaka, S.R.; Yakes, B.J.; Mossoba, M.M. A portable mid-infrared spectrometer and a non-targeted chemometric approach for the rapid screening of economically motivated adulteration of milk powder. Int. Dairy J. 2018, 85, 177–183. [Google Scholar] [CrossRef]
- Pan, M.; Sun, S.; Zhou, Q.; Chen, J. A Simple and Portable Screening Method for Adulterated Olive Oils Using the Hand-Held FTIR Spectrometer and Chemometrics Tools. J. Food Sci. 2018, 83, 1605–1612. [Google Scholar] [CrossRef]
- Gorla, G.; Mestres, M.; Boqué, R.; Riu, J.; Spanu, D.; Giussani, B. ATR-MIR spectroscopy to predict commercial milk major components: A comparison between a handheld and a benchtop instrument. Chemom. Intell. Lab. Syst. 2020, 200, 103995. [Google Scholar] [CrossRef]
- Qin, J.; Kim, M.S.; Chao, K.; Dhakal, S.; Cho, B.-K.; Lohumi, S.; Mo, C.; Peng, Y.; Huang, M. Advances in Raman spectroscopy and imaging techniques for quality and safety inspection of horticultural products. Postharvest Biol. Technol. 2019, 149, 101–117. [Google Scholar] [CrossRef]
- Markiewicz-Keszycka, M.; Cama-Moncunill, R.; Pietat Casado-Gavalda, M.; Sullivan, C.; Cullen, P.J. Laser-induced breakdown spectroscopy for food authentication. Curr. Opin. Food Sci. 2019, 28, 96–103. [Google Scholar] [CrossRef]
- Stuart, M.B.; McGonigle, A.J.S.; Willmott, J.R. Hyperspectral Imaging in Environmental Monitoring: A Review of Recent Developments and Technological Advances in Compact Field Deployable Systems. Sensors 2019, 19, 3071. [Google Scholar] [CrossRef] [Green Version]
- Khan, M.J.; Khan, H.S.; Yousaf, A.; Khurshid, K.; Abbas, A. Modern Trends in Hyperspectral Image Analysis: A Review. IEEE Access. 2018, 6, 14118–14129. [Google Scholar] [CrossRef]
- Capitani, D.; Sobolev, A.P.; Di Tullio, V.; Mannina, L.; Proietti, N. Portable NMR in food analysis. Chem. Biol. Technol. Agric. 2017, 4. [Google Scholar] [CrossRef] [Green Version]
- Shi, H.; Zhang, M.; Adhikari, B. Advances of electronic nose and its application in fresh foods: A review. Crit. Rev. Food Sci. Nutr. 2018, 58, 2700–2710. [Google Scholar] [CrossRef] [PubMed]
- Zaukuu, J.L.Z.; Bazar, G.; Gillay, Z.; Kovacs, Z. Emerging trends of advanced sensor based instruments for meat, poultry and fish quality—A review. Crit. Rev. Food Sci. Nutr. 2020, 60, 3443–3460. [Google Scholar] [CrossRef] [PubMed]
- Jia, W.; Liang, G.; Jiang, Z.; Wang, J. Advances in Electronic Nose Development for Application to Agricultural Products. Food Anal. Methods 2019, 12, 2226–2240. [Google Scholar] [CrossRef]
- Śliwińska, M.; Wiśniewska, P.; Dymerski, T.; Wardencki, W.; Namieśnik, J. Advances in Electronic Noses and Tongues for Food Authenticity Testing. In Advances in Food Authenticity Testing; Downey, G., Ed.; Elsevier: Amsterdam, The Netherlands, 2016; pp. 201–225. [Google Scholar]
- Wojnowski, W.; Majchrzak, T.; Dymerski, T.; Gebicki, J.; Namiesnik, J. Electronic noses: Powerful tools in meat quality assessment. Meat Sci. 2017, 131, 119–131. [Google Scholar] [CrossRef]
- Di Natale, C.; Dini, F.; Scozzari, A. Non-conventional Electrochemical and Optical Sensor Systems. In Threats to the Quality of Groundwater Resources: Prevention and Control; Scozzari, A., Dotsika, E., Eds.; Springer: Berlin/Heidelberg, Germany, 2016; pp. 279–311. [Google Scholar]
- Podrazka, M.; Baczynska, E.; Kundys, M.; Jelen, P.S.; Witkowska Nery, E. Electronic Tongue-A Tool for All Tastes? Biosensors 2017, 8, 3. [Google Scholar] [CrossRef] [Green Version]
- Zhang, D.; Liu, Q. Biosensors and bioelectronics on smartphone for portable biochemical detection. Biosens. Bioelectron. 2016, 75, 273–284. [Google Scholar] [CrossRef]
- Nabok, A.; Al-Rubaye, A.G.; Al-Jawdah, A.M.; Tsargorodska, A.; Marty, J.L.; Catanante, G.; Szekacs, A.; Takacs, E. Novel optical biosensing technologies for detection of mycotoxins. Opt. Laser Technol. 2019, 109, 212–221. [Google Scholar] [CrossRef]
- Rady, A.; Fischer, J.; Reeves, S.; Logan, B.; Watson, N.J. The Effect of Light Intensity, Sensor Height, and Spectral Pre-Processing Methods when using NIR Spectroscopy to Identify Different Allergen-Containing Powdered Foods. Sensors 2019, 20, 230. [Google Scholar] [CrossRef] [Green Version]
- Arsalane, A.; Klilou, A.; Tabyaoui, A.; El Barbri, N.; Rhofir, K. Beef and horse meat discrimination and storage time classification using a portable device based on DSP and PCA method. Int. J. Intell. Enterp. 2017, 4. [Google Scholar] [CrossRef]
- Qing, Z.; Ji, B.; Zude, M. Non-destructive analyses of apple quality parameters by means of laser-induced light backscattering imaging. Postharvest. Biol. Technol. 2008, 48, 215–222. [Google Scholar] [CrossRef]
- Kim, M.S.; Lefcourt, A.M.; Chen, Y.-R.; Tao, Y. Automated detection of fecal contamination of apples based on multispectral fluorescence image fusion. J. Food Eng. 2005, 71, 85–91. [Google Scholar] [CrossRef]
- Makky, M. A Portable Low-cost Non-destructive Ripeness Inspection for Oil Palm FFB. Agric. Agric. Sci. Procedia 2016, 9, 230–240. [Google Scholar] [CrossRef] [Green Version]
- Nguyen Do Trong, N.; Erkinbaev, C.; Tsuta, M.; De Baerdemaeker, J.; Nicolaï, B.; Saeys, W. Spatially resolved diffuse reflectance in the visible and near-infrared wavelength range for non-destructive quality assessment of ‘Braeburn’ apples. Postharvest. Biol. Technol. 2014, 91, 39–48. [Google Scholar] [CrossRef]
- Wang, A.; Fu, X.; Xie, L. Application of Visible/Near-Infrared Spectroscopy Combined with Machine Vision Technique to Evaluate the Ripeness of Melons (Cucumis melo L.). Food Anal. Methods 2014, 8, 1403–1412. [Google Scholar] [CrossRef]
- Lu, Y.; Li, R.; Lu, R. Structured-illumination reflectance imaging (SIRI) for enhanced detection of fresh bruises in apples. Postharvest. Biol. Technol. 2016, 117, 89–93. [Google Scholar] [CrossRef]
- Oliveira, P.C.; Moura, J.P.; Fernandes, L.F.; Amaral, E.M.; Oliveira, A.A. A non-destructive method based on digital image processing for calculate the vigor and the vegetative expression of vines. Comput. Electron. Agric. 2016, 124, 289–294. [Google Scholar] [CrossRef]
- Qin, J.; Chao, K.; Kim, M.S. Raman chemical imaging system for food safety and quality inspection. Trans. ASABE 2010, 53, 1873–1882. [Google Scholar] [CrossRef]
- Dhakal, S.; Li, Y.; Peng, Y.; Chao, K.; Qin, J.; Guo, L. Prototype instrument development for non-destructive detection of pesticide residue in apple surface using Raman technology. J. Food Eng. 2014, 123, 94–103. [Google Scholar] [CrossRef]
- Moscetti, R.; Saeys, W.; Keresztes, J.C.; Goodarzi, M.; Cecchini, M.; Danilo, M.; Massantini, R. Hazelnut Quality Sorting Using High Dynamic Range Short-Wave Infrared Hyperspectral Imaging. Food Bioprocess Technol. 2015, 8, 1593–1604. [Google Scholar] [CrossRef]
- Lefcourt, A.M.; Wiederoder, M.S.; Liu, N.; Kim, M.S.; Martin Lo, Y. Development of a portable hyperspectral imaging system for monitoring the efficacy of sanitation procedures in food processing facilities. J. Food Eng. 2013, 117, 59–66. [Google Scholar] [CrossRef]
- Wiederoder, M.S.; Liu, N.; Lefcourt, A.M.; Kim, M.S.; Martin Lo, Y. Use of a portable hyperspectral imaging system for monitoring the efficacy of sanitation procedures in produce processing plants. J. Food Eng. 2013, 117, 217–226. [Google Scholar] [CrossRef]
- Beck, E.A.; Lefcourt, A.M.; Lo, Y.M.; Kim, M.S. Use of a portable fluorescence imaging device to facilitate cleaning of deli slicers. Food Control 2015, 51, 256–262. [Google Scholar] [CrossRef]
- McGonigle, A.J.S.; Wilkes, T.C.; Pering, T.D.; Willmott, J.R.; Cook, J.M.; Mims, F.M.; Parisi, A.V. Smartphone Spectrometers. Sensors 2018, 18, 223. [Google Scholar] [CrossRef] [PubMed] [Green Version]
- Utsuzawa, S.; Fukushima, E. Unilateral NMR with a barrel magnet. J. Magn. Reson. 2017, 282, 104–113. [Google Scholar] [CrossRef]
- Nakashima, Y. Development of a hand-held magnetic resonance sensor for the nondestructive quantification of fat and lean meat of fresh tuna. J. Food Meas. Charact. 2020, 14, 2947–2955. [Google Scholar] [CrossRef]
- Nakashima, Y. Non-Destructive Quantification of Lipid and Water in Fresh Tuna Meat by a Single-Sided Nuclear Magnetic Resonance Scanner. J. Aquat. Food Prod. Technol. 2019, 28, 241–252. [Google Scholar] [CrossRef] [Green Version]
- Lei, K.M.; Ha, D.; Song, Y.Q.; Westervelt, R.M.; Martins, R.; Mak, P.I.; Ham, D. Portable NMR with Parallelism. Anal. Chem. 2020, 92, 2112–2120. [Google Scholar] [CrossRef]
- Kiani, S.; Minaei, S.; Ghasemi-Varnamkhasti, M. A portable electronic nose as an expert system for aroma-based classification of saffron. Chemom. Intell. Lab. Syst. 2016, 156, 148–156. [Google Scholar] [CrossRef]
- Chang, K.H.; Chen, R.L.; Hsieh, B.C.; Chen, P.C.; Hsiao, H.Y.; Nieh, C.H.; Cheng, T.J. A hand-held electronic tongue based on fluorometry for taste assessment of tea. Biosens. Bioelectron. 2010, 26, 1507–1513. [Google Scholar] [CrossRef]
- Müller-Maatsch, J.; Bertani, F.R.; Mencattini, A.; Gerardino, A.; Martinelli, E.; Weesepoel, Y.; van Ruth, S. The spectral treasure house of miniaturized instruments for food safety, quality and authenticity applications: A perspective. Trends Food Sci. Technol. 2021. [Google Scholar] [CrossRef]
- Capitan-Vallvey, L.F.; Palma, A.J. Recent developments in handheld and portable optosensing-a review. Anal. Chim. Acta 2011, 696, 27–46. [Google Scholar] [CrossRef]
- Dian, P.H.; Andueza, D.; Jestin, M.; Prado, I.N.; Prache, S. Comparison of visible and near infrared reflectance spectroscopy to discriminate between pasture-fed and concentrate-fed lamb carcasses. Meat Sci. 2008, 80, 1157–1164. [Google Scholar] [CrossRef] [PubMed]
- Perez-Marin, D.; De Pedro Sanz, E.; Guerrero-Ginel, J.E.; Garrido-Varo, A. A feasibility study on the use of near-infrared spectroscopy for prediction of the fatty acid profile in live Iberian pigs and carcasses. Meat Sci. 2009, 83, 627–633. [Google Scholar] [CrossRef] [PubMed]
- Prieto, N.; Dugan, M.E.R.; Juárez, M.; López-Campos, Ó.; Zijlstra, R.T.; Aalhus, J.L.; Plaizier, J. Using portable near-infrared spectroscopy to predict pig subcutaneous fat composition and iodine value. Can. J. Anim. Sci. 2018, 98, 221–229. [Google Scholar] [CrossRef]
- Prieto, N.; Juarez, M.; Larsen, I.L.; Lopez-Campos, O.; Zijlstra, R.T.; Aalhus, J.L. Rapid discrimination of enhanced quality pork by visible and near infrared spectroscopy. Meat Sci. 2015, 110, 76–84. [Google Scholar] [CrossRef]
- Dixit, Y.; Pham, H.Q.; Realini, C.E.; Agnew, M.P.; Craigie, C.R.; Reis, M.M. Evaluating the performance of a miniaturized NIR spectrophotometer for predicting intramuscular fat in lamb: A comparison with benchtop and hand-held Vis-NIR spectrophotometers. Meat Sci. 2020, 162, 108026. [Google Scholar] [CrossRef] [PubMed]
- Perez-Marin, D.; Fearn, T.; Riccioli, C.; De Pedro, E.; Garrido, A. Probabilistic classification models for the in situ authentication of iberian pig carcasses using near infrared spectroscopy. Talanta 2021, 222, 121511. [Google Scholar] [CrossRef]
- Piotrowski, C.; Garcia, R.; Garrido-Varo, A.; Perez-Marin, D.; Riccioli, C.; Fearn, T. Short Communication: The potential of portable near infrared spectroscopy for assuring quality and authenticity in the food chain, using Iberian hams as an example. Animal 2019, 13, 3018–3021. [Google Scholar] [CrossRef] [PubMed] [Green Version]
- Zamora-Rojas, E.; Perez-Marin, D.; De Pedro-Sanz, E.; Guerrero-Ginel, J.E.; Garrido-Varo, A. In-situ Iberian pig carcass classification using a micro-electro-mechanical system (MEMS)-based near infrared (NIR) spectrometer. Meat Sci. 2012, 90, 636–642. [Google Scholar] [CrossRef]
- Horcada, A.; Valera, M.; Juarez, M.; Fernandez-Cabanas, V.M. Authentication of Iberian pork official quality categories using a portable near infrared spectroscopy (NIRS) instrument. Food Chem. 2020, 318, 126471. [Google Scholar] [CrossRef]
- Parastar, H.; van Kollenburg, G.; Weesepoel, Y.; van den Doel, A.; Buydens, L.; Jansen, J. Integration of handheld NIR and machine learning to “Measure & Monitor” chicken meat authenticity. Food Control 2020, 112. [Google Scholar] [CrossRef]
- Nolasco Perez, I.M.; Badaro, A.T.; Barbon, S., Jr.; Barbon, A.P.A.; Pollonio, M.A.R.; Barbin, D.F. Classification of Chicken Parts Using a Portable Near-Infrared (NIR) Spectrophotometer and Machine Learning. Appl. Spectrosc. 2018, 72, 1774–1780. [Google Scholar] [CrossRef]
- Dumalisile, P.; Manley, M.; Hoffman, L.; Williams, P.J. Discriminating muscle type of selected game species using near infrared (NIR) spectroscopy. Food Control 2020, 110, 106981. [Google Scholar] [CrossRef]
- Schmutzler, M.; Beganovic, A.; Böhler, G.; Huck, C.W. Methods for detection of pork adulteration in veal product based on FT-NIR spectroscopy for laboratory, industrial and on-site analysis. Food Control 2015, 57, 258–267. [Google Scholar] [CrossRef]
- Silva, L.C.R.; Folli, G.S.; Santos, L.P.; Barros, I.H.A.S.; Oliveira, B.G.; Borghi, F.T.; Santos, F.D.d.; Filgueiras, P.R.; Romão, W. Quantification of beef, pork, and chicken in ground meat using a portable NIR spectrometer. Vib. Spectrosc. 2020, 111, 103158. [Google Scholar] [CrossRef]
- Bilge, G.; Velioglu, H.M.; Sezer, B.; Eseller, K.E.; Boyaci, I.H. Identification of meat species by using laser-induced breakdown spectroscopy. Meat Sci. 2016, 119, 118–122. [Google Scholar] [CrossRef] [PubMed]
- Casado-Gavalda, M.P.; Dixit, Y.; Geulen, D.; Cama-Moncunill, R.; Cama-Moncunill, X.; Markiewicz-Keszycka, M.; Cullen, P.J.; Sullivan, C. Quantification of copper content with laser induced breakdown spectroscopy as a potential indicator of offal adulteration in beef. Talanta 2017, 169, 123–129. [Google Scholar] [CrossRef]
- Andueza, D.; Agabriel, C.; Constant, I.; Lucas, A.; Martin, B. Using visible or near infrared spectroscopy (NIRS) on cheese to authenticate cow feeding regimes. Food Chem. 2013, 141, 209–214. [Google Scholar] [CrossRef] [PubMed]
- Uusitalo, S.; Aernouts, B.; Sumen, J.; Eero, H.; Utriainen, M.; Frondelius, L.; Sari, K.; Pastell, M. Comparison of milk analysis performance between NIR laboratory analyser and miniaturised NIR MEMS sensors. In Proceedings of the ICAR Technical Series No 24, Prague, Czech Republic, 17–21 June 2019. ICAR. 111-5. [Google Scholar]
- Bogomolov, A.; Belikova, V.; Galyanin, V.; Melenteva, A.; Meyer, H. Reference-free spectroscopic determination of fat and protein in milk in the visible and near infrared region below 1000 nm using spatially resolved diffuse reflectance fiber probe. Talanta 2017, 167, 563–572. [Google Scholar] [CrossRef] [PubMed]
- de Lima, G.F.; Andrade, S.A.C.; da Silva, V.H.; Honorato, F.A. Multivariate Classification of UHT Milk as to the Presence of Lactose Using Benchtop and Portable NIR Spectrometers. Food Anal. Methods 2018, 11, 2699–2706. [Google Scholar] [CrossRef]
- Ma, Y.B.; Babu, K.S.; Amamcharla, J.K. Prediction of total protein and intact casein in cheddar cheese using a low-cost handheld short-wave near-infrared spectrometer. LWT Food Sci. Technol. 2019, 109, 319–326. [Google Scholar] [CrossRef]
- Liu, N.; Parra, H.A.; Pustjens, A.; Hettinga, K.; Mongondry, P.; van Ruth, S.M. Evaluation of portable near-infrared spectroscopy for organic milk authentication. Talanta 2018, 184, 128–135. [Google Scholar] [CrossRef]
- Behkami, S.; Zain, S.M.; Gholami, M.; Khir, M.F.A. Classification of cow milk using artificial neural network developed from the spectral data of single- and three-detector spectrophotometers. Food Chem. 2019, 294, 309–315. [Google Scholar] [CrossRef]
- Karunathilaka, S.R.; Yakes, B.J.; He, K.; Chung, J.K.; Mossoba, M. Non-targeted NIR spectroscopy and SIMCA classification for commercial milk powder authentication: A study using eleven potential adulterants. Heliyon 2018, 4, e00806. [Google Scholar] [CrossRef] [Green Version]
- Kong, W.W.; Zhang, C.; Liu, F.; Gong, A.P.; He, Y. Irradiation dose detection of irradiated milk powder using visible and near-infrared spectroscopy and chemometrics. J. Dairy Sci. 2013, 96, 4921–4927. [Google Scholar] [CrossRef] [Green Version]
- Cheng, Y.; Dong, Y.; Wu, J.; Yang, X.; Bai, H.; Zheng, H.; Ren, D.; Zou, Y.; Li, M. Screening melamine adulterant in milk powder with laser Raman spectrometry. J. Food Compos. Anal. 2010, 23, 199–202. [Google Scholar] [CrossRef]
- Sezer, B.; Durna, S.; Bilge, G.; Berkkan, A.; Yetisemiyen, A.; Boyaci, I.H. Identification of milk fraud using laser-induced breakdown spectroscopy (LIBS). Int. Dairy J. 2018, 81, 1–7. [Google Scholar] [CrossRef]
- Moncayo, S.; Manzoor, S.; Rosales, J.D.; Anzano, J.; Caceres, J.O. Qualitative and quantitative analysis of milk for the detection of adulteration by Laser Induced Breakdown Spectroscopy (LIBS). Food Chem. 2017, 232, 322–328. [Google Scholar] [CrossRef] [PubMed] [Green Version]
- Bilge, G.; Sezer, B.; Eseller, K.E.; Berberoglu, H.; Topcu, A.; Boyaci, I.H. Determination of whey adulteration in milk powder by using laser induced breakdown spectroscopy. Food Chem. 2016, 212, 183–188. [Google Scholar] [CrossRef] [PubMed]
- Grassi, S.; Casiraghi, E.; Alamprese, C. Handheld NIR device: A non-targeted approach to assess authenticity of fish fillets and patties. Food Chem. 2018, 243, 382–388. [Google Scholar] [CrossRef]
- O’Brien, N.; Hulse, C.A.; Pfeifer, F.; Siesler, H.W. Near Infrared Spectroscopic Authentication of Seafood. J. Near Infrared Spectrosc. 2013, 21, 299–305. [Google Scholar] [CrossRef] [Green Version]
- He, H.-J.; Wu, D.; Sun, D.-W. Non-destructive and rapid analysis of moisture distribution in farmed Atlantic salmon (Salmo salar) fillets using visible and near-infrared hyperspectral imaging. Innov. Food Sci. Emerg. Technol. 2013, 18, 237–245. [Google Scholar] [CrossRef]
- Coronel Reyes, J.; Ramirez-Morales, I. Determination of egg storage time at room temperature using a low-cost NIR spectrometer and machine learning techniques. Comput. Electron. Agric. 2018, 145, 1–10. [Google Scholar] [CrossRef] [Green Version]
- Kaszab, T.; Bodor, Z.; Kovacs, Z.; Benedek, C. Classification models of hungarian honey samples based on analytical and physical characteristics. Hung. Agric. Eng. 2017, 32, 22–28. [Google Scholar] [CrossRef]
- Lastra-Mejías, M.; Izquierdo, M.; González-Flores, E.; Cancilla, J.C.; Izquierdo, J.G.; Torrecilla, J.S. Honey exposed to laser-induced breakdown spectroscopy for chaos-based botanical classification and fraud assessment. Chemom. Intell. Lab. Syst. 2020, 199, 103939. [Google Scholar] [CrossRef]
- Stefas, D.; Gyftokostas, N.; Couris, S. Laser induced breakdown spectroscopy for elemental analysis and discrimination of honey samples. Spectrochim. Acta Part B 2020, 172, 105969. [Google Scholar] [CrossRef]
- Vincent, J.; Wang, H.; Nibouche, O.; Maguire, P. Differentiation of Apple Varieties and Investigation of Organic Status Using Portable Visible Range Reflectance Spectroscopy. Sensors 2018, 18, 1708. [Google Scholar] [CrossRef] [Green Version]
- Dong, Y.; Liu, X.; Mei, L.; Feng, C.; Yan, C.; He, S. LED-induced fluorescence system for tea classification and quality assessment. J. Food Eng. 2014, 137, 95–100. [Google Scholar] [CrossRef] [Green Version]
- You, H.; Kim, Y.; Lee, J.-H.; Jang, B.-J.; Choi, S. Food Powder Classification Using a Portable Visible-Near-Infrared Spectrometer. J. Electromagn. Eng. Sci. 2017, 17, 186–190. [Google Scholar] [CrossRef] [Green Version]
- Toivonen, P.; Batista, A.; Lannard, B. Development of a predictive model for ‘Lapins’ sweet cherry dry matter content using a visible/near infrared spectrometer and its potential application to other cultivars. Can. J. Plant Sci. 2017, 97, 1030–1035. [Google Scholar] [CrossRef] [Green Version]
- Davey, M.W.; Saeys, W.; Hof, E.; Ramon, H.; Swennen, R.L.; Keulemans, J. Application of Visible and Near-Infrared Reflectance Spectroscopy (Vis/NIRS) to Determine Carotenoid Contents in Banana (Musa spp.) Fruit Pulp. J. Agric. Food Chem. 2009, 57, 1742–1751. [Google Scholar] [CrossRef] [PubMed]
- Ikeogu, U.N.; Davrieux, F.; Dufour, D.; Ceballos, H.; Egesi, C.N.; Jannink, J.L. Rapid analyses of dry matter content and carotenoids in fresh cassava roots using a portable visible and near infrared spectrometer (Vis/NIRS). PLoS ONE 2017, 12, e0188918. [Google Scholar] [CrossRef]
- Szuvandzsiev, P.; Helyes, L.; Lugasi, A.; Szántó, C.; Baranowski, P.; Pék, Z. Estimation of antioxidant components of tomato using VIS-NIR reflectance data by handheld portable spectrometer. Int. Agrophys. 2014, 28. [Google Scholar] [CrossRef] [Green Version]
- Ndlovu, P.F.; Magwaza, L.S.; Tesfay, S.Z.; Mphahlele, R.R. Rapid visible-near infrared (Vis-NIR) spectroscopic detection and quantification of unripe banana flour adulteration with wheat flour. J. Food Sci. Technol. 2019, 56, 5484–5491. [Google Scholar] [CrossRef]
- Rukundo, I.R.; Danao, M.C. Identifying Turmeric Powder by Source and Metanil Yellow Adulteration Levels Using Near-Infrared Spectra and PCA-SIMCA Modeling. J. Food Prot. 2020, 83, 968–974. [Google Scholar] [CrossRef]
- Mat Nawi, N.; Chen, G.; Jensen, T. Application of visible and shortwave near infrared spectrometer to predict sugarcane quality from different sample forms. In Sensing Technologies for Biomaterial, Food, and Agriculture; Kondo, N., Ed.; SPIE—International Society for Optics and Photonics: Bellingham, WA, USA, 2013; p. 88810A. [Google Scholar]
- Steidle Neto, A.J.; Toledo, J.V.; Zolnier, S.; Lopes, D.d.C.; Pires, C.V.; Silva, T.G.F.d. Prediction of mineral contents in sugarcane cultivated under saline conditions based on stalk scanning by Vis/NIR spectral reflectance. Biosyst. Eng. 2017, 156, 17–26. [Google Scholar] [CrossRef]
- Jamshidi, B.; Mohajerani, E.; Jamshidi, J. Developing a Vis/NIR spectroscopic system for fast and non-destructive pesticide residue monitoring in agricultural product. Measurement 2016, 89, 1–6. [Google Scholar] [CrossRef] [Green Version]
- Guidetti, R.; Beghi, R.; Bodria, L. Evaluation of grape quality parameters by a simple VISNIR system. Trans. ASABE 2010, 53, 477–484. [Google Scholar] [CrossRef]
- Wang, Y.J.; Li, T.H.; Li, L.Q.; Ning, J.M.; Zhang, Z.Z. Micro-NIR spectrometer for quality assessment of tea: Comparison of local and global models. Spectrochim. Acta Part A 2020, 237, 118403. [Google Scholar] [CrossRef]
- Plans, M.; Simó, J.; Casañas, F.; Sabaté, J.; Rodriguez-Saona, L. Characterization of common beans (Phaseolus vulgaris L.) by infrared spectroscopy: Comparison of MIR, FT-NIR and dispersive NIR using portable and benchtop instruments. Food Res. Int. 2013, 54, 1643–1651. [Google Scholar] [CrossRef]
- Pérez-Marín, D.; Paz, P.; Guerrero, J.-E.; Garrido-Varo, A.; Sánchez, M.-T. Miniature handheld NIR sensor for the on-site non-destructive assessment of post-harvest quality and refrigerated storage behavior in plums. J. Food Eng. 2010, 99, 294–302. [Google Scholar] [CrossRef]
- Pan, L.; Lu, R.; Zhu, Q.; McGrath, J.M.; Tu, K. Measurement of moisture, soluble solids, sucrose content and mechanical properties in sugar beet using portable visible and near-infrared spectroscopy. Postharvest. Biol. Technol. 2015, 102, 42–50. [Google Scholar] [CrossRef]
- Yu, H.; Liu, H.; Wang, Q.; van Ruth, S. Evaluation of portable and benchtop NIR for classification of high oleic acid peanuts and fatty acid quantitation. LWT Food Sci. Technol. 2020, 128, 109398. [Google Scholar] [CrossRef]
- Yan, H.; Xu, Y.C.; Siesler, H.W.; Han, B.X.; Zhang, G.Z. Hand-Held Near-Infrared Spectroscopy for Authentication of Fengdous and Quantitative Analysis of Mulberry Fruits. Front. Plant Sci. 2019, 10, 1548. [Google Scholar] [CrossRef] [PubMed]
- Correia, R.M.; Tosato, F.; Domingos, E.; Rodrigues, R.R.T.; Aquino, L.F.M.; Filgueiras, P.R.; Lacerda, V., Jr.; Romao, W. Portable near infrared spectroscopy applied to quality control of Brazilian coffee. Talanta 2018, 176, 59–68. [Google Scholar] [CrossRef] [PubMed]
- Oliveira, M.M.; Cruz-Tirado, J.P.; Roque, J.V.; Teófilo, R.F.; Barbin, D.F. Portable near-infrared spectroscopy for rapid authentication of adulterated paprika powder. J. Food Compos. Anal. 2020, 87, 103403. [Google Scholar] [CrossRef]
- Kar, S.; Tudu, B.; Bag, A.K.; Bandyopadhyay, R. Application of Near-Infrared Spectroscopy for the Detection of Metanil Yellow in Turmeric Powder. Food Anal. Methods 2017, 11, 1291–1302. [Google Scholar] [CrossRef]
- McVey, C.; McGrath, T.F.; Haughey, S.A.; Elliott, C.T. A rapid food chain approach for authenticity screening: The development, validation and transferability of a chemometric model using two handheld near infrared spectroscopy (NIRS) devices. Talanta 2021, 222, 121533. [Google Scholar] [CrossRef] [PubMed]
- Haughey, S.A.; Galvin-King, P.; Malechaux, A.; Elliott, C.T. The Use of Handheld near Infrared Reflectance Spectroscopy for the Proximate Analysis of Poultry Feed and to Detect Melamine Adulteration of Soya Bean Meal. NIR News 2015, 26, 4–7. [Google Scholar] [CrossRef]
- Sanchez, M.T.; Torres, I.; de la Haba, M.J.; Chamorro, A.; Garrido-Varo, A.; Perez-Marin, D. Rapid, simultaneous, and in situ authentication and quality assessment of intact bell peppers using near-infrared spectroscopy technology. J. Sci. Food Agric. 2019, 99, 1613–1622. [Google Scholar] [CrossRef]
- Castrignanò, A.; Buttafuoco, G.; Malegori, C.; Genorini, E.; Iorio, R.; Stipic, M.; Girone, G.; Venezia, A. Assessing the Feasibility of a Miniaturized Near-Infrared Spectrometer in Determining Quality Attributes of San Marzano Tomato. Food Anal. Methods 2019, 12, 1497–1510. [Google Scholar] [CrossRef]
- Song, W.; Wang, H.; Maguire, P.; Nibouche, O. Differentiation of organic and non-organic apples using near infrared reflectance spectroscopy—A pattern recognition approach. In Proceedings of the 2016 IEEE SENSORS, Orlando, FL, USA, 30 October–3 November 2016; pp. 1–3. [Google Scholar]
- Rotbart, N.; Schmilovitch, Z.; Cohen, Y.; Alchanatis, V.; Erel, R.; Ignat, T.; Shenderey, C.; Dag, A.; Yermiyahu, U. Estimating olive leaf nitrogen concentration using visible and near-infrared spectral reflectance. Biosyst. Eng. 2013, 114, 426–434. [Google Scholar] [CrossRef]
- Perez-Marin, D.; Torres, I.; Entrenas, J.A.; Vega, M.; Sanchez, M.T. Pre-harvest screening on-vine of spinach quality and safety using NIRS technology. Spectrochim. Acta Part A 2019, 207, 242–250. [Google Scholar] [CrossRef]
- Teye, E.; Amuah, C.L.Y.; McGrath, T.; Elliott, C. Innovative and rapid analysis for rice authenticity using hand-held NIR spectrometry and chemometrics. Spectrochim. Acta Part A 2019, 217, 147–154. [Google Scholar] [CrossRef]
- Zhu, G.; Tian, C. Determining sugar content and firmness of ‘Fuji’ apples by using portable near-infrared spectrometer and diffuse transmittance spectroscopy. J. Food Process Eng. 2018, 41, e12810. [Google Scholar] [CrossRef]
- Manfredi, M.; Robotti, E.; Quasso, F.; Mazzucco, E.; Calabrese, G.; Marengo, E. Fast classification of hazelnut cultivars through portable infrared spectroscopy and chemometrics. Spectrochim. Acta Part A 2018, 189, 427–435. [Google Scholar] [CrossRef]
- Guzman, E.; Baeten, V.; Pierna, J.A.; Garcia-Mesa, J.A. A portable Raman sensor for the rapid discrimination of olives according to fruit quality. Talanta 2012, 93, 94–98. [Google Scholar] [CrossRef]
- Krimmer, M.; Farber, C.; Kurouski, D. Rapid and Noninvasive Typing and Assessment of Nutrient Content of Maize Kernels Using a Handheld Raman Spectrometer. ACS Omega 2019, 4, 16330–16335. [Google Scholar] [CrossRef] [PubMed] [Green Version]
- Vargas Jentzsch, P.; Torrico-Vallejos, S.; Mendieta-Brito, S.; Ramos, L.A.; Ciobotă, V. Detection of counterfeit stevia products using a handheld Raman spectrometer. Vib. Spectrosc. 2016, 83, 126–131. [Google Scholar] [CrossRef]
- Perez-Rodriguez, M.; Dirchwolf, P.M.; Silva, T.V.; Villafane, R.N.; Neto, J.A.G.; Pellerano, R.G.; Ferreira, E.C. Brown rice authenticity evaluation by spark discharge-laser-induced breakdown spectroscopy. Food Chem. 2019, 297, 124960. [Google Scholar] [CrossRef]
- Yang, P.; Zhu, Y.; Yang, X.; Li, J.; Tang, S.; Hao, Z.; Guo, L.; Li, X.; Zeng, X.; Lu, Y. Evaluation of sample preparation methods for rice geographic origin classification using laser-induced breakdown spectroscopy. J. Cereal Sci. 2018, 80, 111–118. [Google Scholar] [CrossRef]
- Sezer, B.; Apaydin, H.; Bilge, G.; Boyaci, I.H. Coffee arabica adulteration: Detection of wheat, corn and chickpea. Food Chem. 2018, 264, 142–148. [Google Scholar] [CrossRef] [PubMed]
- Su, W.-H.; Sun, D.-W. Evaluation of spectral imaging for inspection of adulterants in terms of common wheat flour, cassava flour and corn flour in organic Avatar wheat (Triticum spp.) flour. J. Food Eng. 2017, 200, 59–69. [Google Scholar] [CrossRef]
- Henn, R.; Schwab, A.; Huck, C.W. Evaluation of benchtop versus portable near-infrared spectroscopic method combined with multivariate approaches for the fast and simultaneous quantitative analysis of main sugars in syrup formulations. Food Control 2016, 68, 97–104. [Google Scholar] [CrossRef]
- Jahani, R.; Yazdanpanah, H.; van Ruth, S.M.; Kobarfard, F.; Alewijn, M.; Mahboubi, A.; Faizi, M.; Shojaee AliAbadi, M.H.; Salamzadeh, J. Novel Application of Near-infrared Spectroscopy and Chemometrics Approach for Detection of Lime Juice Adulteration. Iran. J. Pharm. Res. 2020, 19, 34–44. [Google Scholar] [CrossRef] [PubMed]
- Karunathilaka, S.R.; Yakes, B.J.; Farris, S.; Michael, T.J.; He, K.; Chung, J.K.; Shah, R.; Mossoba, M.M. Quantitation of Saccharin and Cyclamate in Tabletop Formulations by Portable Raman and NIR Spectrometers in Combination with Partial Least Squares Regression. Food Anal. Methods 2017, 11, 969–979. [Google Scholar] [CrossRef]
- Basri, K.N.; Hussain, M.N.; Bakar, J.; Sharif, Z.; Khir, M.F.A.; Zoolfakar, A.S. Classification and quantification of palm oil adulteration via portable NIR spectroscopy. Spectrochim. Acta Part A 2017, 173, 335–342. [Google Scholar] [CrossRef]
- Teye, E.; Elliott, C.; Sam-Amoah, L.K.; Mingle, C. Rapid and nondestructive fraud detection of palm oil adulteration with Sudan dyes using portable NIR spectroscopic techniques. Food Addit. Contam. Part A 2019, 36, 1589–1596. [Google Scholar] [CrossRef]
- Yan, J.; Stuijvenberg, L.; Ruth, S.M. Handheld Near-Infrared Spectroscopy for Distinction of Extra Virgin Olive Oil from Other Olive Oil Grades Substantiated by Compositional Data. Eur. J. Lipid Sci. Technol. 2019, 121. [Google Scholar] [CrossRef] [Green Version]
- Yang, M.; Chen, Q.; Kutsanedzie, F.Y.H.; Yang, X.; Guo, Z.; Ouyang, Q. Portable spectroscopy system determination of acid value in peanut oil based on variables selection algorithms. Measurement 2017, 103, 179–185. [Google Scholar] [CrossRef]
- Kaufmann, K.C.; Favero, F.F.; de Vasconcelos, M.A.M.; Godoy, H.T.; Sampaio, K.A.; Barbin, D.F. Portable NIR Spectrometer for Prediction of Palm Oil Acidity. J. Food Sci. 2019, 84, 406–411. [Google Scholar] [CrossRef]
- Picouet, P.A.; Gou, P.; Hyypiö, R.; Castellari, M. Implementation of NIR technology for at-line rapid detection of sunflower oil adulterated with mineral oil. J. Food Eng. 2018, 230, 18–27. [Google Scholar] [CrossRef]
- Giovenzana, V.; Beghi, R.; Guidetti, R. Rapid evaluation of craft beer quality during fermentation process by vis/NIR spectroscopy. J. Food Eng. 2014, 142, 80–86. [Google Scholar] [CrossRef]
- Allendorf, M.; Subramanian, A.; Rodriguez-Saona, L. Application of a Handheld Portable Mid-Infrared Sensor for Monitoring Oil Oxidative Stability. J. Am. Oil Chem. Soc. 2011, 89, 79–88. [Google Scholar] [CrossRef]
- Maurer, N.E.; Hatta-Sakoda, B.; Pascual-Chagman, G.; Rodriguez-Saona, L.E. Characterization and authentication of a novel vegetable source of omega-3 fatty acids, sacha inchi (Plukenetia volubilis L.) oil. Food Chem. 2012, 134, 1173–1180. [Google Scholar] [CrossRef] [PubMed]
- Bellou, E.; Gyftokostas, N.; Stefas, D.; Gazeli, O.; Couris, S. Laser-induced breakdown spectroscopy assisted by machine learning for olive oils classification: The effect of the experimental parameters. Spectrochim. Acta Part B 2020, 163, 105746. [Google Scholar] [CrossRef]
- Moncayo, S.; Rosales, J.D.; Izquierdo-Hornillos, R.; Anzano, J.; Caceres, J.O. Classification of red wine based on its protected designation of origin (PDO) using Laser-induced Breakdown Spectroscopy (LIBS). Talanta 2016, 158, 185–191. [Google Scholar] [CrossRef] [PubMed]
- Tian, Y.; Yan, C.; Zhang, T.; Tang, H.; Li, H.; Yu, J.; Bernard, J.; Chen, L.; Martin, S.; Delepine-Gilon, N.; et al. Classification of wines according to their production regions with the contained trace elements using laser-induced breakdown spectroscopy. Spectrochim. Acta Part B 2017, 135, 91–101. [Google Scholar] [CrossRef]
- Vargas Jentzsch, P.; Ciobotă, V. Raman spectroscopy as an analytical tool for analysis of vegetable and essential oils. Flavour Fragr. J. 2014, 29, 287–295. [Google Scholar] [CrossRef]
- Zou, M.Q.; Zhang, X.F.; Qi, X.H.; Ma, H.L.; Dong, Y.; Liu, C.W.; Guo, X.; Wang, H. Rapid authentication of olive oil adulteration by Raman spectrometry. J. Agric. Food Chem. 2009, 57, 6001–6006. [Google Scholar] [CrossRef]
- Van Ruth, S.M.; Nillesen, O. Which company characteristics make a food business at risk for food fraud. Foods 2021, 10, 842. [Google Scholar] [CrossRef]
- Müller-Maatsch, J.; Alewijn, M.; Wijtten, M.; Weesepoel, Y. Detecting fraudulent additions in skimmed milk powder using a portable, hyphenated, optical multi-sensor approach in combination with one-class classification. Food Control 2020, 121, 107744. [Google Scholar] [CrossRef]
- Weesepoel, Y.; Alewijn, M.; Wijtten, M.; Müller-Maatsch, J. Detecting food fraud in extra virgin olive oil using a prototype portable hyphenated photonics sensor. J. AOAC Int. 2020. [Google Scholar] [CrossRef] [PubMed]
- Chao, K.; Nou, X.; Liu, Y.; Kim, S.; Chan, D.E.; Yang, C.-C.; Patel, J.; Sharma, M. Detection of fecal/ingesta contaminants on poultry processing equipment surfaces by visible and near-infrared reflectance spectroscopy. Appl. Eng. Agric. 2008, 23, 49–55. [Google Scholar] [CrossRef] [Green Version]
- Ait-Kaddour, A.; Boubellouta, T.; Chevallier, I. Development of a portable spectrofluorimeter for measuring the microbial spoilage of minced beef. Meat Sci. 2011, 88, 675–681. [Google Scholar] [CrossRef] [PubMed]
- Savoia, S.; Albera, A.; Brugiapaglia, A.; Di Stasio, L.; Ferragina, A.; Cecchinato, A.; Bittante, G. Prediction of meat quality traits in the abattoir using portable and hand-held near-infrared spectrometers. Meat Sci. 2019, 161, 108017. [Google Scholar] [CrossRef]
- Kartakoullis, A.; Comaposada, J.; Cruz-Carrion, A.; Serra, X.; Gou, P. Feasibility study of smartphone-based near-infrared spectroscopy (NIRS) for salted minced meat composition diagnostics at different temperatures. Food Chem. 2019, 278, 314–321. [Google Scholar] [CrossRef] [Green Version]
- Collell, C.; Gou, P.; Arnau, J.; Muñoz, I.; Comaposada, J. NIR technology for on-line determination of superficial a(2) and moisture content during the drying process of fermented sausages. Food Chem. 2012, 135, 1750–1755. [Google Scholar] [CrossRef] [PubMed]
- Prado, N.; Fernández-Ibáñez, V.; González, P. On-site NIR spectroscopy to control the shelf life of pork meat. Food Anal. Method 2011, 4, 582–589. [Google Scholar] [CrossRef]
- Kucha, C.; Ngadi, M.O. Rapid assessment of pork freshness using miniaturized NIR spectroscopy. J. Food Meas. Charact. 2020, 14, 1105–1115. [Google Scholar] [CrossRef]
- Jaafreh, S.; Breuch, R.; Guenther, K.; Kreyenschmidt, J. Rapid poultry spoilage evaluation using portable fiber-optic raman spectrometer. Food Anal. Method 2018, 11, 2320–2328. [Google Scholar] [CrossRef]
- Liu, Y.; Windham, W.R.; Lawrence, K.C.; Park, B. Simple algorithms for the classification of visible/near-infrared and hyperspectral imaging spectra of chicken skins, feces, and fecal contaminated skins. Appl. Spectrosc. 2003, 57, 1609–1612. [Google Scholar] [CrossRef]
- Karoui, R.; Dufour, E. Development of a portable spectrofluorometer for measuring the quality of cheese. Dairy Sci. Technol. 2008, 88, 477–494. [Google Scholar] [CrossRef] [Green Version]
- Wiedemair, V.; Langore, D.; Garsleitner, R. Investigations into the performance of a novel pocket-sized near-infrared spectrometer for cheese analysis. Molecules 2019, 24, 428. [Google Scholar] [CrossRef] [Green Version]
- Riu, J.; Gorla, G.; Chakif, C.; Boqué, R.; Giussani, B. Rapid analysis of milk using low-cost pocket-size NIR spectrometers and multivariate analysis. Foods 2020, 9, 1090. [Google Scholar] [CrossRef]
- Temiz, T.; Sezer, B.; Berkkan, A.; Tamer, U. Assessment of laser induced breakdown spectroscopy as a tool for analysis of butter adulterations. J. Food Compos. Anal. 2017, 67, 48–54. [Google Scholar] [CrossRef]
- Shimamoto, J.; Hiratsuka, S.; Hasegawa, K. Rapid non-destructive determination of fat content in frozen skipjack using a portable near infrared spectrophotometer. Fisheries Sci. 2003, 69, 856–860. [Google Scholar] [CrossRef] [Green Version]
- Yu, X.; Tang, L.; Wu, X.; Lu, H. Nondestructive freshness discriminating of shrimp using visible/near-infrared hyperspectral imaging technique and deep learning algorithm. Food Anal. Method 2018, 11, 768–780. [Google Scholar] [CrossRef]
- Castrica, M.; Panseri, S.; Siletti, E. Evaluation of smart portable device for food diagnostics: A preliminary study on cape hake fillets (M. capensis and M. paradoxus). J. Chem. 2019, 2019, 2904724. [Google Scholar] [CrossRef]
- Fu, X.; He, X.; Xu, H.; Ying, Y. Nondestructive and rapid assessment of intact tomato freshness and lycopene content based on a miniaturized raman spectroscopy system and colorimetry. Food Anal. Method 2016, 9, 2501–2508. [Google Scholar] [CrossRef]
- Smeesters, L.; Meulebroeck, W.; Raeymaekers, S.; Thienpont, H. Optical detection of aflatoxins in maize using one- and two-photon induced fluorescence spectroscopy. Food Control 2015, 51, 408–416. [Google Scholar] [CrossRef]
- Mat Nawi, N.; Chen, G.; Jensen, T.; Mehdizadeh, S.A. Prediction and classification of sugar content of sugarcane based on skin scanning using visible and shortwave near infrared. Biosyst. Eng. 2013, 115, 154–161. [Google Scholar] [CrossRef]
- Saranwong, S.; Sornsrivichai, J.; Kawano, S. Performance of a portable near infrared instrument for Brix value determination of intact mango fruit. J. Near Infrared Spectrosc. 2003, 11, 175–181. [Google Scholar] [CrossRef]
- Santos Neto, J.P.; Leite, G.W.; Oliveira, G.D.; Cunha Júnior, L.C.; Gratão, P.L.; Morais, C.D.; Teixeira, G.H. Cold storage of ‘Palmer’ mangoes sorted based on dry matter content using portable near infrared (VIS-NIR) spectrometer. J. Food Process. Preserv. 2018, 42, e13644. [Google Scholar] [CrossRef]
- dos Santos Neto, J.P.; de Assis, M.W.D.; Casagrande, I.P.; Cunha Júnior, L.C.; de Almeida Teixeira, G.H. Determination of ‘Palmer’ mango maturity indices using portable near infrared (VIS-NIR) spectrometer. Postharvest Biol. Technol. 2017, 130, 75–80. [Google Scholar] [CrossRef] [Green Version]
- Li, P.; Li, S.; Du, G.; Jiang, L.; Liu, X.; Ding, S.; Shan, Y. A simple and nondestructive approach for the analysis of soluble solid content in citrus by using portable visible to near-infrared spectroscopy. Food Sci. Nutr. 2020, 8, 2543–2552. [Google Scholar] [CrossRef] [PubMed] [Green Version]
- Beghi, R.; Spinardi, A.; Bodria, L.; Mignani, I.; Guidetti, R. Apples Nutraceutic Properties Evaluation Through a Visible and Near-Infrared Portable System. Food Bioprocess Technol. 2012, 6, 2547–2554. [Google Scholar] [CrossRef]
- Cayuela, J.A.; Weiland, C. Intact orange quality prediction with two portable NIR spectrometers. Postharvest Biol. Technol. 2010, 58, 113–120. [Google Scholar] [CrossRef] [Green Version]
- Li, M.; Qian, Z.; Shi, B.; Medlicott, J.; East, A. Evaluating the performance of a consumer scale SCiO™ molecular sensor to predict quality of horticultural products. Postharvest Biol. Technol. 2018, 145, 183–192. [Google Scholar] [CrossRef]
- Kaur, H.; Künnemeyer, R.; McGlone, A. Comparison of hand-held near infrared spectrophotometers for fruit dry matter assessment. J. Near Infrared Spectrosc. 2017, 25, 267–277. [Google Scholar] [CrossRef]
- Wiedemair, V.; Huck, C.W. Evaluation of the performance of three hand-held near-infrared spectrometer through investigation of total antioxidant capacity in gluten-free grains. Talanta 2018, 189, 233–240. [Google Scholar] [CrossRef] [PubMed]
- León, L.; Gracia, A. Non-destructive assessment of olive fruit ripening by portable near infrared spectroscopy. Grasas Y Aceites 2011, 62, 268–274. [Google Scholar] [CrossRef]
- Fernandez-Espinosa, A.J. Combining PLS regression with portable NIR spectroscopy to on-line monitor quality parameters in intact olives for determining optimal harvesting time. Talanta 2016, 148, 216–228. [Google Scholar] [CrossRef]
- Cirilli, M.; Bellincontro, A.; Urbani, S.; Servili, M.; Esposto, S.; Mencarelli, F.; Muleo, R. On-field monitoring of fruit ripening evolution and quality parameters in olive mutants using a portable NIR-AOTF device. Food Chem. 2016, 199, 96–104. [Google Scholar] [CrossRef]
- Sánchez, M.-T.; De la Haba, M.-J.; Pérez-Marín, D. Internal and external quality assessment of mandarins on-tree and at harvest using a portable NIR spectrophotometer. Comput. Electron. Agric. 2013, 92, 66–74. [Google Scholar] [CrossRef]
- Blakey, R.J. Evaluation of avocado fruit maturity with a portable near-infrared spectrometer. Postharvest Biol. Technol. 2016, 121, 101–105. [Google Scholar] [CrossRef]
- Sánchez, M.-T.; De la Haba, M.-J.; Guerrero, J.-E.; Garrido-Varo, A.; Pérez-Marín, D. Testing of a local approach for the prediction of quality parameters in intact nectarines using a portable NIRS instrument. Postharvest Biol. Technol. 2011, 60, 130–135. [Google Scholar] [CrossRef]
- Sánchez, M.-T.; De la Haba, M.J.; Benítez-López, M.; Fernández-Novales, J.; Garrido-Varo, A.; Pérez-Marín, D. Non-destructive characterization and quality control of intact strawberries based on NIR spectral data. J. Food Eng. 2012, 110, 102–108. [Google Scholar] [CrossRef]
- Torres, I.; Pérez-Marín, D.; De la Haba, M.-J.; Sánchez, M.-T. Developing universal models for the prediction of physical quality in citrus fruits analysed on-tree using portable NIRS sensors. Biosyst. Eng. 2017, 153, 140–148. [Google Scholar] [CrossRef]
- Baca-Bocanegra, B.; Hernandez-Hierro, J.M.; Nogales-Bueno, J.; Heredia, F.J. Feasibility study on the use of a portable micro near infrared spectroscopy device for the “in vineyard” screening of extractable polyphenols in red grape skins. Talanta 2019, 192, 353–359. [Google Scholar] [CrossRef] [PubMed]
- Marques, E.J.; de Freitas, S.T.; Pimentel, M.F.; Pasquini, C. Rapid and non-destructive determination of quality parameters in the ‘Tommy Atkins’ mango using a novel handheld near infrared spectrometer. Food Chem. 2016, 197 Pt B, 1207–1214. [Google Scholar] [CrossRef]
- Liu, Y.; Sun, X.; Zhang, H.; Aiguo, O. Nondestructive measurement of internal quality of Nanfeng mandarin fruit by charge coupled device near infrared spectroscopy. Comput. Electron. Agric. 2010, 71, S10–S14. [Google Scholar] [CrossRef]
- Suhandy, D.; Yulia, M.; Kuncoro, S.; Rhinaldo, W.; Kondo, N.; Ogawa, Y. The Measurement of Soluble Solids Content in Snake Fruit (Salacca Edulis Reinw) cv. Pondoh Using A Portable Spectrometer. IFAC Proc. Vol. 2010, 43, 235–240. [Google Scholar] [CrossRef]
- Jie, D.; Xie, L.; Fu, X.; Rao, X.; Ying, Y. Variable selection for partial least squares analysis of solutble solids content in wtermelon using near-infrared diffuse transmission technicque. J. Food Eng. 2013, 118, 387–392. [Google Scholar] [CrossRef]
- Jie, D.; Xie, L.; Rao, X.; Ying, Y. Using visible and near infrared diffuse transmittance technique to predict soluble solids content of wtermelon in an on-line detection system. Postharvest Biol. Technol. 2014, 90, 1–6. [Google Scholar] [CrossRef]
- Jie, D.; Zhou, W.; Wei, X. Nondestructive detection of maturity of wtermelon by spectral characteristic using NIR diffuse transmittance technique. Sci. Hortic. 2019, 257, 108718. [Google Scholar] [CrossRef]
- Beghi, R.; Giovenzana, V.; Civelli, R.; Malegori, C.; Buratti, S.; Guidetti, R. Setting-up of a simplified handheld optical device for decay detection in fresh-cut Valerianella locusta L. J. Food Eng. 2014, 127, 10–15. [Google Scholar] [CrossRef]
- Huang, Y.; Lu, R.; Chen, K. Assessment of tomato soluble solids content and pH by spatially-resolved and conventional Vis/NIR spectroscopy. J. Food Eng. 2018, 236, 19–28. [Google Scholar] [CrossRef]
- Esquerre, C.A.; Achata, E.M.; García-Vaquero, M.; Zhang, Z.; Tiwari, B.K.; O’Donnell, C.P. Use of an NIR MEMS spectrophotometer and visible/NIR hyperspectral imaging systems to predict quality parameters of treated ground peppercorns. LWT 2020, 131, 109761. [Google Scholar] [CrossRef]
- Kiani, S.; van Ruth, S.M.; van Raamsdonk, L.W.D.; Minaei, S. Hyperspectral imaging as a novel system for the authentication of spices: A nutmeg case study. LWT 2019, 104, 61–69. [Google Scholar] [CrossRef]
- Qin, J.; Burks, T.F.; Kim, M.S.; Chao, K.; Ritenour, M.A. Citrus canker detection using hyperspectral reflectance imaging and PCA-based image classification method. Sens. Instrum. Food Qual. Saf. 2008, 2, 168–177. [Google Scholar] [CrossRef]
- Pathange, L.P.; Mallikarjunan, P.; Marini, R.P.; O’Keefe, S.; Vaughan, D. Non-destructive evaluation of apple maturity using an electronic nose system. J. Food Eng. 2006, 77, 1018–1023. [Google Scholar] [CrossRef] [Green Version]
 = ultraviolet–visible spectroscopy (n = 14);
  = fluorescence spectroscopy (n = 1);
  = infrared spectroscopy (n = 18);
  = Raman spectroscopy (n = 9);
  = laser-induced breakdown spectroscopy (n = 3);
  = imaging (n = 3);
  = sensor arrays (n = 3). Details of all devices are provided in Supplementary Material—Table S1.
= ultraviolet–visible spectroscopy (n = 14); = fluorescence spectroscopy (n = 1); = infrared spectroscopy (n = 18); = Raman spectroscopy (n = 9); = laser-induced breakdown spectroscopy (n = 3); = imaging (n = 3); = sensor arrays (n = 3). Details of all devices are provided in Supplementary Material—Table S1.
= sensor arrays (n = 3). Details of all devices are provided in Supplementary Material—Table S1.
= ultraviolet–visible spectroscopy (n = 14); = fluorescence spectroscopy (n = 1); = infrared spectroscopy (n = 18); = Raman spectroscopy (n = 9); = laser-induced breakdown spectroscopy (n = 3); = imaging (n = 3); = sensor arrays (n = 3). Details of all devices are provided in Supplementary Material—Table S1.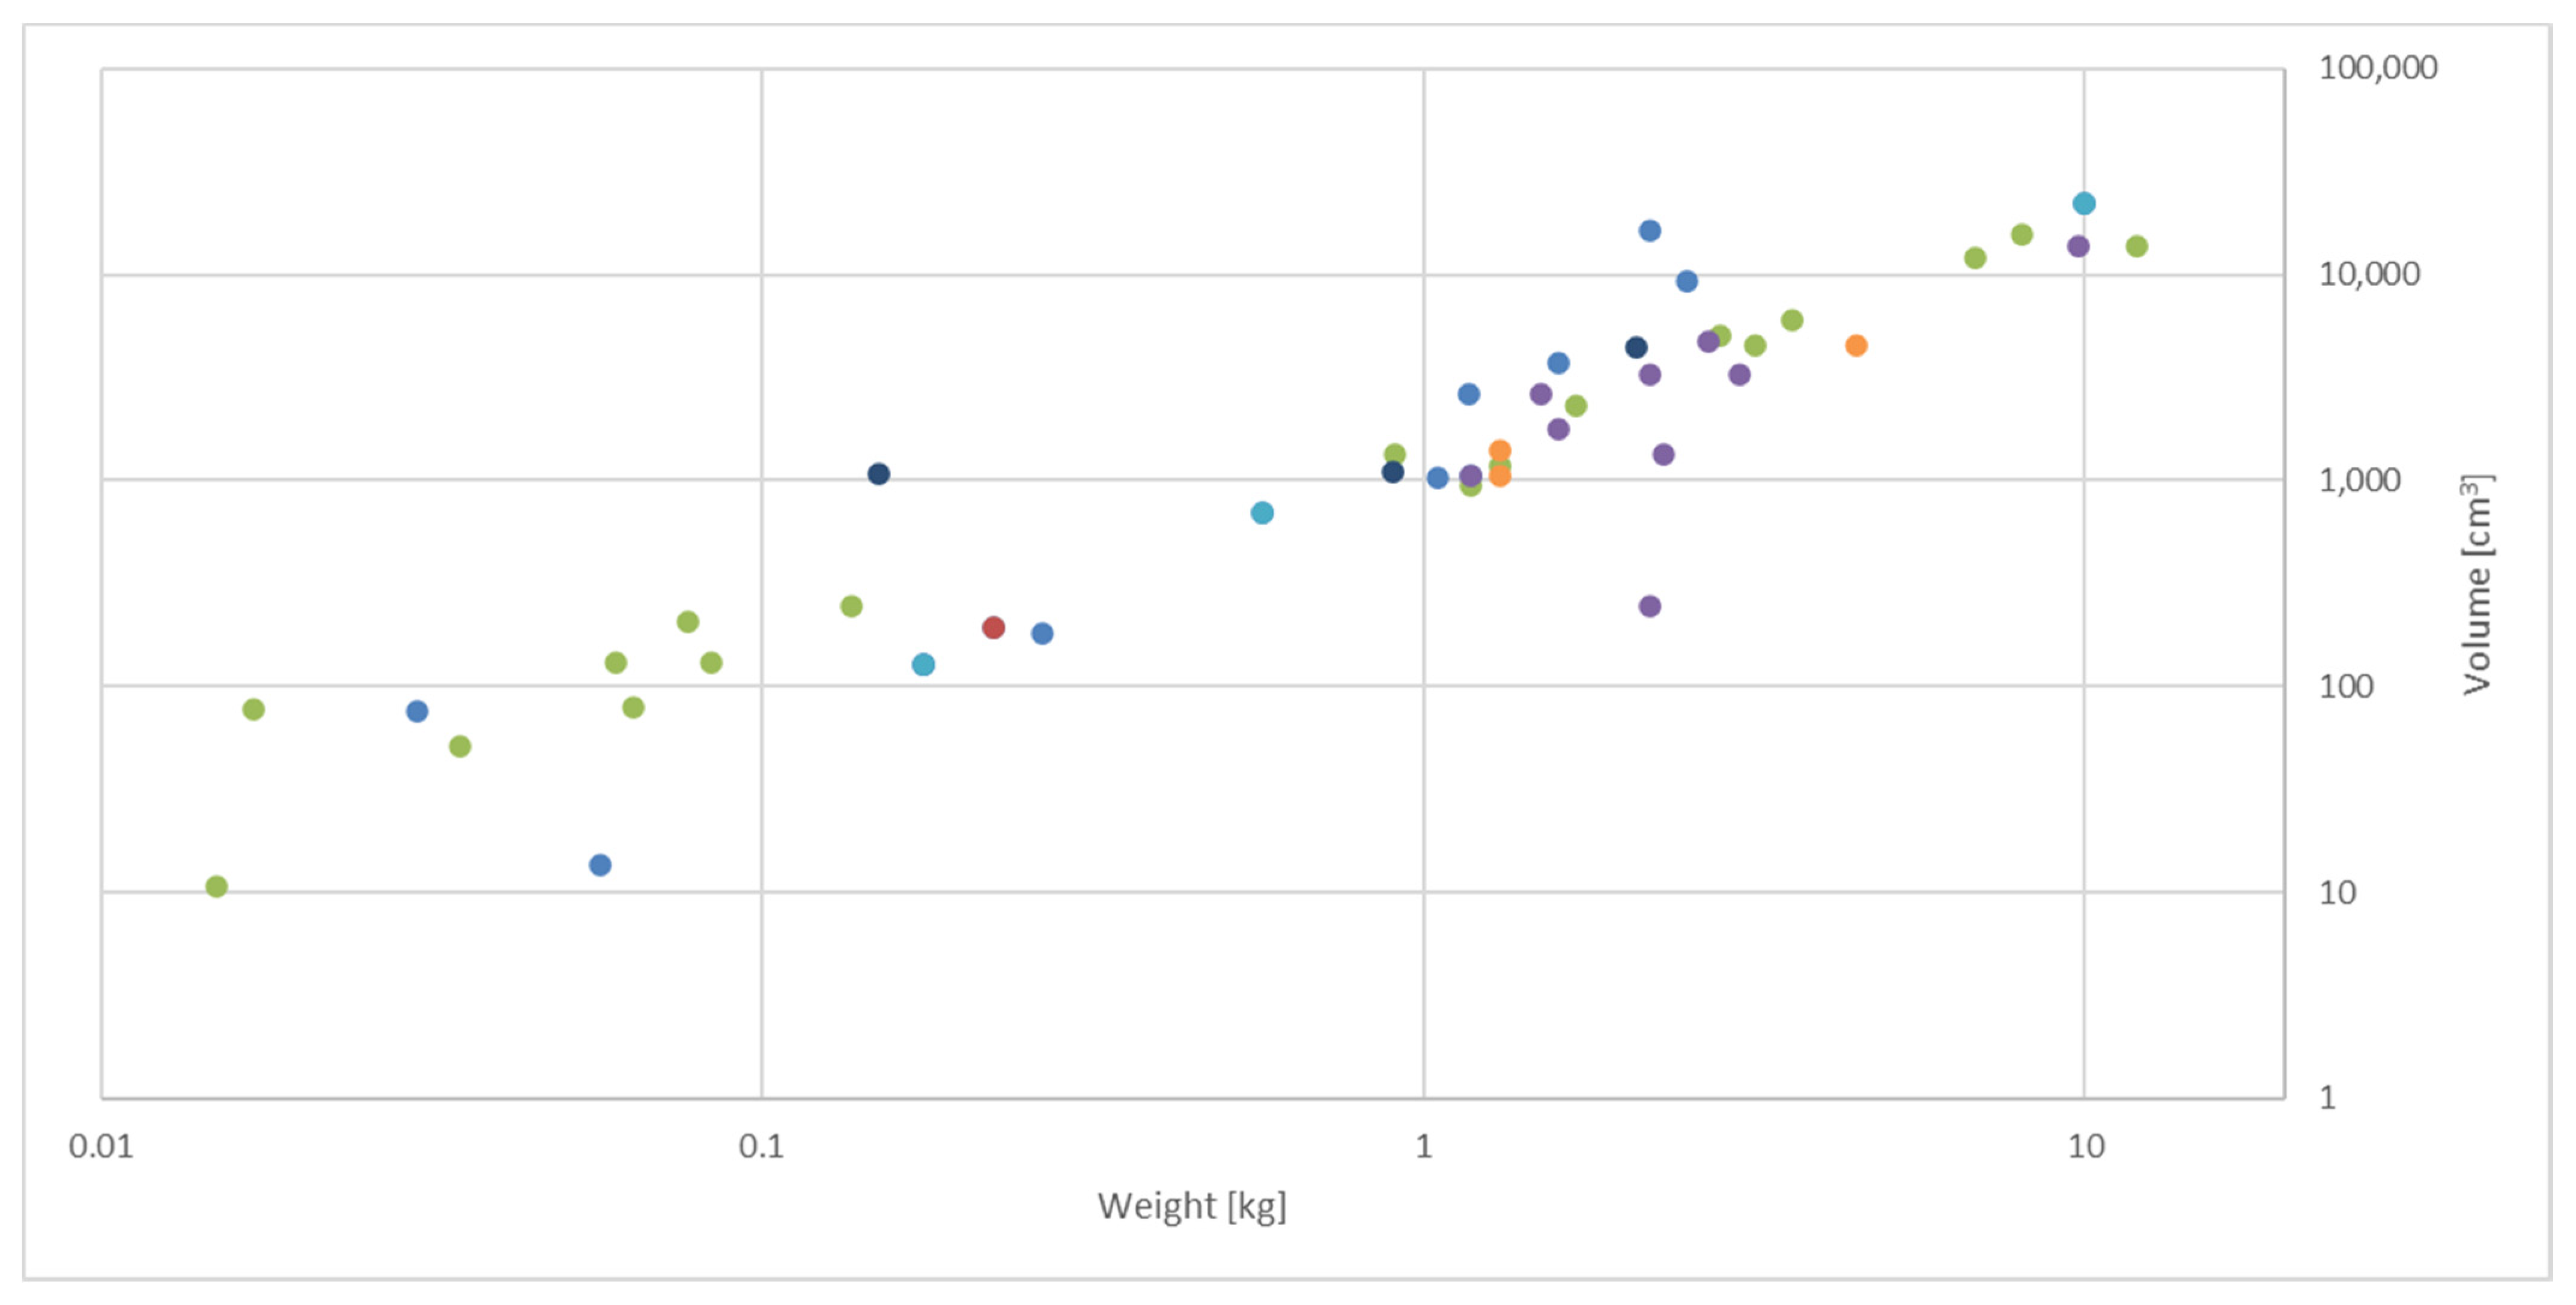

| Technology | Details | Feature Measured | Availability | Stage (Prototype/Commercial) | Literature (Original Articles and Reviews) |
|---|---|---|---|---|---|
| Optical sensors | Reflectance | Colour (CIE lab) | Handheld | C | [17] |
| Reflectance, absorption, fluorescence | VIS spectrum | Handheld | P/C | [18] | |
| Reflectance, absorption | FLUO spectrum | Handheld | P/C | [18,19] | |
| Reflectance, absorption | NIR/SWIR spectrum | Handheld | P/C | [12,20] | |
| Reflectance | FTIR spectrum | Portable | P/C | [21,22] | |
| Reflectance | MIR spectrum | Portable | P | [21,23] | |
| Raman scattering | Scattered light | Portable/handheld | C | [13,20,24] | |
| LIBS | Emitting light from plasma cooling | Portable | P/C | [25] | |
| Imaging | Reflectance, fluorescence | VIS spectrum | Portable | P/C | [18,26,27] |
| Reflectance | SWIR spectrum | Portable | P/C | [26,27] | |
| Scattering | Raman spectrum | Portable | P | [24] | |
| NMR | NMR | NMR spectrum | Portable | P | [28] |
| Sensor arrays | Electronic Nose | Volatile compounds | Handheld | P/C | [10,29,30,31,32,33] |
| Electronic Tongue | Solutes | Portable | P | [30,34,35,36] |
| Technology | Products of Animal Origin | Products of Plant Origin | Total | ||||
|---|---|---|---|---|---|---|---|
| Meat, Meat Products, and Offal | Milk and Milk Products | Fish and Seafood | Others | Fresh/Dried | Processed | ||
| VIS | 2 | 1 | - | - | 2 | - | 5 |
| FLUO | 1 | 1 | - | - | 2 | - | 4 |
| VIS-NIR | 4 | 2 | - | - | 17 | - | 23 |
| NIR | 17 | 8 | 3 | 2 | 40 | 10 | 80 |
| MIR | - | 2 | - | - | 1 | 3 | 6 |
| Raman | 1 | 1 | - | - | 4 | 2 | 8 |
| LIBS | 2 | 4 | - | 2 | 3 | 3 | 14 |
| Imaging | 1 | - | 3 | - | 4 | - | 8 |
| Sensor array | - | - | 1 | - | 1 | - | 2 |
| Total-1 | 28 | 19 | 7 | 4 | 74 | 18 | |
| Total-2 | 58 | 92 | 150 | ||||
Publisher’s Note: MDPI stays neutral with regard to jurisdictional claims in published maps and institutional affiliations. |
© 2021 by the authors. Licensee MDPI, Basel, Switzerland. This article is an open access article distributed under the terms and conditions of the Creative Commons Attribution (CC BY) license (https://creativecommons.org/licenses/by/4.0/).
Share and Cite
Müller-Maatsch, J.; van Ruth, S.M. Handheld Devices for Food Authentication and Their Applications: A Review. Foods 2021, 10, 2901. https://doi.org/10.3390/foods10122901
Müller-Maatsch J, van Ruth SM. Handheld Devices for Food Authentication and Their Applications: A Review. Foods. 2021; 10(12):2901. https://doi.org/10.3390/foods10122901
Chicago/Turabian StyleMüller-Maatsch, Judith, and Saskia M. van Ruth. 2021. "Handheld Devices for Food Authentication and Their Applications: A Review" Foods 10, no. 12: 2901. https://doi.org/10.3390/foods10122901