
Content and Bioaccessibility of Vitamin K (Phylloquinone and Menaquinones) in Cheese


Abstract
:
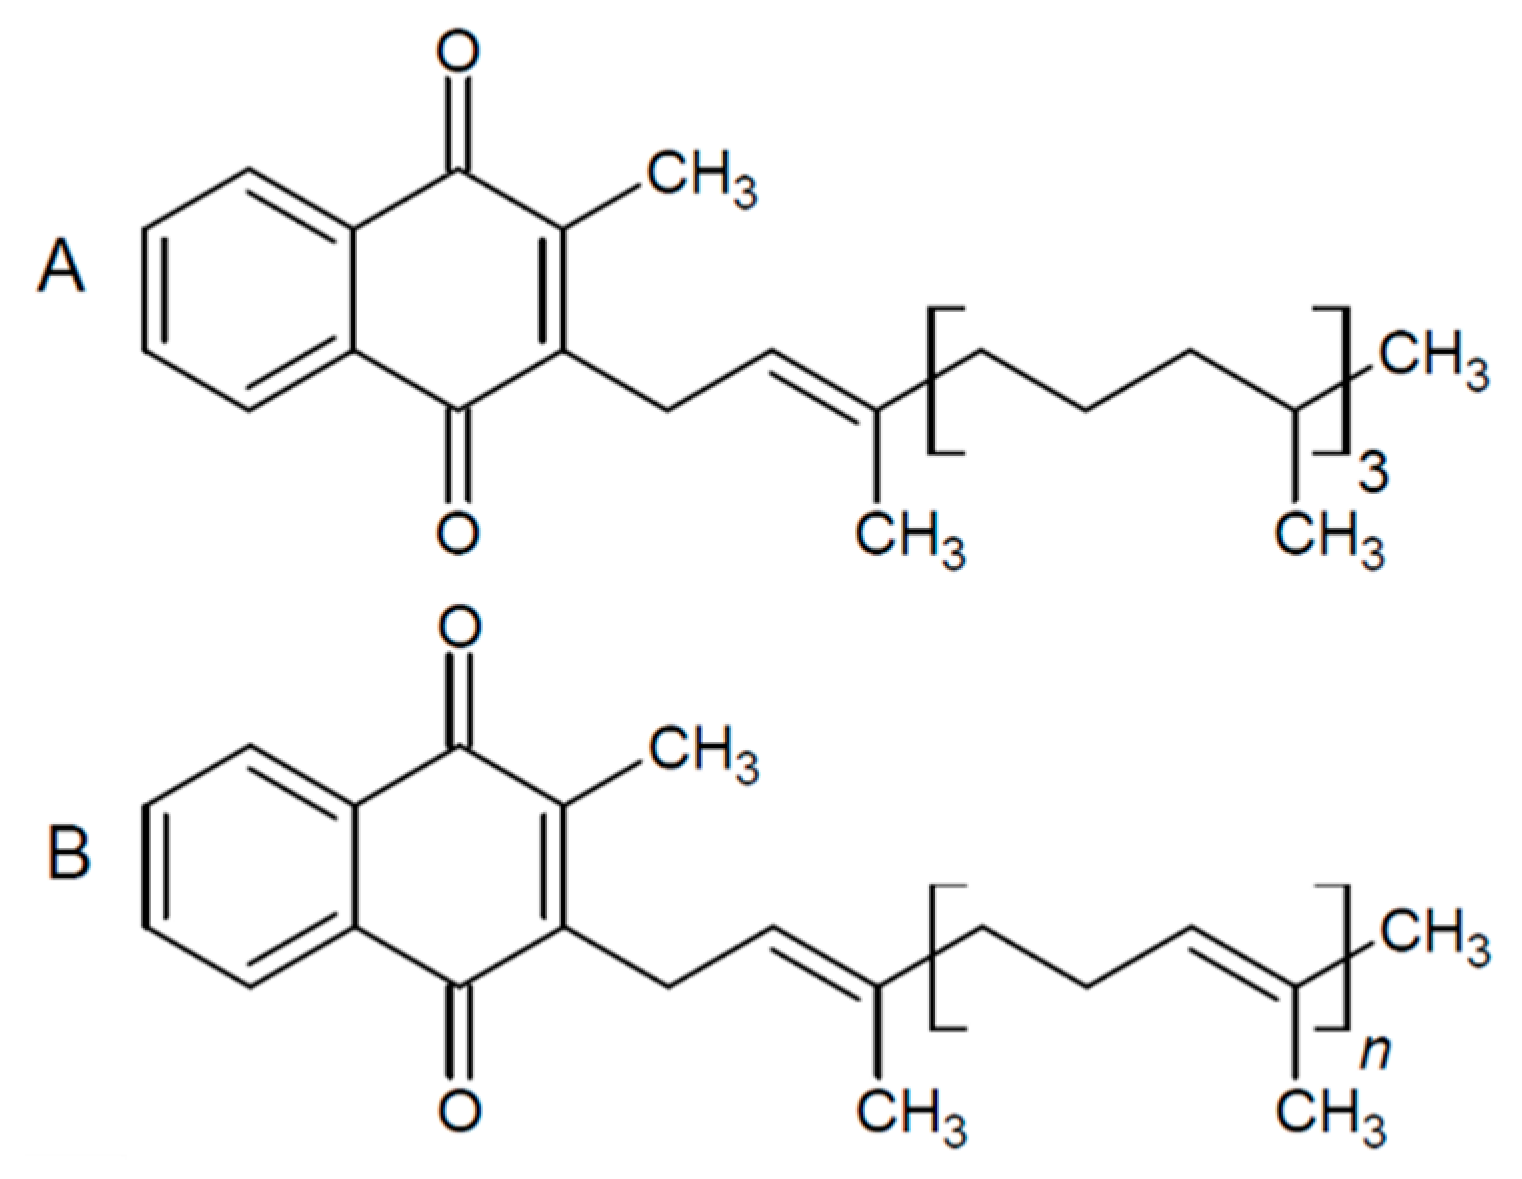
1. Introduction
2. Materials and Methods
2.1. Samples
2.2. Determination of Water in the Cheese Products
2.3. In Vitro Digestion of Cheese Products
2.4. Extraction and Quantification of Vitamin K Vitamers
2.5. Statistical Analysis
3. Results
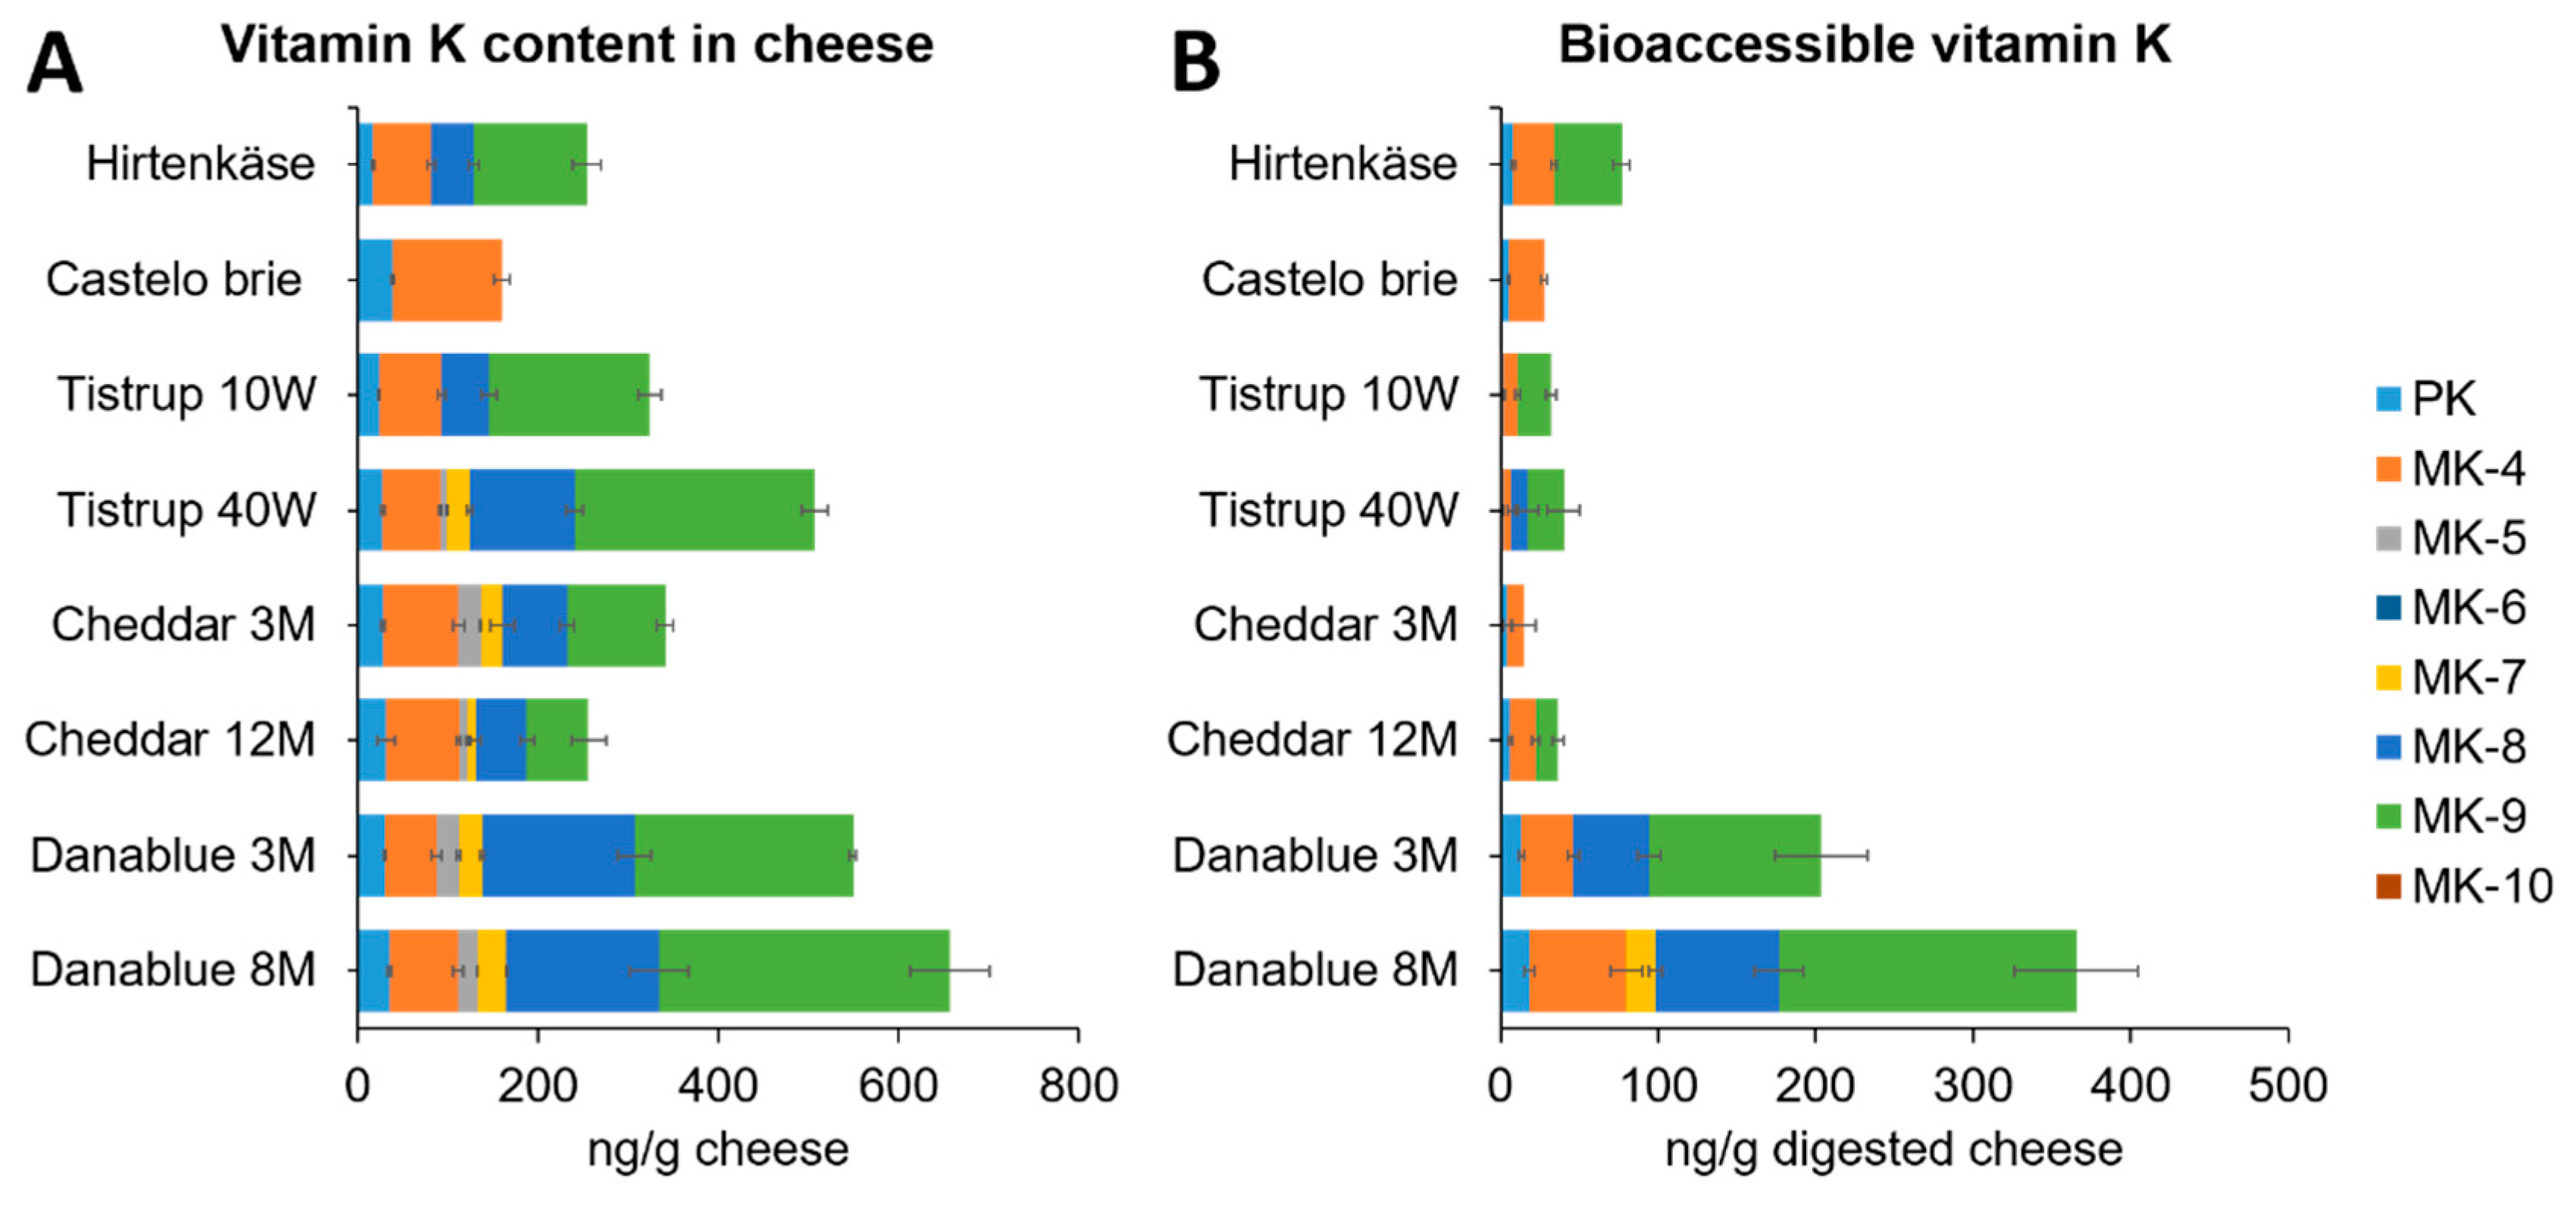
3.1. Content of Vitamin K in Cheese Products
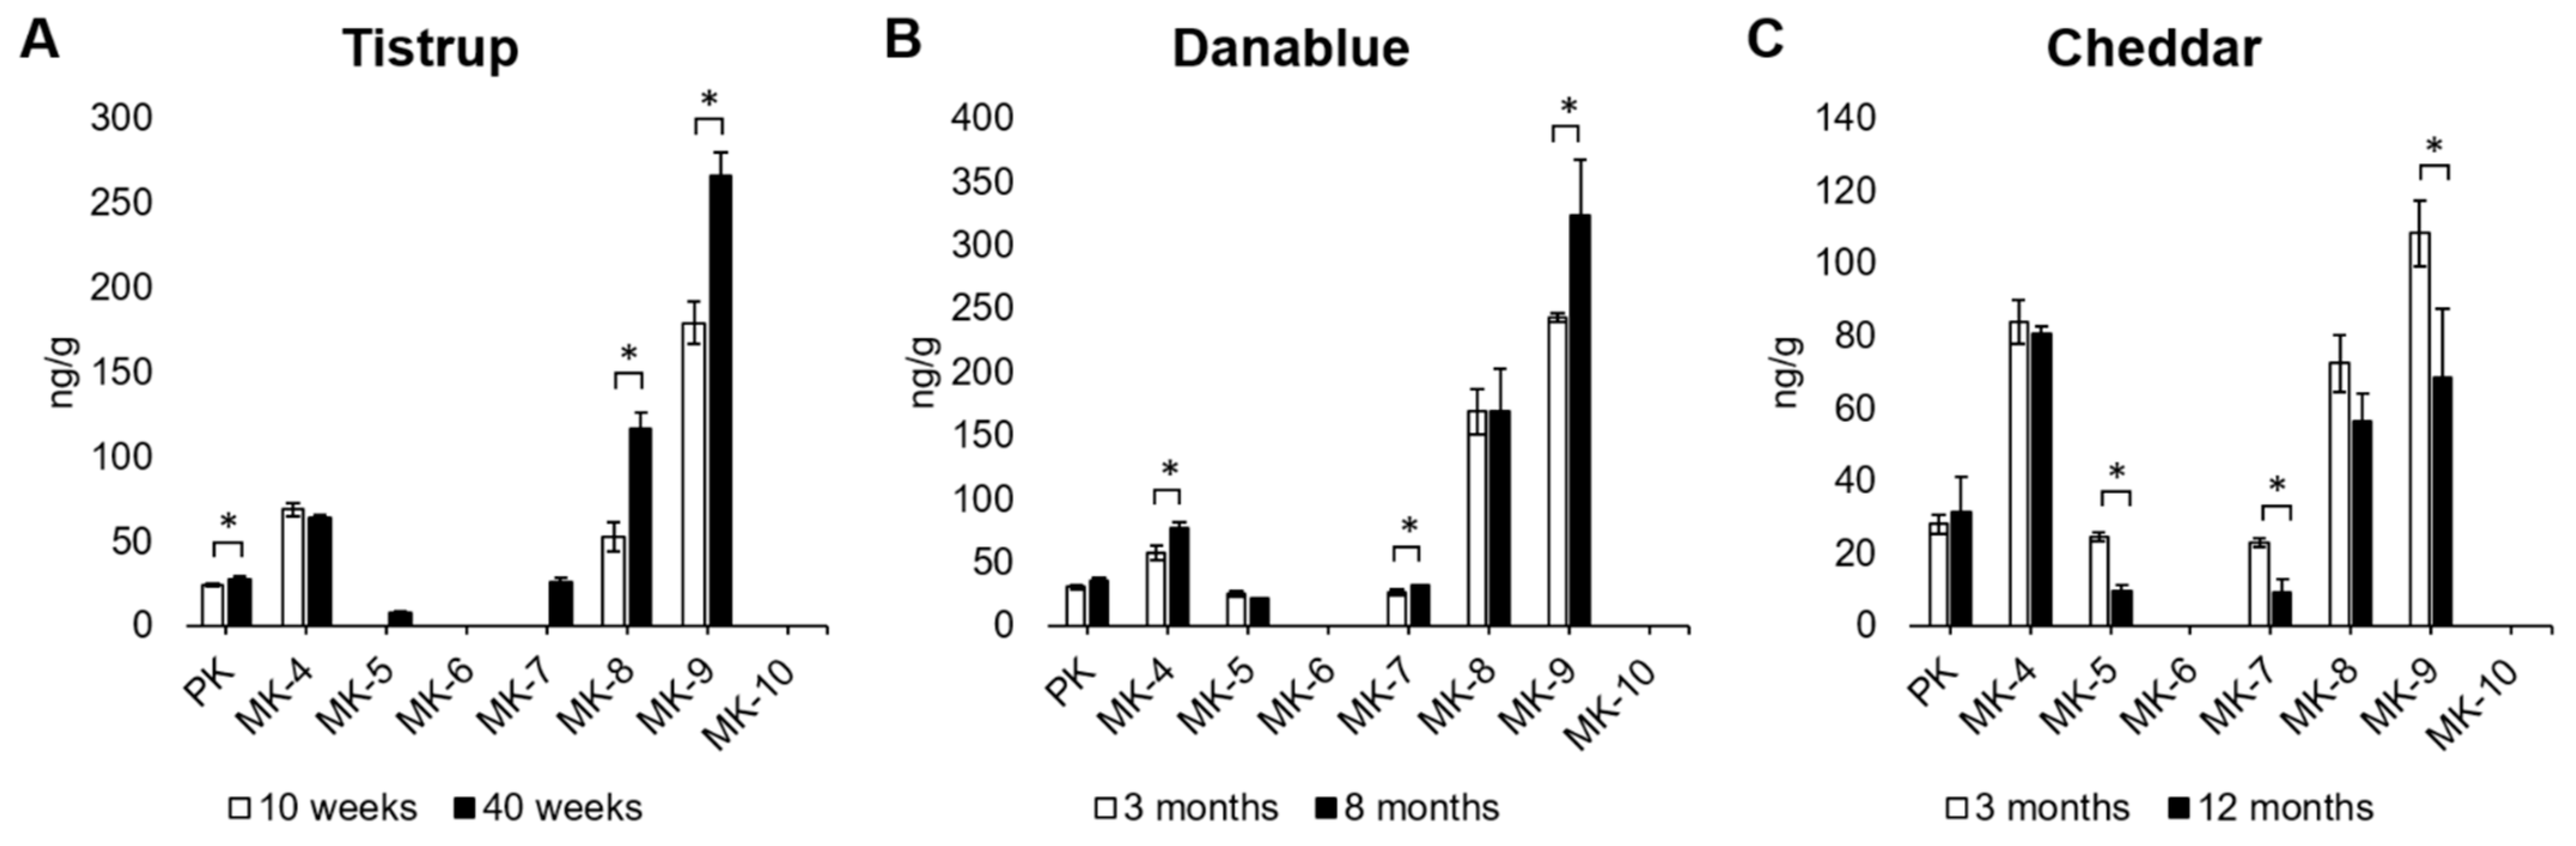
3.2. Development of Vitamin K Content during Ripening of Cheese
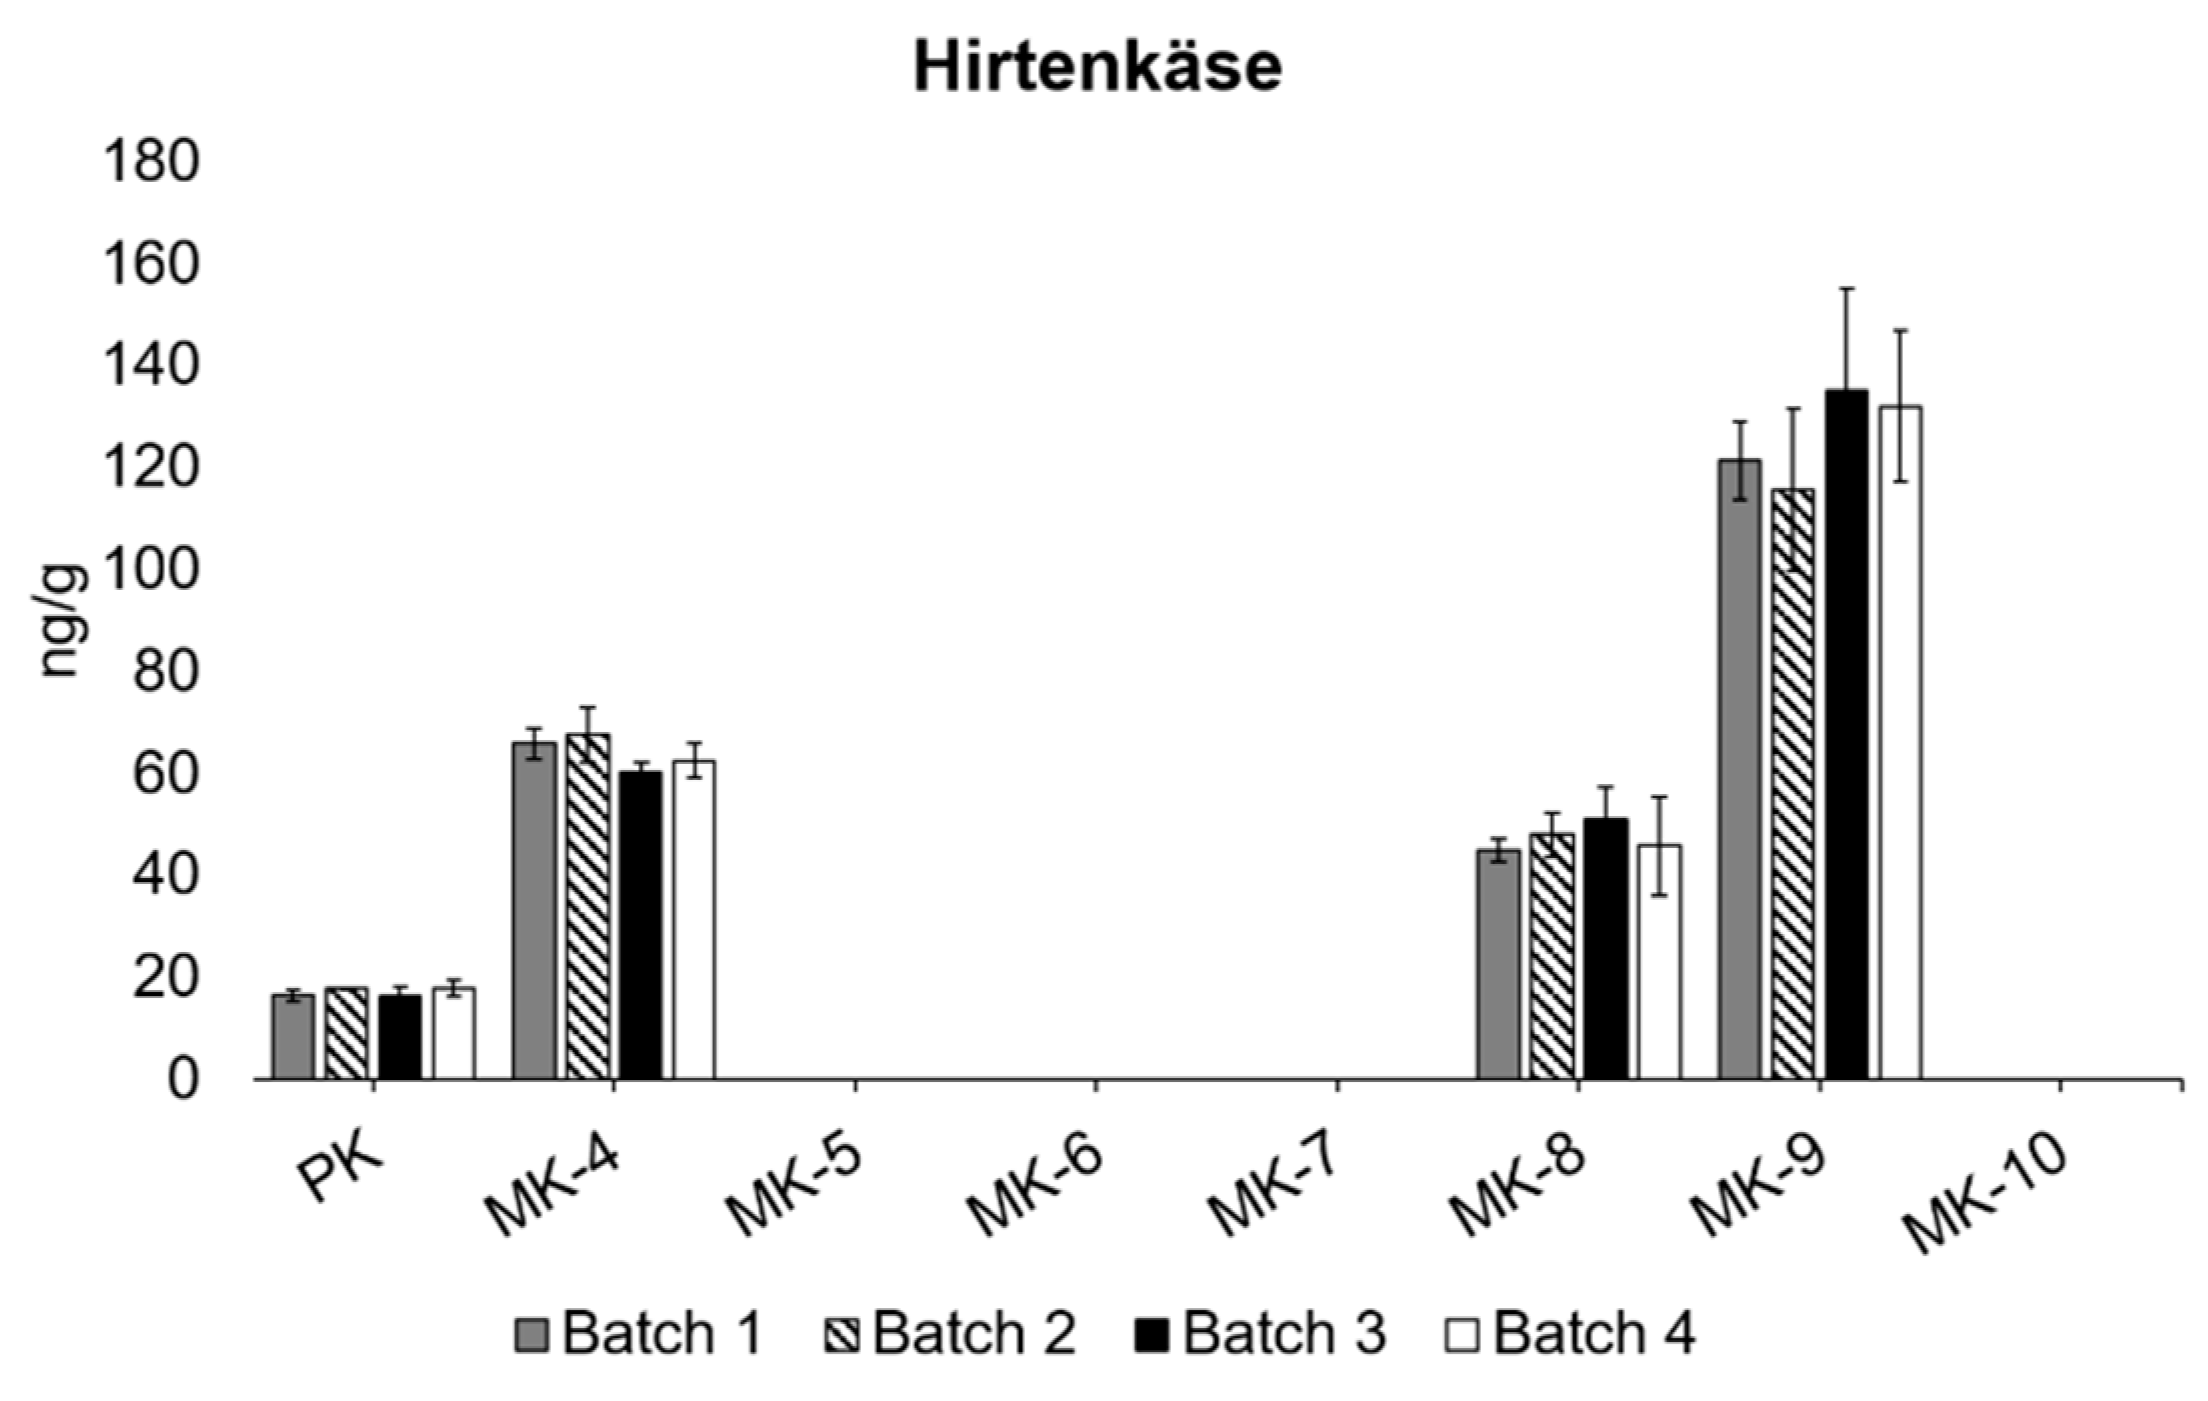
3.3. Differences between Different Batches
3.4. Bioaccessibility of Vitamin K in Cheese
4. Conclusions
Author Contributions
Funding
Data Availability Statement
Acknowledgments
Conflicts of Interest
Appendix A

| Cheese | Ripening Time | No. Batches Recieved | Amount per Batch (Kg) |
|---|---|---|---|
| Danablu | 3 months | 1 | 0.9 |
| 8 months | 1 | 0.9 | |
| Tistrup | 10 weeks | 1 | 1.0 |
| 40 weeks | 1 | 1.0 | |
| Brie | 3 weeks | 1 | 0.2 |
| Hirtenkäse | 1 week | 4 | 0.3 |
| Cheddar | 3 months | 1 | 1.8 |
| 12 months | 1 | 1.8 |
Appendix B
Extraction, Sample Clean-Up, and Quantification of Vitamin K
Appendix C
| Compound | Precursor ion (m/z) | Product Ion (m/z) | Retention Time (min) | Fragmentor (V) | Collision Energy (eV) |
|---|---|---|---|---|---|
| Phylloquinone | 451.71 | 187.0 185.1 | 2.361 2.361 | 148 148 | 25 17 |
| d7-Phylloquinone | 458.71 | 194.1 | 2.331 | 168 | 17 |
| Menaquinone-4 | 445.71 | 187.1 109.1 | 1.485 1.485 | 120 120 | 25 21 |
| d7-Menaquinone-4 | 452.71 | 194.1 | 1.462 | 128 | 21 |
| Menaquinones-5 | 513.8 | 187.1 109.1 | 2.389 2.389 | 135 135 | 25 25 |
| Menaquinone-6 | 581.9 | 187.1 109.1 | 2.775 2.775 | 158 158 | 25 25 |
| Menaquinone-7 | 650.01 | 187.1 109.1 | 3.211 3.211 | 168 168 | 25 25 |
| d7-Menaquinone-7 | 657.01 | 194.1 | 3.197 | 164 | 33 |
| Menaquinones-8 | 718.1 | 187.1 227.1 | 3.288 3.288 | 175 175 | 35 35 |
| Menaquinone-9 | 786.31 | 109.1 187.0 | 3.784 3.784 | 184 184 | 40 40 |
| d7-Menaquinone-9 | 793.31 | 194.1 | 3.770 | 188 | 40 |
| Menaquinones-10 | 854.3 | 187.1 227.2 | 3.851 3.851 | 195 195 | 40 40 |
Appendix D
| Cheese | ng/g Cheese ± sd | Bioaccessibility (%) ± sd | |||||||||
|---|---|---|---|---|---|---|---|---|---|---|---|
| PK | MK-4 | MK-5 | MK-7 | MK-8 | MK-9 | PK | MK-4 | MK-7 | MK-8 | MK-9 | |
| Hirtenkäse | 17 ± 1.4 | 64 ± 4.3 | <7 | <5 | 47 ± 5.9 | 126 ± 15 | 49 ± 6.5 | 40 ± 2.8 | nd | nd | 34 ± 4.4 |
| Castello Brie | 39 ± 1.3 | 121 ± 8.3 | <7 | <5 | <14 | <10 | 14 ± 1.7 | 19 ± 1.7 | nd | nd | nd |
| Tistrup 10 W | 24 ± 0.6 | 69 ± 4.0 | <7 | <5 | 52 ± 8.7 | 179 ± 13 | 9.4 ± 1.4 | 13 ± 2.4 | nd | nd | 12 ± 1.9 |
| Tistrup 40 W | 27 ± 2.0 | 64 ± 1.4 | 8 ± 0.7 | 25 ± 3.0 | 117 ± 9.2 | 266 ± 14 | 6.2 ± 2.4 | 7.7 ± 3.8 | nd | 9.3 ± 0.6 | 8.5 ± 3.8 |
| Cheddar 3 M | 28 ± 2.7 | 84 ± 6.1 | 25 ± 1.2 | 24 ± 14 | 72 ± 8.0 | 108 ± 9.1 | 17 ± 8.5 | 12 ± 8.6 | nd | nd | nd |
| Cheddar 12 M | 31 ± 9.5 | 81 ± 2.0 | 9.6 ± 1.4 | 9.5 ± 5.5 | 56 ± 7.5 | 68 ± 19 | 20 ± 3.3 | 20 ± 3.1 | nd | nd | 21 ± 5.1 |
| Danablu 3 M | 30 ± 1.4 | 57 ± 5.9 | 25 ± 1.8 | 26 ± 2.3 | 169 ± 18 | 243 ± 3.4 | 45 ± 6.0 | 57 ± 6.8 | nd | 28 ± 4.5 | 45 ± 12 |
| Danablu 8 M | 35 ± 2.6 | 76 ± 5.3 | 21 ± 0.6 | 32 ± 0.4 | 169 ± 33 | 323 ± 44 | 53 ± 8.6 | 80 ± 13 | 58 ± 12 | 46 ± 9.3 | 58 ± 12 |
References
- Dam, H. The Antihæmorrhagic Vitamin of the Chick.: Occurrence And Chemical Nature. Nature 1935, 135, 652–653. [Google Scholar] [CrossRef]
- Shearer, M.J.; Newman, P. Metabolism and cell biology of vitamin K. Thromb. Haemost. 2008, 100, 530–547. [Google Scholar] [PubMed]
- Nowicka, B.; Kruk, J. Powered by light: Phototrophy and photosynthesis in prokaryotes and its evolution. Microbiol. Res. 2016, 186–187, 99–118. [Google Scholar] [CrossRef]
- Nowicka, B.; Kruk, J. Occurrence, biosynthesis and function of isoprenoid quinones. Biochim. Biophys. Acta (BBA)-Bioenerg. 2010, 1797, 1587–1605. [Google Scholar] [CrossRef] [PubMed] [Green Version]
- Shearer, M.J.; Okano, T. Key Pathways and Regulators of Vitamin K Function and Intermediary Metabolism. Annu. Rev. Nutr. 2018, 38, 127–151. [Google Scholar] [CrossRef] [PubMed]
- Tie, J.-K.; Stafford, D.W. Structural and functional insights into enzymes of the vitamin K cycle. J. Thromb. Haemost. 2015, 14, 236–247. [Google Scholar] [CrossRef] [PubMed] [Green Version]
- Halder, M.; Petsophonsakul, P.; Akbulut, A.C.; Pavlic, A.; Bohan, F.; Anderson, E.; Maresz, K.; Kramann, R.; Schurgers, L. Vitamin K: Double Bonds beyond Coagulation Insights into Differences between Vitamin K1 and K2 in Health and Disease. Int. J. Mol. Sci. 2019, 20, 896. [Google Scholar] [CrossRef] [PubMed] [Green Version]
- Geleijnse, J.M.; Vermeer, C.; Grobbee, D.E.; Schurgers, L.J.; Knapen, M.H.J.; Van Der Meer, I.M.; Hofman, A.; Witteman, J.C.M. Dietary Intake of Menaquinone Is Associated with a Reduced Risk of Coronary Heart Disease: The Rotterdam Study. J. Nutr. 2004, 134, 3100–3105. [Google Scholar] [CrossRef] [PubMed]
- Gast, G.-C.M.; De Roos, N.M.; Sluijs, I.; Bots, M.L.; Beulens, J.W.J.; Geleijnse, J.M.; Witteman, J.C.; Grobbee, D.E.; Peeters, P.H.M.; van der Schouw, Y.T.; et al. A high menaquinone intake reduces the incidence of coronary heart disease. Nutr. Metab. Cardiovasc. Dis. 2009, 19, 504–510. [Google Scholar] [CrossRef] [PubMed]
- Nimptsch, K.; Rohrmann, S.; Kaaks, R.; Linseisen, J. Dietary vitamin K intake in relation to cancer incidence and mortality: Results from the Heidelberg cohort of the European Prospective Investigation into Cancer and Nutrition (EPIC-Heidelberg). Am. J. Clin. Nutr. 2010, 91, 1348–1358. [Google Scholar] [CrossRef] [PubMed] [Green Version]
- The European Parliament. Regulation (EU) No 1169/2011 of the European Parliament and of the Council. OJEU 2011, 304, 18–63. [Google Scholar]
- EFSA; NDA; Turck, D.; Bresson, J.-L.; Burlingame, B.; Dean, T.; Fairweather-Tait, S.; Heinonen, M.; Hirsch-Ernst, K.I.; Mangelsdorf, I.; et al. Dietary reference values for vitamin K. EFSA J. 2017, 15, e04780. [Google Scholar]
- Reboul, E.; Richelle, M.; Perrot, E.; Desmoulins-Malezet, C.; Pirisi, A.V.; Borel, P. Bioaccessibility of Carotenoids and Vitamin E from Their Main Dietary Sources. J. Agric. Food Chem. 2006, 54, 8749–8755. [Google Scholar] [CrossRef] [PubMed]
- Wu, P.; Chen, X.D. Validation of in vitro bioaccessibility assays—A key aspect in the rational design of functional foods towards tailored bioavailability. Curr. Opin. Food Sci. 2021, 39, 160–170. [Google Scholar] [CrossRef]
- McClements, D.J.; Peng, S.-F. Current status in our understanding of physicochemical basis of bioaccessibility. Curr. Opin. Food Sci. 2019, 31, 57–62. [Google Scholar] [CrossRef]
- Shearer, M.J.; Fu, X.; Booth, S.L. Vitamin K Nutrition, Metabolism, and Requirements: Current Concepts and Future Research. Adv. Nutr. 2012, 3, 182–195. [Google Scholar] [CrossRef] [PubMed] [Green Version]
- Vermeer, C.; Raes, J.; Van’t Hoofd, C.; Knapen, M.H.J.; Xanthoulea, S. Menaquinone Content of Cheese. Nutrients 2018, 10, 446. [Google Scholar] [CrossRef] [PubMed] [Green Version]
- Fu, X.; Harshman, S.G.; Shen, X.; Haytowitz, D.B.; Karl, J.P.; Wolfe, B.; Booth, S.L. Multiple Vitamin K Forms Exist in Dairy Foods. Curr. Dev. Nutr. 2017, 1, e000638. [Google Scholar] [CrossRef] [PubMed] [Green Version]
- Manoury, E.; Jourdon, K.; Boyaval, P.; Fourcassié, P. Quantitative measurement of vitamin K2 (menaquinones) in various fermented dairy products using a reliable high-performance liquid chromatography method. J. Dairy Sci. 2013, 96, 1335–1346. [Google Scholar] [CrossRef] [Green Version]
- Tarvainen, M.; Fabritius, M.; Yang, B. Determination of vitamin K composition of fermented food. Food Chem. 2019, 275, 515–522. [Google Scholar] [CrossRef] [PubMed]
- Jäpelt, R.B.; Jakobsen, J. Analysis of vitamin K1 in fruits and vegetables using accelerated solvent extraction and liquid chromatography tandem mass spectrometry with atmospheric pressure chemical ionization. Food Chem. 2016, 192, 402–408. [Google Scholar] [CrossRef]
- Kamao, M.; Suhara, Y.; Tsugawa, N.; Uwano, M.; Yamaguchi, N.; Uenishi, K.; Ishida, H.; Sasaki, S.; Okano, T. Vitamin K Content of Foods and Dietary Vitamin K Intake in Japanese Young Women. J. Nutr. Sci. Vitaminol. 2007, 53, 464–470. [Google Scholar] [CrossRef] [Green Version]
- Schurgers, L.J.; Vermeer, C. Determination of Phylloquinone and Menaquinones in Food Effect of Food Matrix on Circulating Vitamin K Concentrations. Haemostasis 2000, 30, 298–307. [Google Scholar] [PubMed]
- Brodkorb, A.; Egger, L.; Alminger, M.; Alvito, P.; Assunção, R.; Ballance, S.; Bohn, T.; Bourlieu-Lacanal, C.; Boutrou, R.; Carrière, F.; et al. INFOGEST static In Vitro simulation of gastrointestinal food digestion. Nat. Protoc. 2019, 14, 991–1014. [Google Scholar] [CrossRef] [PubMed]
- Jensen, M.B.; Ložnjak Švarc, P.; Jakobsen, J. Vitamin K (phylloquinone and menaquinones) in foods—Optimisation of extraction, clean-up and LC–ESI-MS/MS method for quantification. Food Chem. 2021, 345, 128835. [Google Scholar] [CrossRef] [PubMed]
- Jensen, M.B.; Rød, K.E.; Ložnjak Švarc, P.; Oveland, E.; Jakobsen, J. Vitamin K (phylloquinone and menaquinones) in foods—Cost-effective quantification by LC-ESI-MS/MS. Food Chem. Under Review. [CrossRef]
- Walther, B.; Guggisberg, D.; Schmidt, R.S.; Portmann, R.; Risse, M.-C.; Badertscher, R.; Chollet, M. Quantitative analysis of menaquinones (vitamin K2) in various types of cheese from Switzerland. Int. Dairy J. 2020, 112, 104853. [Google Scholar] [CrossRef]
- Chollet, M.; Guggisberg, D.; Portmann, R.; Risse, M.-C.; Walther, B. Determination of menaquinone production by Lactococcus spp. and propionibacteria in cheese. Int. Dairy J. 2017, 75, 1–9. [Google Scholar] [CrossRef]
- Gentili, A.; Caretti, F.; Bellante, S.; Ventura, S.; Canepari, S.; Curini, R. Comprehensive Profiling of Carotenoids and Fat-Soluble Vitamins in Milk from Different Animal Species by LC-DAD-MS/MS Hyphenation. J. Agric. Food Chem. 2012, 61, 1628–1639. [Google Scholar] [CrossRef] [PubMed]
- Indyk, H.E.; Woollard, D.C. The edogenous vitamin K1 content of bovine milk: Temporal influence of season and lactation. Food Chem. 1995, 54, 403–407. [Google Scholar] [CrossRef]
- Fournier, B.; Sann, L.; Guillaumont, M.; Leclercq, M. Variations of phylloquinone concentration in human milk at various stages of lactation and comw’s milk at various seasons. Am. J. Clin. Nutr. 1987, 45, 551–558. [Google Scholar] [CrossRef] [PubMed]
- Qureshi, T.M.; Vermeer, C.; Vegarud, G.E.; Abrahamsen, R.K.; Skeie, S. Formation of biogenic amines and vitamin K contents in the Norwegian autochthonous cheese Gamalost during ripening. Dairy Sci. Technol. 2013, 93, 303–314. [Google Scholar] [CrossRef] [Green Version]
- The European Parliament. Regulation (EU) No 1169/2011. J. Eur. Union 2014, 304, 1–60. [Google Scholar]
- Tyssandier, V.; Reboul, E.; Dumas, J.-F.; Bouteloup-Demange, C.; Armand, M.; Marcand, J.; Sallas, M.; Borel, P. Processing of vegetable-borne carotenoids in the human stomach and duodenum. Am. J. Physiol. Gastrointest. Liver Physiol. 2003, 284, G913–G923. [Google Scholar] [CrossRef]
- Minekus, M.; Alminger, M.; Alvito, P.; Ballance, S.; Bohn, T.; Bourlieu, C.; Carrière, F.; Boutrou, R.; Corredig, M.; Dupont, D.; et al. A standardised static in vitro digestion method suitable for food—An international consensus. Food Funct. 2014, 5, 1113–1124. [Google Scholar] [CrossRef] [PubMed] [Green Version]
- Furuichi, K.; Hojo, K.-I.; Katakura, Y.; Ninomiya, K.; Shioya, S. Aerobic culture of Propionibacterium freudenreichii ET-3 can increase production ratio of 1,4-dihydroxy-2-naphthoic acid to menaquinone. J. Biosci. Bioeng. 2006, 101, 464–470. [Google Scholar] [CrossRef] [PubMed]
- Margier, M.; Buffière, C.; Goupy, P.; Rémond, D.; Halimi, C.; Caris-Veyrat, C.; Borel, P.; Reboul, E. Opposite Effects of the Spinach Food Matrix on Lutein Bioaccessibility and Intestinal Uptake Lead to Unchanged Bioavailability Compared to Pure Lutein. Mol. Nutr. Food Res. 2018, 62, e1800185. [Google Scholar] [CrossRef] [PubMed]
| Cheese Product | Ripening Time 1 | Starter Culture 1 | Fat (%) 1 | Water (%) 2 |
|---|---|---|---|---|
| Danablu | 3 months | Lactococcus lactis lactis, Lactococcus lactis cremoris, Lactococcus lactis lactis diacetylactis, Leuconostock mesenteroides cremoris | 37 | 41 |
| 8 months | 38 | |||
| Tistrup | 10 weeks | 26 | 44 | |
| 40 weeks | 39 | |||
| Brie | 3 weeks | 39 | 42 | |
| Hirtenkäse | 1 week | 28.6 | 57 | |
| Cheddar | 3 months | Lactococcus lactis lactis, Lactococcus lactis cremoris | 35 | 36 |
| 12 months | 37 |
Publisher’s Note: MDPI stays neutral with regard to jurisdictional claims in published maps and institutional affiliations. |
© 2021 by the authors. Licensee MDPI, Basel, Switzerland. This article is an open access article distributed under the terms and conditions of the Creative Commons Attribution (CC BY) license (https://creativecommons.org/licenses/by/4.0/).
Share and Cite
Jensen, M.B.; Daugintis, A.; Jakobsen, J. Content and Bioaccessibility of Vitamin K (Phylloquinone and Menaquinones) in Cheese. Foods 2021, 10, 2938. https://doi.org/10.3390/foods10122938
Jensen MB, Daugintis A, Jakobsen J. Content and Bioaccessibility of Vitamin K (Phylloquinone and Menaquinones) in Cheese. Foods. 2021; 10(12):2938. https://doi.org/10.3390/foods10122938
Chicago/Turabian StyleJensen, Marie Bagge, Andrius Daugintis, and Jette Jakobsen. 2021. "Content and Bioaccessibility of Vitamin K (Phylloquinone and Menaquinones) in Cheese" Foods 10, no. 12: 2938. https://doi.org/10.3390/foods10122938
APA StyleJensen, M. B., Daugintis, A., & Jakobsen, J. (2021). Content and Bioaccessibility of Vitamin K (Phylloquinone and Menaquinones) in Cheese. Foods, 10(12), 2938. https://doi.org/10.3390/foods10122938