
Optimization of the Appearance Quality in CO2 Processed Ready-to-Eat Carrots through Image Analysis

 , ,
, ,  , and
, and 
Abstract
: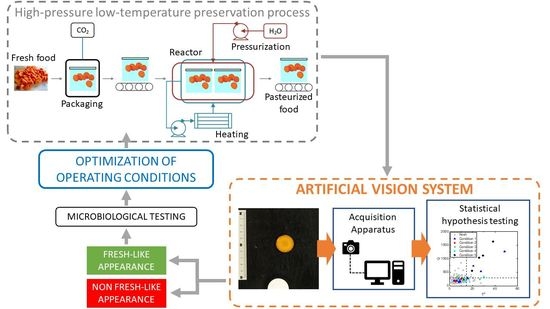
1. Introduction
2. Materials and Methods
2.1. Sample Preparation and Storage
2.2. Experimental Desing
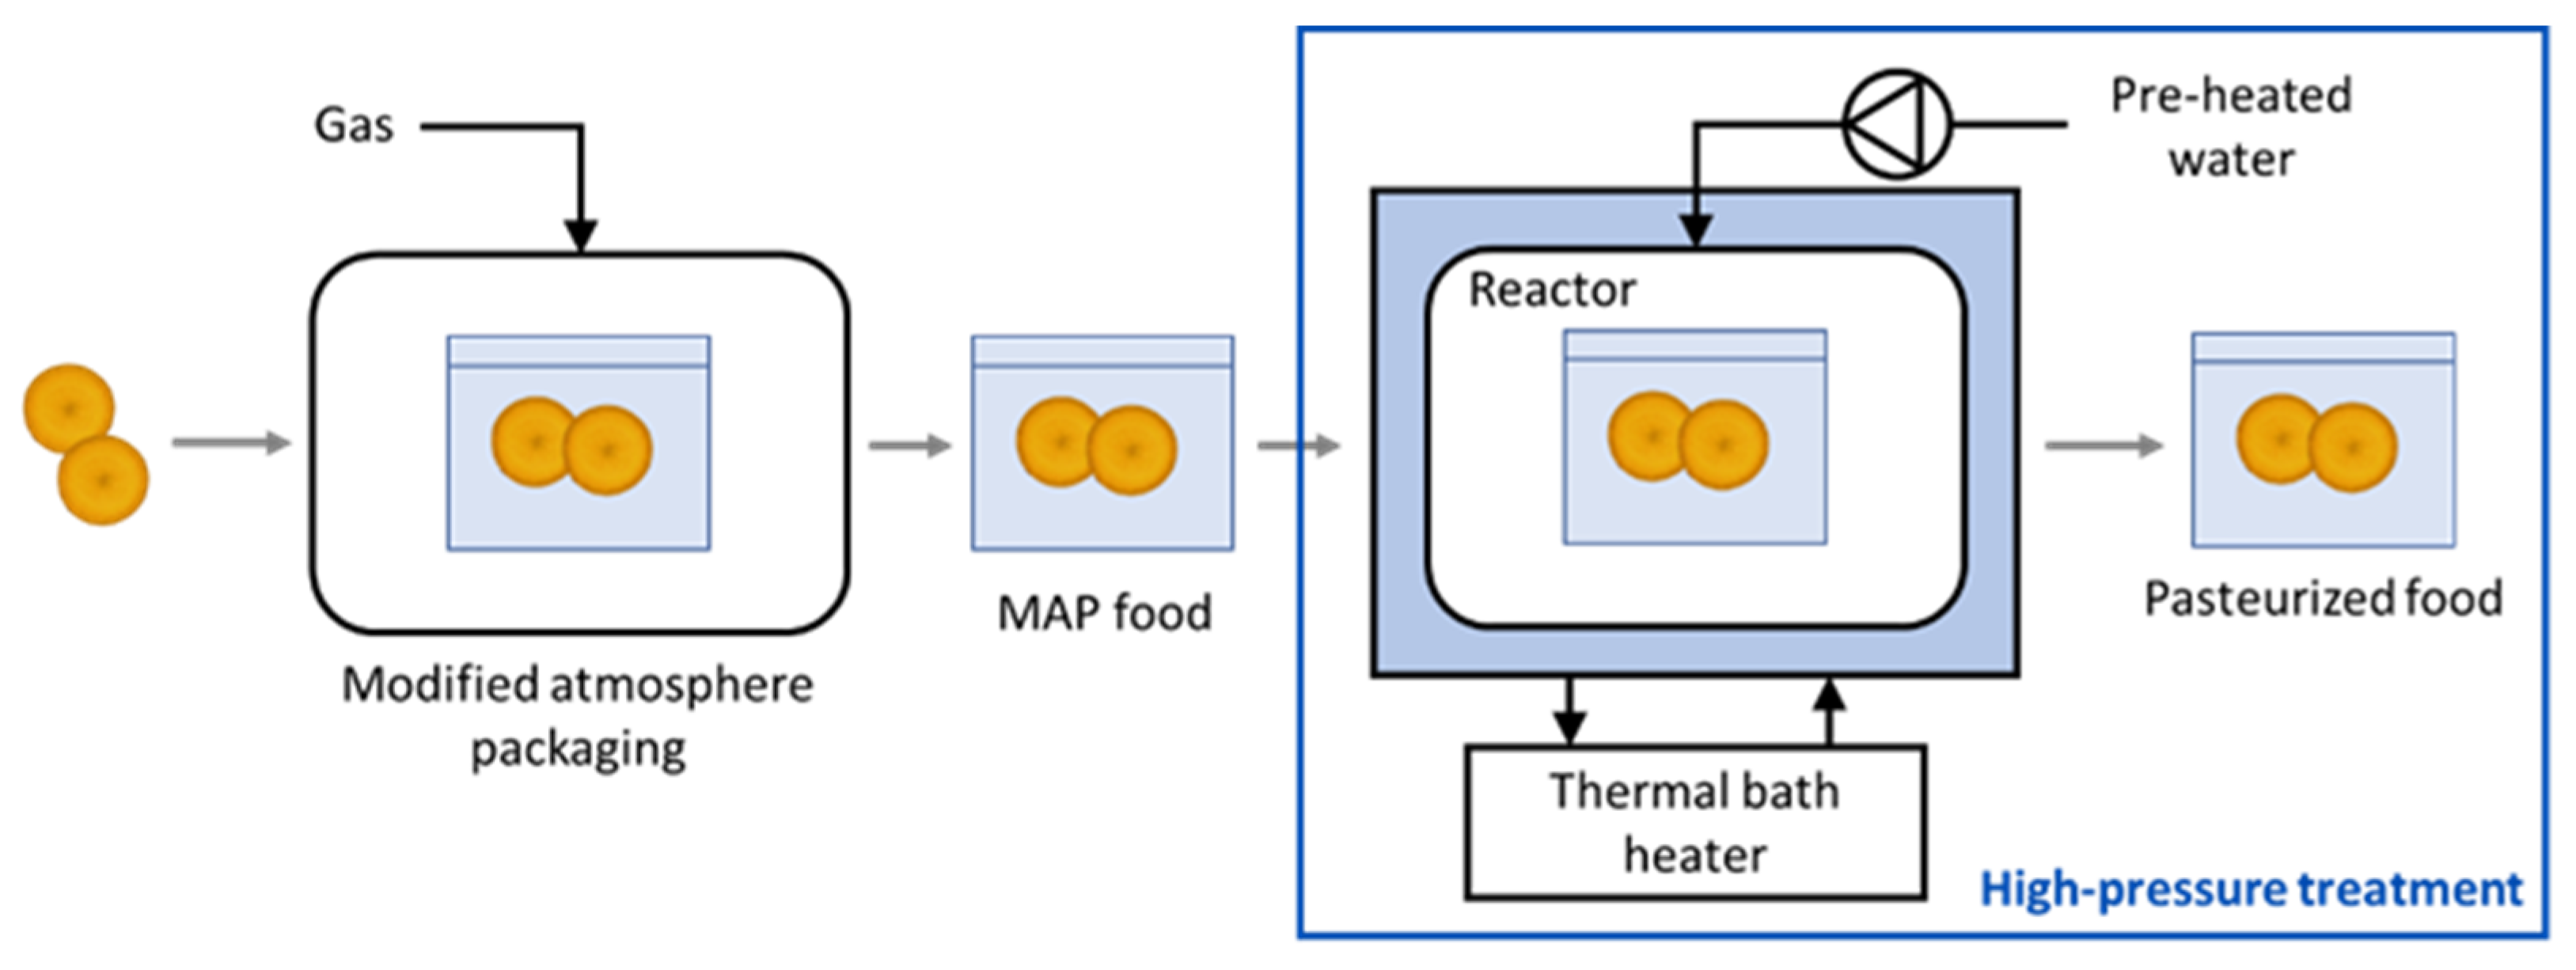
2.3. High-Pressure CO2 Treatment
2.3.1. MAP Packaging
2.3.2. High Pressure Equipment
2.4. Artificial Vision System
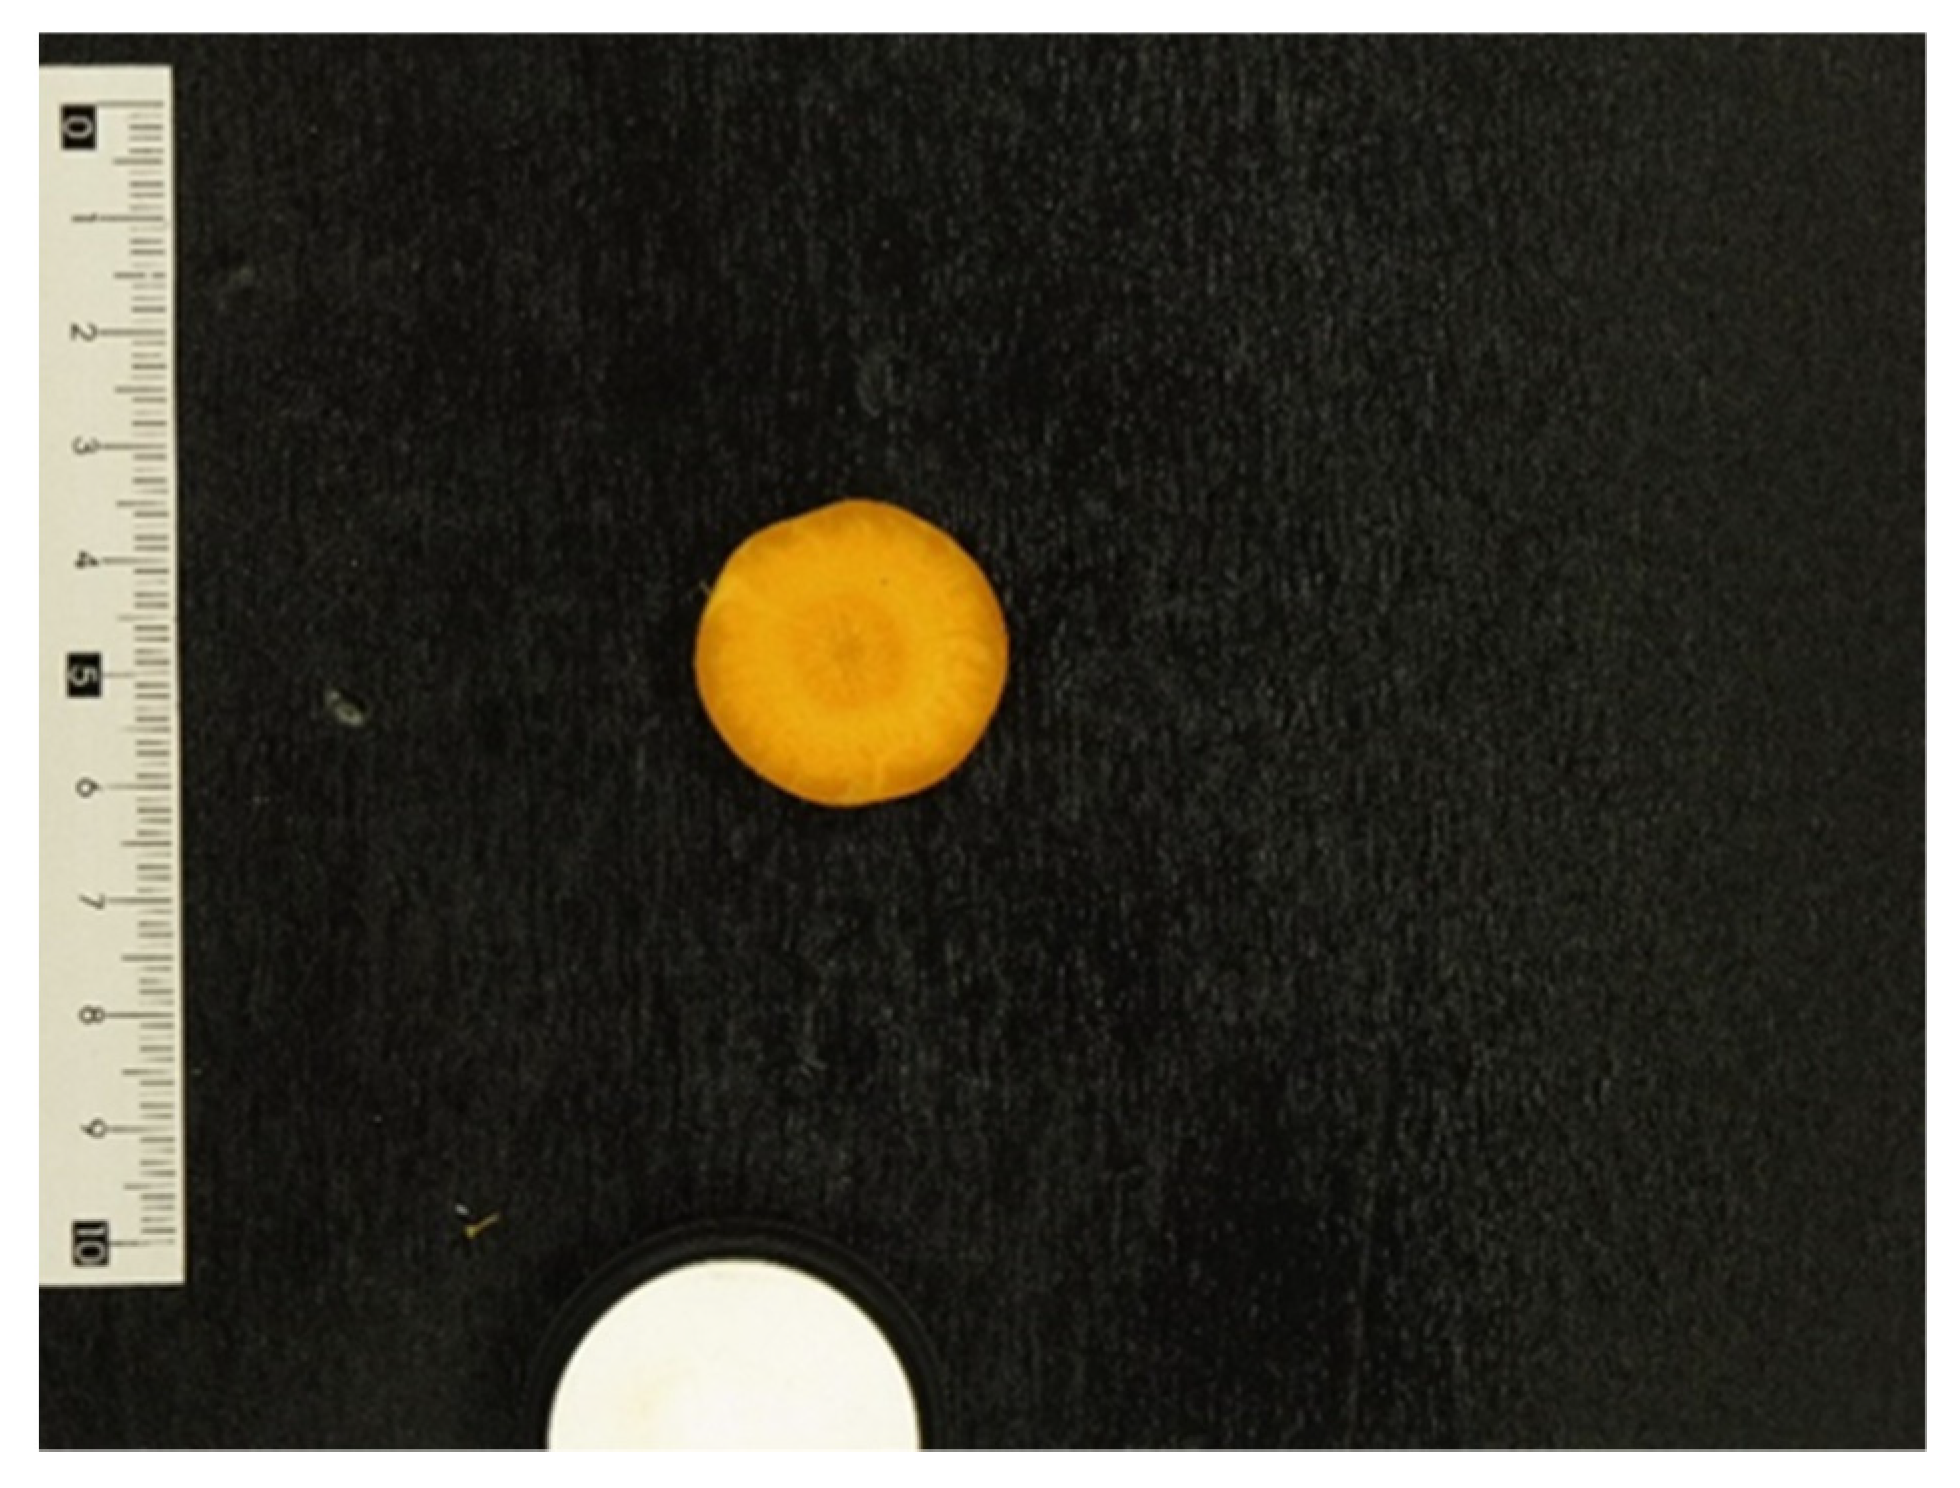
2.4.1. Image Acquisition
2.4.2. Image Analysis
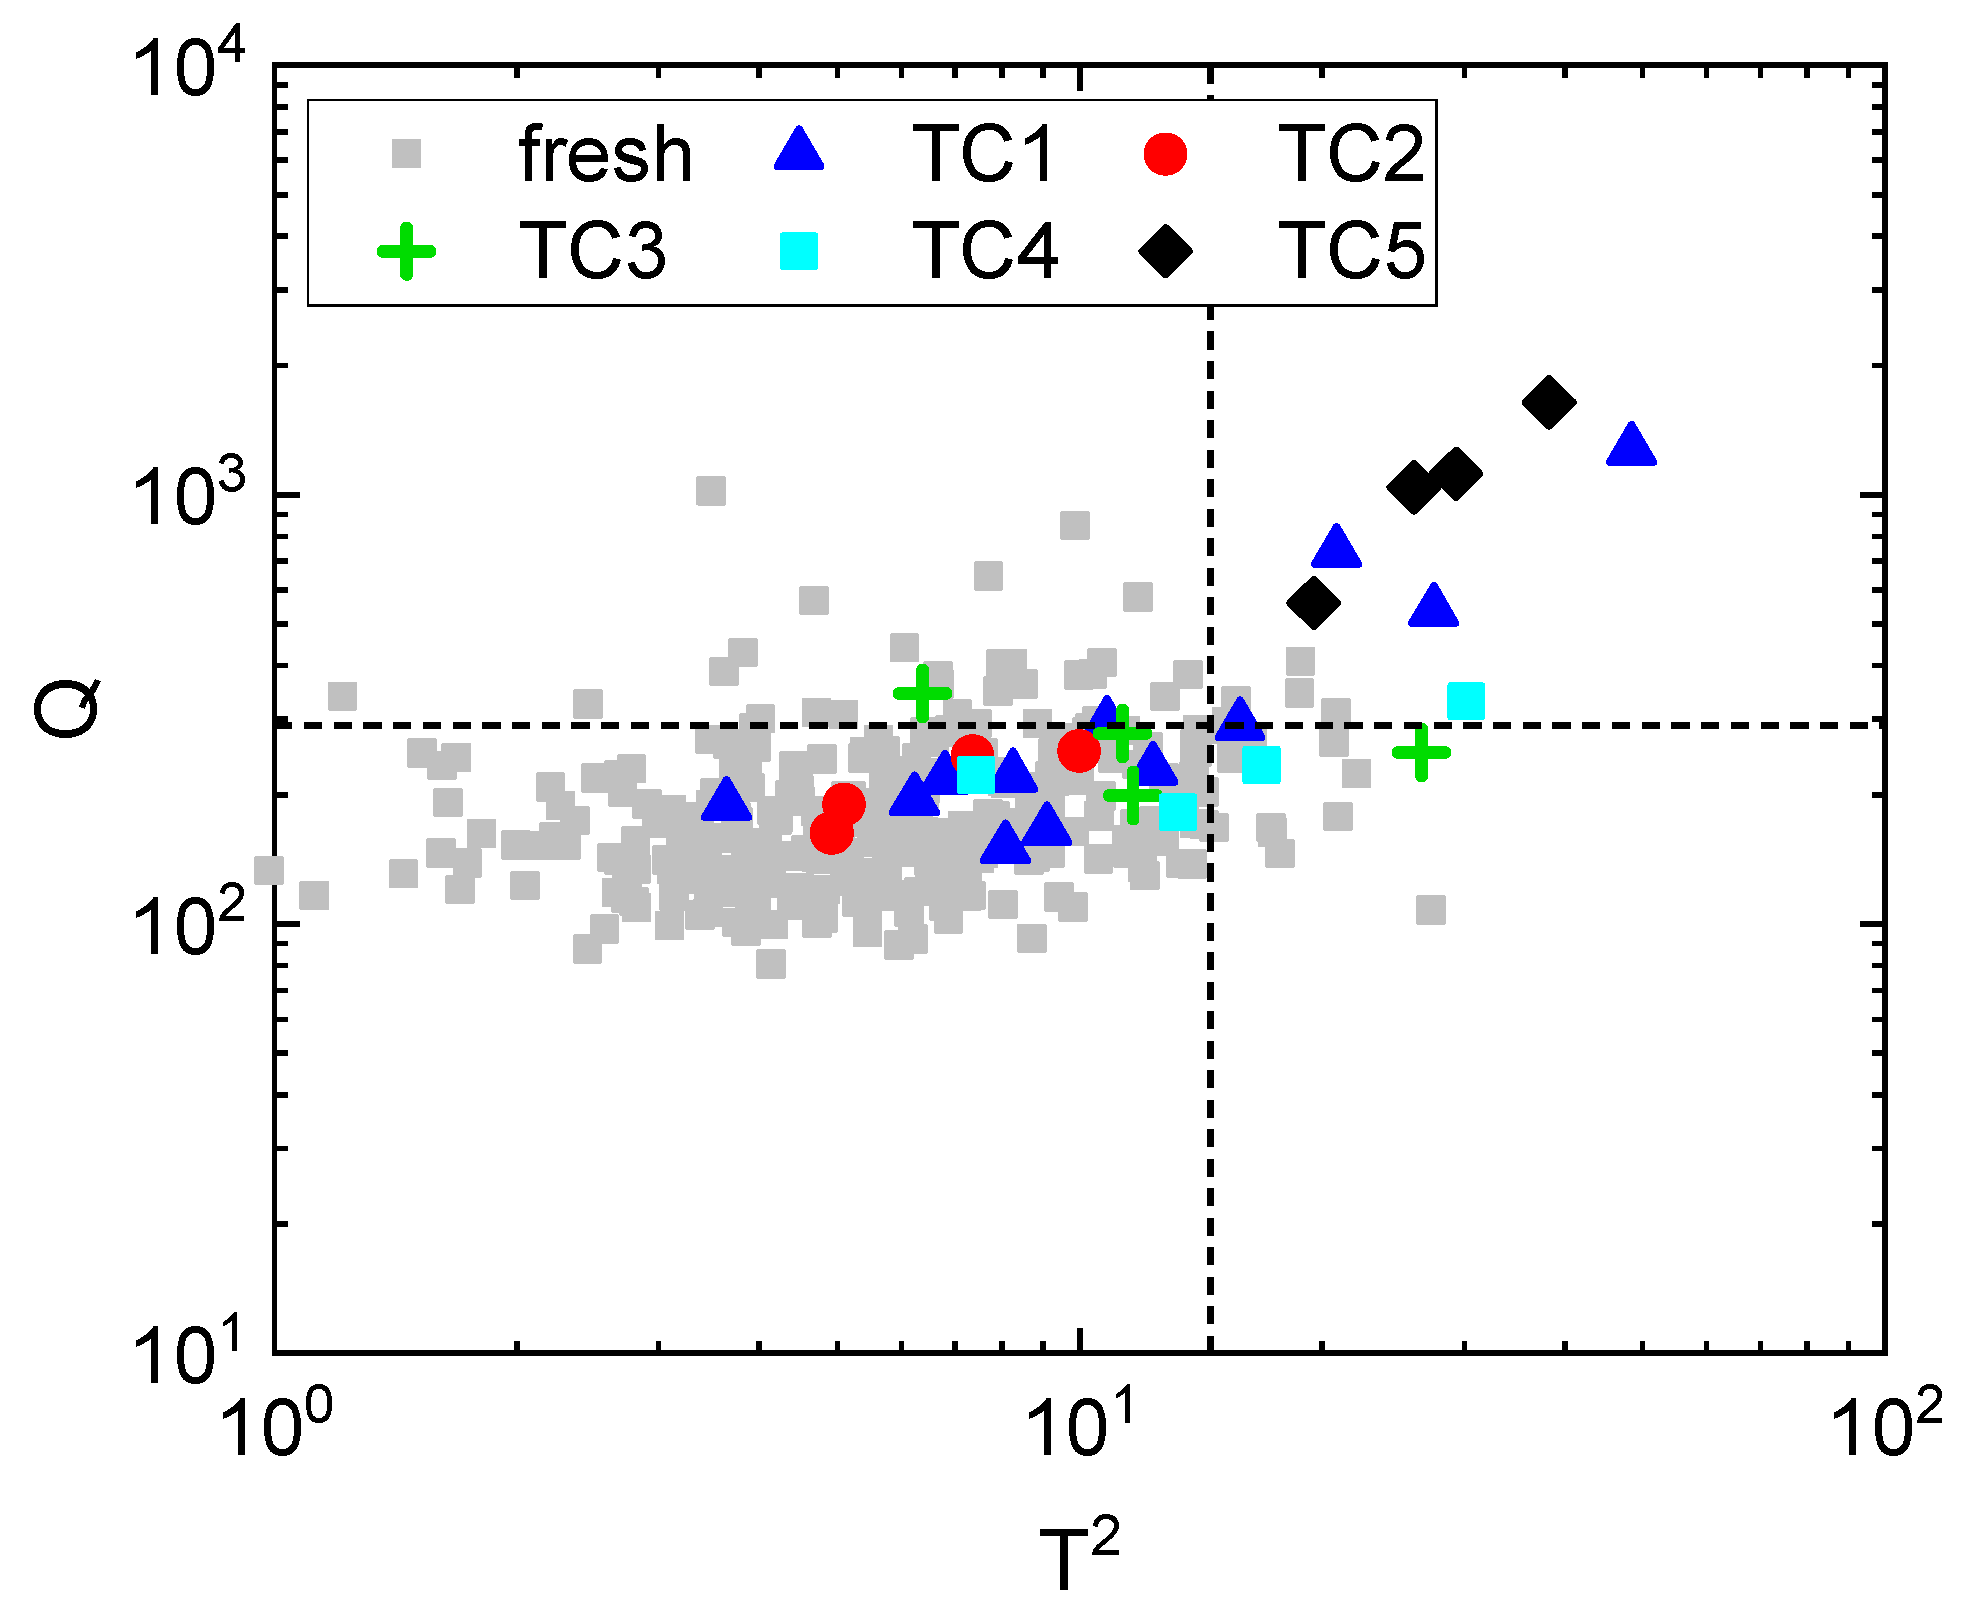
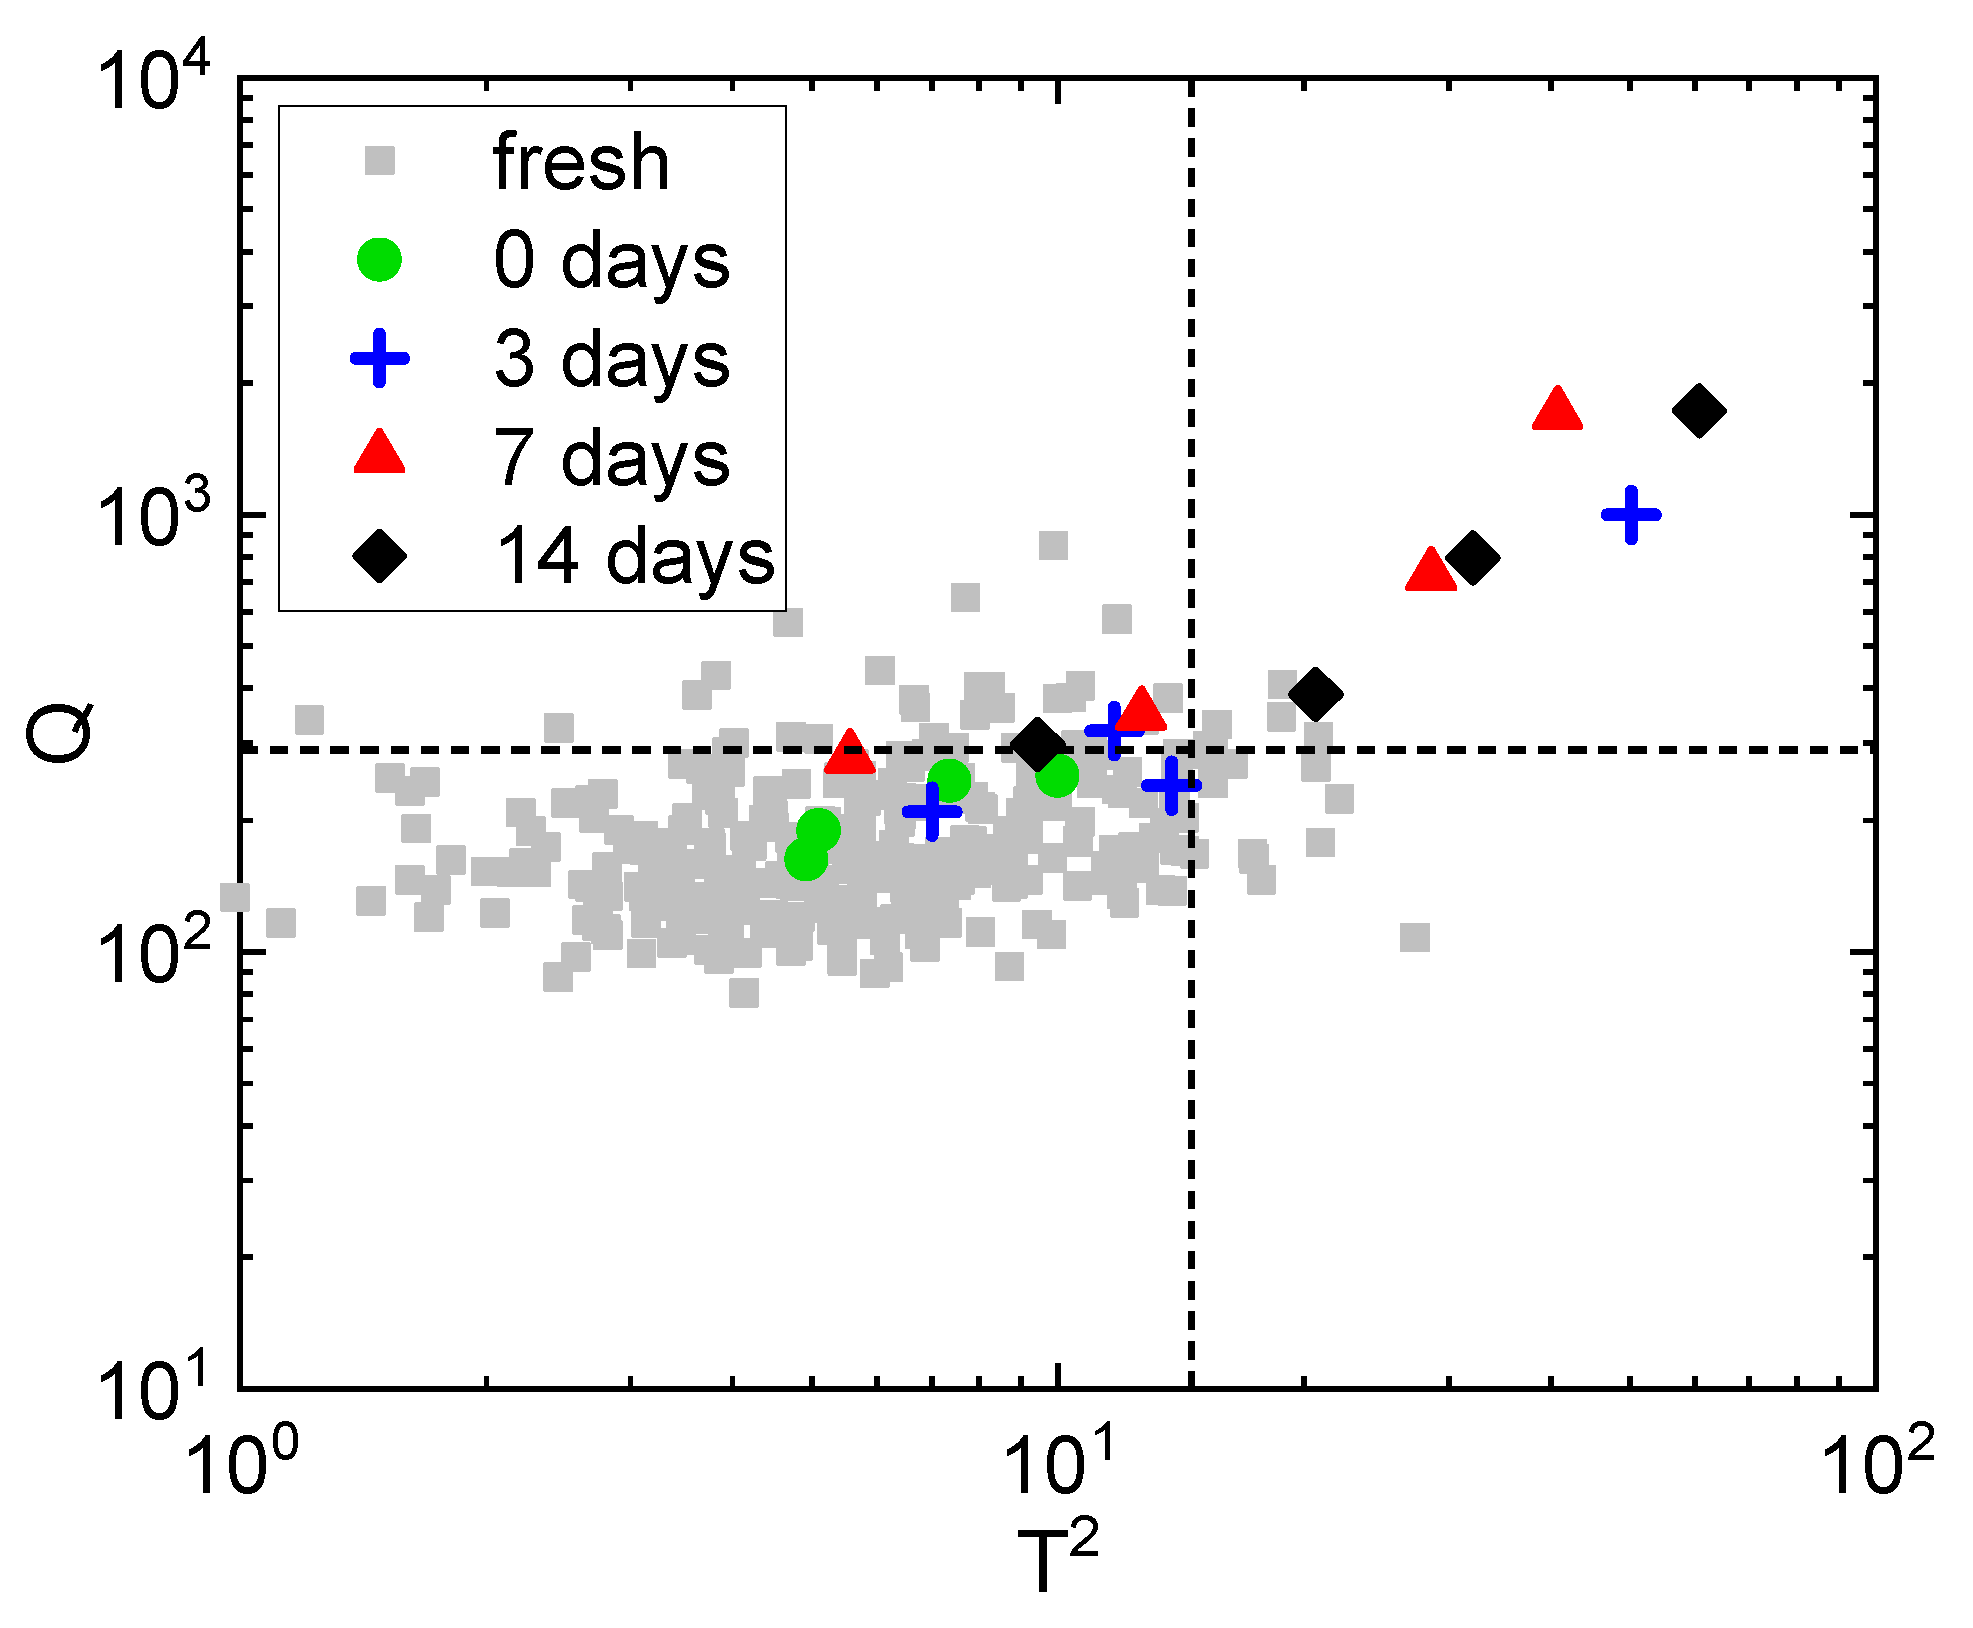
2.4.3. Multivariate Hypothesis Testing for Appearance Characterization
2.5. Microbiological Analyses
2.6. Statistical Tests of the Microbiological Analyses
3. Results and Discussion
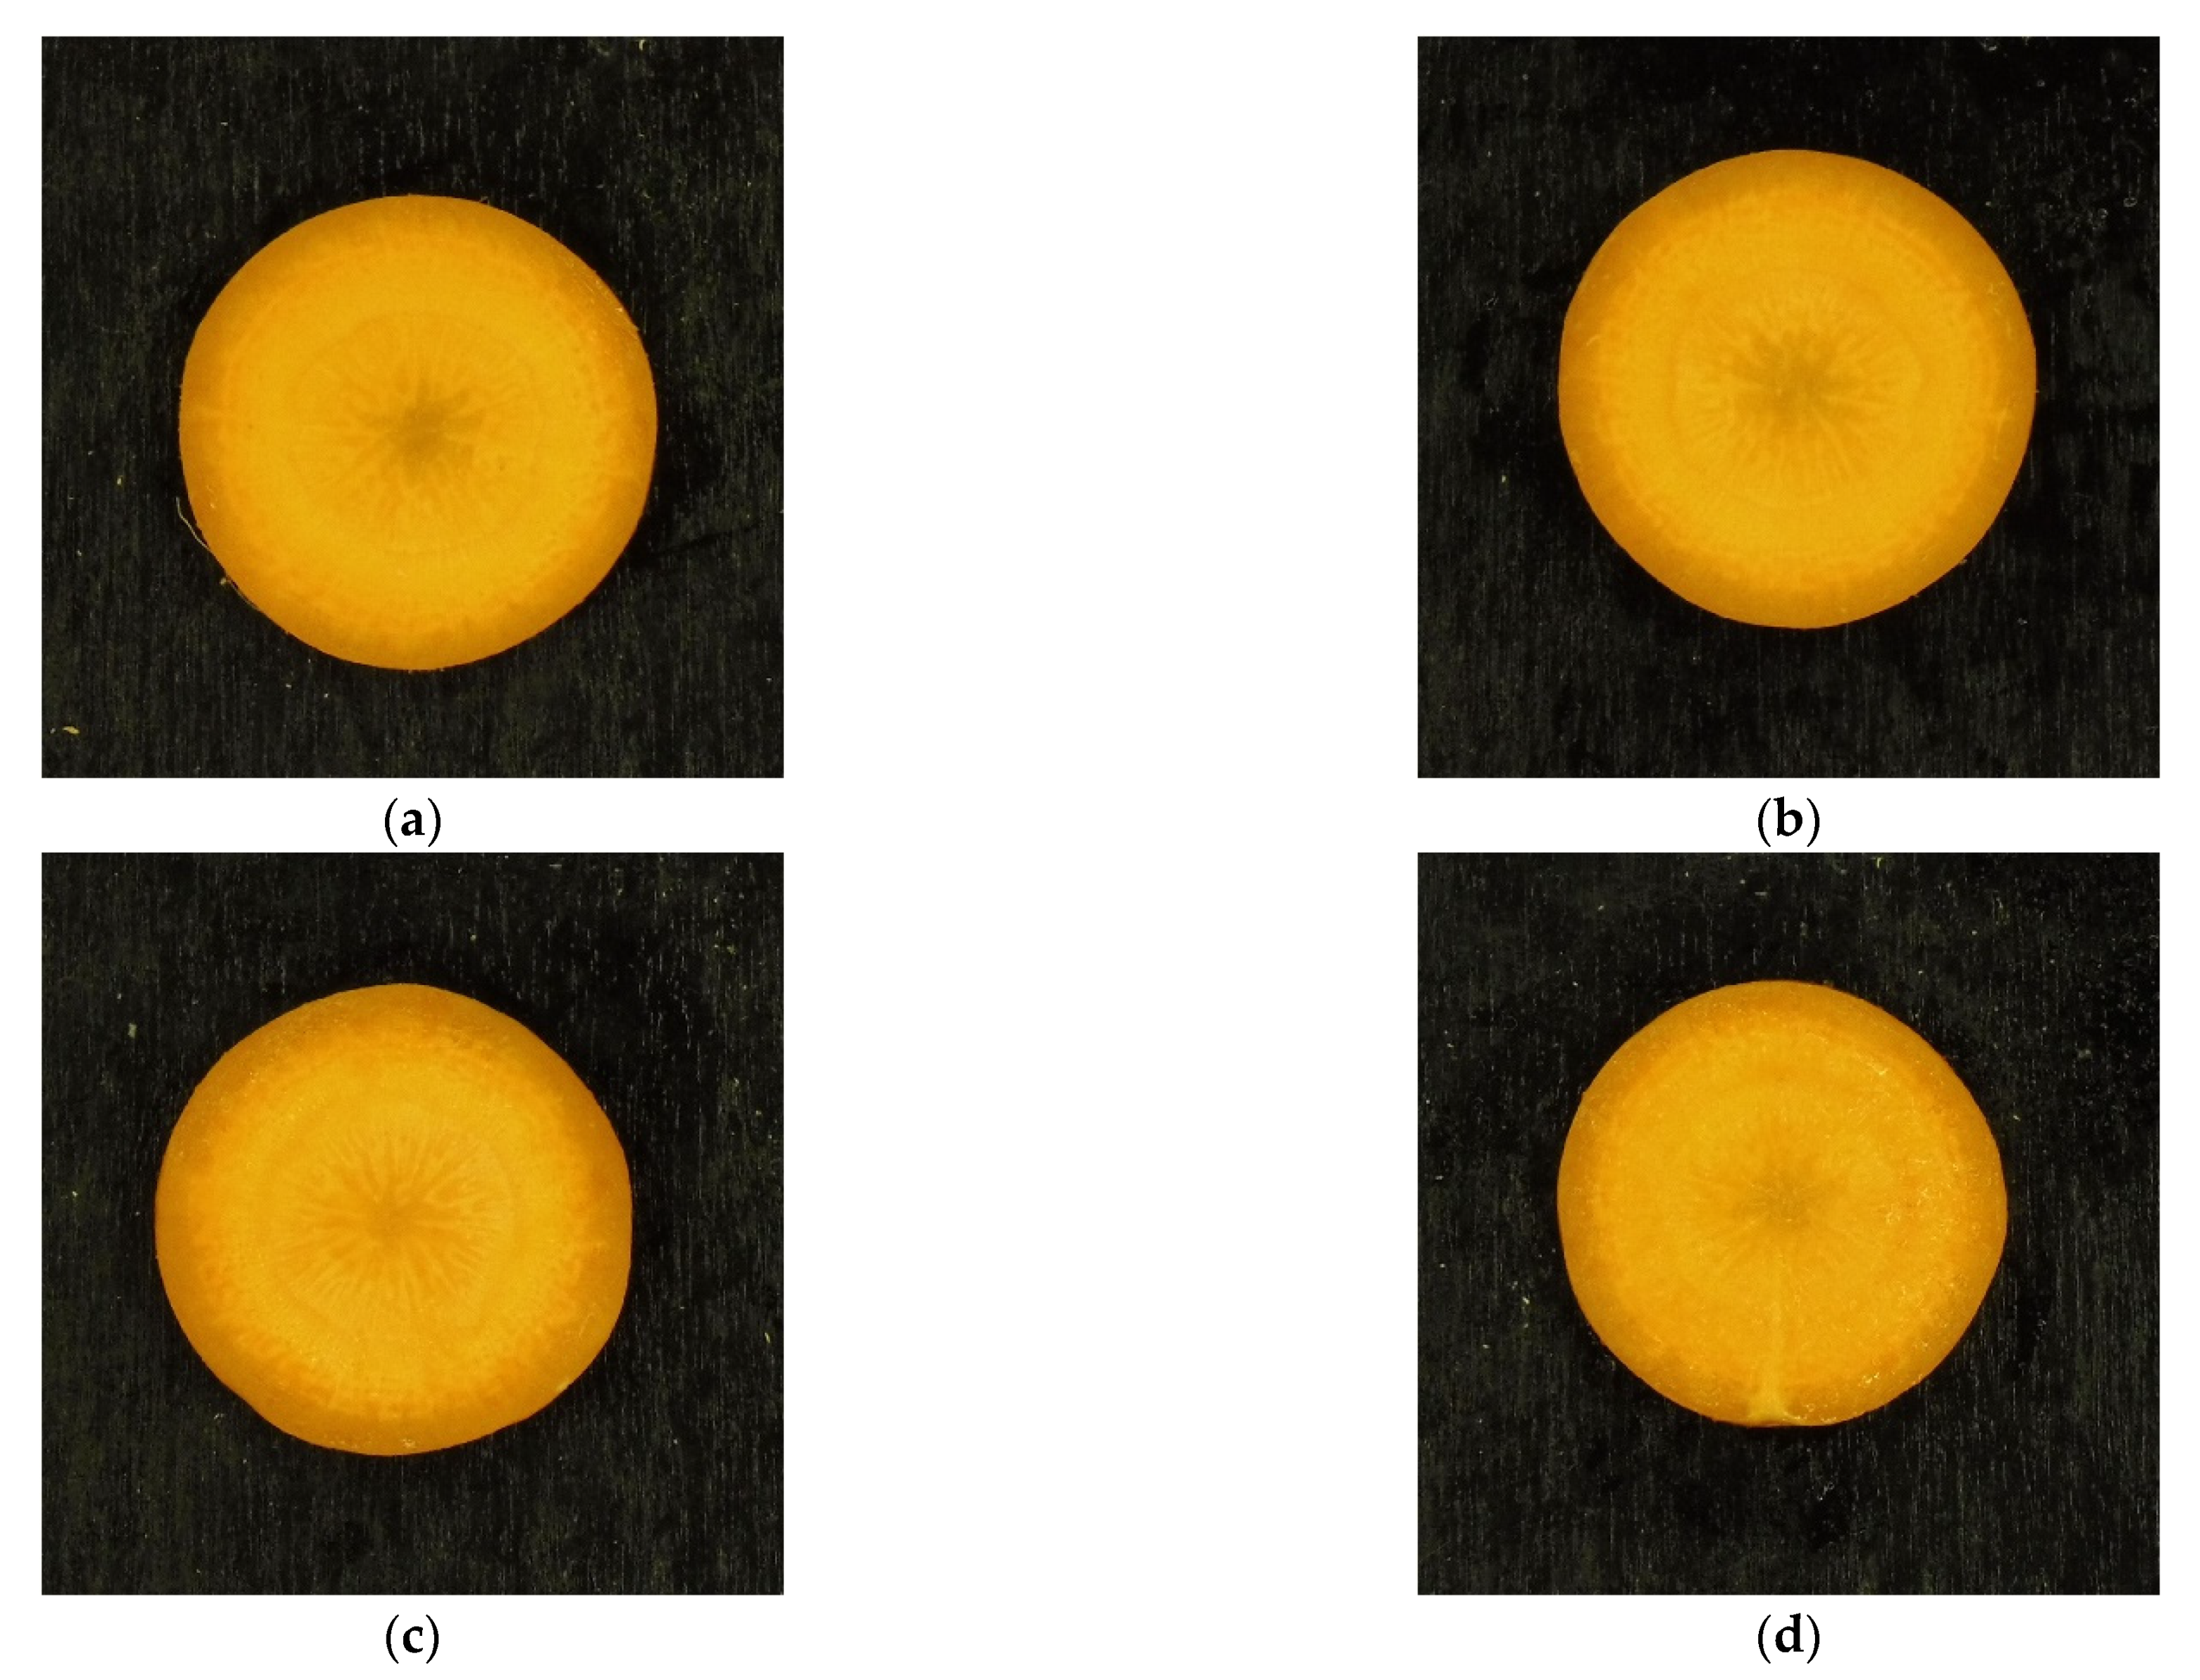
3.1. Identification of the Atmosphere Composition Preserving Fresh-like Product Appearance
3.2. Identification of the Processing Condition Preserving the Fresh-like Product Appearance
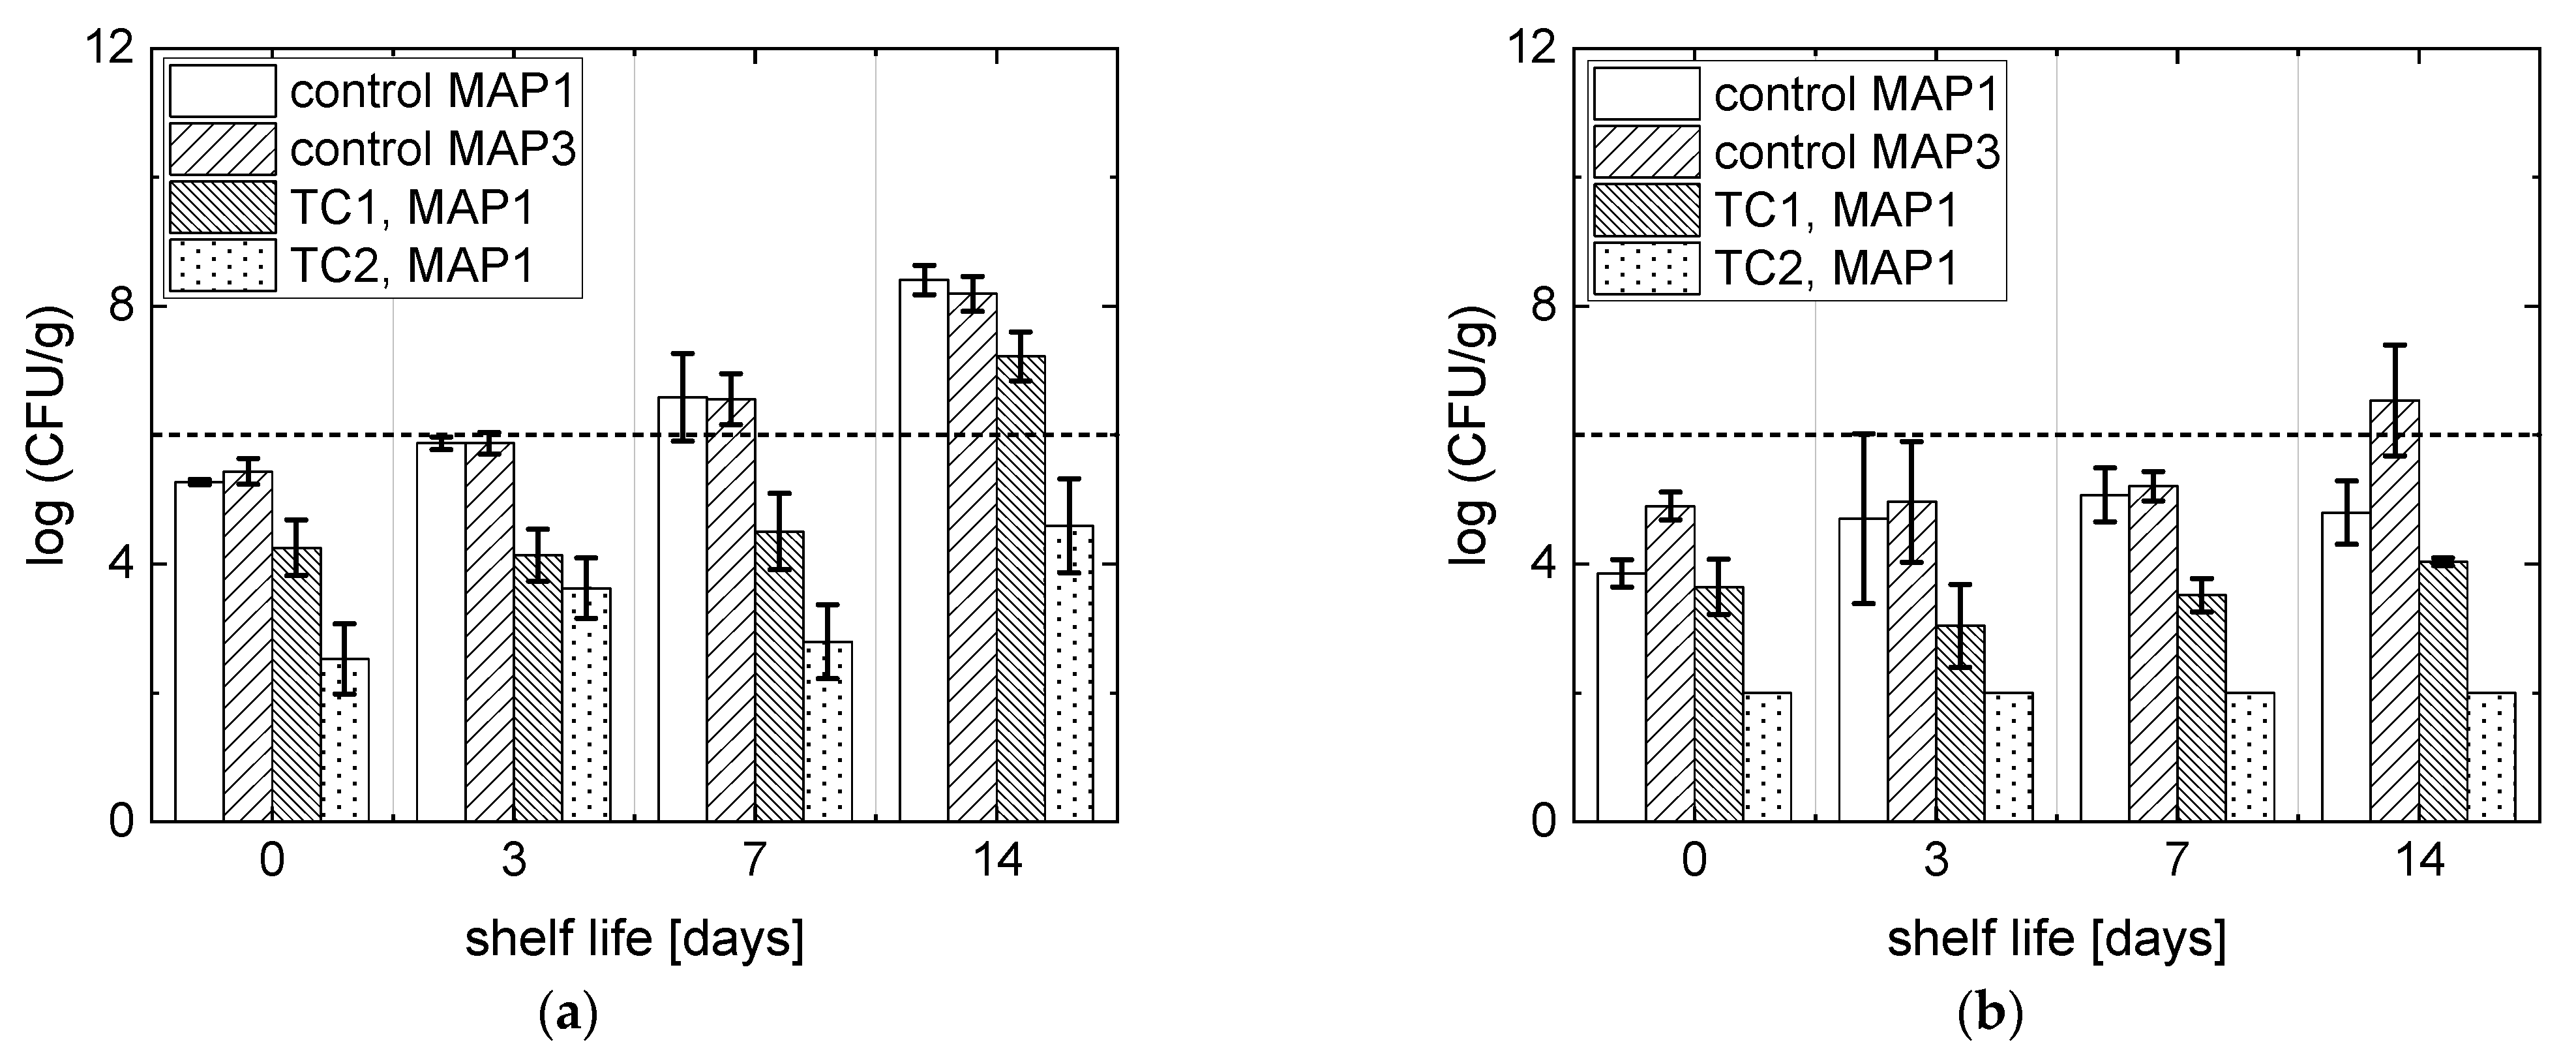
3.3. Microbial Analyses
4. Conclusions
Supplementary Materials
Author Contributions
Funding
Institutional Review Board Statement
Informed Consent Statement
Data Availability Statement
Acknowledgments
Conflicts of Interest
Appendix A. Artificial Vision System Details
Appendix B. Principal Components Analysis
References
- Davis, W.; Lucier, G. Vegetable and Pulses Outlook: April 2021; USDA: Washington, DC, USA, 2021. [Google Scholar]
- Müller, L.; Kjelsø, C.; Frank, C.; Jensen, T.; Torpdahl, M.; Soborg, B.; Dorleans, F.; Rabsch, W.; Prager, R.; Gossner, C.M.; et al. Outbreak of Salmonella Strathcona caused by datterino tomatoes, Denmark, 2011. Epidemiol. Infect. 2016, 144, 2802–2811. [Google Scholar] [CrossRef] [PubMed]
- Vestrheim, D.F.; Lange, H.; Nygard, K.; Borgen, K.; Wester, A.L.; Kvarme, M.L.; Vold, L. Are ready-to-eat salads ready to eat? An outbreak of Salmonella Coeln linked to imported, mixed, pre-washed and bagged salad, Norway, November 2013. Epidemiol. Infect. 2016, 144, 1756–1760. [Google Scholar] [CrossRef] [Green Version]
- Tejedor-Calvo, E.; Morales, D.; García-Barreda, S.; Sánchez, S.; Venturini, M.E.; Blanco, D.; Soler-Rivas, C.; Marco, P. Effects of gamma irradiation on the shelf-life and bioactive compounds of Tuber aestivum truffles packaged in passive modified atmosphere. Int. J. Food Microbiol. 2020, 332, 108774. [Google Scholar] [CrossRef] [PubMed]
- Li, L.; Li, C.; Sun, J.; Xin, M.; Yi, P.; He, X.; Sheng, J.; Zhou, Z.; Ling, D.; Zheng, F.; et al. Synergistic effects of ultraviolet light irradiation and high-oxygen modified atmosphere packaging on physiological quality, microbial growth and lignification metabolism of fresh-cut carrots. Postharvest Biol. Technol. 2021, 173, 111365. [Google Scholar] [CrossRef]
- Pinto, L.; Palma, A.; Cefola, M.; Pace, B.; D’Aquino, S.; Carboni, C.; Baruzzi, F. Effect of modified atmosphere packaging (MAP) and gaseous ozone pre-packaging treatment on the physico-chemical, microbiological and sensory quality of small berry fruit. Food Packag. Shelf Life 2020, 26, 100573. [Google Scholar] [CrossRef]
- Huang, Y.C.; Yang, Y.H.; Sridhar, K.; Tsai, P.J. Synergies of modified atmosphere packaging and high-voltage electrostatic field to extend the shelf-life of fresh-cut cabbage and baby corn. Lwt 2021, 138, 110559. [Google Scholar] [CrossRef]
- Zhou, B.; Zhang, L.; Wang, X.; Dong, P.; Hu, X.; Zhang, Y. Inactivation of Escherichia coli O157:H7 by high hydrostatic pressure combined with gas packaging. Microorganisms 2019, 7, 154. [Google Scholar] [CrossRef] [Green Version]
- Spilimbergo, S.; Zambon, A.; Michelino, F.; Polato, S. Method for Food Pasteurization. U.S. Patent Application 16/642,401, 25 June 2020. [Google Scholar]
- Bi, X.; Wu, J.; Zhang, Y.; Xu, Z.; Liao, X. High pressure carbon dioxide treatment for fresh-cut carrot slices. Innov. Food Sci. Emerg. Technol. 2011, 12, 298–304. [Google Scholar] [CrossRef]
- Spilimbergo, S.; Komes, D.; Vojvodic, A.; Levaj, B.; Ferrentino, G. High pressure carbon dioxide pasteurization of fresh-cut carrot. J. Supercrit. Fluids 2013, 79, 92–100. [Google Scholar] [CrossRef]
- Oey, I.; Lille, M.; Van Loey, A.; Hendrickx, M. Effect of high-pressure processing on colour, texture and flavour of fruit- and vegetable-based food products: A review. Trends Food Sci. Technol. 2008, 19, 320–328. [Google Scholar] [CrossRef]
- Zudaire, L.; Lafarga, T.; Viñas, I.; Abadias, M.; Brunton, N.; Aguiló-Aguayo, I. Effect of Ultrasound Pre-Treatment on the Physical, Microbiological, and Antioxidant Properties of Calçots. Food Bioprocess Technol. 2019, 12, 387–394. [Google Scholar] [CrossRef] [Green Version]
- Zhou, L.; Bi, X.; Xu, Z.; Yang, Y.; Liao, X. Effects of High-Pressure CO2 Processing on Flavor, Texture, and Color of Foods. Crit. Rev. Food Sci. Nutr. 2015, 55, 750–768. [Google Scholar] [CrossRef] [PubMed]
- Ferrentino, G.; Balzan, S.; Spilimbergo, S. On-line color monitoring of solid foods during supercritical CO2 pasteurization. J. Food Eng. 2012, 110, 80–85. [Google Scholar] [CrossRef]
- Rico, D.; Martín-Diana, A.B.; Barat, J.M.; Barry-Ryan, C. Extending and measuring the quality of fresh-cut fruit and vegetables: A review. Trends Food Sci. Technol. 2007, 18, 373–386. [Google Scholar] [CrossRef] [Green Version]
- Yagiz, Y.; Balaban, M.O.; Kristinsson, H.G.; Welt, B.A.; Marshall, M.R. Comparison of Minolta colorimeter and machine vision system in measuring colour of irradiated Atlantic salmon. J. Sci. Food Agric. 2009, 89, 728–730. [Google Scholar] [CrossRef]
- Goñi, S.M.; Salvadori, V.O. Color measurement: Comparison of colorimeter vs. computer vision system. J. Food Meas. Charact. 2017, 11, 538–547. [Google Scholar] [CrossRef]
- León, K.; Mery, D.; Pedreschi, F.; León, J. Color measurement in L*a*b* units from RGB digital images. Food Res. Int. 2006, 39, 1084–1091. [Google Scholar] [CrossRef]
- Pathare, P.B.; Opara, U.L.; Al-Said, F.A.J. Colour Measurement and Analysis in Fresh and Processed Foods: A Review. Food Bioprocess Technol. 2013, 6, 36–60. [Google Scholar] [CrossRef]
- Boschetti, L.; Ottavian, M.; Facco, P.; Barolo, M.; Serva, L.; Balzan, S.; Novelli, E. A correlative study on data from pork carcass and processed meat (Bauernspeck) for automatic estimation of chemical parameters by means of near-infrared spectroscopy. Meat Sci. 2013, 95, 621–628. [Google Scholar] [CrossRef]
- Ottavian, M.; Fasolato, L.; Serva, L.; Facco, P.; Barolo, M. Data Fusion for Food Authentication: Fresh/Frozen-Thawed Discrimination in West African Goatfish (Pseudupeneus prayensis) Fillets. Food Bioprocess Technol. 2014, 7, 1025–1036. [Google Scholar] [CrossRef]
- Cubero, S.; Aleixos, N.; Moltó, E.; Gómez-Sanchis, J.; Blasco, J. Advances in Machine Vision Applications for Automatic Inspection and Quality Evaluation of Fruits and Vegetables. Food Bioprocess Technol. 2011, 4, 487–504. [Google Scholar] [CrossRef]
- Momin, M.A.; Yamamoto, K.; Miyamoto, M.; Kondo, N.; Grift, T. Machine vision based soybean quality evaluation. Comput. Electron. Agric. 2017, 140, 452–460. [Google Scholar] [CrossRef]
- Nandi, C.S.; Tudu, B.; Koley, C. A machine vision technique for grading of harvested mangoes based on maturity and quality. IEEE Sens. J. 2016, 16, 6387–6396. [Google Scholar] [CrossRef]
- Kiani, S.; Minaei, S. Potential application of machine vision technology to saffron (Crocus sativus L.) quality characterization. Food Chem. 2016, 212, 392–394. [Google Scholar] [CrossRef]
- Cubero, S.; Lee, W.S.; Aleixos, N.; Albert, F.; Blasco, J. Automated Systems Based on Machine Vision for Inspecting Citrus Fruits from the Field to Postharvest—A Review. Food Bioprocess Technol. 2016, 9, 1623–1639. [Google Scholar] [CrossRef] [Green Version]
- Jackman, P.; Sun, D.W. Recent advances in image processing using image texture features for food quality assessment. Trends Food Sci. Technol. 2013, 29, 35–43. [Google Scholar] [CrossRef]
- Liu, J.J.; MacGregor, J.F.; Duchesne, C.; Bartolacci, G. Flotation froth monitoring using multiresolutional multivariate image analysis. Miner. Eng. 2005, 18, 65–76. [Google Scholar] [CrossRef]
- Montgomery, D.C. Design and Analysis of Experiments: Second Edition. Des. Anal. Exp. Second Ed. 2007, 1, 1–641. [Google Scholar]
- Yu, T.; Niu, L.; Iwahashi, H. High-Pressure Carbon Dioxide Used for Pasteurization in Food Industry. Food Eng. Rev. 2020, 12, 364–380. [Google Scholar] [CrossRef]
- Fleury, C.; Savoire, R.; Harscoat-Schiavo, C.; Hadj-Sassi, A.; Subra-Paternault, P. Optimization of supercritical CO2 process to pasteurize dietary supplement: Influencing factors and CO2 transfer approach. J. Supercrit. Fluids 2018, 141, 240–251. [Google Scholar] [CrossRef]
- Cappelletti, M.; Ferrentino, G.; Spilimbergo, S. Supercritical carbon dioxide combined with high power ultrasound: An effective method for the pasteurization of coconut water. J. Supercrit. Fluids 2014, 92, 257–263. [Google Scholar] [CrossRef]
- Garcia-Gonzalez, L.; Geeraerd, A.H.; Spilimbergo, S.; Elst, K.; Van Ginneken, L.; Debevere, J.; Van Impe, J.F.; Devlieghere, F. High pressure carbon dioxide inactivation of microorganisms in foods: The past, the present and the future. Int. J. Food Microbiol. 2007, 117, 1–28. [Google Scholar] [CrossRef]
- Russ, J.C. The Image Processing Handbook, 6th ed.; CRC Press: Boca Raton, FL, USA, 2011. [Google Scholar]
- Facco, P.; Santomaso, A.C.; Barolo, M. Artificial vision system for particle size characterization from bulk materials. Chem. Eng. Sci. 2017, 164, 246–257. [Google Scholar] [CrossRef]
- Hartigan, J.A.; Wong, M.A. Algorithm AS 136: A K-Means Clustering Algorithm. Appl. Stat. 1979, 28, 100. [Google Scholar] [CrossRef]
- Addison, P.S. The Illustrated Wavelet Transform Handbook, 2nd ed.; CRC Press: Boca Raton, FL, USA, 2016; ISBN 9781315372556. [Google Scholar]
- Bharati, M.H.; Liu, J.J.; MacGregor, J.F. Image texture analysis: Methods and comparisons. Chemom. Intell. Lab. Syst. 2004, 72, 57–71. [Google Scholar] [CrossRef]
- Haralick, R.M.; Dinstein, I.; Shanmugam, K. Textural Features for Image Classification. IEEE Trans. Syst. Man Cybern. 1973, SMC-3, 610–621. [Google Scholar] [CrossRef] [Green Version]
- Tessier, J.; Duchesne, C.; Gauthier, C.; Dufour, G. Estimation of alumina content of anode cover materials using multivariate image analysis techniques. Chem. Eng. Sci. 2008, 63, 1370–1380. [Google Scholar] [CrossRef]
- Wold, S.; Esbensen, K.; Geladi, P. Principal component analysis. Chemom. Intell. Lab. Syst. 1987, 2, 37–52. [Google Scholar] [CrossRef]
- González-Alonso, V.; Cappelletti, M.; Bertolini, F.M.; Lomolino, G.; Zambon, A.; Spilimbergo, S. Research Note: Microbial inactivation of raw chicken meat by supercritical carbon dioxide treatment alone and in combination with fresh culinary herbs. Poult. Sci. 2020, 99, 536–545. [Google Scholar] [CrossRef]
- Zhou, Z.; Zuber, S.; Cantergiani, F.; Sampers, I.; Devlieghere, F.; Uyttendaele, M. Inactivation of Foodborne Pathogens and Their Surrogates on Fresh and Frozen Strawberries Using Gaseous Ozone. Front. Sustain. Food Syst. 2018, 2, 1–9. [Google Scholar] [CrossRef] [Green Version]
- Alasalvar, C.; Al-Farsi, M.; Quantick, P.C.; Shahidi, F.; Wiktorowicz, R. Effect of chill storage and modified atmosphere packaging (MAP) on antioxidant activity, anthocyanins, carotenoids, phenolics and sensory quality of ready-to-eat shredded orange and purple carrots. Food Chem. 2005, 89, 69–76. [Google Scholar] [CrossRef]
- Esturk, O.; Ayhan, Z.; Gokkurt, T. Minimal Processing and Modified Atmosphere Packaging of Carrot Discs: Effects of Packaging Film and Product Weight. Int. J. Food Process. Technol. 2015, 2, 31–38. [Google Scholar] [CrossRef]
- Chen, C.; Hu, W.; Zhang, R.; Jiang, A.; Liu, C. Effects of hydrogen sulfide on the surface whitening and physiological responses of fresh-cut carrots. J. Sci. Food Agric. 2018, 98, 4726–4732. [Google Scholar] [CrossRef] [PubMed]
- Ayhan, Z.; Eştürk, O.; Taş, E. Effect of modified atmosphere packaging on the quality and shelf life of minimally processed carrots. Turk. J. Agric. For. 2008, 32, 57–64. [Google Scholar] [CrossRef]
- Zambon, A.; Michelino, F.; Bourdoux, S.; Devlieghere, F.; Sut, S.; Dall’Acqua, S.; Rajkovic, A.; Spilimbergo, S. Microbial inactivation efficiency of supercritical CO2 drying process. Dry. Technol. 2018, 36, 2016–2021. [Google Scholar] [CrossRef] [Green Version]
- Ferrentino, G.; Spilimbergo, S. High pressure carbon dioxide pasteurization of solid foods: Current knowledge and future outlooks. Trends Food Sci. Technol. 2011, 22, 427–441. [Google Scholar] [CrossRef]
- Facco, P.; Tomba, E.; Roso, M.; Modesti, M.; Bezzo, F.; Barolo, M. Automatic characterization of nanofiber assemblies by image texture analysis. Chemom. Intell. Lab. Syst. 2010, 103, 66–75. [Google Scholar] [CrossRef]


| Name | Temperature (°C) | Pressure (MPa) | Treatment Time (min) |
|---|---|---|---|
| TC1 | 32.5 | 9 | 30 |
| TC2 | 40 | 6 | 15 |
| TC3 | 25 | 6 | 45 |
| TC4 | 25 | 12 | 15 |
| TC5 | 40 | 12 | 45 |
Publisher’s Note: MDPI stays neutral with regard to jurisdictional claims in published maps and institutional affiliations. |
© 2021 by the authors. Licensee MDPI, Basel, Switzerland. This article is an open access article distributed under the terms and conditions of the Creative Commons Attribution (CC BY) license (https://creativecommons.org/licenses/by/4.0/).
Share and Cite
Barberi, G.; González-Alonso, V.; Spilimbergo, S.; Barolo, M.; Zambon, A.; Facco, P. Optimization of the Appearance Quality in CO2 Processed Ready-to-Eat Carrots through Image Analysis. Foods 2021, 10, 2999. https://doi.org/10.3390/foods10122999
Barberi G, González-Alonso V, Spilimbergo S, Barolo M, Zambon A, Facco P. Optimization of the Appearance Quality in CO2 Processed Ready-to-Eat Carrots through Image Analysis. Foods. 2021; 10(12):2999. https://doi.org/10.3390/foods10122999
Chicago/Turabian StyleBarberi, Gianmarco, Víctor González-Alonso, Sara Spilimbergo, Massimiliano Barolo, Alessandro Zambon, and Pierantonio Facco. 2021. "Optimization of the Appearance Quality in CO2 Processed Ready-to-Eat Carrots through Image Analysis" Foods 10, no. 12: 2999. https://doi.org/10.3390/foods10122999
APA StyleBarberi, G., González-Alonso, V., Spilimbergo, S., Barolo, M., Zambon, A., & Facco, P. (2021). Optimization of the Appearance Quality in CO2 Processed Ready-to-Eat Carrots through Image Analysis. Foods, 10(12), 2999. https://doi.org/10.3390/foods10122999