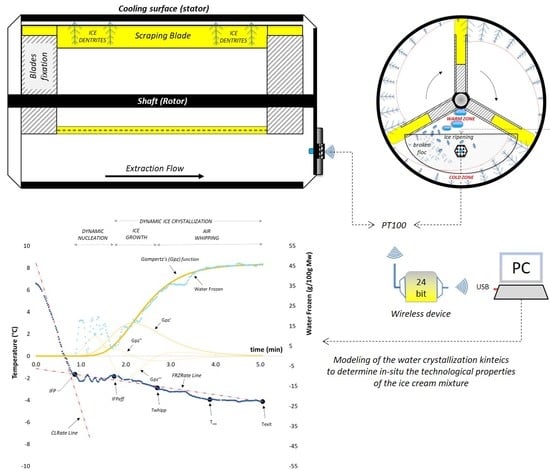
A Mathematical Modeling of Freezing Process in the Batch Production of Ice Cream
Abstract
1. Introduction
2. Materials and Methods
- -
- preparation of mixtures characterized by different total solid contents and different level of complexity (water-based model systems, milk-based model systems and real ice cream mixtures);
- -
- partial freezing of the starting mixtures inside a batch SSHE;
- -
- phenomenological analysis of the behavior of model systems and ice cream mixtures in order to explore the effects on the solute-solvent interactions on the main freezing events registered along the experimental cooling curve (it was necessary to simplify the mathematical description of the water crystallization kinetics occurring under the SSHE conditions);
- -
- numerical analysis of the cooling curves (temperature calibration and mathematical modeling of the water crystallization kinetics;
- -
- statistical analysis to select the most significant kinetic properties able to classify the ice creams according to quality characteristics such as overrun and melting and sensory properties;
- -
- development and validation of statistical models able to predict the melting and sensory attributes of the final ice cream.
2.1. Sugar-Based Model Systems
2.2. Ice Cream Mixtures
2.3. Aging Operation
2.4. Freezing and Tempering Operation
2.5. Calculation of the Theoretical Freezing Point
2.6. Ice Cream Analysis
2.6.1. Overrun
2.6.2. Melting Test
2.6.3. Sensory Evaluation of Ice Cream
2.6.4. Data Preprocessing and Statistical Analysis
3. Results and Discussion
3.1. Cooling Curves for Water-Based Model Systems
3.2. Cooling Curves for Milk-Based Model Systems
3.3. Cooling Curve for the Ice Cream Mixtures
3.4. Solute-Solvent Interactions
3.5. Modeling of Crystallization Kinetics for Ice Cream Mixtures
3.6. Modeling of Ice Cream Melting Kinetics
3.7. Liking Degree and Sensory Profile Intensity
3.8. Relationships between Technological Quality of the Ice Cream Mixture and Ice Cream Quality
4. Conclusions
Author Contributions
Funding
Institutional Review Board Statement
Informed Consent Statement
Data Availability Statement
Conflicts of Interest
Abbreviations
| CLrate, Chilling Rate | the Newtonian cooling rate, that is, the rate at which the solution experiences a decrease in temperature without ice nucleation and growth. |
| [DEXTR] | the initial concentration (% by weight) of the dextrose in the ICM. |
| [HYD] | the initial concentration (% by weight) of all hydrocolloids in the ICM (i.e., maltodextrin, inulin, sucrose esters, carrageenan, Tara seed flour and carboxymethylcellulose arising from the multicomponent basis used in the formulation of the ice cream mixtures). |
| [FAT] | the initial concentration of fat in the ICM. |
| FP, Freezing Point (°C) | the equilibrium freezing temperature experienced by the WBMS, at which the ice crystal starts to growth with a steady-state kinetics (i.e., without changes in temperature): it was determined as the highest temperature after the unique supercooling event as registered by the lowest experimental temperature. |
| FPD, Freezing Point Depression (°C) | the fall of the equilibrium freezing temperature below 0 °C due to the presence of colligative solutes. |
| FPt, Theoretical Freezing Point | the theoretical equilibrium freezing temperature that the WBMS can virtually experience on cooling if they would behave as a pure sucrose solution having an equivalent concentration of sucrose. |
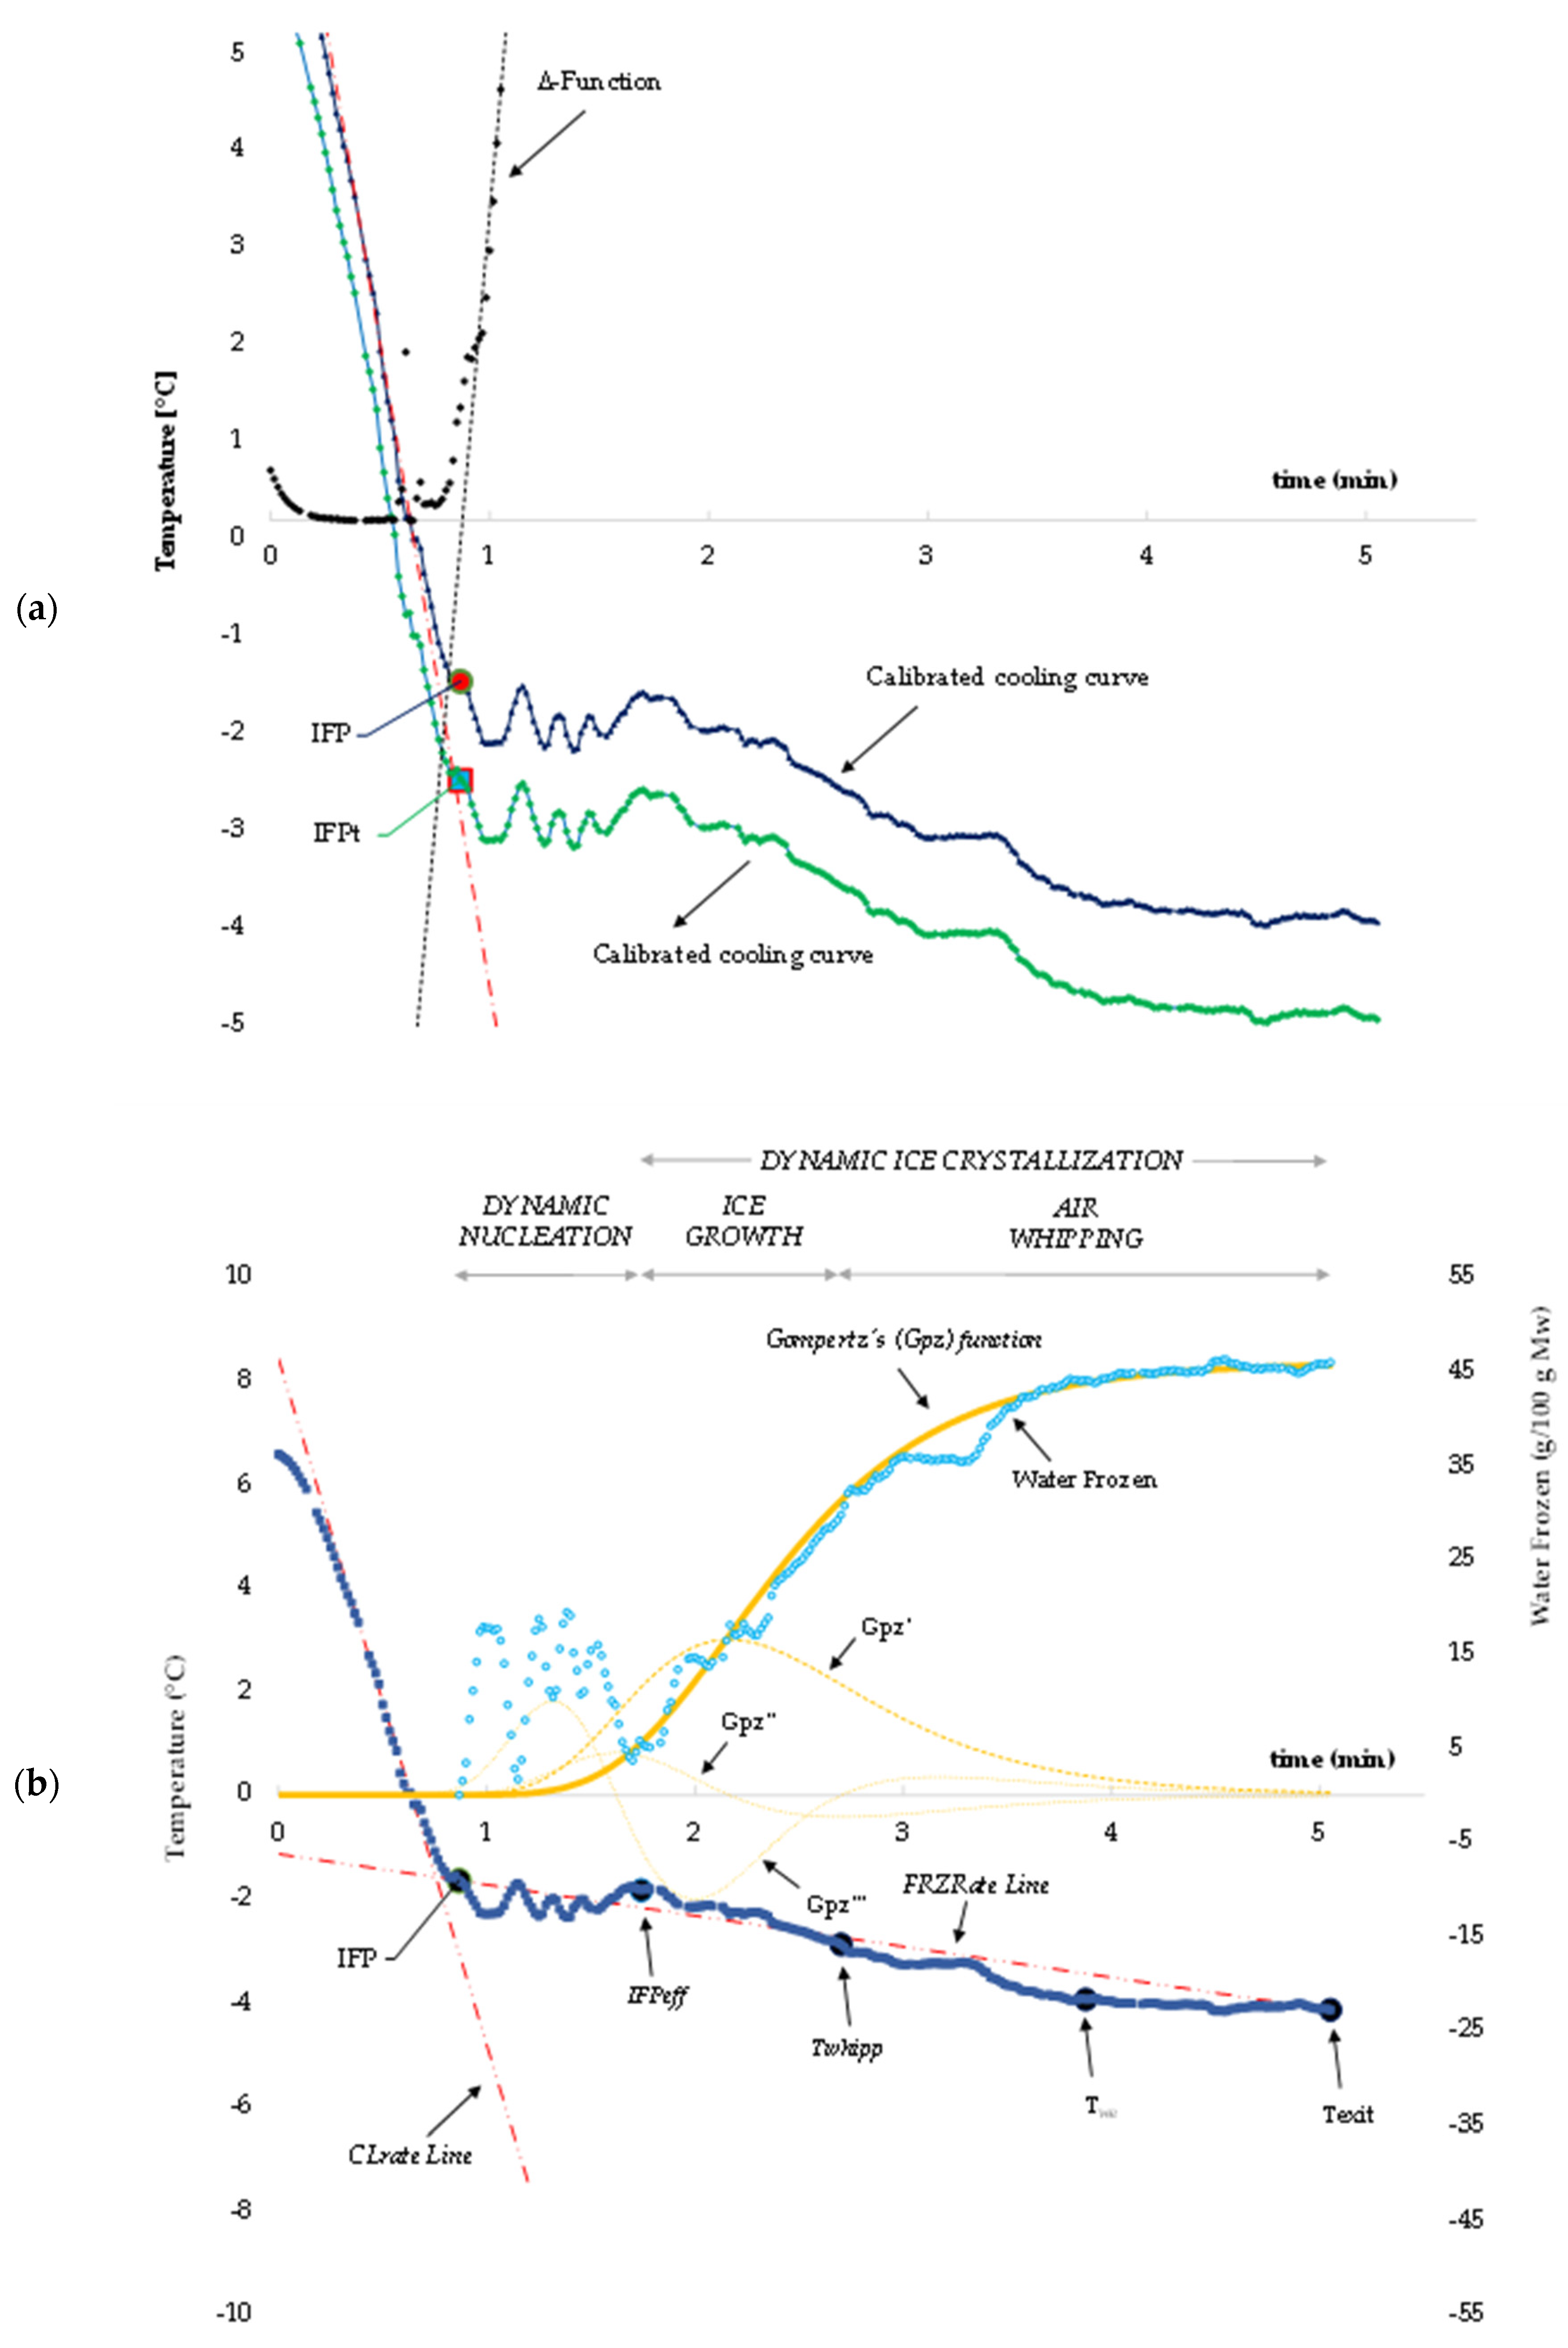
| the maximum rate (1/min) of the water crystallization (or equivalently, the maximum Growth Rate of the ice crystals) that takes place during batch ice cream production. | |
| Gpz’ | first derivative function of the re-parameterized Gompertz’s model. |
| Gpz,” | second derivative function of the re-parameterized Gompertz’s model. |
| Gpz’’’ | third derivative function of the re-parameterized Gompertz’s model. |
| GRtime | the freezing time corresponding to GRmax. |
| GRT | the freezing temperature corresponding to GRmax. |
| HNT, Heterogeneous Nucleation Time | the time length (min) required to form stable ice nuclei through one (as experienced by the WBMS) or more than one (as experienced by the MBMS and ICM) supercooling events before to reach respectively FP or IFP. |
| HSC, High Sugar Content | ice cream mixture prepared with the highest content of the colligative sugars. |
| ICM | Ice Cream Mixture. |
| IFP, Initial Freezing Point (°C) | the first equilibrium freezing temperature experienced during cooling by the investigated MBMS and ICM (it was determined as the highest temperature after the first supercooling event as registered on the experimental cooling curve). |
| IFPeff, Effective Initial Freezing Point (°C) | the equilibrium freezing temperature at which the water crystallization kinetics is at its acceleration point, after the heterogeneous nucleation step and where the ice starts to accumulate significantly and extensively in the ICM (it was estimated by using the re-parameterized Gompertz’ model). |
| IFPt, Theoretical Freezing Point | the theorical equilibrium freezing temperature that the investigated MBMS and ICM can experience virtually if they would behave on cooling as a pure sucrose solution having an equivalent concentration of sucrose. |
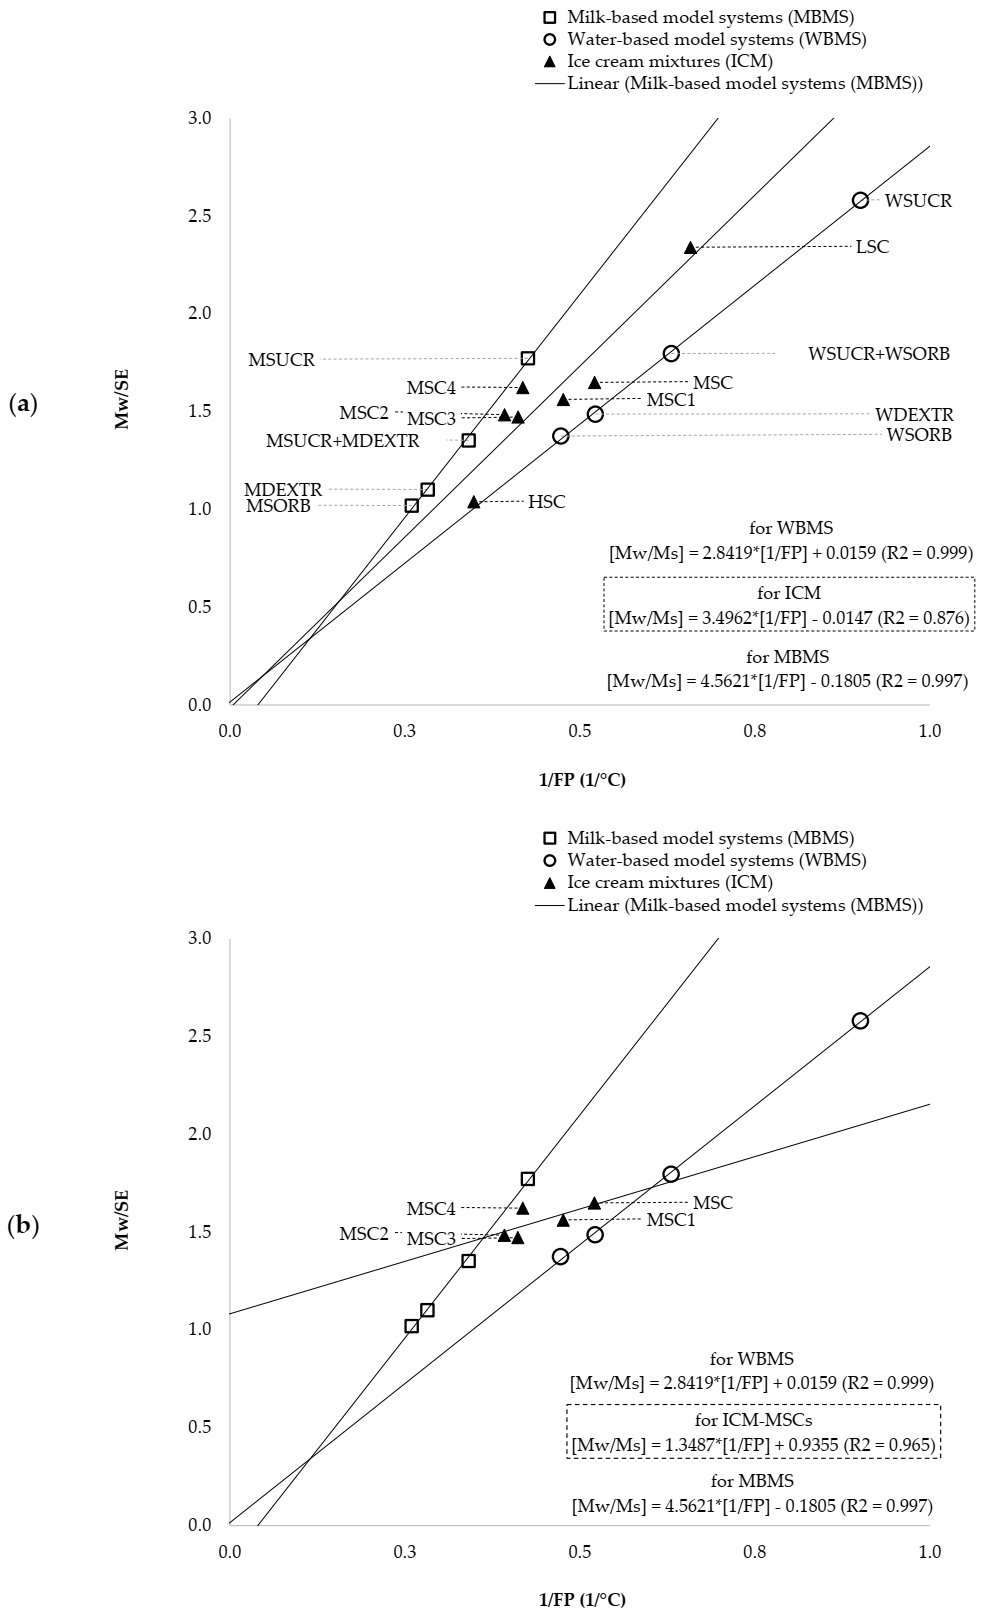
| ILP | Interaction Linear Plot obtained by linear regression analysis of the experimental data corresponding to the inverse values of the freezing point depression (x-data) and the ratio between Mw/Ms (y-data). |
| IS, Initial Supercooling (°C) | the maximum temperature depression below 0 °C experienced on cooling by the investigated MBMS and ICM at the point corresponding to the first ice nuclei formation. |
| LAGTIME | the time at which melting of the ice cream accelerates. |
| LSC, Low Sugar Content | ice cream mixture prepared with the lowest total sugar content. |
| MBMS | Milk-based model systems (i.e., MSUCR, MSUCR + MDEXTR, MDEXTR, MSORB). |
| m0 | the total mass of the ice cream. |
| mD | the mass of the drip loss during melting of the ice cream. |
| the maximum rate (1/min) of the ice cream melting. | |
| Ms | the concentration of the sucrose equivalents (expressed as g/100 of water) corresponding to all the colligative solutes. |
| MSC, MSC1, MSC2, MSC3 and MSC4 | Medium Sugar Content: ice cream mixtures prepared with the same intermediate total sugar content but varying the concentration of the individual sugar added as sweeteners, that is, sucrose, dextrose and sorbitol. |
| MSNF, Milk Solids Non-Fat | they include all solids in milk other than fat in the ICM. |
| MSUCR, MDEXT, MSORB | milk-based model systems prepared by adding 300 g of sucrose or dextrose or sorbitol to 1000 g of whole milk, respectively. |
| MSUCR + MDEXTR | milk-based model systems prepared by adding 150 g of sucrose and 150 g of dextrose to 1000 g of whole milk. |
| Mw | the mass fraction (% by weight) of the initial water of the ICM. |
| n | the number of time-temperature data registered by the PT100 probe inside the SSHE. |
| NUR, Nucleation Rate (°C/min) | the rate of formation of unstable ice nuclei in the unique supercooling domain (as experienced by the WBMS) or in the first supercooling domain (as experienced by the MBMS and ICM). |
| S, Supercooling (°C) | the maximum temperature depression below 0 °C required by the water to begin crystallization in the WBMS. |
| [SE] | the concentration (% by weight) of the sucrose equivalents as calculated by summing the individual contribute of all colligative solutes present in a given solution, provided that the it would behave as a pure sucrose solution (“sucrose equivalency” was derived for a comparison of the mean molecular weights for each colligative solute with that of the sucrose). |
| [SORB] | the initial concentration (% by weight) of the sorbitol in the ICM. |
| SSHE | Scraped-Surface Heat Exchanger used for batch ice cream production. |
| [SUCR] | the concentration (% by weight) of the sucrose. |
| the experimental temperature (°C) at a given time (t) registered by the PT100 inside the SSHE. | |
| TCL (t) | the theoretical temperature (°C) at a given time (t), that either the MBMS and the ICM would experience under a pure Newtonian cooling process, that is, without experience ice nucleation and ice growth. |
| Texit | the temperature (°C) at which the ice cream exits from the SSHE. |
| TP1 | First target point: the temperature at which the formation of unstable clusters of ice nuclei begins and the cooling curve starts to deviate from its linear trend experienced during the chilling step of cooling: it was estimated by determining the minimum significant difference between the experimental temperature and the theoretical temperature TCL (t). |
| TS, Total Solids | the total mass fraction (% by weight) that includes all solids that are present in the WBMS, MBMS and ICM. |
| tTexit | the time (min) corresponding to Texit. |
| tTwhipp | the time (min) corresponding to Twhipp. |
| Twe | the temperature (°C) corresponding to the intermediate time between Twhipp and Texit. |
| Twhipp | the temperature (°C) at which the water crystallization kinetics is at its decelerating point and air incorporation starts to dominate on the ice growth (it was estimated by using the re-parameterized Gompertz’ model). |
| WBMS | Water-based model systems (i.e., WSUCR, WSUCR + WSORB, WDEXTR, WSORB) |
| , Freezable Water Fraction (%) | the time-dependent changes in mass fraction (% by weight) of the water initially present in the ICM and that can be virtually converted in the ice during freezing under batch SSHE conditions, as estimated by using the re-parameterized Gompertz’s function. |
| , Experimental Freezable Water Fraction | the time-dependent changes in mass fraction (% by weight) of the water initially present in the ICM and that can be virtually converted in the ice during freezing under batch SSHE conditions, as estimated by coupling the experimental time-temperature data to the reverse relationship between the freezing point depression values tabulated for pure sucrose solutions with different sucrose concentrations and the corresponding mass fraction of the initial water that can be converted in the ice. |
| the upper asymptotic level of . | |
| Wice cream | the weight of a standard volume of the just extruded ice cream (used for overrun measurements). |
| Wmixture | the weight of the ice cream mixture after aging corresponding to the same volume of Wice cream (used for overrun measurements). |
| WSUCR, WDEXT, WSORB | water-based model systems prepared by adding 300 g of sucrose or dextrose or sorbitol to 1000 g of water, respectively. |
| WSUCR + WSORB | water-based model systems prepared by adding 150 g of sucrose and 150 g of sorbitol to 1000 g of water. |
| ∆FP | the difference between the FPt and FP. |
References
- Allied Market Research. Ice Cream Market by Product Type (Impulse Ice Cream, Take-Home Ice Cream and Artisanal Ice Cream): Global Opportunity Analysis and Industry Forecast, 2017–2023. 2017. Available online: https://www.alliedmarketresearch.com/press-release/ice-cream-market.html (accessed on 17 July 2020).
- Chernyshova, M.P.; Pristenskiy, D.V.; Lozbiakova, M.V.; Chalyk, N.E.; Bandaletova, T.Y.; Petyaev, I.M. Systemic and skin-targeting beneficial effects of lycopene-enriched ice cream: A pilot study. J. Dairy Sci. 2019, 102, 14–25. [Google Scholar] [CrossRef]
- Solieri, L.; De Vero, L.; Tagliazucchi, D. Peptidomic study of casein proteolysis in bovine milk by Lactobacillus casei PRA205 and Lactobacillus rhamnosus PRA331. Int. Dairy J. 2018, 85, 237–246. [Google Scholar] [CrossRef]
- Chiari, P.; Pulvirenti, A.; Giudici, P. Cold dessert: Criteria for their classification. Ind. Alim. 2016, 55, 11–18. [Google Scholar]
- Goff, H.D.; Hartel, W.R. Ice Cream; Springer: Berlin/Heidelberg, Germany, 2013. [Google Scholar] [CrossRef]
- Goff, H. Colloidal aspects of ice cream—A review. Int. Dairy J. 1997, 7, 363–373. [Google Scholar] [CrossRef]
- Dwórznicka, A.K.; Gondek, E.; Laba, S.; Jacubczyk, E.; Samborska, K. Characteristics of Instrumental methods to describe and asses the recrystallization process in ice cream systems. Foods 2019, 8, 117. [Google Scholar] [CrossRef] [PubMed]
- Mo, J.; Guo, E.; McCartney, D.G.; Eastwood, D.S.; Bent, J.; Van Dalen, G.; Schuetz, P.; Rockett, P.; Lee, P.D. Time-Resolved Tomographic Quantification of the Microstructural Evolution of Ice Cream. Materials 2018, 11, 2031. [Google Scholar] [CrossRef] [PubMed]
- Adapa, S.; Schmidt, K.A.; Jeon, I.J.; Herald, T.J.; Flores, R.A. Mechanisms of ice crystallization and recrystallization in ice cream: A review. Food Rev. Int. 2000, 16, 259–271. [Google Scholar] [CrossRef]
- Toker, O.S.; Karaman, S.; Yuksel, F.; Doğan, M.; Kayacier, A.; Yilmaz, M.T. Temperature Dependency of Steady, Dynamic, and Creep-Recovery Rheological Properties of Ice Cream Mix. Food Bioprocess Technol. 2013, 6, 2974–2985. [Google Scholar] [CrossRef]
- Da Silva Junior, E.; Da Silva Lannes, S.C. Effect of different sweetener blends and fat types on ice cream properties. Food Sci. Technol. 2011, 31, 217–220. [Google Scholar] [CrossRef]
- Cook, K.; Hartel, R.W. Mechanisms of Ice Crystallization in Ice Cream Production. Compr. Rev. Food Sci. Food Saf. 2010, 9, 213–222. [Google Scholar] [CrossRef]
- Cebula, D.J.; Russell, A.B. Ice Crystallization Control in Ice Cream. In Proceedings of the International Dairy Federation international ice cream symposium, Brussels, Belgium, 18–19 September 1998. [Google Scholar]
- Roos, Y.H. Phase Transitions in Foods. Phase Transit. Foods 1995, 43. [Google Scholar] [CrossRef]
- Lakhdar, B.M.; Cerecero, R.; Alvarez, G.; Guilpart, J.; Flick, D.; Lallemand, A. Heat transfer with freezing in a scraped surface heat exchanger. Appl. Therm. Eng. 2005, 25, 45–60. [Google Scholar] [CrossRef]
- Sodawala, S.; Garside, J. Ice Nucleation on A Cold Surface. In Proceedings of the 1997 Jubilee Research Event, Nottingham, UK, 8–9 April 1997; Institution of Chemical Engineers: Rugby, UK, 1997; pp. 477–480. [Google Scholar]
- Bolliger, S.; Wildmoser, H.; Kung, B.; Tharp, B. Relationships between ice cream mix viscoelasticity and ice crystal growth in ice cream. Int. Dairy J. 2000, 10, 791–797. [Google Scholar] [CrossRef]
- Ndoye, F.; Alvarez, G. Characterization of ice recrystallization in ice cream during storage using the focused beam reflectance measurement. J. Food Eng. 2015, 148, 24–34. [Google Scholar] [CrossRef]
- Potter, R.W.; Clynne, M.A.; Brown, D.L. Freezing point depression of aqueous sodium chloride solutions. Econ. Geol. 1978, 73, 284–285. [Google Scholar] [CrossRef]
- Gorry, P.A. General least-squares smoothing and differentiation by the convolution (Savitzky-Golay) method. Anal. Chem. 1990, 62, 570–573. [Google Scholar] [CrossRef]
- Omran, A.M.; King, C.J. Kinetics of ice crystallization in sugar solutions and fruit juices. AIChE J. 1974, 20, 795–803. [Google Scholar] [CrossRef]
- Schwartzberg, H.G.; Liu, Y. Ice crystal growth on chilled scraped surfaces. In Proceedings of the American Institute of Chemical Engineers Summer National Meeting, San Diego, CA, USA, 19–22 August 1990; pp. 19–22. [Google Scholar]
- Uraji, T.; Kohno, H.; Yoshimura, H.; Shimoyamada, M.; Watanabe, K. Freezing Point Depression of Polyol-Aqueous Solutions in the High Concentration Range. Food Sci. Technol. Int. Tokyo 1996, 2, 38–42. [Google Scholar] [CrossRef]
- Jaskulka, F.J.; Smith, D.E.; Larntz, K. Comparison of the Predictive Ability of Ice Cream Freezing Point Depression Equations. Milchwissenschaft 1993, 48, 671–675. [Google Scholar]
- Kobayashi, A.; Shirai, Y.; Nakanishi, K.; Matsuno, R. A method for making large agglomerated ice crystals for freeze concentration. J. Food Eng. 1996, 27, 1–15. [Google Scholar] [CrossRef]
- Pradipasena, P.; Tattiakul, J.; Nakamura, K.; Miyawaki, O.; Anuntagool, J. Temperature Dependence of Fraction of Frozen Water in Solutions of Glucose and its Oligomers, Dextrans, and Potato Starch. Food Sci. Technol. Res. 2007, 13, 286–290. [Google Scholar] [CrossRef][Green Version]
- Rahman, M.S.; Guizani, N.; Al-Khaseibi, M.; Al-Hinai, S.A.; Al-Maskri, S.S.; Al-Hamhami, K. Analysis of cooling curve to determine the end point of freezing. Food Hydrocoll. 2002, 16, 653–659. [Google Scholar] [CrossRef]
- Qin, F.; Chen, X.D.; Ramachandra, S.; Free, K. Heat transfer and power consumption in a scraped-surface heat exchanger while freezing aqueous solutions. Sep. Purif. Technol. 2006, 48, 150–158. [Google Scholar] [CrossRef]
- Koxholt, M.; Eisenmann, B.; Hinrichs, J. Effect of the Fat Globule Sizes on the Meltdown of Ice Cream. J. Dairy Sci. 2001, 84, 31–37. [Google Scholar] [CrossRef]
- Muse, M.; Hartel, R. Ice Cream Structural Elements that Affect Melting Rate and Hardness. J. Dairy Sci. 2004, 87, 1–10. [Google Scholar] [CrossRef]


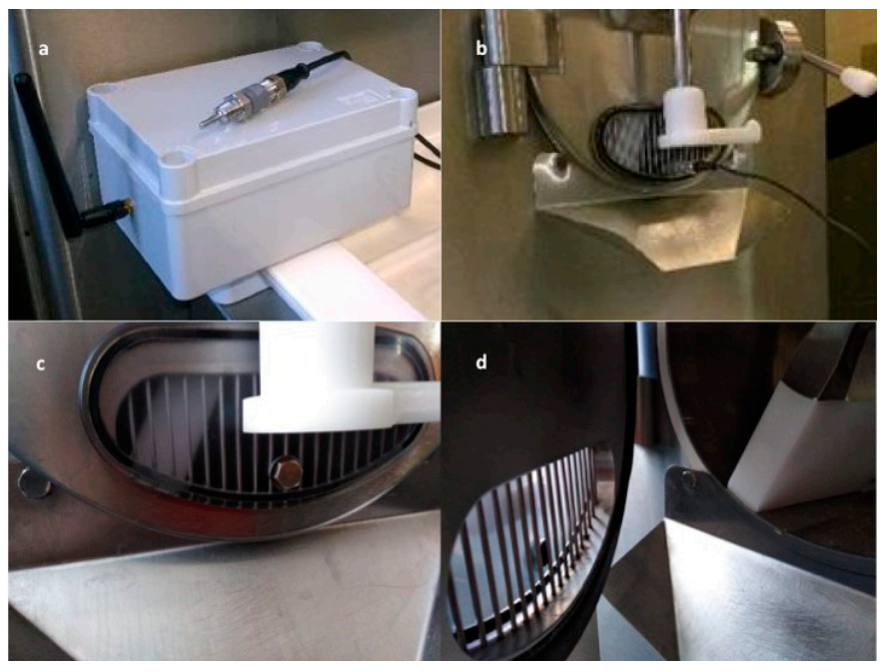
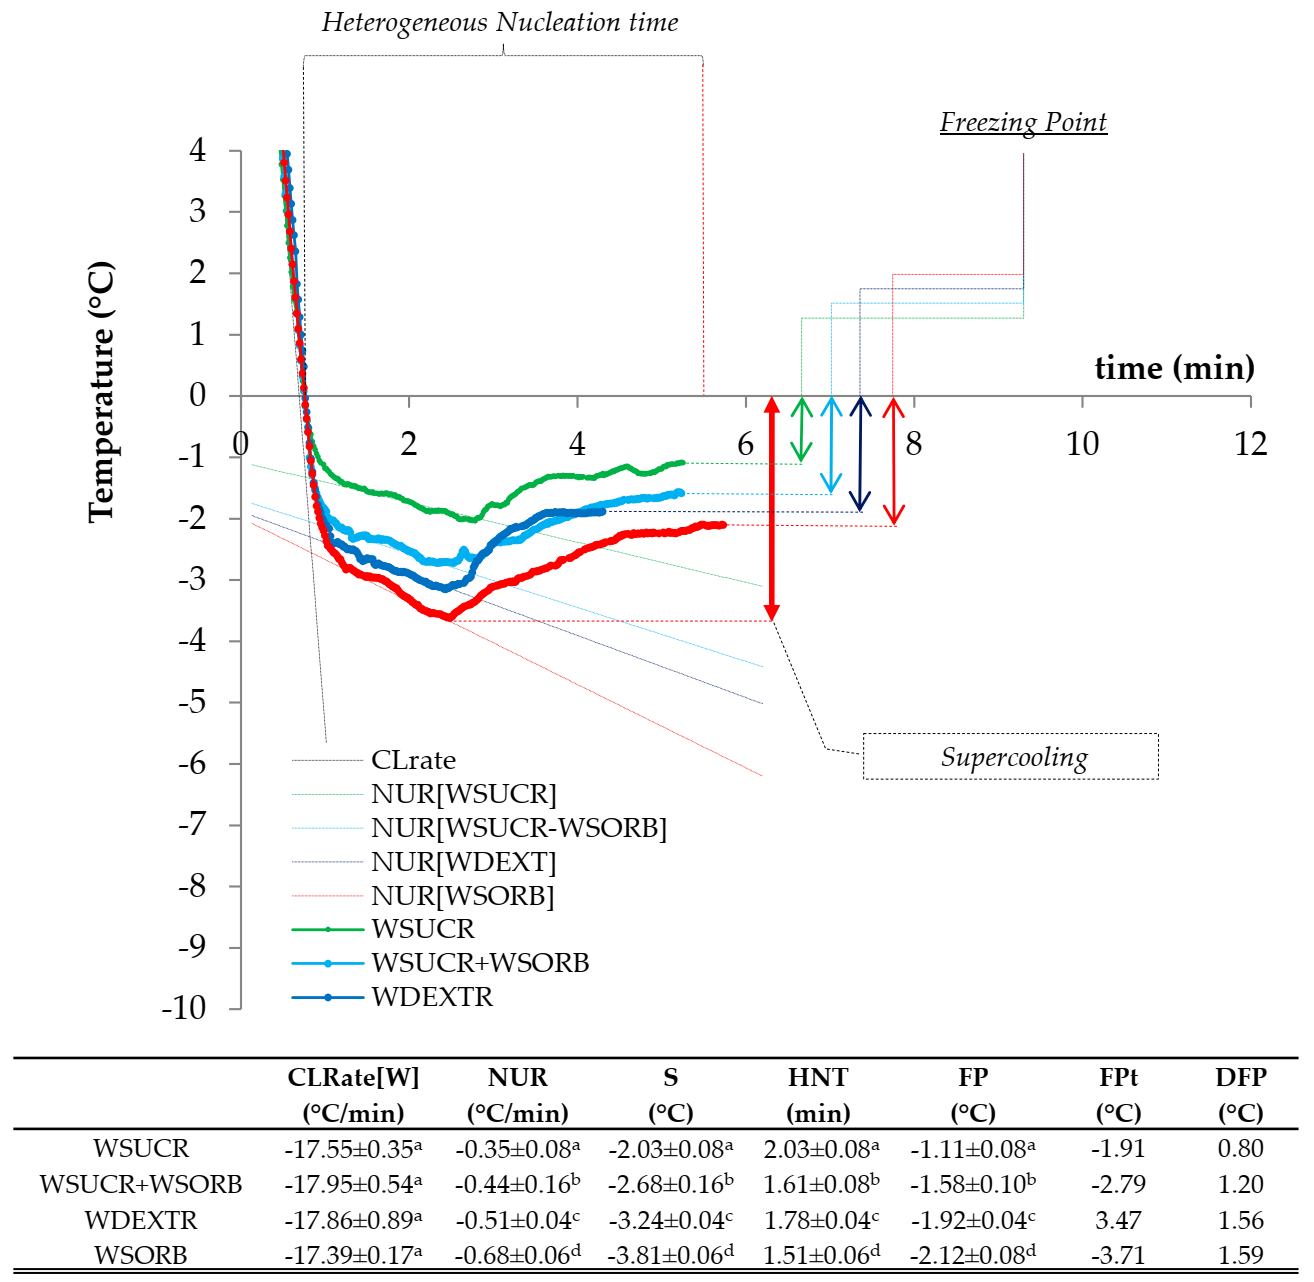

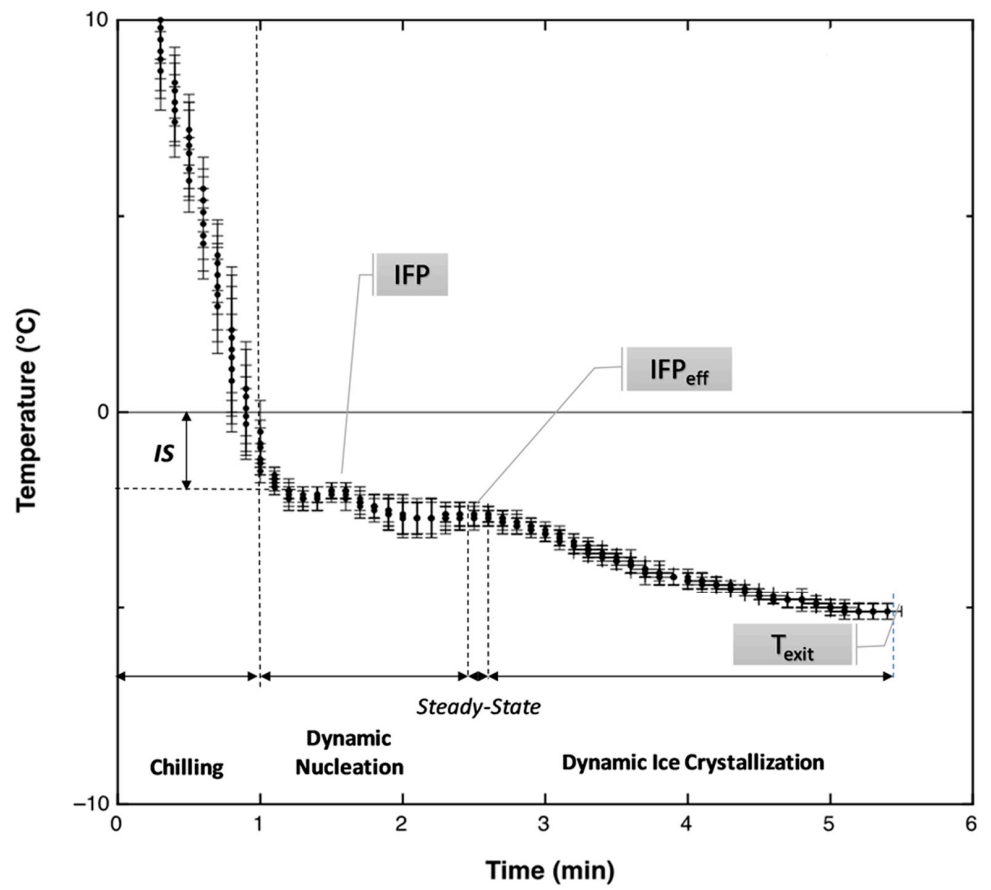

| WSUCR | WSUCR + WSORB | WDEXTR | WSORB | MSUCR | MSUCR + MDEXTR | MDEXTR | MSORB | |
|---|---|---|---|---|---|---|---|---|
| Added Sugars | 300 | 300 | 300 | 300 | 300 | 300 | 300 | 300 |
| Sucrose | 300 | 150 | 0 | 0 | 300 | 150 | 0 | 0 |
| Dextrose | 0 | 0 | 300 | 0 | 0 | 150 | 300 | 0 |
| Sorbitol | 0 | 150 | 0 | 300 | 0 | 0 | 0 | 300 |
| Water | 1000 | 1000 | 1000 | 1000 | 0 | 0 | 0 | 0 |
| Whole Milk | 0 | 0 | 0 | 0 | 1000 | 1000 | 1000 | 1000 |
| Model system | 1300 | 1300 | 1300 | 1300 | 1300 | 1300 | 1300 | 1300 |
| WSUCR | WSUCR + WSORB | WDEXTR | WSORB | MSUCR | MSUCR + MDEXTR | MDEXTR | MSORB | |
|---|---|---|---|---|---|---|---|---|
| Sugars | 22.97 | 22.94 | 21.69 | 22.96 | 26.62 | 25.98 | 25.35 | 26.61 |
| Fats | 0.00 | 0.00 | 0.00 | 0.00 | 1.19 | 1.19 | 1.19 | 1.19 |
| MSNF | 0.00 | 0.00 | 0.00 | 0.00 | 2.56 | 2.55 | 2.55 | 2.55 |
| NaCl | 0.00 | 0.00 | 0.00 | 0.00 | 0.10 | 0.10 | 0.10 | 0.10 |
| Total Solids (TS) | 22.97 | 22.94 | 21.69 | 22.96 | 30.47 | 29.83 | 29.19 | 30.46 |
| Total Water (Mw) | 77.03 | 77.06 | 78.31 | 77.04 | 69.53 | 70.17 | 70.81 | 69.54 |
| LSC | HSC | MSC | MSC1 | MSC2 | MSC3 | MSC4 | |
|---|---|---|---|---|---|---|---|
| Total Added Sugars | 100 | 300 | 200 | 200 | 200 | 200 | 200 |
| Sucrose | 50 | 150 | 150 | 125 | 100 | 100 | 150 |
| Dextrose | 0 | 50 | 50 | 50 | 50 | 25 | 0 |
| Sorbitol | 50 | 100 | 0 | 25 | 50 | 75 | 50 |
| Whole Milk | 1000 | 1000 | 1000 | 1000 | 1000 | 1000 | 1000 |
| Multicomponent basis | 100 | 100 | 100 | 100 | 100 | 100 | 100 |
| Ice cream mixture | 1200 | 1400 | 1300 | 1300 | 1300 | 1300 | 1300 |
| LSC | HSC | MSC | MSC1 | MSC2 | MSC3 | MSC4 | |
|---|---|---|---|---|---|---|---|
| Sugars | 18.34 | 29.74 | 24.37 | 24.37 | 24.37 | 24.47 | 24.58 |
| Fats | 1.32 | 1.13 | 1.22 | 1.22 | 1.22 | 1.22 | 1.22 |
| MSNF | 4.20 | 3.60 | 3.88 | 3.88 | 3.88 | 3.88 | 3.88 |
| NaCl | 0.14 | 0.12 | 0.13 | 0.13 | 0.13 | 0.13 | 0.13 |
| Total Solids (TS) | 23.99 | 34.58 | 29.59 | 29.59 | 29.59 | 29.69 | 29.80 |
| Total Water (Mw) | 76.01 | 65.42 | 70.41 | 70.41 | 70.41 | 70.31 | 70.20 |
| WSUCR | WSUCR + WSORB | WDEXTR | WSORB | MSUCR | MSUCR + MDEXTR | MDEXTR | MSORB | |
|---|---|---|---|---|---|---|---|---|
| SE from Sucrose | 29.81 | 14.90 | 0.00 | 0.06 | 33.02 | 16.36 | 0.00 | 0.07 |
| SE from Dextrose 1 | 0.01 | 0.09 | 52.63 | 0.17 | 0.01 | 29.37 | 58.21 | 0.19 |
| SE from Sorbito l | 0.00 | 27.87 | 0.00 | 55.75 | 0.00 | 0.00 | 0.00 | 61.76 |
| SE from Lactose 2 | 0.00 | 0.00 | 0.00 | 0.00 | 5.26 | 5.21 | 5.16 | 5.25 |
| SE from Fructose 3 | 0.01 | 0.00 | 0.00 | 0.00 | 0.01 | 0.00 | 0.00 | 0.00 |
| SE from all Sugars | 29.82 | 42.86 | 52.63 | 55.98 | 38.29 | 50.94 | 63.37 | 67.27 |
| LSC | HSC | MSC | MSC1 | MSC2 | MSC3 | MSC4 | |
|---|---|---|---|---|---|---|---|
| SE from Sucrose | 5.55 | 16.41 | 16.39 | 13.68 | 10.97 | 10.99 | 16.45 |
| SE from Dextrose 1 | 6.30 | 16.06 | 16.01 | 16.02 | 16.04 | 11.19 | 6.30 |
| Se form Sorbito l | 10.20 | 20.32 | 0.00 | 5.08 | 10.17 | 15.27 | 10.20 |
| SE from Lactose 2 | 6.94 | 6.91 | 6.91 | 6.91 | 6.91 | 6.92 | 6.93 |
| SE from Fructose 3 | 0.03 | 0.04 | 0.04 | 0.04 | 0.04 | 0.04 | 0.04 |
| SE from Maltose 4 | 0.10 | 0.10 | 0.10 | 0.10 | 0.10 | 0.10 | 0.10 |
| SE from Maltotriose 4 | 0.17 | 0.17 | 0.17 | 0.17 | 0.17 | 0.17 | 0.17 |
| SE from Inulin 4 | 0.18 | 0.17 | 0.17 | 0.17 | 0.17 | 0.18 | 0.18 |
| SE from Maltodextrins 4 | 0.17 | 0.17 | 0.17 | 0.17 | 0.17 | 0.17 | 0.17 |
| SE from all Sugars | 29.64 | 60.35 | 39.96 | 42.35 | 44.73 | 45.03 | 40.54 |
| Attribute | Score Scale | Description |
|---|---|---|
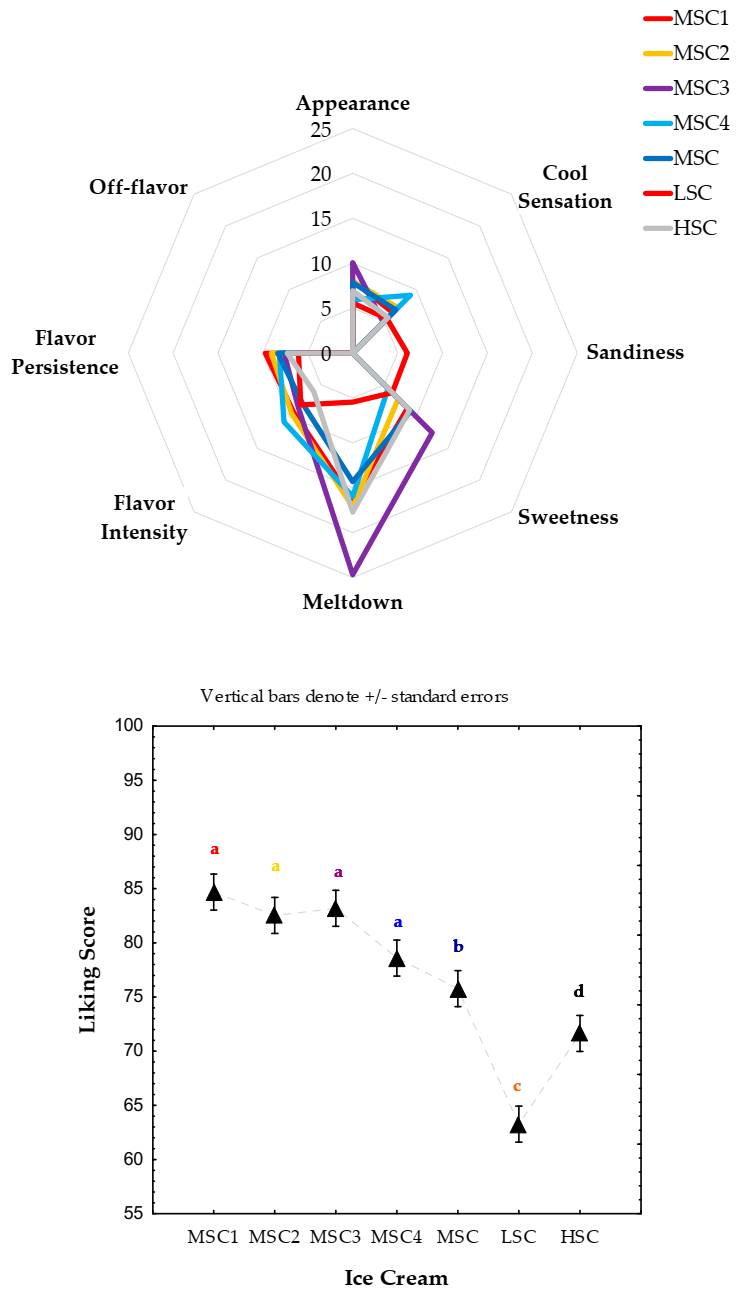
| Appearance | 0–5 | Visual perception of the ability to retain the initial waves after shaping with a cup without undergo fast surface melting (score = 0 for “doesn’t appeal”; score = 5 for “very appealing”) |
| Sweetness | 0–10 | In-mouth sweetness perception (score = 0 for “too low” or “too high” and score = 10 for “optimal level”) |
| Meltdown | 0–10 | The time required by the product to melt in the mouth when continuously pressed by the tongue against the palate (score = 0 for “too low” or “too high” and score = 10 for “optimal level”) |
| Sandiness | 0–5 | In-mouth textural sensation of the presence of fine, hard, uniform, sand-like particles. It was evaluated by pressing a thin layer of ice cream against the palate of the mouth with the tongue to obtain a quick melting (score = 0 for “very sand texture” and score = 5 for “very smooth texture”) |
| Cool sensation | 0–10 | In-mouth trigeminal perception of low temperature (score = 0 for “too low” or “too high” and score = 10 for “optimal level”) |
| Flavor Intensity | 0–8 | In-mouth intensity of the overall gustative sensations (score = 0 for “too low” or “too high” and score = 8 for “optimal level”) |
| Flavor persistence | 0–8 | In-mouth temporal dominance of the overall gustative sensations (score = 0 for “too low” or “too high” and score = 8 for “optimal level”) |
| Off-flavor | 0–5 | Evaluated as retro gustative perception of flavor not typical of ice-cream when the ice cream is in mouth or it has just been swallowed (0 for “without flavor defects,” 5 for “very defective flavor”) |
| Attribute | Production Specifications Used to Obtain the Four Intensity Levels (*) | |||
|---|---|---|---|---|
| Appearance and Meltdown | Amount and ratio between total emulsifiers (sucrose esters) and stabilizers in the multicomponent basis | |||
| (34.65 g + 5.35 g);6.47:1 | (35.65 g + 4.35 g); 8.19:1 | (36.65 g + 3.35 g); 10.94:1 | (37.65 g + 2.35 g); 16.02:1 | |
| Sweetness | Amount of total added sucrose | |||
| 100 g | 150 g | 200 g | 250 g | |
| Sandiness | Duration of shut down of the power supply of the tempering cabinet | |||
| 30 min | 60 min | 90 min | 120 min | |
| Cool sensation | Drawing temperature from the SSHE | |||
| −3 °C | −5 °C | −7 °C | −9 °C | |
| Flavor Intensity, Persistency, Off-flavor | Amount and ratio between the whole milk and multicomponent basis | |||
| (990 g + 110 g); 9:1 | (1000 g + 100 g); 10:1 | (1010 g + 90 g); 11.22:1 | (1020 g + 80 g); 12.75:1 | |
| WSUCR | WSUCR + WSORB | WDEXTR | WSORB | MSUCR | MSUCR + MDEXTR | MDEXTR | MSORB | ||
|---|---|---|---|---|---|---|---|---|---|
| Contributionto FPD (°C) of: | MSNF 1 | 0.00 | 0.00 | 0.00 | 0.00 | 0.09 | 0.09 | 0.09 | 0.09 |
| NaCl 2 | 0.00 | 0.00 | 0.00 | 0.00 | 0.09 | 0.08 | 0.08 | 0.08 | |
| Sugars 3 | 1.91 | 2.79 | 3.47 | 3.71 | 2.48 | 3.35 | 4.24 | 4.52 | |
| IFPt (°C) of the model systems | −1.91 | −2.79 | −3.47 | −3.71 | −2.65 | −3.52 | −4.41 | −4.70 | |
| LSC | HSC | MSC | MSC1 | MSC2 | MSC3 | MSC4 | ||
|---|---|---|---|---|---|---|---|---|
| Contribution to FPD (°C) of: | MSNF 1 | 0.13 | 0.13 | 0.13 | 0.13 | 0.13 | 0.13 | 0.13 |
| NaCl 2 | 0.10 | 0.10 | 0.10 | 0.10 | 0.10 | 0.10 | 0.10 | |
| Sugars 3 | 1.89 | 4.02 | 2.59 | 2.75 | 2.92 | 2.94 | 2.63 | |
| IFPt (°C) of ice cream mixtures | −2.13 | −4.26 | −2.82 | −2.99 | −3.15 | −3.17 | −2.86 | |
| IFP (°C) of ice cream mixtures | −1.52 | −2.87 | −1.92 | −2.99 | −3.15 | −3.17 | −2.86 | |
| ∆IFP (°C) | 0.61 | 1.39 | 0.90 | 0.89 | 0.60 | 0.74 | 0.47 | |
| Multiple Regression Models | Multiple R2 | p | Calibration Model (70%) | Multiple R2 | p | Validation Data (30%) | Multiple R2 | p |
|---|---|---|---|---|---|---|---|---|
| Mrate = −0.61 HNT−1.45·tTexit + 0.12 CLrate + 0.69 GRtime | 0.775 | 4.4 × 10⁻⁴ | Pred = 0.56 + 0.78·Obs | 0.775 | 0.000 | Pred=1.11 + 0.56·Obs | 0.526 | 0.000 |
| Overrun = 21.54 Twe + 25.03·IFP−5.82·IFPeff-14.33 tTexit | 0.717 | 3.9 × 10⁻³ | Pred = 8.39 + 0.72·Obs | 0.717 | 0.000 | Pred=19.87 + 0.31·Obs | 0.421 | 0.018 |
| Appearance = −2.91·Twe − 0.94·HNT | 0.817 | 5.4 × 10⁻⁵ | Pred = 0.61 + 0.82·Obs | 0.817 | 0.000 | Pred=0.93 + 0.73·Obs | 0.548 | 0.000 |
| Cool sensation = 5.19 − T[IFP-2] − 3.07 GRtime + 2.30·HNT+5.3·tTexit − 7.13 IFP + 0.39·CLrate | 0.798 | 1.5 × 10⁻⁴ | Pred = 1.18 + 0.79·Obs | 0.798 | 0.000 | Pred=2.18 + 0.62·Obs | 0.426 | 0.000 |
| Smoothness = 0.33 tTwhipp | 0.792 | 2.1 × 10⁻⁴ | Pred = 1.03 + 0.79·Obs | 0.792 | 0.000 | Pred=0.56+ 0.78·Obs | 0.401 | 0.000 |
| Sweetness = 2.65·IFPeff − 2.34·HNT | 0.805 | 1.1 × 10⁻⁴ | Pred = 1.46 + 0.80·Obs | 0.805 | 0.000 | Pred=2.22 + 0.69·Obs | 0.486 | 0.000 |
| Meltdown = −3.80·Twe | 0.872 | 1.2 × 10⁻⁶ | Pred = 0.86 + 0.87·Obs | 0.872 | 0.000 | Pred=1.10 + 0.85·Obs | 0.672 | 0.000 |
| Flavor Intensity = −2.31·GRtime + 1.13·HNT − 0.24·CLrate + 6.35·FAT | 0.865 | 2.2 × 10⁻⁶ | Pred = 1.04 + 0.87·Obs | 0.865 | 0.000 | Pred=2.15 + 0.71F·Obs | 0.709 | 0.000 |
| Flavor Persistence = −1.942·HNT | 0.775 | 0.001 | Pred = 1.667 + 0.775·Obs | 0.775 | 0.000 | Pred=2.174 + 0.715·Obs | 0.523 | 0.000 |
Publisher’s Note: MDPI stays neutral with regard to jurisdictional claims in published maps and institutional affiliations. |
© 2021 by the authors. Licensee MDPI, Basel, Switzerland. This article is an open access article distributed under the terms and conditions of the Creative Commons Attribution (CC BY) license (http://creativecommons.org/licenses/by/4.0/).
Share and Cite
Giudici, P.; Baiano, A.; Chiari, P.; De Vero, L.; Ghanbarzadeh, B.; Falcone, P.M. A Mathematical Modeling of Freezing Process in the Batch Production of Ice Cream. Foods 2021, 10, 334. https://doi.org/10.3390/foods10020334
Giudici P, Baiano A, Chiari P, De Vero L, Ghanbarzadeh B, Falcone PM. A Mathematical Modeling of Freezing Process in the Batch Production of Ice Cream. Foods. 2021; 10(2):334. https://doi.org/10.3390/foods10020334
Chicago/Turabian StyleGiudici, Paolo, Antonietta Baiano, Paola Chiari, Luciana De Vero, Babak Ghanbarzadeh, and Pasquale Massimiliano Falcone. 2021. "A Mathematical Modeling of Freezing Process in the Batch Production of Ice Cream" Foods 10, no. 2: 334. https://doi.org/10.3390/foods10020334
APA StyleGiudici, P., Baiano, A., Chiari, P., De Vero, L., Ghanbarzadeh, B., & Falcone, P. M. (2021). A Mathematical Modeling of Freezing Process in the Batch Production of Ice Cream. Foods, 10(2), 334. https://doi.org/10.3390/foods10020334


