Omnibus Modeling of Listeria monocytogenes Growth Rates at Low Temperatures
Abstract
:1. Introduction
2. Materials and Methods
2.1. Listeria monocytogenes Strains
2.2. Growth Determination
2.3. First-Order Growth Rate Modeling
2.4. Omnibus Modeling of Growth Curves
2.5. Omnibus Modeling of the Growth of L. monocytogenes for the Five Strains
2.6. Validation of the Omnibus Model
3. Results
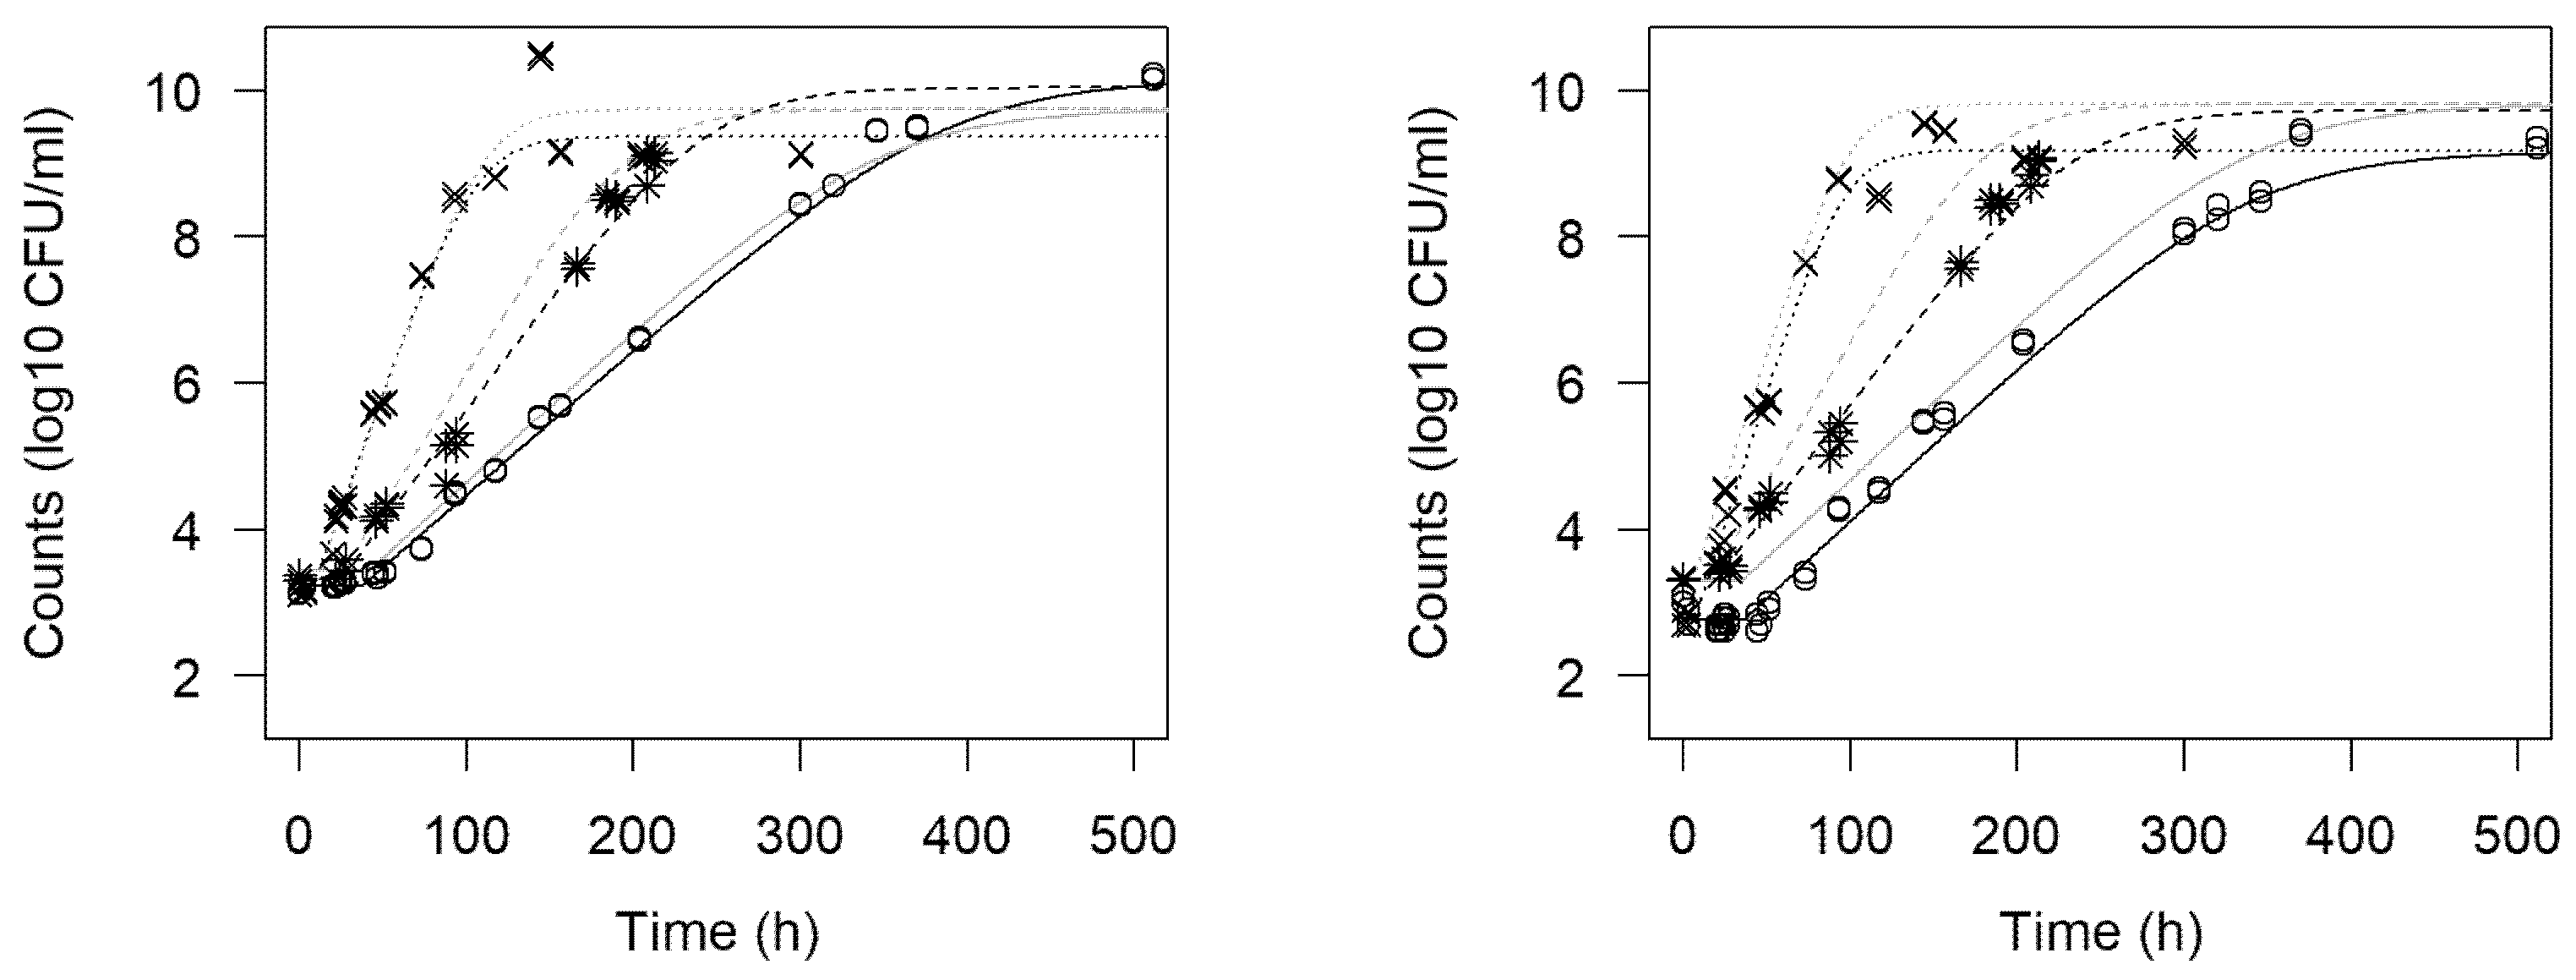
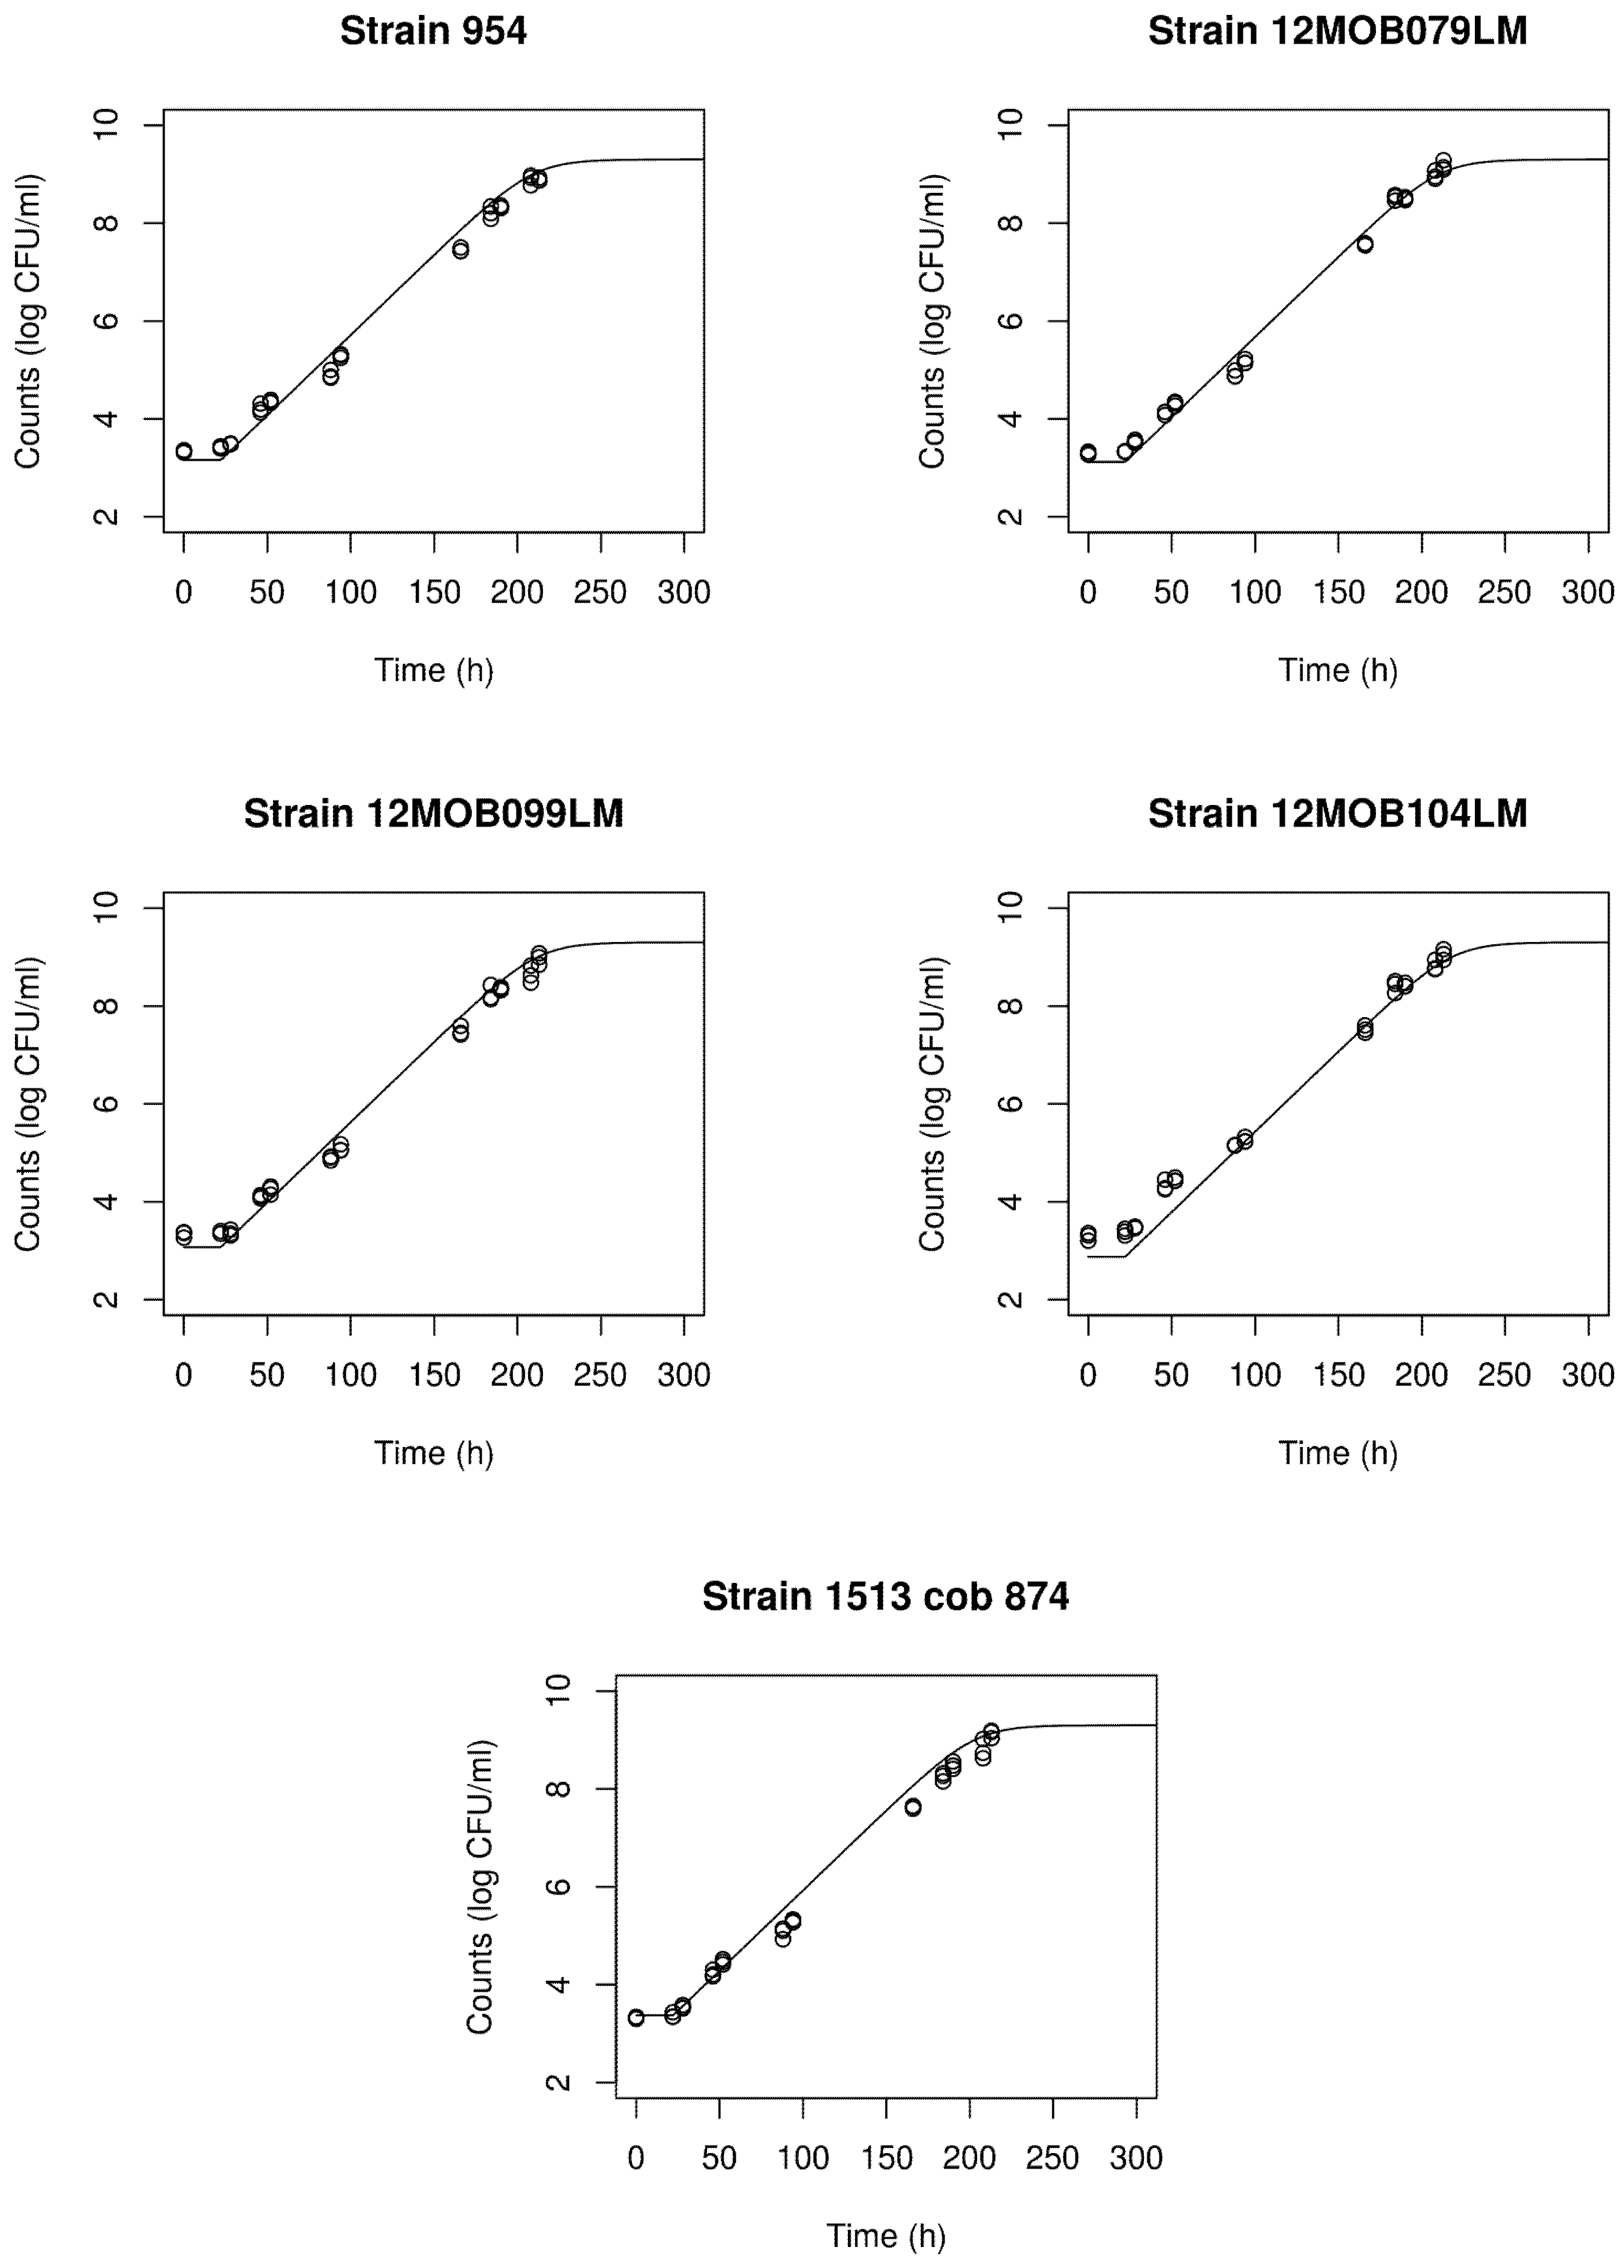
3.1. Growth Curves
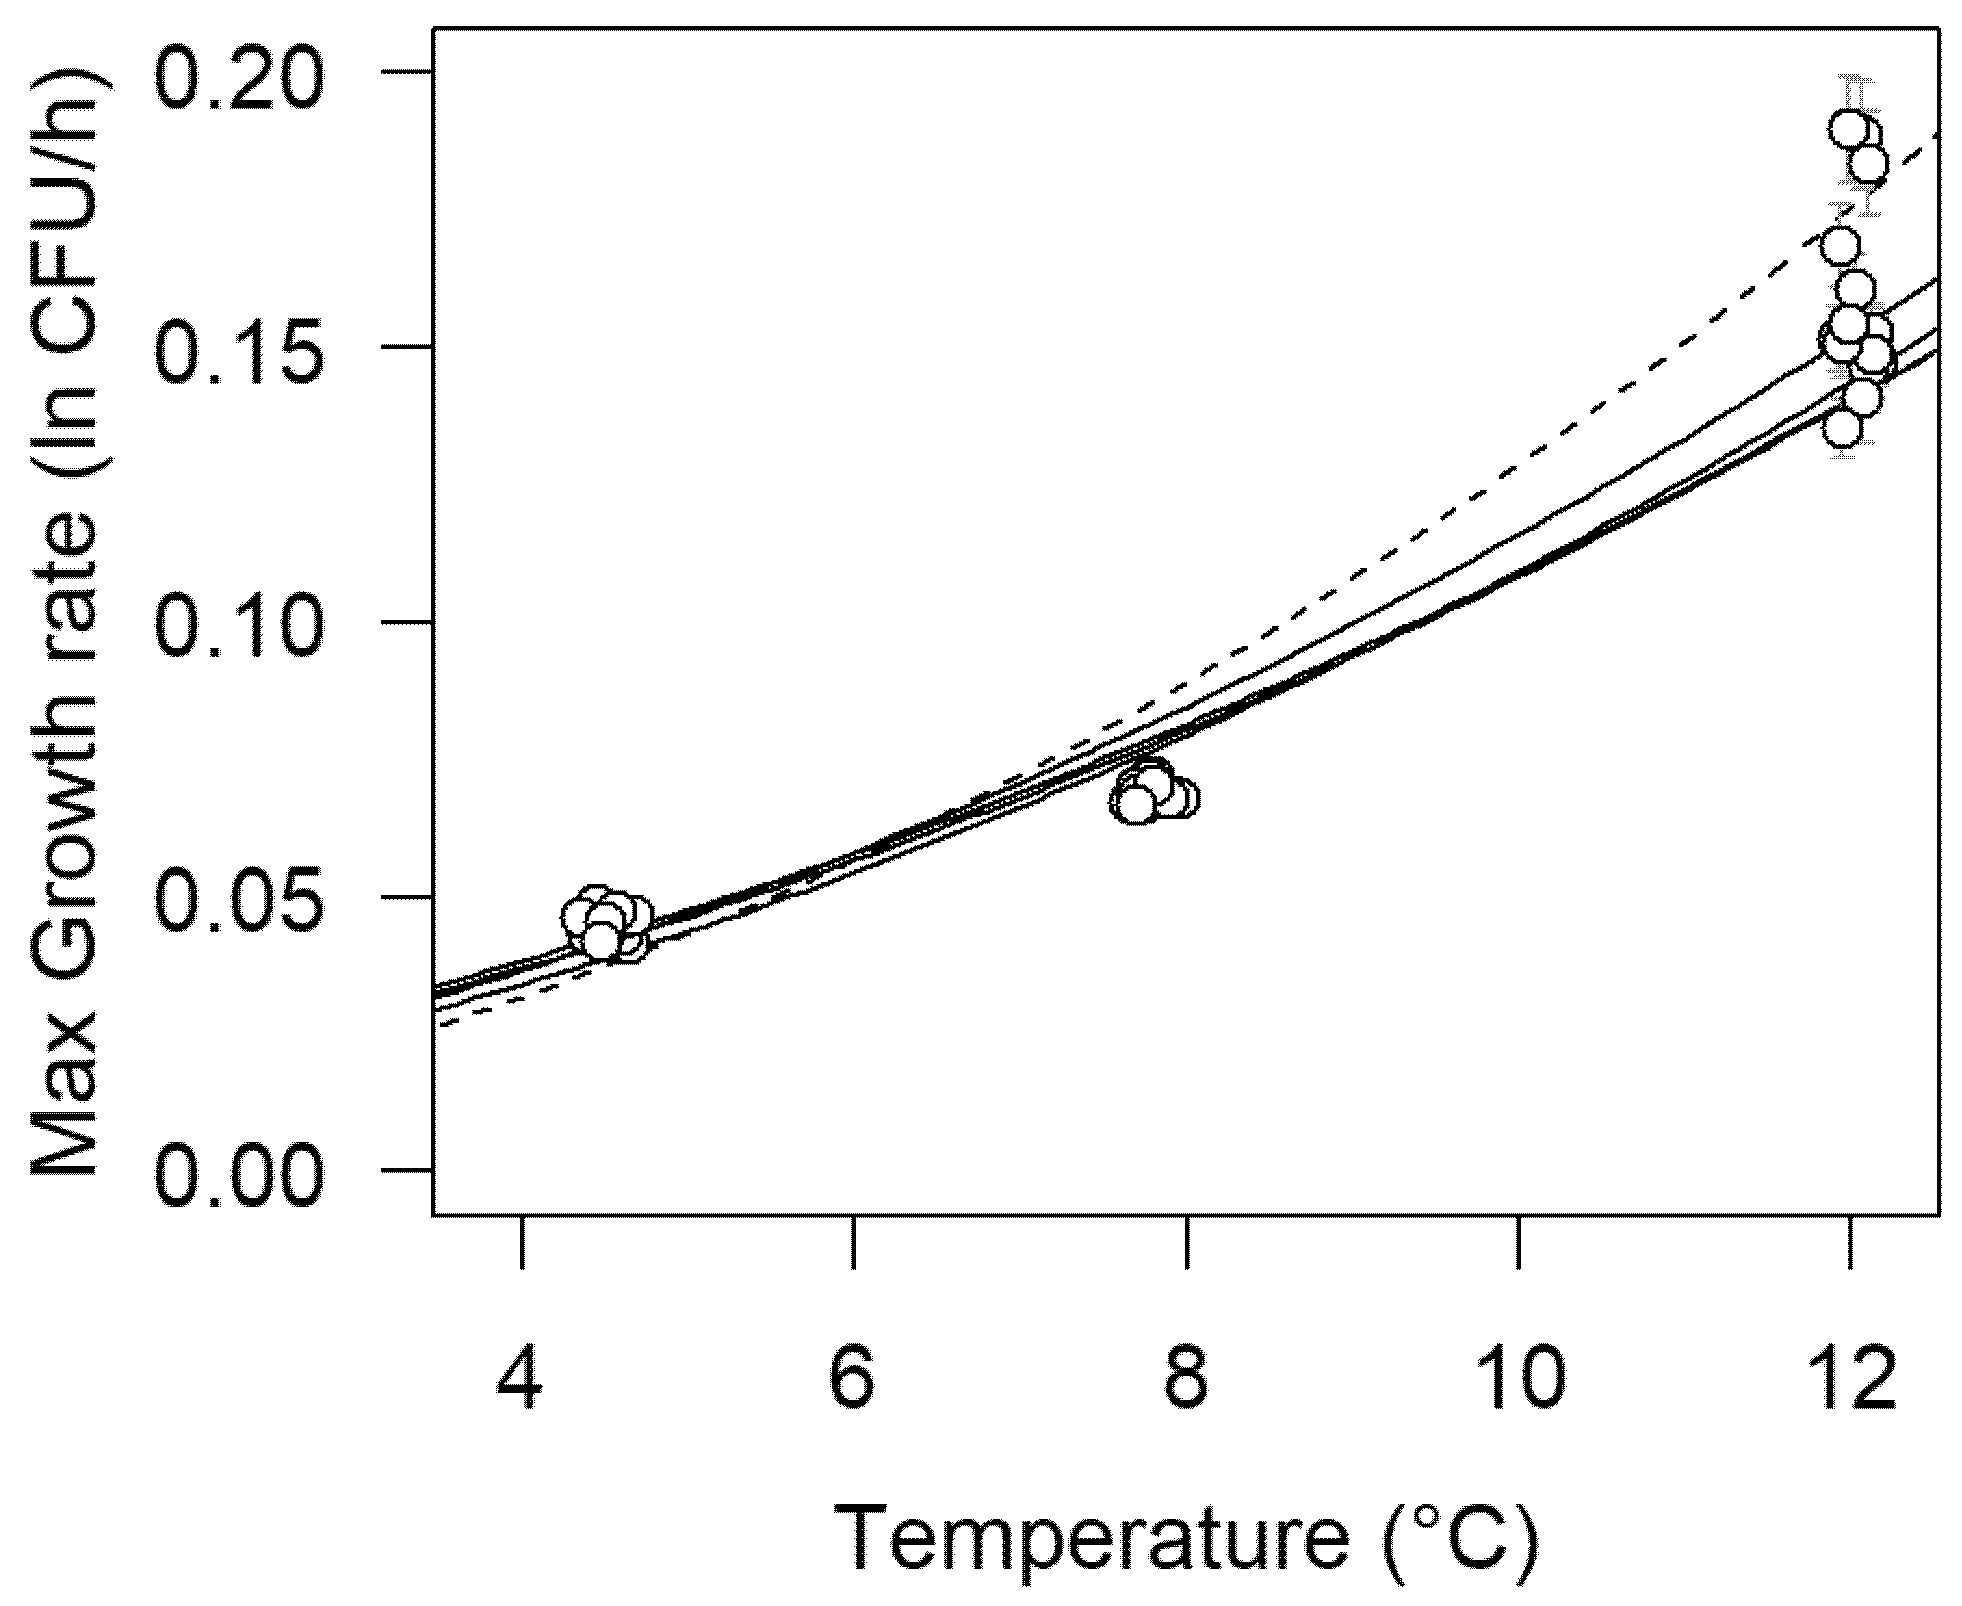
3.2. First-Order Growth Rate Modeling
3.3. Omnibus Modeling of Growth Curves
3.4. Omnibus Modeling of the Growth of L. monocytogenes for the Five Strains
4. Discussion
Author Contributions
Funding
Data Availability Statement
Conflicts of Interest
References
- EFSA. The European Union one health 2018 Zoonoses Report. EFSA J. 2019, 17, e05926. [Google Scholar]
- EC/DG SANCO. Commission Staff Working Document Guidance Document on Listeria monocytogenes Shelf-Life Studies for Ready-to-Eat Foods, under Regulation (EC) No 2073/2005 of 15 November 2005 on Microbiological Criteria for Foodstuffs. SANCO/11510/2013; European Commission: Brussels, Belgium, 2013. [Google Scholar]
- EURL Lm Technical Guidance Document for Conducting Shelf-Life Studies on Listeria monocytogenes in Ready-to-Eat Foods. Version 3 of 6 June 2014—Amendment 1 of 21 February 2019. French Agency for Food, Environmental and Occupational Health Safety and European Union Reference Laboratory for Listeria monocytogenes. Available online: https://eurl-listeria.anses.fr/en/system/files/LIS-Cr-201909D2.pdf (accessed on 23 February 2021).
- ISO. Microbiology of the FOOD CHAIN—Requirements and guidelines for Conducting Challenge Tests of Food and Feed Products. Part I: Challenge Tests to Study Growth Potential, Lag Time and Maximum Growth Rate; ISO 20976-1:2019.E. Switzerland; ISO: Geneva, Switzerland, 2019. [Google Scholar]
- Scott, V.N.; Swanson, K.M.; Freier, T.A.; Pruett, W.P., Jr.; Sveum, W.H.; Hall, P.A.; Smoot, L.A.; Brown, D.G. Guidelines for conducting Listeria monocytogenes challenge testing of foods. Food Prot. Trends 2005, 25, 818–825. [Google Scholar]
- National Advisory Committee on Microbiological Criteria for Foods. Requisite scientific parameters for establishing the equivalence of alternative methods of pasteurization. J. Food Prot. 2006, 69, 1190–1216. [Google Scholar] [CrossRef] [PubMed] [Green Version]
- Zwietering, M.H.; Jongenburger, I.; Rombouts, F.M.; van’t Riet, K. Modelling of the bacterial growth curve. Appl. Environ. Microbiol. 1990, 56, 1875–1881. [Google Scholar] [CrossRef] [PubMed] [Green Version]
- Baranyi, J.; McClure, P.J.; Sutherland, J.P.; Roberts, T.A. Modeling bacterial growth responses. J. Ind. Microbiol. 1993, 12, 190–194. [Google Scholar] [CrossRef]
- Buchanan, R.L.; Whiting, R.C.; Damert, W.C. When is simple good enough: A comparison of the Gompertz, Baranyi, and three-phase linear models for fitting bacterial growth curves. Food Microbiol. 1997, 14, 313–326. [Google Scholar] [CrossRef]
- Huang, L. Optimization of a new mathematical model for bacterial growth. Food Control 2013, 32, 283–288. [Google Scholar] [CrossRef]
- Ratkowsky, D.A.; Olley, J.; McMeekin, T.A.; Ball, A. Relationship between temperature and growth rate of bacterial cultures. J. Bacteriol. 1982, 149, 1–5. [Google Scholar] [CrossRef] [PubMed] [Green Version]
- Juneja, V.K.; Cadavez, V.; Gonzales-Barron, U.; Mukhopadhyay, S. Effect of pH, sodium chloride and sodium pyrophosphate on the thermal resistance of escherichia coli O157:H7 in ground beef. Food Res. Int. 2015, 69, 289–304. [Google Scholar] [CrossRef] [Green Version]
- Juneja, V.; Cadavez, V.; Gonzales-Barron, U.; Mukhopadhyay, S.; Friedman, M. Effect of pomegranate powder on the heat inactivation of Escherichia coli O104: H4 in ground chicken. Food Control 2016, 70, 26–34. [Google Scholar] [CrossRef] [Green Version]
- Gonzales-Barron, U.; Cadavez, V. Handbook of Predictive Microbiology Growth Models Using R; Centro de Investigação de Montanha: Bringráfica, Portugal, 2019. [Google Scholar]
- Nufer, U.; Stephan, R.; Tasara, T. Growth characteristics of Listeria monocytogenes, Listeria welshimeri and Listeria innocua strains in broth cultures and a sliced bologna-type product at 4 and 7 °C. Food Microbiol. 2007, 24, 444–451. [Google Scholar] [CrossRef] [PubMed]
- Pal, A.; Labuza, T.P.; Diez-Gonzalez, F. Evaluating the growth of Listeria monocytogenes in refrigerated ready-to-eat frankfurters: Influence of strain, temperature, packaging, lactate and diacetate, and background microflora. J. Food Prot. 2008, 71, 1806–1816. [Google Scholar] [CrossRef] [PubMed]
- Lianou, A.; Stopforth, J.D.; Yoon, Y.; Wiedmann, M.; Sofos, J.N. Growth and stress resistance variation in culture broth among Listeria monocytogenes strains of various serotypes and origins. J. Food Prot. 2006, 69, 2640–2647. [Google Scholar] [CrossRef] [PubMed]
- Aryani, D.C.; Den Besten, H.M.W.; Hazeleger, W.C.; Zwietering, M.H. Quantifying strain variability in modeling growth of Listeria monocytogenes. Int. J. Food Microbiol. 2015, 208, 19–29. [Google Scholar] [CrossRef] [PubMed]
- R Core Team. R: A Language and Environment for Statistical Computing; R Foundation for Statistical Computing: Vienna, Austria, 2013; Available online: http://www.R-project.org/ (accessed on 23 February 2021).
- Ross, T. Indices for performance evaluation of predictive models in food microbiology. J. Appl. Bacteriol. 1996, 81, 501–508. [Google Scholar] [PubMed]
- Pinheiro, J.; Bates, D.; DebRoy, S.; Sarkar, D.; R Core Team. nlme: Linear and Nonlinear Mixed Effects Models. R Package Version 3.1-152. 2021. Available online: https://CRAN.R-project.org/package=nlme (accessed on 23 February 2021).
- ANSES. Development of a Set of Listeria monocytogenes Strains for Conducting Challenge Tests. 2013. Available online: https://sitesv2.anses.fr/en/system/files/private/LIS-Cr-201317R.pdf (accessed on 23 February 2021).
- Silva, B.N.; Cadavez, V.; Teixeira, J.A.; Ellouze, M.; Gonzales-Barron, U. Cardinal parameter meta-regression models describing Listeria monocytogenes growth in broth. Food Res. Int. 2020, 136, 109476. [Google Scholar] [CrossRef] [PubMed]
- COMBASE. A Web Resource for Quantitative and Predictive Food Microbiology. University of Tasmania; USDA Agricultural Research Service. Available online: https://www.combase.cc/index.php/en/ (accessed on 23 February 2021).
- Huang, L. Growth kinetics of Listeria monocytogenes in broth and beef frankfurters—determination of lag phase duration and exponential growth rate under isothermal conditions. J. Food Sci. 2008, 73, E235–E242. [Google Scholar] [CrossRef] [PubMed]
- Liu, Y.; Wang, X.; Liu, B.; Dong, Q. One-Step Analysis for Listeria monocytogenes Growth in Ready-to-Eat Braised Beef at Dynamic and Static Conditions. J. Food Prot. 2019, 82, 1820–1827. [Google Scholar] [CrossRef] [PubMed]
- Juneja, V.K.; Marks, H.M.; Mohr, T. Predictive Thermal Inactivation Model for Effects of Temperature, Sodium Lactate, NaCl, and Sodium Pyrophosphate on Salmonella Serotypes in Ground Beef. Appl. Environ. Microbiol. 2003, 69, 5138–5156. [Google Scholar] [CrossRef] [PubMed] [Green Version]
- Juneja, V.; Gonzales-Barron, U.; Butler, F.; Yadav, A.; Friedman, M. Predictive thermal inactivation model for the combined effect of temperature, cinnamaldehyde and carvacrol on starvation-stressed multiple Salmonella serotypes in ground chicken. Int. J. Food Microbiol. 2013, 165, 184–199. [Google Scholar] [CrossRef] [PubMed]


| Strain | 4.5 °C | Growth Rate (h−1) 7.8 °C | 12.0 °C |
|---|---|---|---|
| 954 | 0.043 b (0.00091) | 0.068 b (0.00045) | 0.15 bc (0.0027) |
| 12MOB079LM | 0.046 a (0.00038) | 0.071 a (0.00069) | 0.15 c (0.0040) |
| 12MOB099LM | 0.046 ab (0.00098) | 0.069 ab (0.00071) | 0.15 bc (0.0093) |
| 12MOB104LM | 0.048 a (0.0011) | 0.068 b (0.00017) | 0.16 b (0.0070) |
| 1513COB874 | 0.045 ab (0.0022) | 0.068 b (0.0016) | 0.19 a (0.0034) |
| Parameters | Mean | Standard Error | Pr > |t| | Other Analysis |
|---|---|---|---|---|
| Fixed effects | ||||
| Y0 (ln CFU·mL−1) | 7.280 | 0.205 | <0.0001 | |
| Ymax (ln CFU·mL−1) | 21.48 | 0.475 | <0.0001 | |
| Predictor of õmax | ||||
| β0 (Intercept) (h−0.5) | 0.108 | 0.004 | <0.0001 | |
| β1 (Temp) (h−0.5·°C−1) | 0.021 | 0.001 | <0.0001 | |
| Predictor of 1/√λ | ||||
| γ0 (Intercept) (h−0.5) | 0.145 | 0.009 | <0.0001 | Robs-fit = 0.997 |
| γ1 (Temp²) (h−0.5·°C−2) | 0.0017 | 0.0003 | <0.0001 | Rfit-residuals = 0.008 |
| Random effects (condition) | Correlation matrix | |||
| su (Y0) (ln CFU·mL−1) | 0.302 | su (Y0) | sw (Ymax) | |
| sv (β0) (h−0.5) | 1.7 × 10⁻⁹ | 0.725 | ||
| sw (Ymax) (ln CFU·mL−1) | 0.774 | −0.582 | −0.284 | |
| s (residual) | 0.507 | |||
| Parameters | Mean | Standard Error | Pr > |t| | Other Analysis |
|---|---|---|---|---|
| Fixed effects | ||||
| Y0 (ln CFU·mL−1) | 7.318 | 0.107 | <0.0001 | |
| Ymax (ln CFU·mL−1) | 21.86 | 0.135 | <0.0001 | |
| Predictor of õmax | ||||
| β0 (Intercept) (h−0.5) | 0.111 | 0.016 | <0.0001 | |
| β1 (Temp) (h−0.5·°C−1) | 0.022 | 0.002 | <0.0001 | |
| Predictor of 1/√λ | ||||
| γ0 (Intercept) (h−0.5) | 0.135 | 0.010 | <0.0001 | Robs-fit = 0.995 |
| γ1 (Temp²) (h−0.5·°C−2) | 0.001 | 0.0002 | <0.0001 | Rfit-residuals = 0.002 |
| Random effects (condition) | Correlation | |||
| su (Y0) (ln CFU·mL−1) | 0.021 | su (Y0) | sw (Ymax) | |
| sv (β0) (h−0.5) | 0.009 | 0.177 | ||
| sw (Ymax) (ln CFU·mL−1) | 3.2 × 10⁻⁷ | 0.006 | 0.030 | |
| s (residual) | 0.572 | |||
| Parameters | Mean | Standard Error | Pr > |t| | Other Analysis |
|---|---|---|---|---|
| Fixed effects | ||||
| Y0 (ln CFU·mL−1) | 7.420 | 0.170 | <0.0001 | |
| Ymax (ln CFU·mL−1) | 21.09 | 0.208 | <0.0001 | |
| Predictor of õmax | ||||
| β0 (Intercept) (h−0.5) | 0.101 | 0.012 | <0.0001 | |
| β1 (Temp) (h−0.5·°C−1) | 0.023 | 0.001 | <0.0001 | |
| Predictor of 1/√λ | ||||
| γ0 (Intercept) (h−0.5) | 0.129 | 0.009 | <0.0001 | Robs-fit = 0.996 |
| γ1 (Temp²) (h−0.5·°C−2) | 0.001 | 0.0002 | <0.0001 | Rfit-residuals = 0.001 |
| Random effects (condition) | Correlation matrix | |||
| su (Y0) (ln CFU·mL−1) | 0.232 | su (Y0) | sw (Ymax) | |
| sv (β0) (h−0.5) | 0.013 | 0.171 | ||
| sw (Ymax) (ln CFU·mL−1) | 0.284 | −0.165 | 0.051 | |
| s (residual) | 0.508 | |||
| Parameters | Mean | Standard Error | Pr > |t| | Other Analysis |
|---|---|---|---|---|
| Fixed effects | ||||
| Y0 (ln CFU·mL−1) | 6.709 | 0.241 | <0.0001 | |
| Ymax (ln CFU·mL−1) | 21.58 | 0.331 | <0.0001 | |
| Predictor of õmax | ||||
| β0 (Intercept) (h−0.5) | 0.097 | 0.012 | <0.0001 | |
| β1 (Temp) (h−0.5·°C−1) | 0.024 | 0.001 | <0.0001 | |
| Predictor of 1/√λ | ||||
| γ0 (Intercept) (h−0.5) | 0.129 | 0.011 | <0.0001 | Robs-fit = 0.996 |
| γ1 (Temp²) (h−0.5·°C−2) | 0.002 | 0.0003 | <0.0001 | Rfit-residuals = 0.013 |
| Random effects (condition) | Correlation matrix | |||
| su (Y0) (ln CFU·mL−1) | 0.373 | su (Y0) | sw (Ymax) | |
| sv (β0) (h−0.5) | 0.017 | 0.016 | ||
| sw (Ymax) (ln CFU·mL−1) | 0.518 | −0.091 | 0.031 | |
| s (residual) | 0.495 | |||
| Parameters | Mean | Standard Error | Pr > |t| | Other Analysis |
|---|---|---|---|---|
| Fixed effects | ||||
| Y0 (ln CFU·mL−1) | 7.336 | 0.294 | <0.0001 | |
| Ymax (ln CFU·mL−1) | 21.05 | 0.518 | <0.0001 | |
| Predictor of õmax | ||||
| β0 (Intercept) (h−0.5) | 0.089 | 0.007 | <0.0001 | |
| β1 (Temp) (h−0.5·°C−1) | 0.027 | 0.001 | <0.0001 | |
| Predictor of 1/√λ | ||||
| γ0 (Intercept) (h−0.5) | 0.145 | 0.016 | <0.0001 | Robs-fit = 0.993 |
| γ1 (Temp²) (h−0.5·°C−2) | 0.001 | 0.0003 | <0.0001 | Rfit-residuals = −0.003 |
| Random effects (condition) | Correlation matrix | |||
| su (Y0) (ln CFU·mL−1) | 0.442 | su (Y0) | sw (Ymax) | |
| sv (β0) (h−0.5) | 9.9 × 10⁻⁹ | 0.689 | ||
| sw (Ymax) (ln CFU·mL−1) | 0.848 | −0.288 | −0.225 | |
| s (residual) | 0.667 | |||
| Parameters | Mean | Standard Error | Pr > |t| | Other Analysis |
|---|---|---|---|---|
| Fixed effects | ||||
| Y0 (ln CFU·mL−1) | 7.286 | 0.092 | <0.0001 | |
| Ymax (ln CFU·mL−1) | 21.69 | 0.150 | <0.0001 | |
| Predictor of õmax | ||||
| β0 (Intercept) (h−0.5) | 0.098 | 0.013 | <0.0001 | |
| β1 (Temp) (h−0.5·°C−1) | 0.024 | 0.001 | <0.0001 | |
| Predictor of 1/√λ | ||||
| γ0 (Intercept) (h−0.5) | 0.144 | 0.005 | <0.0001 | Robs-fit = 0.996 |
| γ1 (Temp²) (h−0.5·°C−2) | 0.0013 | 0.0001 | <0.0001 | Rfit-residuals = 0.006 |
| Nested random effects | ||||
| Strain s | Correlation matrix | |||
| su s (Y0) (ln CFU·mL−1) | 3.2 × 10⁻⁵ | sv s (γ0) | sw s (β0) | sz s (Ymax) |
| sv s (γ0) (h−0.5) | 8.5 × 10⁻⁸ | −0.148 | ||
| sw s (β0) (h−0.5) | 2.8 × 10⁻⁶ | 0.360 | −0.226 | |
| sz s (Ymax) (ln CFU·mL−1) | 5.7 × 10⁻⁵ | 0.245 | −0.003 | 0.543 |
| Condition j in Strain s | ||||
| su s(j) (Y0) (ln CFU·mL−1) | 0.305 | sv s(j) (γ0) | sw s(j) (β0) | sz s(j) (Ymax) |
| sv s(j) (γ0) (h−0.5) | 8.2 × 10⁻⁸ | −0.763 | ||
| sw s(j) (β0) (h−0.5) | 0.017 | −0.385 | 0.719 | |
| sz s(j) (Ymax) (ln CFU·mL−1) | 0.450 | 0.514 | −0.511 | −0.552 |
| s (residual) | 0.498 | |||
| Temperature (°C) | Strain | Mean μmax (h−1) | Low CI μmax (h−1) | High CI μmax (h−1) |
|---|---|---|---|---|
| 4.5 | 954 | 0.0410 | 0.0364 | 0.0459 |
| 12MOB079LM | 0.0441 | 0.0304 | 0.0606 | |
| 12MOB099LM | 0.0418 | 0.0321 | 0.0527 | |
| 12MOB104LM | 0.0420 | 0.0324 | 0.0528 | |
| 1513COB874 | 0.0443 | 0.0377 | 0.0515 | |
| 7.8 | 954 | 0.0738 | 0.0649 | 0.0835 |
| 12MOB079LM | 0.0799 | 0.0573 | 0.1068 | |
| 12MOB099LM | 0.0787 | 0.0635 | 0.0951 | |
| 12MOB104LM | 0.0807 | 0.0655 | 0.0973 | |
| 1513COB874 | 0.0897 | 0.0780 | 0.1025 | |
| 12 | 954 | 0.1126 | 0.1049 | 0.1480 |
| 12MOB079LM | 0.1407 | 0.1017 | 0.1867 | |
| 12MOB099LM | 0.1422 | 0.1180 | 0.1684 | |
| 12MOB104LM | 0.1481 | 0.1234 | 0.1748 | |
| 1513COB874 | 0.1705 | 0.1490 | 0.1939 |
| Study | Current | EURL [18] | Shiny [21] | Combase [19] |
|---|---|---|---|---|
| Environment | ||||
| Temperature (°C) | 7.8 | 8 | 8 | 8 |
| pH | 7.2 | 7 | 7 | 7 |
| Aw | 0.997 | 0.98 | 0.98 | 0.98 |
| Strain | ||||
| 12MOB079LM | 0.080 | 0.093 | ||
| 12MOB099LM | 0.079 | 0.094 | ||
| 12MOB104LM | 0.081 | 0.089 | ||
| Model (op. density) | 0.086 | |||
| Model (cell count) | 0.063 | 0.071 |
Publisher’s Note: MDPI stays neutral with regard to jurisdictional claims in published maps and institutional affiliations. |
© 2021 by the authors. Licensee MDPI, Basel, Switzerland. This article is an open access article distributed under the terms and conditions of the Creative Commons Attribution (CC BY) license (https://creativecommons.org/licenses/by/4.0/).
Share and Cite
Pennone, V.; Gonzales-Barron, U.; Hunt, K.; Cadavez, V.; McAuliffe, O.; Butler, F. Omnibus Modeling of Listeria monocytogenes Growth Rates at Low Temperatures. Foods 2021, 10, 1099. https://doi.org/10.3390/foods10051099
Pennone V, Gonzales-Barron U, Hunt K, Cadavez V, McAuliffe O, Butler F. Omnibus Modeling of Listeria monocytogenes Growth Rates at Low Temperatures. Foods. 2021; 10(5):1099. https://doi.org/10.3390/foods10051099
Chicago/Turabian StylePennone, Vincenzo, Ursula Gonzales-Barron, Kevin Hunt, Vasco Cadavez, Olivia McAuliffe, and Francis Butler. 2021. "Omnibus Modeling of Listeria monocytogenes Growth Rates at Low Temperatures" Foods 10, no. 5: 1099. https://doi.org/10.3390/foods10051099
APA StylePennone, V., Gonzales-Barron, U., Hunt, K., Cadavez, V., McAuliffe, O., & Butler, F. (2021). Omnibus Modeling of Listeria monocytogenes Growth Rates at Low Temperatures. Foods, 10(5), 1099. https://doi.org/10.3390/foods10051099


