Abstract
This study investigated the effect of seaweed supplementation in dairy cow diets on milk yield, basic composition, and mineral concentrations. Thirty-seven Icelandic cows were split into three diet treatments: control (CON, no seaweed), low seaweed (LSW, 0.75% concentrate dry matter (DM), 13–40 g/cow/day), and high seaweed (HSW, 1.5% concentrate DM, 26–158 g/cow/day). Cows were fed the same basal diet of grass silage and concentrate for a week, and then were introduced to the assigned experimental diets for 6 weeks. The seaweed mix of 91% Ascophyllum nodosum: 9% Laminaria digitata (DM basis), feed, and milk samples were collected weekly. Data were analyzed using a linear mixed effects model, with diet, week, and their interaction as fixed factors, cow ID as random factor, and the pre-treatment week data as a covariate. When compared with CON milk, LSW and HSW milk had, respectively, less Se (−1.4 and −3.1 μg/kg milk) and more I (+744 and +1649 μg/kg milk), while HSW milk also had less Cu (−11.6 μg/kg milk) and more As (+0.17 μg/kg milk) than CON milk. The minimal changes or concentrations in milk for Se, Cu, and As cannot be associated with any effects on consumer nutrition, but care should be taken when I-rich seaweed is fed to cows to avoid excessive animal I supply and milk I concentrations.
1. Introduction
Seaweed is an underexploited potential animal feed source that has recently gained increased attention due to its high concentration of specific minerals, macronutrients, and bioactive compounds, spearheaded by indications that certain seaweed species have been shown to markedly reduce enteric methane emissions [1,2,3,4,5]. Seaweed farming and wild harvesting have a number of benefits, including faster growth rates from traditional crops farmed on land and less of a vulnerability to the meteorological effects of climate change, therefore reducing the increasing competition between food and feed production from traditional land-based agricultural production [6]. Global seaweed production has increased by almost 27% between 2011 and 2015, resulting in a total output of 30 million tons at the end of this period, and continues to grow, with the vast majority of seaweed being from farmed aquaculture [7]. Given the current state of harvesting seaweed, and its potential benefits on animal nutrition and health, there is an increasing interest towards alternative applications for the growing industry, such as the sustainable seaweed supplementation of animal diets which may yield potential benefits for ruminant health and nutrition along with resulting benefits to human health [8,9,10].
Of the several seaweed species that have been previously explored, Ascophyllum nodosum and Laminaria digitata have been identified as potential candidates for experimental animal feeding [11,12,13]. A. nodosum is a brown cold-water alga which is found in much of the Northern Atlantic Ocean, including Norway, the United Kingdom, Iceland, and the eastern seaboard of the United States and Canada [14,15]. A. nodosum is either gathered by hand (e.g., Scotland and Ireland) or by mechanical harvesting (e.g., Norway and Iceland) and is one of the main species harvested in Europe; its use as a bio-stimulant for agricultural opportunities have been recently researched and it is currently used in much of phycological industrial applications, such as fertilizer and alginate production, along with a function as an animal feed supplement [16,17,18]. L. digitata, is a less harvested but still common seaweed found within the Northern Atlantic Ocean, with an estimated total harvested amount annually (<150 tons in the wild) being lower than A. nodosum in Ireland [19]. L. digitata is one of the most exploited types of seaweed off the coast of France, where it has been harvested for alginates at around 50,000 tons a year as of 2011 [20]. These two species (i) have been shown to illicit a positive effect on rumen function, animal health, energy utilization, and milk quality and safety [3,10,13,21,22,23,24,25]; (ii) are good sources of minerals, such as iodine (I), calcium (Ca), phosphorus (P), selenium (Se), magnesium (Mg), and zinc (Zn) representing excellent candidates for feed mineral supplementation [26,27,28]; (iii) are excellent sources of essential amino acids for the animal, such as theanine, valine, methionine, isoleucine, leucine, phenylalanine, lysin, histidine, and arginine—of which, for many, dairy serves as a source of [27,29,30]; and (iv) are readily available in Europe, Scandinavia, and the eastern seaboard of North America [14,15].
While previous findings regarding the effect of seaweed supplementation in ruminant diets on animal health and rumen function are promising, the impact on milk quality should also be considered. Milk and dairy products are rich in minerals and are large suppliers of I, Ca, P, Se, Mg and Zn in human diets [31,32]. These minerals can exert positive effects on human health as they are associated with reduced risk of cardiometabolic diseases and other non-communicable diseases, therefore providing a source of nutrition and the potential to reduce healthcare expenses [33]. A common characteristic of most seaweeds is the high mineral content, and therefore, supplementation of dairy cow diets with this aquacultural product may influence mineral concentrations in the milk [28]. Previous work has found that dietary supplementation of cow diets with A. nodosum has increased milk I concentrations by approximately 309%, to 481 μg/L average across three periods, when offered at 113 g per cow per day, and by approximately 671% to 1370 μg/L when cows were offered 170 g per head per day [10,34]. In another study, supplementation of dairy cow diets with a blend of seaweeds, including Ulva rigida, Laminaria ochroleuca, Saccharina latissima, Saccorhiza polyschides, Mastocarpus stellatus, and Sargassum muticum resulted in higher milk I content, indicating that dietary supplementation of seaweed could be used as a potential strategy to increase milk I content [10,24]. However, seaweed may contain heavy metals, including cadmium (Cd), lead (Pb), mercury (Hg), copper (Cu), molybdenum (Mo), and arsenic (As) [35,36,37]. Some of these heavy metals are considered contaminants in the food chain and there is a requirement to maintain their concentrations in foods below certain thresholds, although there are currently no published maximum statutory limits for As, Cd, or Hg in milk in Europe; while Pb is limited to 20 μg/kg milk [24,38,39]. Brown macroalgae in particular may contain high concentrations of total As but usually with low levels of the toxic inorganic As (e.g., A. nodosum), however, L. digitata is a notable exception to this as it can contain high concentrations of both [40,41]. Supplementation of dairy cow diets with a mixture of U. rigida (green seaweed), S. muticum (brown seaweed) and S. polyschides (brown seaweed), increased As content in milk while Cd and Pb concentration was unaffected [24].
While there is increasing interest of several seaweed species as animal feed, high seasonal and between-species variation in mineral and chemical composition of seaweed species [42,43,44] suggests a need for vigilant screening of seaweeds, as well as the development of corresponding animal feeding strategies. This will ensure that seaweed supplementation to dairy cow diets improves or at least maintains milk yield, quality, and safety characteristics. Therefore, the present study aimed to (i) investigate the effect of feeding a mixture of seaweed (9% Laminaria digitata + 91% Ascophyllum nodosum) to dairy cows at different dietary inclusion rates (0.75% and 1.5% of the concentrate dry matter (DM)) on milk yield and basic composition, along with the concentrations of macrominerals, trace elements and heavy metals, and (ii) estimate the impact that the consumption of milk from seaweed-fed cows may have on consumer mineral intakes.
2. Materials and Methods
2.1. Experimental Design
The current study was conducted during the winter indoor period at Stóra-Ármót farm, Selfoss, Iceland. Animal procedures were reviewed by The Icelandic Food and Veterinary Authority and confirmed that the experiment did not require a license according to the regulation no. 460/2017. Thirty-seven lactating dairy cows of the Icelandic breed were blocked into three groups of 11 to 13 cows each, balanced for parity, lactation stage, milk yield and milk contents of fat, protein, and somatic cell count (SCC). Before the experiment began, all cows received a basal diet made up of 4.8–11.4 kg DM concentrate feed (ingredients list presented in Supplementary Materials, Table S1) according to milk yield, topped up with ad libitum supply of grass silage. Each group was assigned to one of three experimental diets (i) without seaweed supplementation (control, CON), (ii) with seaweed supplementation at 0.75% seaweed in concentrate, DM basis (low seaweed, LSW; 13–40 g seaweed/cow/day), and (iii) 1.5% seaweed in concentrate, DM basis (high seaweed, HSW; 26–158 g seaweed/cow/day). The seaweed mix comprised of 91% Ascophyllum nodosum and 9% Laminaria digitata, on DM basis. These seaweeds were selected because they represent species with high commercial potential as they are abundant and easy to access; the dietary inclusion rate was based on not exceeding maximum levels of heavy metals according to the European Commission. Commission Regulation for maximum levels for As in animal feed, where 2 mg/kg diet DM of inorganic As in the seaweed mixture was the limiting factor [45]. The chemical composition of silage and concentrate are shown in Table 1 and mineral composition of silage, concentrate, and concentrate with seaweed are shown in Table 2. The average chemical composition and mineral composition of the three experimental diets are presented in Tables S2 and S3, respectively, in the Supplementary Materials. Animal data (estimated bodyweight, lactation stage, parity) are presented in Table 3. Feed intake was calculated as described by Butler et al. [46], using estimated bodyweight and milk yield.

Table 1.
Means, standard deviation (SD), minimum and maximum values for the chemical composition of silage and concentrate used in the animal trial.
Table 2.
Means, standard deviation (SD), minimum and maximum values for the mineral composition of silage, concentrate and seaweed used in the animal trial.
Table 3.
Means, standard error (SE) and ANOVA p-values for the effect of the dietary treatment (Control, no seaweed, CON; Low Seaweed, 0.75% concentrate DM, LS; High Seaweed, 1.5% concentrate DM, HS) on animal data, milk production and basic composition and efficiency parameters.
The experiment was carried out over a 7-week period between December 2018 and January 2019. All animals were fed the CON diet for two weeks before the commencement of the 7-week period. The starting week was used as a covariate, where all cows were fed the basal diet, and this was followed by 6-week measurement period where animals were offered experimental diets. Seaweed was gradually introduced to diets. In week 1 of the measurement period, seaweed was provided at approximately 0.25% (13 g/cow/day) and 0.50% (26 g/cow/day) of concentrate DM for LSW and HSW groups, respectively. In weeks 2 to 5, seaweed was provided at 0.75% (19–40 g/cow/day) and 1.5% (79–158 g/cow/day) of concentrate DM for LSW and HSW groups, respectively. In week 6, dietary inclusion rate of seaweed returned to approximately 0.25% (13 g/cow/day) and 0.50% (26 g/cow/day) of concentrate DM for LSW and HSW groups, respectively. Cows were milked twice daily. Milk samples were collected from each cow at the end of each experimental week during the morning and evening milkings, and composite milk samples were stored frozen (at −18 °C) in a 50 mL polypropylene tube. Samples of grass silage were collected once a week (n = 7) during the experimental period and immediately frozen at −18 °C. Samples of concentrate without seaweed were collected in experimental weeks 1, 3, and 5 (n = 3), while samples of concentrate with seaweed were collected in weeks 3 and 5 (n = 2). All feed samples were stored at −18 °C until further analysis.
2.2. Analysis of Milk and Feed for Chemical Composition
The basic composition (fat, protein, casein, lactose, urea, free fatty acids (FFA)) and somatic cell count (SCC) of milk was analyzed using Fourier Transform Infrared Spectroscopy (Combifoss 6000, FOSS, Hilleroed, Denmark) in the laboratories of Auðhumla (Selfoss, Iceland). Samples of silages and concentrates were analyzed for chemical composition (crude protein, CP; fat; sugar; starch; sugar, neutral detergent fiber, NDF; acid detergent fiber, ADF; water soluble carbohydrates, WSC; single cell protein, SCP; indigestible NDF, iNDF; neutral detergent cellulase digestible organic matter, NCDG) at the laboratories of Efnagreining (Hvanneyri, Iceland).
2.3. Quantification of Mineral Concentrations in Milk and Feed
Concentrations of macrominerals, trace elements (except for I) and heavy metals in milk, silage and concentrate feed were quantified according to NMKL method 186 [48], using an Ultra wave Acid Digestion System (Milestone Inc., Sorisole, Italy) for the digestion of samples. An Agilent 7900 quadrupole inductively coupled plasma mass spectrometer (ICP-MS) (Agilent Technologies, Singapore) was used. It was combined with an ultra-high matrix introduction (UHMI) system with a quartz cyclonic spray chamber and MicroMist nebulizer (Glass Expansion, Weilburg, Germany). Concentrations of I in milk and feed samples were quantified according to previously published methods by [49] and British Standards Institution Publication (BS EN 17050:2017), respectively, using ICP-MS (Agilent 7000, Agilent, Singapore). For Sn, Cd, Cr, Ni, Pb and Hg, the majority of the individual measurements (88% for Sn, 96% for Cd, 59% for Cr, 53% for Ni, 82% for Pb and 92% for Hg) were below the limits of quantification (LOQ; Sn, 0.266 μg/kg milk; Cd, 0.099 μg/kg milk; Cr, 0.696 μg/kg milk; Ni, 1.457 μg/kg milk; Pb, 0.335 μg/kg milk; Hg, 0.243 μg/kg milk); and the results of these elements were thus not included in statistical analysis. The scatter plots of all measurements of mineral concentrations in the three experimental treatments, and in relation to LOQ, are presented in supplementary Figure S1 (macrominerals), Figure S2 (trace elements) and Figure S3 (heavy metals). Transfer efficiencies from feed to milk were calculated as follows: 100 × (milk mineral concentration (ug/kg milk) × milk output (kg/d)/diet mineral concentration (ug/kg dry matter) × feed intake (kg dry matter/day)).
2.4. Statistical Analysis
Data were analyzed using a mixed effects model in Minitab 18. In the model, diet, experimental week, and their interaction were used as fixed factors, while cow was set as the random factor [50]. Measurements from the week before the 6-week measurement period, when all cows were fed the same basal diet, were used as a covariate in the model. Normality of residuals were evaluated visually and, while most data showed no deviation from normality, SCC, milk I content, and I intake were log10 transformed prior to analysis so that their residuals were normalized. Fischer’s least significance difference test (p < 0.05) was used for pairwise comparison of the means, where the mixed effect model showed a significant effect of diet, experimental week, or their interaction.
3. Results
3.1. Animal and Diet Parameters
The experimental groups were balanced for parity, lactation stage and bodyweight (Table 3). Parity ranged 1–4, 1–5, and 1–5, in CON, LSW and HSW groups, respectively. Lactation stage in weeks ranged 1–42, 1–68, and 1–47 in CON, LSW and HSW groups, respectively. The dietary treatment influenced seaweed intake which increased from CON to LSW, and LSW to HSW cows, in line with the experimental design (Table 3). Seaweed intake significantly differed between experimental groups, averaging 0 g, 12.8 g, and 50.2 g for CON, LSW, and HSW groups, respectively (Table 3). The DMI, forage:concentrate ratio, silage intake and concentrate intake varied by experimental week (Table 3; Table S4).
3.2. Milk Yield, Basic Composition, and Efficiency
Milk from HSW group cows had 4.1% and 2.2% less protein (g/100 g) and 4.3% and 2.6% less casein (g/100 g), when compared with CON and LSW milk, respectively (Table 3). There was a significant effect of dietary treatment on milk protein and casein concentration. However, milk production, and other compositional and efficiency parameters were not influenced by dietary supplementation of seaweed (Table 3). Milk yield, milk composition (e.g., contents of protein, casein, lactose, whey protein, urea, and FFS), and feed efficiency varied with experimental week (Table 3; Table S4). Individual significant differences between weeks are presented in detail in the Supplementary Materials (Table S4). There was no significant diet × sampling week interaction on milk production, milk basic composition, or efficiency parameters (Table 3).
3.3. Milk Mineral Concentrations
Dietary supplementation of seaweed influenced milk concentrations of Cu, I, Se, and As, with CON milk having a 32.5% higher Cu concentration compared to HSW milk (Table 4). When compared with CON milk, I concentrations were greater in LSW (+90.5%) and HSW milk (+200.8%); while HSW milk had higher (+57.8%) concentrations of I than LSW milk (Table 4). However, the trend was the opposite for Se concentration in milk. When compared with CON milk, concentrations of Se were lower in LSW milk (−6.0%) and HSW milk (−13.4%); while HSW contained less Se (−8.5%) than LSW milk (Table 4). The concentration of As in HSW milk was higher compared with LSW and CON milk (+28.8% and +36.7%, respectively) (Table 4).
Table 4.
Means, standard error (SE) and ANOVA p-values for the effect of the dietary treatment (Control, no seaweed, CON; Low seaweed, 0.75% concentrate DM, LSW; High Seaweed, 1.5% concentrate DM, HSW) on milk mineral concentrations.
The effect of sampling week was significant for all macrominerals, trace elements, and heavy metals assessed (Table S5). Individual significant differences between weeks are presented in detail in the Supplementary Materials (Table S5). The I concentration in milk was influenced by the dietary treatment × sampling week interaction (Figure 1A). Milk I concentration was highest in HSW milk, intermediate in LSW and lowest in CON milk throughout seaweed supplementation period. Their relative difference in milk I concentrations between all experimental groups was higher during weeks 2 and 3 compared with the rest of weeks. HSW contained significantly more I across the experiment than LSW, except for Week 6 where there was not difference between the experimental groups.
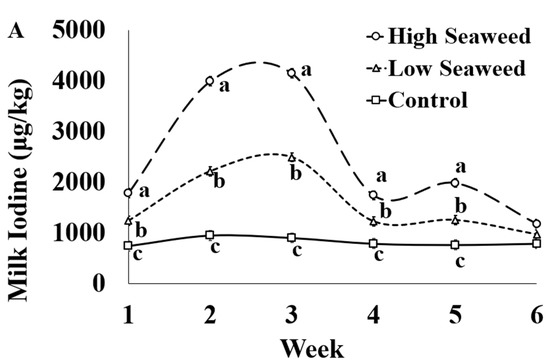
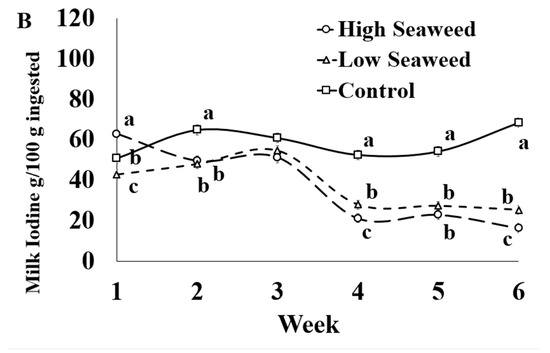
Figure 1.
Interaction means ± SE (error bars) for the effects of dietary treatment (Control, no seaweed, CON; Low seaweed, 0.75% concentrate DM, LSW; High Seaweed, 1.5% concentrate DM, HSW) and week on the concentration of iodine in milk (μg/kg; panel (A); p <0.001) and transfer efficiency (g milk/100 g ingested; panel (B); p < 0.001). Means for diet treatments within a week with different letters are significantly different according to Fisher’s Least Significant Difference test (p < 0.05).
3.4. Estimated Mineral Transfer Efficiencies from Feed to Milk
There was a significant effect of dietary treatment on the estimated transfer efficiency of Cu, I, Se, and Co. The transfer efficiency of Cu was higher (+0.5 μg/kg intake) in CON milk than HSW milk (Table 5). Transfer efficiency of I was higher (+21 μg/kg intake) in CON milk when compared to LSW and HSW milk (Table 5). Similarly, transfer efficiency of Se was higher (+0.7 μg/kg intake and +1.0 μg/kg intake) in CON milk than in LSW and HSW milk, respectively (Table 5). The transfer efficiency of Co was higher (+0.005 μg/kg intake and +0.009 μg/kg intake) in CON milk than LSW and HSW milk, respectively (Table 5).
Table 5.
Means, standard error (SE) and ANOVA p-values for the effect of the dietary treatment (Control, no seaweed, CON; Low seaweed, 0.75% concentrate DM, LSW; High Seaweed, 1.5% concentrate DM, HSW) on estimated transfer efficiency of minerals from feed into milk.
The effect of sampling week was significant on the transfer efficiency of all assessed macrominerals, trace elements, and heavy metals and individual significant differences between weeks are presented in detail in the Supplementary Materials (Table S6).
The only significant effects of the dietary treatment × sampling week interaction mineral transfer efficiency from feed to milk was for I (Table 5). In Week 1, I transfer efficiencies were highest in HSW milk, intermediate in CON milk and lowest in LSW milk. Between Weeks 2 and 6, I transfer efficiencies were higher in CON milk than in LSW and HSW milk (except for Week 3), while LSW also resulted on higher I transfer efficiencies than HSW milk in Weeks 4 and 6 (Figure 1B).
4. Discussion
4.1. Effect of Seaweed Supplementation on Milk Yield, Basic Composition and Efficiency Parameters
In the present study, seaweed supplementation of dairy cow diets did not affect productivity, efficiency, and the basic composition of milk, thus agreeing with previous studies feeding Ascophyllum nodosum and Undaria pinnatifida [10,51,52]. Given that main drivers for productivity, production efficiency and milk composition are animal breed, intakes, and types of forages and concentrates [53,54], it is likely that the relatively small amount of seaweed supplementation to dairy cow diets (0 to 158 g/cow/day) in the present study was not adequate to cause any impact on these parameters. In contrast, Singh et al. [55] reported that S. wightii supplementation at 20% to concentrate DM showed increased milk production in dairy cows. This discrepancy could be attributed to the much larger degree of supplementation as they administered approximately 955 g of seaweed per cow per day and indicated that there might be unidentified bioactive substances within the seaweed that may have positively affected milk yield at such high supplementation rates. The only milk composition parameters affected by seaweed supplementation in the present study were milk protein and casein contents, which were both reduced in case of HSW diets. This is different than the studies of Hong, Kim, Jin, Lee, Choi and Lee [51] and Chaves Lopez, Serio, Rossi, Mazzarrino, Marchetti, Castellani, Grotta, Fiorentino, Paparella and Martino [52], which saw no change in milk protein concentrations with increasing brown seaweed by-products or A. nodosum supplementation, respectively. However, the differences in the present study were numerically marginal as HSW contained only 1.3 g/kg less protein and 1.0 g/kg less casein than CON milk.
4.2. Effect of Seaweed on Milk Mineral Concentrations and Estimated Mineral Transfer Efficiencies from Feed to Milk
4.2.1. Trace Elements
The reduced Cu concentration in milk with increased seaweed supplementation in the present study is in contrast with other studies that showed seaweed supplementation did not impact milk Cu content [24]. In the current study, reduced Cu concentration was found in HSW milk despite the minimal difference in dietary intakes of Cu between experimental groups (614.5 mg/cow/day for CON, 413.1–934.1 mg/cow/day; 602.3 mg/cow/day for LS, 376.1–932.9 mg/cow/day; and 615.1 mg/cow/day for HSW, 403.6–926.9 mg/cow/day). This might indicate that the appearance of Cu into milk might be mediated by physiological or metabolic processes rather than simply Cu intake. Milk Cu concentrations are unaffected by high Cu intakes, but when Cu intakes are restricted below requirement there is a commensurate decrease in milk Cu concentrations [56]. Although Cu availability has not been assessed in this study, a possible explanation might be that Cu availability from the CON was higher than that in seaweed-supplemented diets (in line with the lower Cu transfer efficiency observed in the current study). However, it should be noted that Cu regulation is more complicated than a simple input/output relationship and involves several organ systems [56]. In general, differences between studies may also originate from the use of different species of seaweed, known to affect mineral concentrations [28], which was a mix of A. nodosum and L. digitata in this study and a mix of Ulva rigida, Sargassum muticum, and Saccorhiza polyschides in the study of Rey-Crespo, López-Alonso and Miranda [24], as well as the dietary supplementation level (158 g/cow/day maximum in the present study for the HSW group vs. 100 g/cow/day in study by Rey-Crespo, López-Alonso and Miranda [24]).
In the current study, seaweed supplementation in dairy cow diets increased I concentrations in milk, which is in line with the findings from previous work that investigated the effect of feeding A. nodosum [10,52,57] and kelp powder or Thallus laminariae to dairy cows on milk I concentration [58]. Concentrations of I in raw milk are primarily influenced by diet I concentrations, but in-feed goitrogenic compounds, husbandry practices, and mammary gland hygiene management (teat-dipping) are also determinant factors [10,59,60]. Seaweed is a known rich source of I [26,28] and in the present study, I intake across the experimental period was 35.0 mg/cow/day (21.2–48.5 mg/cow/day), 107 mg/cow/day (60.4–163.6 mg/cow/day), and 178.7 mg/cow/day (60.4–281.1 mg/cow/d) for CON, LSW, and HSW cows, respectively. Therefore, LSW and HSW cows ingested 3.1 and 5.1 times more I, respectively, than CON cows, which could explain the higher concentration of I in the milk from LSW and HSW cows.
In the present study, the diet I concentration was 2.4 mg/kg DM for CON, 7.5 mg/kg DM for LSW and 12.3 mg/kg DM for HSW cows. Given the maximum permitted dietary I concentration is 5 mg/kg DM [61], the I concentration in CON, LS and HS diets was 48%, 150%, and 246% of maximum permitted I concentration, respectively. Notably, at the peak of seaweed supplementation (weeks 2, 3, 5), dietary supply of I to LSW and HSW cows temporarily exceeded 2.2 and 4.0 times of the maximum permitted supply. This indicates that care should be taken when seaweed is supplemented in dairy cow diets for long periods because small amounts of I-rich seaweed may supply far higher amounts of I in dairy cow diets than the maximum permitted intakes. The upper tolerable limit dietary I for cattle is reported to be 50 mg/kg of diet DM [62]. At an average DMI of 14.4 kg/day, as calculated in the present study, the maximum tolerable limit for I intake would be 720 mg/cow/day. Therefore, although LSW and HSW diets exceeded permitted dietary supplementation of I for cattle, I intake by LSW and HSW cows in the current study was, respectively, on average 15% and 25% of the upper tolerable limit for cattle, and never exceeded the 40% of upper tolerable limit. Although the dietary I supply in the current study was much lower than the upper tolerable limit, after one week adaptation in seaweed diets and two weeks after peak seaweed supplementation, the I transfer from feed to milk dropped from 55% and 51% to 28% and 21% in LSW and HSW cows, respectively. In mammals, excessive I intake triggers the Wolff-Chaikoff effect reducing I absorption from the gut to blood [63]. A similar mechanism may not be excluded in dairy cows and therefore, the rapid increase in I supply may have triggered a reduced absorption of I and subsequent supply in the mammary gland and/or a down regulation of the Na+/I- symporter system in the mammary gland; both of which would reflect in reduced I concentrations in milk despite the high intakes. After the end of the experiment, I was monitored for 3 more weeks in the cows that consumed LSW and HSW diets and the transfer efficiencies of I returned to the pre-supplementation levels (52% and 57% for LSW and HSW cows, respectively), only a week after removal of seaweed from the diet, which may indicate that this impact is reversible, at least after the exposure duration to LSW and HSW diets investigated in the present study, when I supply returns to recommended levels; possibly because the Na+/I- symporter system returns to pre-high dose levels.
The reduced Se concentration in milk with increased seaweed supplementation in the present study is in contrast with the findings of a previous study that reported that seaweed supplementation did not impact milk Se concentration [24]. Even though Se intake was not different between experimental groups in the current study (8.4 mg/cow/day for CON (5.7–11.5 mg/cow/day), 8.3 mg/cow/day for LSW (5.3–11.5 mg/cow/day), and 8.5 mg/cow/day for HSW (5.7–11.4 mg/cow/day)), there was still a decrease in milk Se concentration in the LSW and HSW groups. This indicates that the resulting concentrations might be influenced by physiological or metabolic processes rather than being a direct effect of Se intake. Milk Se concentrations are influenced by cow supplementation and feed types (varying widely between different areas [64,65], and has been shown to be increased (albeit short-lived) with dietary Se increases [56]. Another explanation could be in that an increase in sulfur supplied from seaweed, as sulphate is a typical component of marine algal polysaccharides, may antagonize selenium absorption, or that the form of Se found within the treatment feed may affect uptake [24,66,67]. Reduced transfer efficiency might be a consequence of an interaction between Se and Se antagonists thus reducing the uptake and transfer of selenium from feed into milk. The differences between Rey-Crespo, López-Alonso and Miranda [24] and this study can also be explained via the differing species and amount fed to the cows, as described above for Cu.
The decreased Co transfer efficiency with increased seaweed supplementation in the present study was not reflected in the Co content between the experimental groups. This is likely due to differences between the groups and the total Co transfer efficiency results numerically extremely small—as the difference between the highest and lowest transfer efficiency is 0.009%.
4.2.2. Heavy Metals
Increasing seaweed supplementation in cow diets increased As concentrations, thus being in line with Rey-Crespo, López-Alonso and Miranda [24]. This is expected, as the most prominent heavy metal in algae is As, hence the EU there is relevant regulation regarding the maximum amount in algae in feed [41]. As intake across the experimental period was 6.0 mg/cow/day for CON (2.8–14.81 mg/cow/day), 6.7 mg/cow/day for LSW (3.1–15.2 mg/cow/day), and 9.3 mg/cow/day for HSW (4.5–15.6 mg/cow/day). The higher dietary intake of As when seaweed was fed is the most possible reason for the increased As content in milk, as As intake leads to increased milk As content [68]. Any amount of inorganic As (which is more toxic than organic As [69]) in feed or product is recommended to be avoided, and US NRC reports that the maximum tolerable dosage for cattle is 50 mg/kg diet DM [70]. At an average DMI of 14.4 kg/day in the present study, the maximum tolerable limit for inorganic As intake would be 720 mg/cow/day, which is 46 times higher than the maximum As intake in the present study (15.6 mg/cow/day). In the present study, the analysis did not differentiate between organic or inorganic As and diets were designed to supply less than the maximum limits of As in dairy cow diets (2 mg/kg inorganic As and 40 mg/kg total As in the seaweed mixture [45]).
4.3. Nutritional Implications of Milk from Seaweed-Fed Cows for Consumers (I, Cu, Se, As)
Milk is a good source of several macrominerals and trace elements and this has particular importance for different demographics which may have higher requirements or rely more on milk for the supply of minerals across infancy, adolescence, and adulthood [71]. In the present study, the concentrations of Cu, I, Se, and As were affected by seaweed supplementation in dairy cow diets and this would have an effect on consumer intakes of these minerals when consuming milk from seaweed-fed cows. To assess the impact of seaweed supplementation of dairy diets on consumers’ mineral intakes, the mineral intakes from the milk of experimental groups was calculated by multiplying the recorded average milk intakes in Iceland (kg of liquid milk per person per day) with the concentrations of I, Cu, Se, and As (ug, or mg, per kg milk). Following that, the calculated mineral intakes were compared against the nutritional recommendations (reference nutrient intakes (RNI) and upper limits (UL)) by the Icelandic Directorate of Health [72] to assess the % contribution that milk would provide to the RNI, but also investigate whether consumption of any minerals exceeds UL, when milk from different experimental groups would be consumed.
The average consumption of milk in Iceland is 285 g/day, according the most recent available milk sale records (2020) from Icelandic Dairies Association (Samtök afurðastöðva í mjólkuriðnaði); based on this, CON, LSW, and HSW milks would cover 2.7–4.5%, 2.3–3.9%, and 2.0–3.4% of the RNI for Cu in children <10 years of age, respectively; 1.5–1.9%, 1.3–1.7%, and 1.1–1.5% in adolescents and adults ≥10 years of age, respectively; and 1.0–1.4%, 0.9–1.2%, and 0.8–1.0% in nursing mothers and pregnant women, respectively. Given that this amount does not represent a considerable proportion of RNI for Cu for all age groups at Icelandic levels of consumption, it is unlikely that these differences will have a relevance to consumers’ nutrition and health.
Based on the above-referenced average consumption of milk in Iceland, the CON, LSW and HSW milks would cover 196–470%, 373–895% and 589–1413% of the RNI for I in children <10 years of age, respectively; 157%, 299% and 471% of the RNI for I in adolescents and adults ≥10 years of age, respectively; and 117–134%, 224–256% and 353–404% in nursing mothers and pregnant women, respectively. Even consumption of CON milk from the present study, and under the stated milk intakes in Iceland, would provide more than the required I to the population to meet their RNI for I. This is of particular importance because I deficiency prevails globally, occurring in 435.5 million (56.9% of the population) and almost 2 billion (35.2% of the population) people in Europe and globally, respectively [73]. Although in Iceland this was not a public health issue for years, more recent studies have highlighted that specific demographics (including pregnant women) had suboptimal I intake and have associated this with the reduction in milk, dairy and fish consumption [74]. The results for the CON milk in the present study reinforce the important role that milk can play in providing the required amounts of I in human diets. Interestingly, the milk I content of the CON milk (822 μg/kg) was substantially higher than that in countries neighboring Iceland (e.g., 331 μg/kg milk in conventional UK milk [75] 232 μg/L in winter low-fat Norwegian milk [76]; and 670 μg/kg in Irish milk that involved pre- and post-milking teat dipping in I-containing solution [77]). These higher concentrations may be due to the experimental farm being on the banks of the Ölfusá River, a body of water that carries glacial water (commonly rich in I) and at close proximity to the sea (~20 km) [78,79]. Coastal areas have more I in the soil and subsequently produce forage that may also have higher I concentrations [80]. The potential effect of Icelandic cow genetics may not be excluded as it is known that breed can also be a driver for milk I concentrations [75,81]. The combination of even standard milk being rich in I, and the relatively high average consumption of milk in Iceland (26th in the world and 23rd in Europe, [82]), contributed to a high calculated contribution of milk towards the RNI for I.
However, supplementation of dairy diets with seaweed would exacerbate an excessive I intake. The upper limit for I in adults is 600 μg/day, and high consumption of I may induce hypothyroidism, in which susceptible individuals fail to adapt to the acute Wolff-Chaikoff effect, or hyperthyroidism in which vulnerable individuals increase thyroid hormone production due to the rich I substrate, inducing thyrotoxicosis [83]. When comparing these intakes with the recommended UL for adults [72], consumption of CON, LSW and HSW milk would provide 39%, 75% and 118% of the upper limit. This highlights that, although high in I, CON and LSW milk would not provide an amount that would be considered a risk (at a consumption rate of 285 g/day) but drinking milk from the HSW group at the average Icelandic intake levels would exceed the UL for I. From a different perspective, the UL for I intake in adults would be reached by drinking 730 g of CON milk, 383 g of LSW milk, or 243 g of HSW milk. Although Icelandic guidelines were not available for UL in children and adolescents, EFSA [84] recommends that UL for children <10 years of age to be 200–300 μg/day and UL for adolescents (10–17 years of age) to be 450–500 μg/day. Based on this, the UL can be reached by children drinking 243–365 g of the CON milk, 128–192 g of the LSW milk and 81–122 g of the HSW milk. For adolescents, the UL can be reached by children drinking 548–608 g of the CON milk, 287–319 g of the LSW milk and 182–203 g of the HSW milk. It is important however to note that in the present study, I concentrations in LSW and HSW averaged 7.5 and 12.3 mg/kg DM, respectively, while CON diet contained 2.4 mg/kg DM. Such high diet I concentrations as in LSW and HSW groups are unlikely to be provided in commercial herds because I supplementation in dairy diets ought to be less than 5 mg/kg DM [85]. Although these diets do not represent potential commercial examples, and therefore it is unlikely that milk with such high I content would reach the Icelandic market, the findings highlight that extreme care should be taken when seaweed is supplemented to dairy cow diets because even small amounts of I-rich seaweed can not only exceed I allowances in dairy cow diets, but also drastically increase milk I concentrations and potentially pose a nutritional risk to the consumers.
Based on the above-referenced average consumption of milk in Iceland, CON, LSW, and HSW milks would cover 22–44%, 21–42%, and 19–38% of the RNI for Se in children <10 years of age, respectively; 12–17%, 11–16%, and 11–14% in adolescents and adults ≥10 years of age, respectively; and 11%, 11%, and 10% for nursing mothers and pregnant women, respectively. Although milk appears to be among the main suppliers of Se in the Icelandic diets, and seaweed supplementation in dairy diets influences milk Se concentrations, the numerical differences are rather small. As a result, the consumption of CON, LSW or HSW milk would marginally differentiate the proportionate contribution of milk to RNI for Se and it is unlikely that consuming milk from different groups would impact consumer nutrition and health.
As is a toxic heavy metal and should generally be avoided in foodstuffs, as previous nutritional research council reports have not found a biochemical process in which As is required, and that the concept of As essentiality is still to be researched [86]. The WHO provisional guideline recommendation is that As intake should not exceed 10 μg/L in drinking water [87]. The milks in the present study contained 0.46 μg/kg (CON), 0.48 μg/kg (LSW) and 0.62 μg/kg (HSW), thus all having extremely low As concentrations, being only 4.6%, 4.8% and 6.2% of the maximum recommended concentrations in water. Notably, this recommendation for milk As content is paired with the Tropical Agriculture Association’s (TAA) published requirements for humans living in temperate conditions to drink 3 L of water per day [88]; which would provide a recommended maximum As supply of 30 μg/day. In the present study, considering above-referenced average consumption of milk in Iceland, CON, LSW, and HSW milks would account for 0.13, 0.14, and 0.18 μg/day, respectively, which represents 0.4–0.6% of the maximum recommended As intake. Therefore, milk cannot be considered a source of As and the consumption of milk of any experimental group is not associated with any potential As-related risks in human nutrition and health; a finding which also aligns with previous studies using other seaweeds (Ulva rigida, Sargassum muticum, Saccorhiza polyschides, fed at 80.0:17.5:2.5 ratio at 100 g per animal per day) [24]. In addition, it should be noted that the present study has not differentiated between organic and inorganic As, a parameter that also influences toxicity with inorganic As posing a higher toxicity [69]. Therefore, the intakes of inorganic As could be smaller given that a fraction of As in milk, might be present as organic As, however, since the total As concentration is so low a distinction between inorganic and organic As is not relevant from a toxicological point of view [89]. In general, milk is not a source of heavy metals in human diets as only traces were detected, mostly below an already extremely low LOQ, which are far below the maximum recommended levels for milk, and this is not expected to be associated with effects on human health.
5. Conclusions
Seaweed supplementation (9% Laminaria digitata + 91% Ascophyllum nodosum) did not affect cow productivity or milk basic composition, except for a small reduction in milk protein and casein content. However, seaweed supplementation reduced contents of Cu and Se in milk and increased contents of I and As in milk. The increases in milk I and As contents are likely due to the higher dietary supply of I and As, although the lower concentrations of Cu and Se seem to be more associated with a reduction in their transfer efficiencies from diet to milk, when seaweed was included in cows’ diets. Despite the lower milk Cu and Se contents when seaweed was supplemented in dairy diets, the subsequent calculated contribution of the different milks on Cu and Se reference nutrient intakes (based in Icelandic population milk intakes and nutritional guidelines) were marginally different and unlikely to be related with any effect on consumers nutrition or health. This study further emphasizes the main role that milk plays in I supply as even consumption of the control milk would provide more than the required I to the population to meet their RNI for I. However, the findings also showed that extreme care should be taken when seaweed is supplemented to dairy diets because even small amounts of I-rich seaweed can exceed the cow dietary I allowances but also drastically increase milk I concentrations and potentially pose a nutritional risk for consumers. Seaweed supplementation of dairy diets increased As concentrations in milk but milk from all experimental groups contained only traces of As and consumption cannot not be associated with any potential As-related risks in human nutrition and health.
Supplementary Materials
The following are available online at https://www.mdpi.com/article/10.3390/foods10071526/s1, Table S1: Ingredient composition (g/100 g dry matter) of the concentrate feed fed during the animal trial, Table S2: Means, standard deviation (SD), minimum and maximum values for the average chemical composition of the three experimental diets used in the animal trial, Table S3: Means, standard deviation (SD), minimum and maximum values for the average mineral concentrations of the three experimental diets used in the animal trial, Table S4: Means, standard error (SE) and ANOVA p-values for the effect of the dietary treatment (Control, no seaweed, CON; Low Seaweed, 0.75% concentrate DM, LSW; High Seaweed, 1.5% concentrate DM, HSW) on animal data, milk production and basic composition and efficiency parameters. Table S5: Means, standard error (SE) and ANOVA p-values for the effect of the dietary treatment (Control, no seaweed, CON; Low seaweed, 0.75% concentrate DM, LSW; High Seaweed, 1.5% concentrate DM, HSW) on mineral composition within the resulting milk, Table S6: Means, standard error (SE) and ANOVA p-values for the effect of the dietary treatment (Control, no seaweed, CON; Low seaweed, 0.75% concentrate DM, LSW; High Seaweed, 1.5% concentrate DM, HSW) on transfer efficiency of minerals from feed to milk per week, Figure S1: Scatter plots of all measurements of macromineral concentrations in milk samples collected throughout the study from the three experimental groups (▢, control, no seaweed; ×, Low seaweed, 0.75% concentrate DM; ◯, High Seaweed, 1.5% concentrate DM), Figure S2: Scatter plots of all measurements of trace element concentrations in milk samples collected throughout the study from the three experimental groups (▢, control, no seaweed; ×, Low seaweed, 0.75% concentrate DM; ◯, High Seaweed, 1.5% concentrate DM). The horizontal dotted lines represent limits of quantification for each element, Figure S3: Scatter plots of all measurements of heavy metal concentrations in milk samples collected throughout the study from the three experimental groups (▢, control, no seaweed; ×, Low seaweed, 0.75% concentrate DM; ◯, High Seaweed, 1.5% concentrate DM). The horizontal dotted lines represent limits of quantification for each element.
Author Contributions
Conceptualization, Á.H.P. and S.S.; data curation, E.E.N., K.G., S.S., C.B. and Á.H.P.; formal analysis, E.E.N., P.R. and S.S.; funding acquisition, Á.H.P. and S.S.; investigation, Á.H.P., K.G. and E.E.N.; methodology, Á.H.P., S.S., E.E.N., P.R. and D.J.; project administration, Á.H.P. and S.S.; resources, Á.H.P. and S.S.; software, Á.H.P., S.S. and P.R.; supervision, Á.H.P., S.S., P.R., N.D. and D.J.; validation, Á.H.P., E.E.N. and S.S.; visualization, E.E.N.; writing—Original draft, E.E.N. and S.S.; writing—Review and editing, E.E.N., Á.H.P., G.R., C.B., N.D., K.G., D.J., P.R., and S.S. All authors have read and agreed to the published version of the manuscript.
Funding
The authors would like to acknowledge Agricultural fund of Iceland (Framleiðnisjóður landbúnaðarins, Grant Numbers 18-039 and 20-025) for funding the research work, and the University of Reading for funding the analysis of milk and feed samples for iodine.
Institutional Review Board Statement
Animal procedures were reviewed by The Icelandic Food and Veterinary Authority and confirmed that the experiment did not require a license according to the regulation no. 460/2017.
Informed Consent Statement
Not applicable.
Data Availability Statement
The raw data presented in this study are available on request from the corresponding author.
Acknowledgments
The farmers Höskuldur Gunnarsson and Hilda Pálmadóttir at the experimental farm Stóra-Ármót, Iceland, are thanked for their efforts and work. Helga Gunnlaugsdóttir (Orkidea) and Jóhannes Sveinbjörnsson (Agricultural University of Iceland) are acknowledged for their much-appreciated advice on the experimental design. Sveinn Sigurmundsson (Agricultural Society of South Iceland) is thanked for his effort in getting the project started. The authors would like to thank Christopher Humphrey for his guidance on milk and feed analysis for iodine.
Conflicts of Interest
The authors declare that no conflict of interest.
References
- Roque, B.M.; Brooke, C.G.; Ladau, J.; Polley, T.; Marsh, L.J.; Najafi, N.; Pandey, P.; Singh, L.; Kinley, R.; Salwen, J.K.; et al. Effect of the macroalgae Asparagopsis taxiformis on methane production and rumen microbiome assemblage. Anim. Microbiome 2019, 1, 3. [Google Scholar] [CrossRef] [Green Version]
- Roque, B.M.; Salwen, J.K.; Kinley, R.; Kebreab, E. Inclusion of Asparagopsis armata in lactating dairy cows’ diet reduces enteric methane emission by over 50 percent. J. Clean. Prod. 2019, 234, 132–138. [Google Scholar] [CrossRef]
- Cherry, P.; Yadav, S.; Strain, C.R.; Allsopp, P.J.; McSorley, E.M.; Ross, R.P.; Stanton, C. Prebiotics from Seaweeds: An Ocean of Opportunity? Mar. Drugs 2019, 17, 327. [Google Scholar] [CrossRef] [Green Version]
- Makkar, H.P.S.; Tran, G.; Heuzé, V.; Giger-Reverdin, S.; Lessire, M.; Lebas, F.; Ankers, P. Seaweeds for livestock diets: A review. Anim. Feed. Sci. Technol. 2016, 212, 1–17. [Google Scholar] [CrossRef]
- Kinley, R.D.; Martinez-Fernandez, G.; Matthews, M.K.; de Nys, R.; Magnusson, M.; Tomkins, N.W. Mitigating the carbon footprint and improving productivity of ruminant livestock agriculture using a red seaweed. J. Clean. Prod. 2020, 259, 120836. [Google Scholar] [CrossRef]
- Gegg, P.; Wells, V. UK Macro-Algae Biofuels: A Strategic Management Review and Future Research Agenda. J. Mar. Sci. Eng. 2017, 5, 32. [Google Scholar] [CrossRef] [Green Version]
- Ferdouse, F.L.H.; Susan, L.; Smith, R.; Murúa, P.; Yang, Z. The Global Status of Seaweed Production, Trade and Utilization; Food and Agriculture Organization of the UN: Rome, Italy, 2018; p. 120. [Google Scholar]
- Saker, K.E.; Fike, J.H.; Veit, H.; Ward, D.L. Brown seaweed- (TascoTM) treated conserved forage enhances antioxidant status and immune function in heat-stressed wether lambs. J. Anim. Physiol. Anim. Nutr. 2004, 88, 122–130. [Google Scholar] [CrossRef] [PubMed]
- Braden, K.W.; Blanton, J.R., Jr.; Allen, V.G.; Pond, K.R.; Miller, M.F. Ascophyllum nodosum supplementation: A preharvest intervention for reducing Escherichia coli O157:H7 and Salmonella spp. in feedlot steers. J. Food Prot. 2004, 67, 1824–1828. [Google Scholar] [CrossRef]
- Antaya, N.T.; Ghelichkhan, M.; Pereira, A.B.D.; Soder, K.J.; Brito, A.F. Production, milk iodine, and nutrient utilization in Jersey cows supplemented with the brown seaweed Ascophyllum nodosum (kelp meal) during the grazing season. J. Dairy Sci. 2019, 102, 8040–8058. [Google Scholar] [CrossRef]
- Moroney, N.C.; O’Grady, M.N.; Robertson, R.C.; Stanton, C.; O’Doherty, J.V.; Kerry, J.P. Influence of level and duration of feeding polysaccharide (laminarin and fucoidan) extracts from brown seaweed (Laminaria digitata) on quality indices of fresh pork. Meat Sci. 2015, 99, 132–141. [Google Scholar] [CrossRef]
- de la Moneda, A.; Carro, M.D.; Weisbjerg, M.R.; Roleda, M.Y.; Lind, V.; Novoa-Garrido, M.; Molina-Alcaide, E. Variability and Potential of Seaweeds as Ingredients of Ruminant Diets: An In Vitro Study. Animals 2019, 9, 851. [Google Scholar] [CrossRef] [PubMed] [Green Version]
- Belanche, A.; Jones, E.; Parveen, I.; Newbold, C.J. A Metagenomics Approach to Evaluate the Impact of Dietary Supplementation with Ascophyllum nodosum or Laminaria digitata on Rumen Function in Rusitec Fermenters. Front. Microbiol. 2016, 7, 299. [Google Scholar] [CrossRef]
- Buschmann, A.; Camus, C.; Infante Rosselot, J.; Neori, A.; Israel, A.; Hernández-González, M.; Pereda, S.; Gomez Pinchetti, J.L.; Golberg, A.; Tadmor Shalev, N.; et al. Seaweed production: Overview of the global state of exploitation, farming and emerging research activity. Eur. J. Phycol. 2017, 52, 391–406. [Google Scholar] [CrossRef]
- Ugarte, R.; Sharp, G. Management and production of the brown algae Ascophyllum nodosum in the Canadian maritimes. J. Appl. Phycol. 2012, 24, 409–416. [Google Scholar] [CrossRef]
- Capuzzo, E.; McKie, T. Seaweed in the UK and aborad—Status, Products, Limitations, Gaps and Cefas Role; Centre for Environment, Fisheries & Aquacultural Science: Suffolk, UK, 2016. [Google Scholar]
- Shukla, P.S.; Mantin, E.G.; Adil, M.; Bajpai, S.; Critchley, A.T.; Prithiviraj, B. Ascophyllum nodosum-Based Biostimulants: Sustainable Applications in Agriculture for the Stimulation of Plant Growth, Stress Tolerance, and Disease Management. Front. Plant Sci. 2019, 10, 655. [Google Scholar] [CrossRef] [Green Version]
- Borges, D.; Araujo, R.; Azevedo, I.; Pinto, I.S. Sustainable management of economically valuable seaweed stocks at the limits of their range of distribution: Ascophyllum nodosum (Phaeophyceae) and its southernmost population in Europe. J. Appl. Phycol. 2020, 32, 1365–1375. [Google Scholar] [CrossRef]
- Edwards, M.; Watson, L. Aquaculture Explained: Cultivating Laminaria Digitata; BIM Bord Iascaigh Mhara, Irish Sea Fisheries Board: Dublin, Ireland, 2015. [Google Scholar]
- Davoult, D.; Engel, C.; Arzel, P.; Knoch, D.; Laurans, M. Environmental factors and commercial harvesting: Exploring possible links behind the decline of the kelp Laminaria digitata in Brittany, France. Cah. Biol. Mar. 2011, 52, 429–435. [Google Scholar]
- Brantsæter, A.L.; Knutsen, H.; Johansen, N.; Nyheim, K.; Erlund, I.; Meltzer, H.; Henjum, S. Inadequate Iodine Intake in Population Groups Defined by Age, Life Stage and Vegetarian Dietary Practice in a Norwegian Convenience Sample. Nutrients 2018, 10, 230. [Google Scholar] [CrossRef] [PubMed] [Green Version]
- Karatzia, M.; Christaki, E.; Bonos, E.; Karatzias, C.; Florou-Paneri, P. The influence of dietary Ascophyllum nodosum on haematologic parameters of dairy cows. Ital. J. Anim. Sci. 2012, 11, e31. [Google Scholar] [CrossRef]
- Rayman, M.; Bath, S. The new emergence of iodine deficiency in the UK: Consequences for child neurodevelopment. Ann. Clin. Biochem. 2015, 52, 705–708. [Google Scholar] [CrossRef] [PubMed] [Green Version]
- Rey-Crespo, F.; López-Alonso, M.; Miranda, M. The use of seaweed from the Galician coast as a mineral supplement in organic dairy cattle. Animal 2014, 8, 580–586. [Google Scholar] [CrossRef]
- Zhou, M.; Hünerberg, M.; Chen, Y.; Reuter, T.; McAllister, T.A.; Evans, F.; Critchley, A.T.; Guan, L.L. Air-dried brown seaweed, Ascophyllum nodosum, alters the rumen microbiome in a manner that changes rumen fermentation profiles and lowers the prevalence of foodborne pathogens. mSphere 2018, 3, e17–e18. [Google Scholar] [CrossRef] [PubMed] [Green Version]
- Circuncisão, A.R.; Catarino, M.D.; Cardoso, S.M.; Silva, A.M.S. Minerals from Macroalgae Origin: Health Benefits and Risks for Consumers. Mar. Drugs 2018, 16, 400. [Google Scholar] [CrossRef] [PubMed] [Green Version]
- Lorenzo, J.M.; Agregán, R.; Munekata, P.E.S.; Franco, D.; Carballo, J.; Şahin, S.; Lacomba, R.; Barba, F.J. Proximate composition and nutritional value of three macroalgae: Ascophyllum nodosum, Fucus vesiculosus and Bifurcaria bifurcata. Mar. Drugs 2017, 15, 360. [Google Scholar] [CrossRef] [Green Version]
- Pereira, L. A Review of the Nutrient Composition of Selected Edible Seaweeds; Nova Science Publishers Inc.: Athens, GA, USA, 2011; pp. 15–47. [Google Scholar]
- Smith, D.G.; Young, E.G. The combined amino acids in several species of marine algae. J. Biol. Chem. 1955, 217, 845–853. [Google Scholar] [CrossRef]
- Gaillard, C.; Bhatti, H.S.; Novoa-Garrido, M.; Lind, V.; Roleda, M.Y.; Weisbjerg, M.R. Amino acid profiles of nine seaweed species and their in situ degradability in dairy cows. Anim. Feed. Sci. Technol. 2018, 241, 210–222. [Google Scholar] [CrossRef]
- Górska-Warsewicz, H.; Rejman, K.; Laskowski, W.; Czeczotko, M. Milk and Dairy Products and Their Nutritional Contribution to the Average Polish Diet. Nutrients 2019, 11, 1771. [Google Scholar] [CrossRef] [Green Version]
- Haug, A.; Høstmark, A.T.; Harstad, O.M. Bovine milk in human nutrition--a review. Lipids Health Dis. 2007, 6, 1–16. [Google Scholar] [CrossRef] [Green Version]
- Thorning, T.; Raben, A.; Tholstrup, T.; Soedamah-Muthu, S.; Givens, I.; Astrup, A. Milk and dairy products: Good or bad for human health? An assessment of the totality of scientific evidence. Food Nutr. Res. 2016, 60, 32527. [Google Scholar] [CrossRef] [Green Version]
- Antaya, N.T.; Soder, K.J.; Kraft, J.; Whitehouse, N.L.; Guindon, N.E.; Erickson, P.S.; Conroy, A.B.; Brito, A.F. Incremental amounts of Ascophyllum nodosum meal do not improve animal performance but do increase milk iodine output in early lactation dairy cows fed high-forage diets. J. Dairy Sci. 2015, 98, 1991–2004. [Google Scholar] [CrossRef] [PubMed] [Green Version]
- Besada, V.; Andrade, J.; Schultze, F.; Gonzalez, J. Heavy metals in edible seaweeds commercialised for human consumption. J. Mar. Syst. 2009, 75, 305–313. [Google Scholar] [CrossRef]
- Pomin, V.H. Seaweed: Ecology, Nutrient Composition, and Medicinal Uses; Nova Science Publishers, Inc.: New York, NY, USA, 2011; p. 248. [Google Scholar]
- Smith, J.L.; Summers, G.; Wong, R. Nutrient and heavy metal content of edible seaweeds in New Zealand. N. Z. J. Crop. Hortic. Sci. 2010, 38, 19–28. [Google Scholar] [CrossRef]
- Commision Regulation (EC). Consolidated text: Commission Regulation (EC) No 1881/2006 of 19 December 2006 setting maximum levels for certain contaminants in foodstuffs. Off. J. Eur. Union L 2006, 187, 11–15. [Google Scholar]
- EFSA. Dietary exposure to inorganic arsenic in the European population. EFSA J. 2014, 12. [Google Scholar] [CrossRef]
- Ronan, J.M.; Stengel, D.B.; Raab, A.; Feldmann, J.; O’Hea, L.; Bralatei, E.; McGovern, E. High proportions of inorganic arsenic in Laminaria digitata but not in Ascophyllum nodosum samples from Ireland. Chemosphere 2017, 186, 17–23. [Google Scholar] [CrossRef]
- Pétursdóttir, Á.H.; Gunnlaugsdóttir, H. Selective and fast screening method for inorganic arsenic in seaweed using hydride generation inductively coupled plasma mass spectrometry (HG-ICPMS). Microchem. J. 2019, 144, 45–50. [Google Scholar] [CrossRef]
- El-Said, G.; El-Sikaily, A. Chemical composition of some seaweed from Mediterranean Sea coast, Egypt. Environ. Monit. Assess. 2012, 185, 6089–6099. [Google Scholar] [CrossRef] [Green Version]
- Mišurcová, L. Chemical Composition of Seaweeds. In Handbook of Marine Macroalgae; TBU Publications: Zlín, Czech Republic, 2012; pp. 171–192. [Google Scholar]
- Mwalugha, H.; Wakibia, J.; Kenji, G.; Mwasaru, M. Chemical Composition of Common Seaweeds from the Kenya Coast. J. Food Res. 2015, 4, 28. [Google Scholar] [CrossRef]
- European Commission. Commission Regulation (EU) 2015/186 of 6 February 2015 Amending Annex I to Directive 2002/32/EC of the European Parliament and of the Council as Regards Maximum Levels for Arsenic, Fluorine, Lead, Mercury, Endosulfan and Ambrosia Seeds Text with EEA Relevance; European Commission: Brussels, Belgium, 2015. [Google Scholar]
- Butler, G.; Nielsen, J.H.; Slots, T.; Seal, C.; Eyre, M.D.; Sanderson, R.; Leifert, C. Fatty acid and fat-soluble antioxidant concentrations in milk from high- and low-input conventional and organic systems: Seasonal variation. J. Sci. Food Agric. 2008, 88, 1431–1441. [Google Scholar] [CrossRef]
- Sjaunja, L.O.; Junkkarinen, L.; Pedersen, J.; Setala, J. A Nordic proposal for an energy corrected milk (ECM) formula. In Proceedings of the 27th Session International Committee for Recording and Productivity of Milk Animals, Paris, France, 2–6 July 1990; pp. 1156–1157. [Google Scholar]
- NordVal International. Trace Elements—As, Cd, Hg, Pb and Other Elements: Determination by ICP-MS after Pressure Digestion; NMKL: Tamil Nadu, India, 2007; p. 186. [Google Scholar]
- Payling, L.M.; Juniper, D.T.; Drake, C.; Rymer, C.; Givens, D.I. Effect of milk type and processing on iodine concentration of organic and conventional winter milk at retail: Implications for nutrition. Food Chem. 2015, 178, 327–330. [Google Scholar] [CrossRef] [PubMed]
- Minitab (Version 18). Minitab 18: Session Commands; Minitab. Inc.: State College, PA, USA, 2019; Available online: https://support.minitab.com/en-us/minitab/18/session_commands.pdf (accessed on 17 March 2021).
- Hong, Z.S.; Kim, E.J.; Jin, Y.C.; Lee, J.S.; Choi, Y.J.; Lee, H.G. Effects of Supplementing Brown Seaweed By-products in the Diet of Holstein Cows during Transition on Ruminal Fermentation, Growth Performance and Endocrine Responses. Asian Aust. J. Anim. Sci. 2015, 28, 1296–1302. [Google Scholar] [CrossRef] [PubMed] [Green Version]
- Chaves Lopez, C.; Serio, A.; Rossi, C.; Mazzarrino, G.; Marchetti, S.; Castellani, F.; Grotta, L.; Fiorentino, F.P.; Paparella, A.; Martino, G. Effect of diet supplementation with Ascophyllum nodosum on cow milk composition and microbiota. J. Dairy Sci. 2016, 99, 6285–6297. [Google Scholar] [CrossRef] [PubMed]
- Stergiadis, S.; Leifert, C.; Seal, C.J.; Eyre, M.D.; Nielsen, J.H.; Larsen, M.K.; Slots, T.; Steinshamn, H.; Butler, G. Effect of Feeding Intensity and Milking System on Nutritionally Relevant Milk Components in Dairy Farming Systems in the North East of England. J. Agric. Food Chem. 2012, 60, 7270–7281. [Google Scholar] [CrossRef]
- Stergiadis, S.; Bieber, A.; Franceschin, E.; Isensee, A.; Eyre, M.D.; Maurer, V.; Chatzidimitriou, E.; Cozzi, G.; Bapst, B.; Stewart, G.; et al. Impact of US Brown Swiss genetics on milk quality from low-input herds in Switzerland: Interactions with grazing intake and pasture type. Food Chem. 2015, 175, 609–618. [Google Scholar] [CrossRef] [PubMed]
- Singh, B.; Chopra, R.; Rai, S.; Verma, M.; Mohanta, R. Nutritional Evaluation of Seaweed on Nutrient Digestibility, Nitrogen Balance, Milk Production and Composition in Sahiwal Cows. Proc. Natl. Acad. Sci. India Sect. B Biol. Sci. 2015, 87, 437–443. [Google Scholar] [CrossRef]
- Suttle, N. Mineral Nutrition of Livestock, 4th ed.; Cabi: Wallingford, UK, 2010; pp. 1–547. [Google Scholar]
- Sorge, U.S.; Henriksen, M.; Bastan, A.; Cremers, N.; Olsen, K.; Crooker, B.A. Short communication: Iodine concentrations in serum, milk, and tears after feeding Ascophyllum nodosum to dairy cows—A pilot study. J. Dairy Sci. 2016, 99, 8472–8476. [Google Scholar] [CrossRef] [PubMed] [Green Version]
- Xue, F.; Sun, F.; Jiang, L.; Hua, D.; Wang, Y.; Nan, X.; Zhao, Y.; Xiong, B. Effects of Partial Replacment of Dietary Forage Using Kelp Powder (Thallus laminariae) on Ruminal Fermentation and Lactation Performances of Dairy Cows. Animals 2019, 9, 852. [Google Scholar] [CrossRef] [PubMed] [Green Version]
- Schöne, F.; Leiterer, M.; Lebzien, P.; Bemmann, D.; Spolders, M.; Flachowsky, G. Iodine concentration of milk in a dose–response study with dairy cows and implications for consumer iodine intake. J. Trace Elem. Med. Biol. 2009, 23, 84–92. [Google Scholar] [CrossRef] [PubMed]
- Flachowsky, G.; Franke, K.; Meyer, U.; Leiterer, M.; Schöne, F. Influencing factors on iodine content of cow milk. Eur. J. Nutr. 2013, 53, 351–365. [Google Scholar] [CrossRef]
- EFSA. Scientific Opinion on the safety and efficacy of iodine compounds (E2) as feed additives for all species: Calcium iodate anhydrous and potassium iodide, based on a dossier submitted by HELM AG. EFSA J. 2013, 11, 3101. [Google Scholar] [CrossRef]
- NRC. Mineral Tolerance of Animals; The National Academies Press: Washington, DC, USA, 2005. [Google Scholar]
- Arriagada, A.A.; Albornoz, E.; Opazo, M.C.; Becerra, A.; Vidal, G.; Fardella, C.; Michea, L.; Carrasco, N.; Simon, F.; Elorza, A.A.; et al. Excess Iodide Induces an Acute Inhibition of the Sodium/Iodide Symporter in Thyroid Male Rat Cells by Increasing Reactive Oxygen Species. Endocrinology 2015, 156, 1540–1551. [Google Scholar] [CrossRef] [Green Version]
- Ammerman, C.B.; Miller, S.M. Selenium in Ruminant Nutrition: A Review1. J. Dairy Sci. 1975, 58, 1561–1577. [Google Scholar] [CrossRef]
- Grace, N.D.; Lee, J.; Mills, R.A.; Death, A.F. Influence of Se status on milk Se concentrations in dairy cows. N. Z. J. Agric. Res. 1997, 40, 75–78. [Google Scholar] [CrossRef]
- Galbraith, M.; Vorachek, W.; Estill, C.; Whanger, P.; Bobe, G.; Davis, T.; Hall, J. Rumen Microorganisms Decrease Bioavailability of Inorganic Selenium Supplements. Biol. Trace Elem. Res. 2016, 171, 338–343. [Google Scholar] [CrossRef]
- Netto, A.S.; Zanetti, M.A.; Correa, L.B.; Del Claro, G.R.; Salles, M.S.V.; Vilela, F.G. Effects of dietary selenium, sulphur and copper levels on selenium concentration in the serum and liver of lamb. Asian Aust. J. Anim. Sci. 2014, 27, 1082–1087. [Google Scholar] [CrossRef] [Green Version]
- Hameed, A.; Akhtara, S.; Amjada, A.; Naeema, I.; Tariqa, M. Comparative Assessment of Arsenic Contamination in Raw Milk, Infant Formulas and Breast Milk. J. Dairy Vet. Sci. 2019, 13, 555851. [Google Scholar]
- Cubadda, F.; Jackson, B.P.; Cottingham, K.L.; Van Horne, Y.O.; Kurzius-Spencer, M. Human exposure to dietary inorganic arsenic and other arsenic species: State of knowledge, gaps and uncertainties. Sci. Total Environ. 2017, 579, 1228–1239. [Google Scholar] [CrossRef] [PubMed] [Green Version]
- Bampidis, V.; Nistor, E.; Nitas, D. Arsenic, cadmium, lead and mercury as undesirable substances in animal feeds. Scientific Pap. Anim. Sci. Biotechnol. 2013, 46, 17–22. [Google Scholar]
- Scholz-Ahrens, K.E.; Ahrens, F.; Barth, C.A. Nutritional and health attributes of milk and milk imitations. Eur. J. Nutr. 2020, 59, 19–34. [Google Scholar] [CrossRef] [PubMed]
- Iceland, Department of Health. Ráðlagðir Dagskammtar (RDS) af Ýmsum Vítamínum; Department of Health: Reykjavík, Iceland, 2013.
- WHO. Iodine Deficiency in Europe: A Continuing Public Health Problem; WHO: Geneva, Switzerland, 2007. [Google Scholar]
- Adalsteinsdottir, S.; Tryggvadottir, E.; Hrolfsdottir, L.; Halldorsson, T.; Birgisdottir, B.; Hreidarsdottir, I.; Hardardottir, H.; Arohonka, P.; Erlund, I.; Gunnarsdottir, I. Insufficient iodine status in pregnant women as consequence of dietary changes. Food Nutr. Res. 2020, 64. [Google Scholar] [CrossRef] [PubMed] [Green Version]
- Qin, N.; Faludi, G.; Beauclercq, S.; Pitt, J.; Desnica, N.; Petursdottir, A.; Newton, E.E.; Angelidis, A.; Givens, I.; Juniper, D.; et al. Macromineral and Trace Element Concentrations and Their Seasonal Variation in Milk from Organic and Conventional Dairy Herds; Elsevier: Amsterdam, The Netherlands, 2021; p. 129865. [Google Scholar]
- Dahl, L.; Opsahl, J.; Meltzer, H.; Julshamn, K. Iodine concentration in Norwegian milk and dairy products. Br. J. Nutr. 2003, 90, 679–685. [Google Scholar] [CrossRef]
- O’Brien, B.; Gleeson, D.E.; Jordan, K. Iodine concentrations in milk. Ir. J. Agric. Food Res. 2013, 209–216. [Google Scholar]
- Hansen, K. Iceland’s Raging Rivers. Available online: https://earthobservatory.nasa.gov/images/145408/icelands-raging-rivers (accessed on 28 June 2021).
- Nyström, H.F.; Brantsæter, A.L.; Erlund, I.; Gunnarsdottir, I.; Hulthén, L.; Laurberg, P.; Mattisson, I.; Rasmussen, L.B.; Virtanen, S.; Meltzer, H.M. Iodine status in the Nordic countries—Past and present. Food Nutr. Res. 2016, 60, 31969. [Google Scholar] [CrossRef] [PubMed]
- Jensen, H.; Orth, B.; Reiser, R.; Bürge, D.; Lehto, N.; Almond, P.; Gaw, S.; Thomson, B.; Lilburne, L.; Robinson, B. Environmental Parameters Affecting the Concentration of Iodine in New Zealand Pasture. J. Environ. Qual. 2019, 48, 1517–1523. [Google Scholar] [CrossRef] [Green Version]
- Franke, A.A.; Bruhn, J.C.; Osland, R.B. Factors Affecting Iodine Concentration of Milk of Individual Cows. J. Dairy Sci. 1983, 66, 997–1002. [Google Scholar] [CrossRef]
- FAOSTAT. Food Supply-Livestock and Fish Primary Equivalent; FAOSTAT: Rome, Itlay, 2013. [Google Scholar]
- Leung, A.M.; Braverman, L.E. Consequences of excess iodine. Nat. Rev. Endocrinol. 2014, 10, 136–142. [Google Scholar] [CrossRef] [Green Version]
- EFSA. Tolerable Upper Intake Levels for Vitamins and Minerals; EFSA: Parma, Italy, 2006. [Google Scholar]
- NRC. Nutrient Requirements of Dairy Cattle, 7th ed.; National Academy Press: Washington, DC, USA, 2001. [Google Scholar]
- Hughes, M.F.; Beck, B.D.; Chen, Y.; Lewis, A.S.; Thomas, D.J. Arsenic exposure and toxicology: A historical perspective. Toxicol. Sci. 2011, 123, 305–332. [Google Scholar] [CrossRef] [Green Version]
- Ravenscroft, P.; Brammer, H.; Richards, K. Arsenic Pollution: A Global Synthesis; Wiley-Blackwell: Chichester, UK, 2009; pp. 387–454. [Google Scholar] [CrossRef]
- Grandjean, A. Water Requirements, Impinging Factors, and Recommended Intakes. Nutr. Drink. Water 2009. Available online: https://aloyoun.com.sa/documentation/nutrientsindw.pdf#page=34 (accessed on 28 June 2021).
- Jackson, B.P.; Taylor, V.F.; Punshon, T.; Cottingham, K.L. Arsenic concentration and speciation in infant formulas and first foods. Pure Appl. Chem. 2012, 84, 215–223. [Google Scholar] [CrossRef] [PubMed] [Green Version]

Publisher’s Note: MDPI stays neutral with regard to jurisdictional claims in published maps and institutional affiliations. |
© 2021 by the authors. Licensee MDPI, Basel, Switzerland. This article is an open access article distributed under the terms and conditions of the Creative Commons Attribution (CC BY) license (https://creativecommons.org/licenses/by/4.0/).