1. Introduction
Microwave heating offers an easy, fast, and convenient way of preparing food for consumers [
1,
2]. In addition, it has several other advantages such as prompt electric control, energy efficiency, and non-pollution of the environment [
3] due to the use of clean energy [
4]. Therefore, microwave heating is extensively used on a domestic scale and is also gradually used in industrial applications [
3,
5]. The applications of microwave heating in the food processing sector can be various including reheating, tempering, defrosting, cooking, baking, pasteurization, sterilization, drying, etc. [
2].
Although microwave heating in principle provides a volumetric and, thus, a more uniform heat processing compared to conventional heating by conduction or convection [
2], one of the main limitations of microwave heating is non-uniform temperature distribution of the processed sample [
6]. This limitation can result in overheat processing in hot spots and, simultaneously, possibly unsafe heat processing in cold spots of processed foods. This issue is at least partially related to an uneven distribution of the electromagnetic field inside the microwave cavity [
2]. Therefore, although microwave heat processing has an irreplaceable position in households, it has so far not been exploited to its fullest potential in industrial applications, especially in the food industry [
7]. In fact, to actually achieve uniform volumetric microwave heating is an ideal aim and therefore the subject of ongoing research and development in the food industry [
5].
One promising technology is the application of solid-state microwave generators instead of magnetrons [
1,
8,
9,
10,
11]. In solid-state microwave technology, the initial phase of the varying field can be controlled at any electromagnetic inlet port and, thus, the position of the nodes and antinodes can be changed in a targeted manner. Moreover, the power of any port can be changed independently to increase the number of electric field patterns in the solid-state microwave system. In this system, the frequency can be changed dynamically to change the resonant mode number [
5,
12,
13]. Finally, although magnetron microwave systems can only be switched on/off for several seconds during heat processing, providing a coarse control, solid-state microwave systems can provide both coarse and fine control (switching on/off for microsecond), which makes the power delivery much more linear and controllable in this system [
10]. Therefore, solid-state microwave systems can potentially replace traditional magnetron microwave systems in the near future [
9,
14].
Moreover, shape [
15], position, and orientation of the samples are factors to improve microwave heating uniformity [
11]. In the paper by Taghian Dinani, Hasić, Auer, and Kulozik (2020) [
16], we compared three different shapes of samples including spherical, cylindrical, and cuboid shapes. In this paper, the cuboid shape was suggested as the best, perfectly showing the changes of microwave field distribution. Taghian Dinani, Kubbutat, and Kulozik (2020) [
11] compared two positions of cuboid samples in both magnetron and solid-state systems: at the center and near the edge of the turntable. However, the orientation of cuboid samples in the center of the turntable has not been investigated until now. Considering sample placement inside the microwave cavity, in particular, vertical and horizontal orientation can be effective and should be investigated. By changing the orientation of that sample from vertical to horizontal, not only is the sample surface in physical contact with the turntable, but also the sample surfaces exposed to the microwaves are changed. In this case, the microwave field distribution may be changed inside the microwave cavity. In addition, by changing the orientation of the sample from vertical to horizontal and by the selection of different horizontal orientations, the position of the sample relative to the microwave port is changed. Therefore, it can be effective for microwave absorption and microwave field distribution in the sample. Therefore, the goal of this study was to investigate the effects of the vertical and horizontal orientation of samples and orientation variants in terms of the angle relative to the microwave inlet port and changing positions in the cavity on microwave heat uniformity. Differences between samples processed in the magnetron and the solid-state microwave system were compared. To the best of our knowledge, a study combining all these factors in comparing different vertical and horizontal orientations in both magnetron and solid-state microwave systems is lacking. As a model sample, gellan gel cubes containing Maillard reaction reactants were used. The famous Maillard reaction is a non-enzymatic browning process that occurs between amino acids and reducing sugars [
17]. The brown color formation during the Maillard reaction can be used and measured for three-dimensional visualization of the heating pattern of samples during microwave processing [
18,
19]. In other words, the application of the time-temperature mapping technique of the Maillard chemical marker method is an appropriate tool to monitor microwave heat uniformity inside the microwave heated samples for the optimization and controlling of microwave processes [
20,
21,
22,
23]. Moreover, this method offers a reliable and fast visual and optical procedure to detect the position of cold and hot spots in the heated sample [
11,
24]. To analyze the heating patterns of samples, Maillard reaction-related color changes and temperature distribution measured by an infrared camera were used.
2. Materials and Methods
2.1. Identifying Parallel Output Power Levels in Each Orientation for Microwave Heat Processing in Both Microwave Generators
Since the primary goal was to compare the effect of different sample orientations on the heat uniformity of the model food systems, it was important to expose them to a similar level of absorbed power in similar orientations in both solid-state and magnetron microwave systems. In other words, for an impartial comparison of each orientation in both microwave systems, the equivalent output power levels for both microwave systems in each orientation should be adjusted to lead to similar levels of absorbed power in the samples [
11]. In this study, the output power level of 300 W was picked for all samples processed in different orientations in the magnetron microwave system. Therefore, corresponding parallel output power levels for each orientation were identified in the solid-state microwave system to obtain the same absorbed powers in both microwave systems, as explained in the following.
To measure the power absorbed by samples in both magnetron and solid-state microwave systems, double deionized (DDI) water was used as a model system to easily measure the temperature increase. Although the characteristics of DDI water such as its dielectric properties are different in comparison to the solid gellan gel samples, a liquid sample such as DDI water needs to be used to determine the absorbed power levels in the microwave systems. It is related to the fact that it is necessary to mix the sample very quickly after microwave heat processing to have an even temperature distribution in the whole sample, and thus provide the opportunity to conveniently measure the sample temperature for the calculation of absorbed microwave energy by the sample. Therefore, the energy absorption by samples at different orientations and in both microwave systems can be determined with negligible errors and very precisely to have a fair comparison of different orientations and microwave systems using this procedure [
11]. In more detail, two Teflon beakers with the same shape and internal dimensions representing vertical and horizontal gellan gel samples were prepared (
Figure 1). Then, they were filled with 58 g of DDI water with a temperature between 0 °C and 10 °C. This weight equals the weight of one gellan gel cuboid sample with dimensions of 3.2 cm × 3.2 cm × 6 cm with the described formula and production procedure in
Section 2.2. It is worth mentioning that the DDI water was previously cooled down to prevent excessive evaporation during microwave heat processing for 120 s. This time duration was similar to the microwave heat processing time of the gellan gel samples in different orientations.
Next, the output power levels of 100 W, 300 W, and 440 W in the magnetron microwave system and 50 W, 150 W, 250 W, and 300 W in the solid-state microwave system were applied for each orientation. It must be noted that in the magnetron microwave system, other power levels than 300 W such as 100 W and 440 W were investigated to establish a linear relationship between the absorbed power and output power levels in this microwave system. To measure the absorbed power, the temperature of DDI water inside the Teflon beaker was measured after fine water stirring right before and after microwave heating with a thermocouple (Testo 108, Testo SE & CO, Titisee-Neustadt, Germany). Then, the absorbed power (Pabs) was calculated with this equation [
10,
11,
25]:
In Equation (1), m is the weight of the DDI water sample (58 g); cp is the specific heat capacity of water (4.187 J g−1 K−1 at ambient pressure); ΔT is the temperature difference between the start and end of the heat processing; and Δt is the duration of microwave heat processing (120 s). For each orientation and power level, three replications were performed.
In the next step, the mean values of three replications of absorbed power (
y-axis) were plotted against the output power (
x-axis) in the solid-state microwave system for each orientation and the linear equations were calculated. Then, the absorbed power of the magnetron system at the output power of 300 W in a similar orientation was inserted in the related linear equation to calculate the adjusted output power in the solid-state system. Therefore, the calculated parallel output power levels in the solid-state microwave system for each orientation resulted in a similar absorbed power level as the magnetron microwave system at the output power level of 300 W. All equations and calculated parallel output power levels of different sample orientations are summarized in
Table 1.
2.2. Preparation of Gellan Gel Cuboids
To prepare gellan gel samples, the formulation and preparation methods of our previous paper [
20] were used. In more detail, the liquid mixture containing
l-lysine (2%),
d-ribose (2%), gellan gum (1.5%), calcium chloride dehydrate (0.59%), anatase titanium dioxide (0.01%), and double deionized (DDI) water (93.9%) was prepared. This formulation was selected after several trials. It is important to mention that in designing a suitable model food system, it is crucial to find the optimal concentrations of initial Maillard substrates as well as other ingredients to provide a detectable increment in Maillard color changes of the processed sample during or after microwave heat processing [
18]. Furthermore, it is necessary to prevent color changes at saturated color changes in the whole sample. The prepared gel solution with the temperature of 77 °C was quickly poured into cubical molds with internal cross-sections of 3.2 cm × 3.2 cm, which were placed in an ice bath to make the cooling process faster and prevent the Maillard color changes of the gels before the microwave heat processing. When the gels cooled down completely, they were taken out of the molds and stored at the temperature of 10 °C overnight. To process the gels the next day, the gels were cut into 6 cm high pieces before microwave heat processing.
2.3. Microwave Heat Processing of Gellan Gel Cuboids
For microwave heat processing, the gels were taken from the cooling storage room. Then, they were cut to a length of 6 cm. At the end, each sample was 6.0 cm long, 3.2 cm wide, and 3.2 cm high. For the microwave heat processing of samples, they were placed on round Teflon plates (
Figure 2) with a cavity custom-sized to fit the gels. The Teflon is a non-dielectric substance [
26] and it was used to prevent heat conduction between the heated gellan gel sample and the turntable and thus provide better recognition of the heated sample in the infrared (IR) pictures. For microwave heat processing of the samples, the cavity was 6.0 cm long and 3.2 cm wide for all horizontal positions, while it was a square with 3.2 cm length for both vertical positions. The cavities of both Teflon plates were 2 mm deep. These cavities were designed to put samples on the Teflon plates at a similar place and at their center the whole time (
Figure 2). The advantage of using Teflon plates for microwave heat processing of samples is that they are almost insulated from microwaves and thus are not considerably affected by microwave heating. Therefore, they make it easier to distinguish between the sample and surrounding area in the thermal images.
Then, the gellan gel cuboid samples were processed for 120 s at a frequency of 2.45 GHz with magnetron (Panasonic NN-SD681S, Panasonic, Japan) and solid-state (FM–SSMWG–500 W 2.45 GHz, Fricke und Mallah Microwave Technology GmbH, Peine, Germany) microwave generators using the described output power levels for each orientation (see
Table 1). It is worth mentioning that both magnetron and solid-state microwave cavities were fragmented according to the four cardinal directions (0° as north, 90° as east, 180 as south, and 270 as west) to be able to name each of the seven investigated orientations. These seven orientations are displayed in
Figure 3 and the following abbreviations were used to distinguish them:
H–0°–OFF: Horizontal orientation in north–south direction without turntable rotation.
H–135°–OFF: Horizontal orientation in northwest–southeast direction without turntable rotation.
H–45°–OFF: Horizontal orientation in southwest–northeast direction without turntable rotation.
H–90°–OFF: Horizontal orientation in west–east direction without turntable rotation.
H–ON: Horizontal orientation with turntable rotation.
V–OFF: Vertical orientation without turntable rotation.
V–ON: Vertical orientation with turntable rotation.
Figure 3.
Seven investigated orientations in both the solid-state and magnetron microwave cavities. The abbreviations of V, H, ON, and OFF represent vertical orientation, horizontal orientation, turntable on, and turntable off, respectively.
Figure 3.
Seven investigated orientations in both the solid-state and magnetron microwave cavities. The abbreviations of V, H, ON, and OFF represent vertical orientation, horizontal orientation, turntable on, and turntable off, respectively.
After microwave heat processing, the heated samples were quickly removed from the microwave cavity and cut into four even slices with the same thickness of 8 mm using a bread-cutting machine (E16, Ritterwerk GmbH, Sendling, Germany).
Figure 4 shows that each slice was labeled with a letter and each surface was labeled with a number. Therefore, it is possible to name every surface clearly by combining slice letters and surface numbers (
Figure 4).
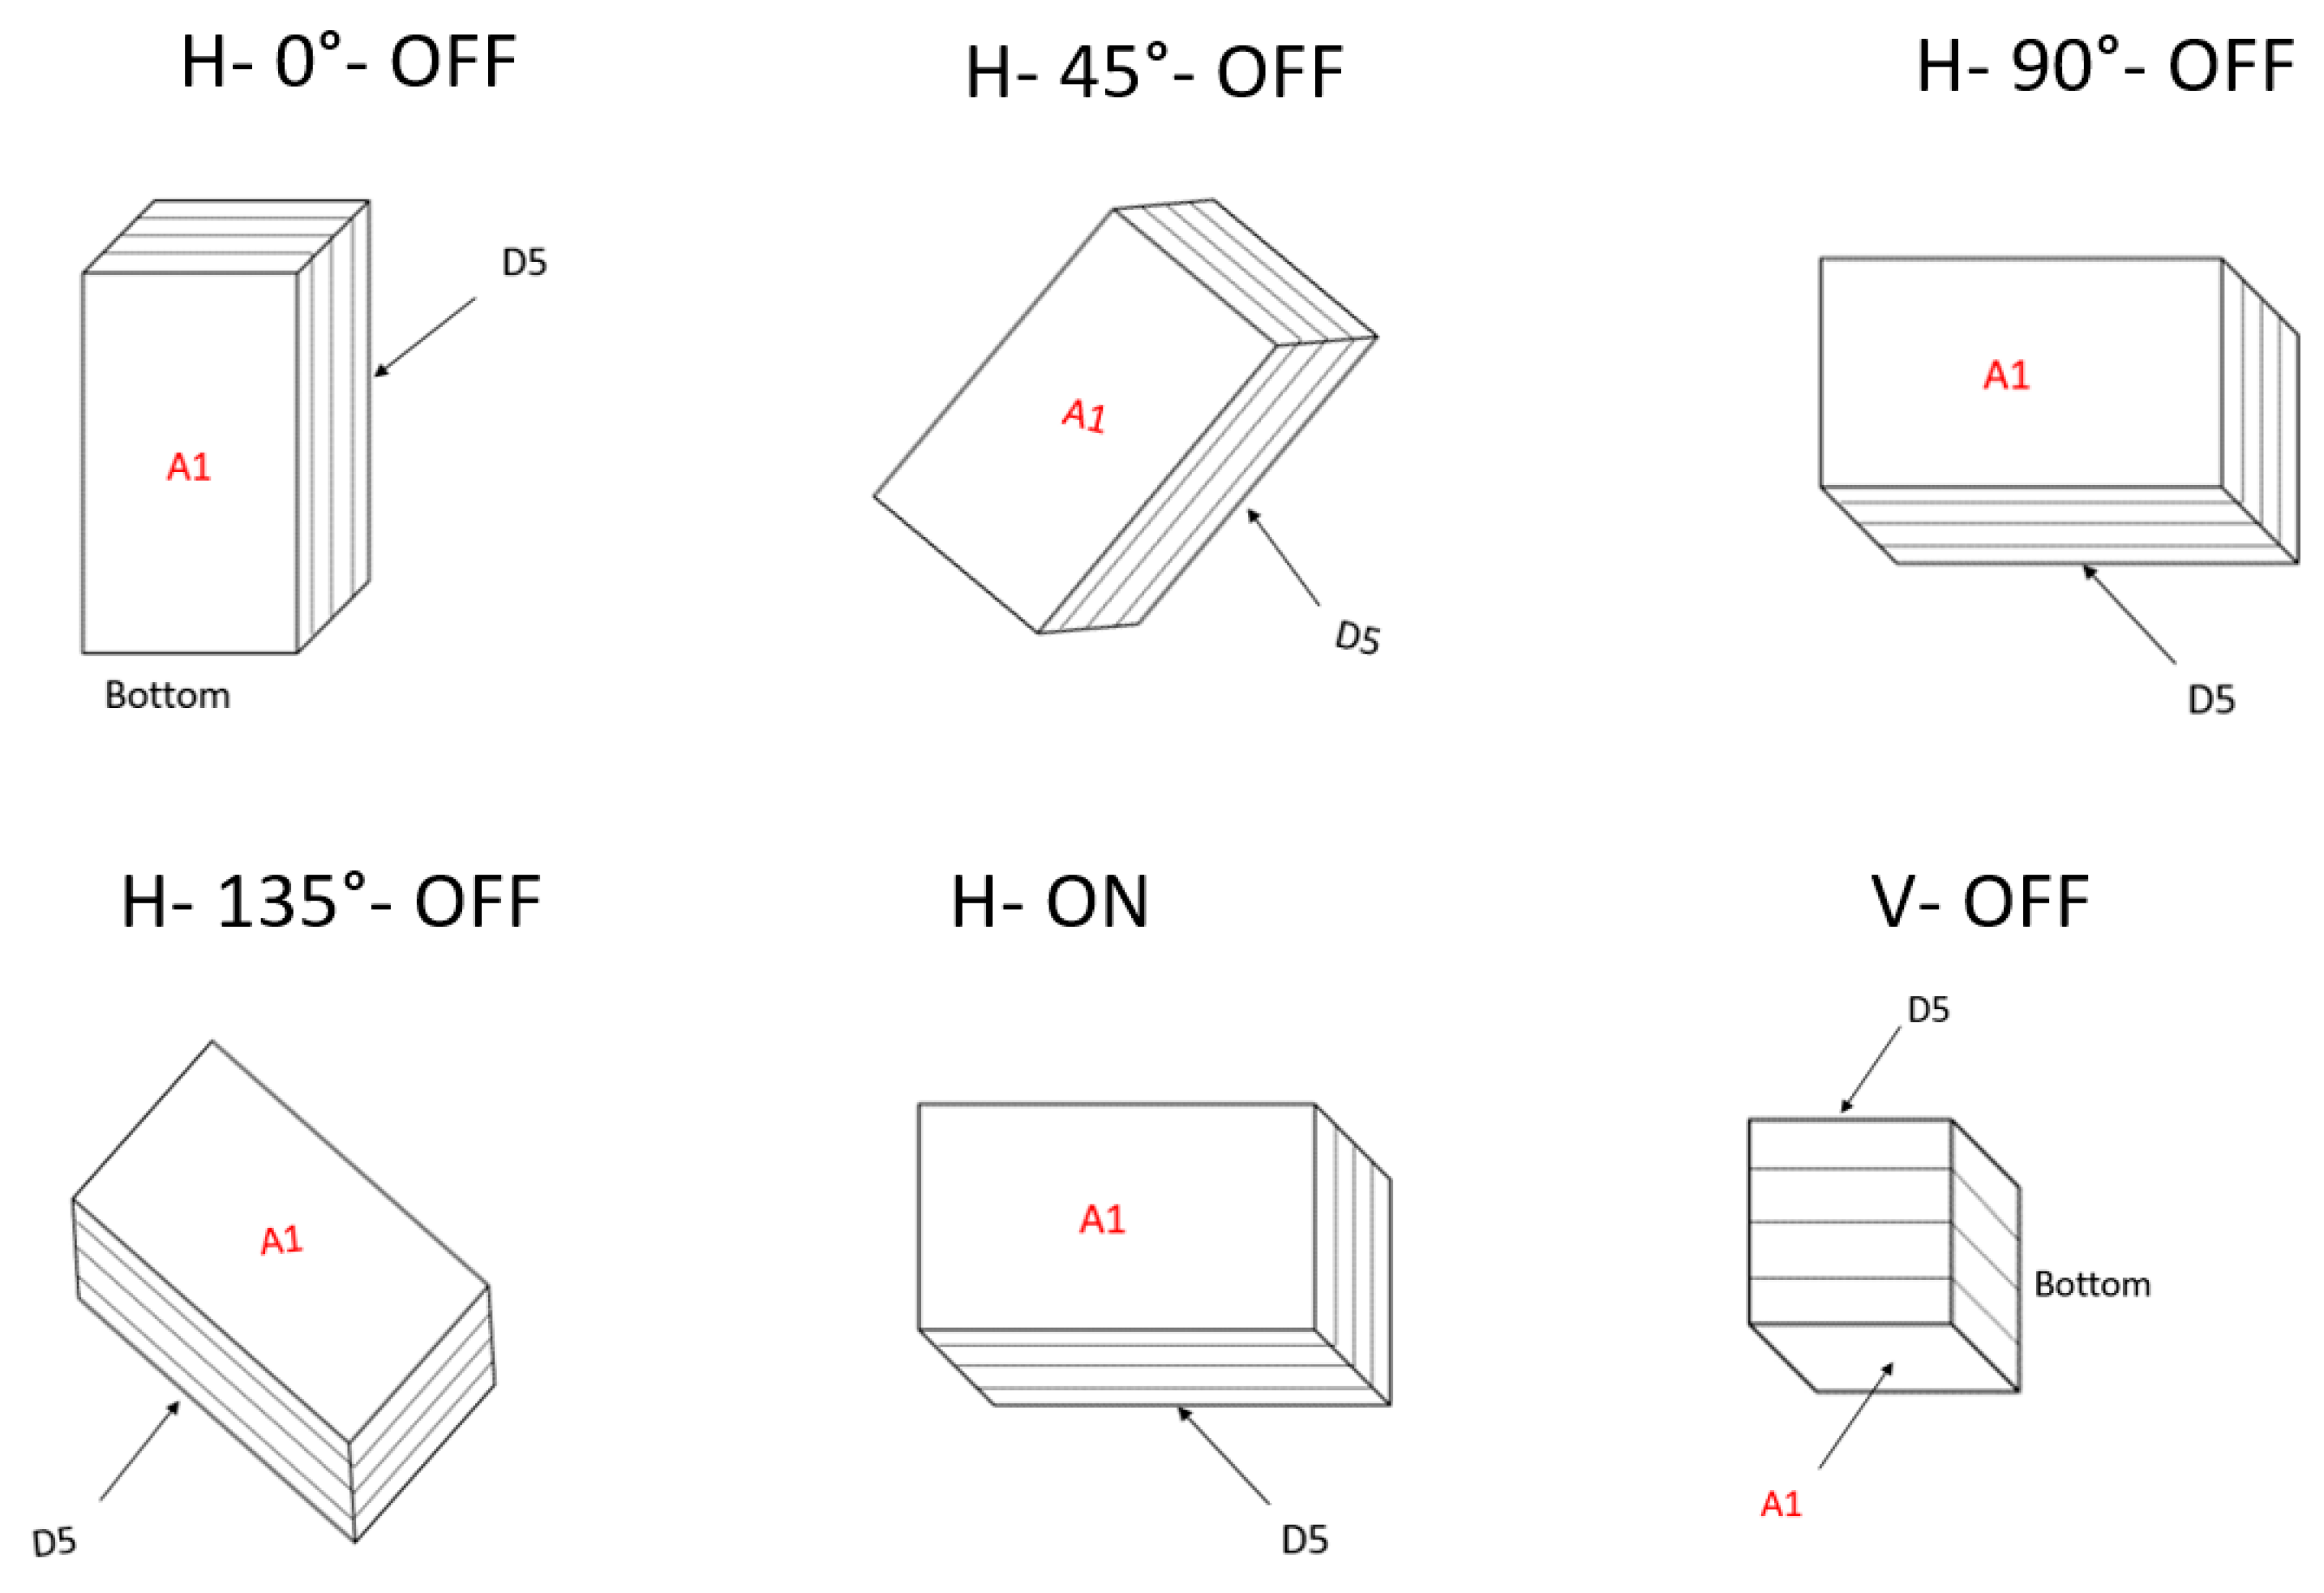
In addition, since all gel samples were processed in different orientations, it was important to define the cutting procedure for each orientation and always follow the same procedure for all its replications. It can be seen in
Figure 5 that for each horizontal orientation (H–90°–OFF, H–0°–OFF, H–135°–OFF, H–45°–OFF, H–ON, and V–ON), the top surface of the sample was assigned as A1 and the bottom surface was assigned as D5. However, for V–OFF orientation, the lateral surface in front of the microwave door was considered as A1 and the opposite lateral surface was assigned as D5 (see
Figure 5).
In this orientation, the bottom of the sample seen in the posters represents the part of each sample surface that has contact with the turntable. For V–ON orientation, the sample and its lateral surfaces were rotated during microwave heat processing and thus one of the four lateral surfaces was randomly assigned as A1. Finally, after cutting the samples, the gel slices were cooled using a mixture of ice, water, and sodium chloride (NaCl) in a box covered with a thin plastic sheet to ensure that the gel samples did not absorb water. With this quick decline in temperature, any further Maillard reaction was stopped after the microwave heat processing.
2.4. Thermal Pictures
After the gellan gel samples were heated in the microwave systems for 2 min and before their cutting, thermal (IR) pictures were taken from their A1 surface (see
Figure 5) with an infrared camera (FLIR E53, FLIR Systems Inc., Wilsonville, OR, USA). Afterward, the thermal pictures were edited with special software (FLIR tools) to make the picture more accessible for interpretation. Most importantly, the color scale was changed to a “rainbow color palette” ranging from 20 °C to 100 °C. In the following IR pictures, low temperatures are presented in purple and dark blue and high temperatures are presented in red and white. It is important to mention that IR pictures were not taken from DDI in the Teflon beakers during identifying parallel output power levels, which was described in
Section 2.1. In this case, only correlation between absorbed and output powers for different sample orientations in both microwave systems are presented in Figure 6.
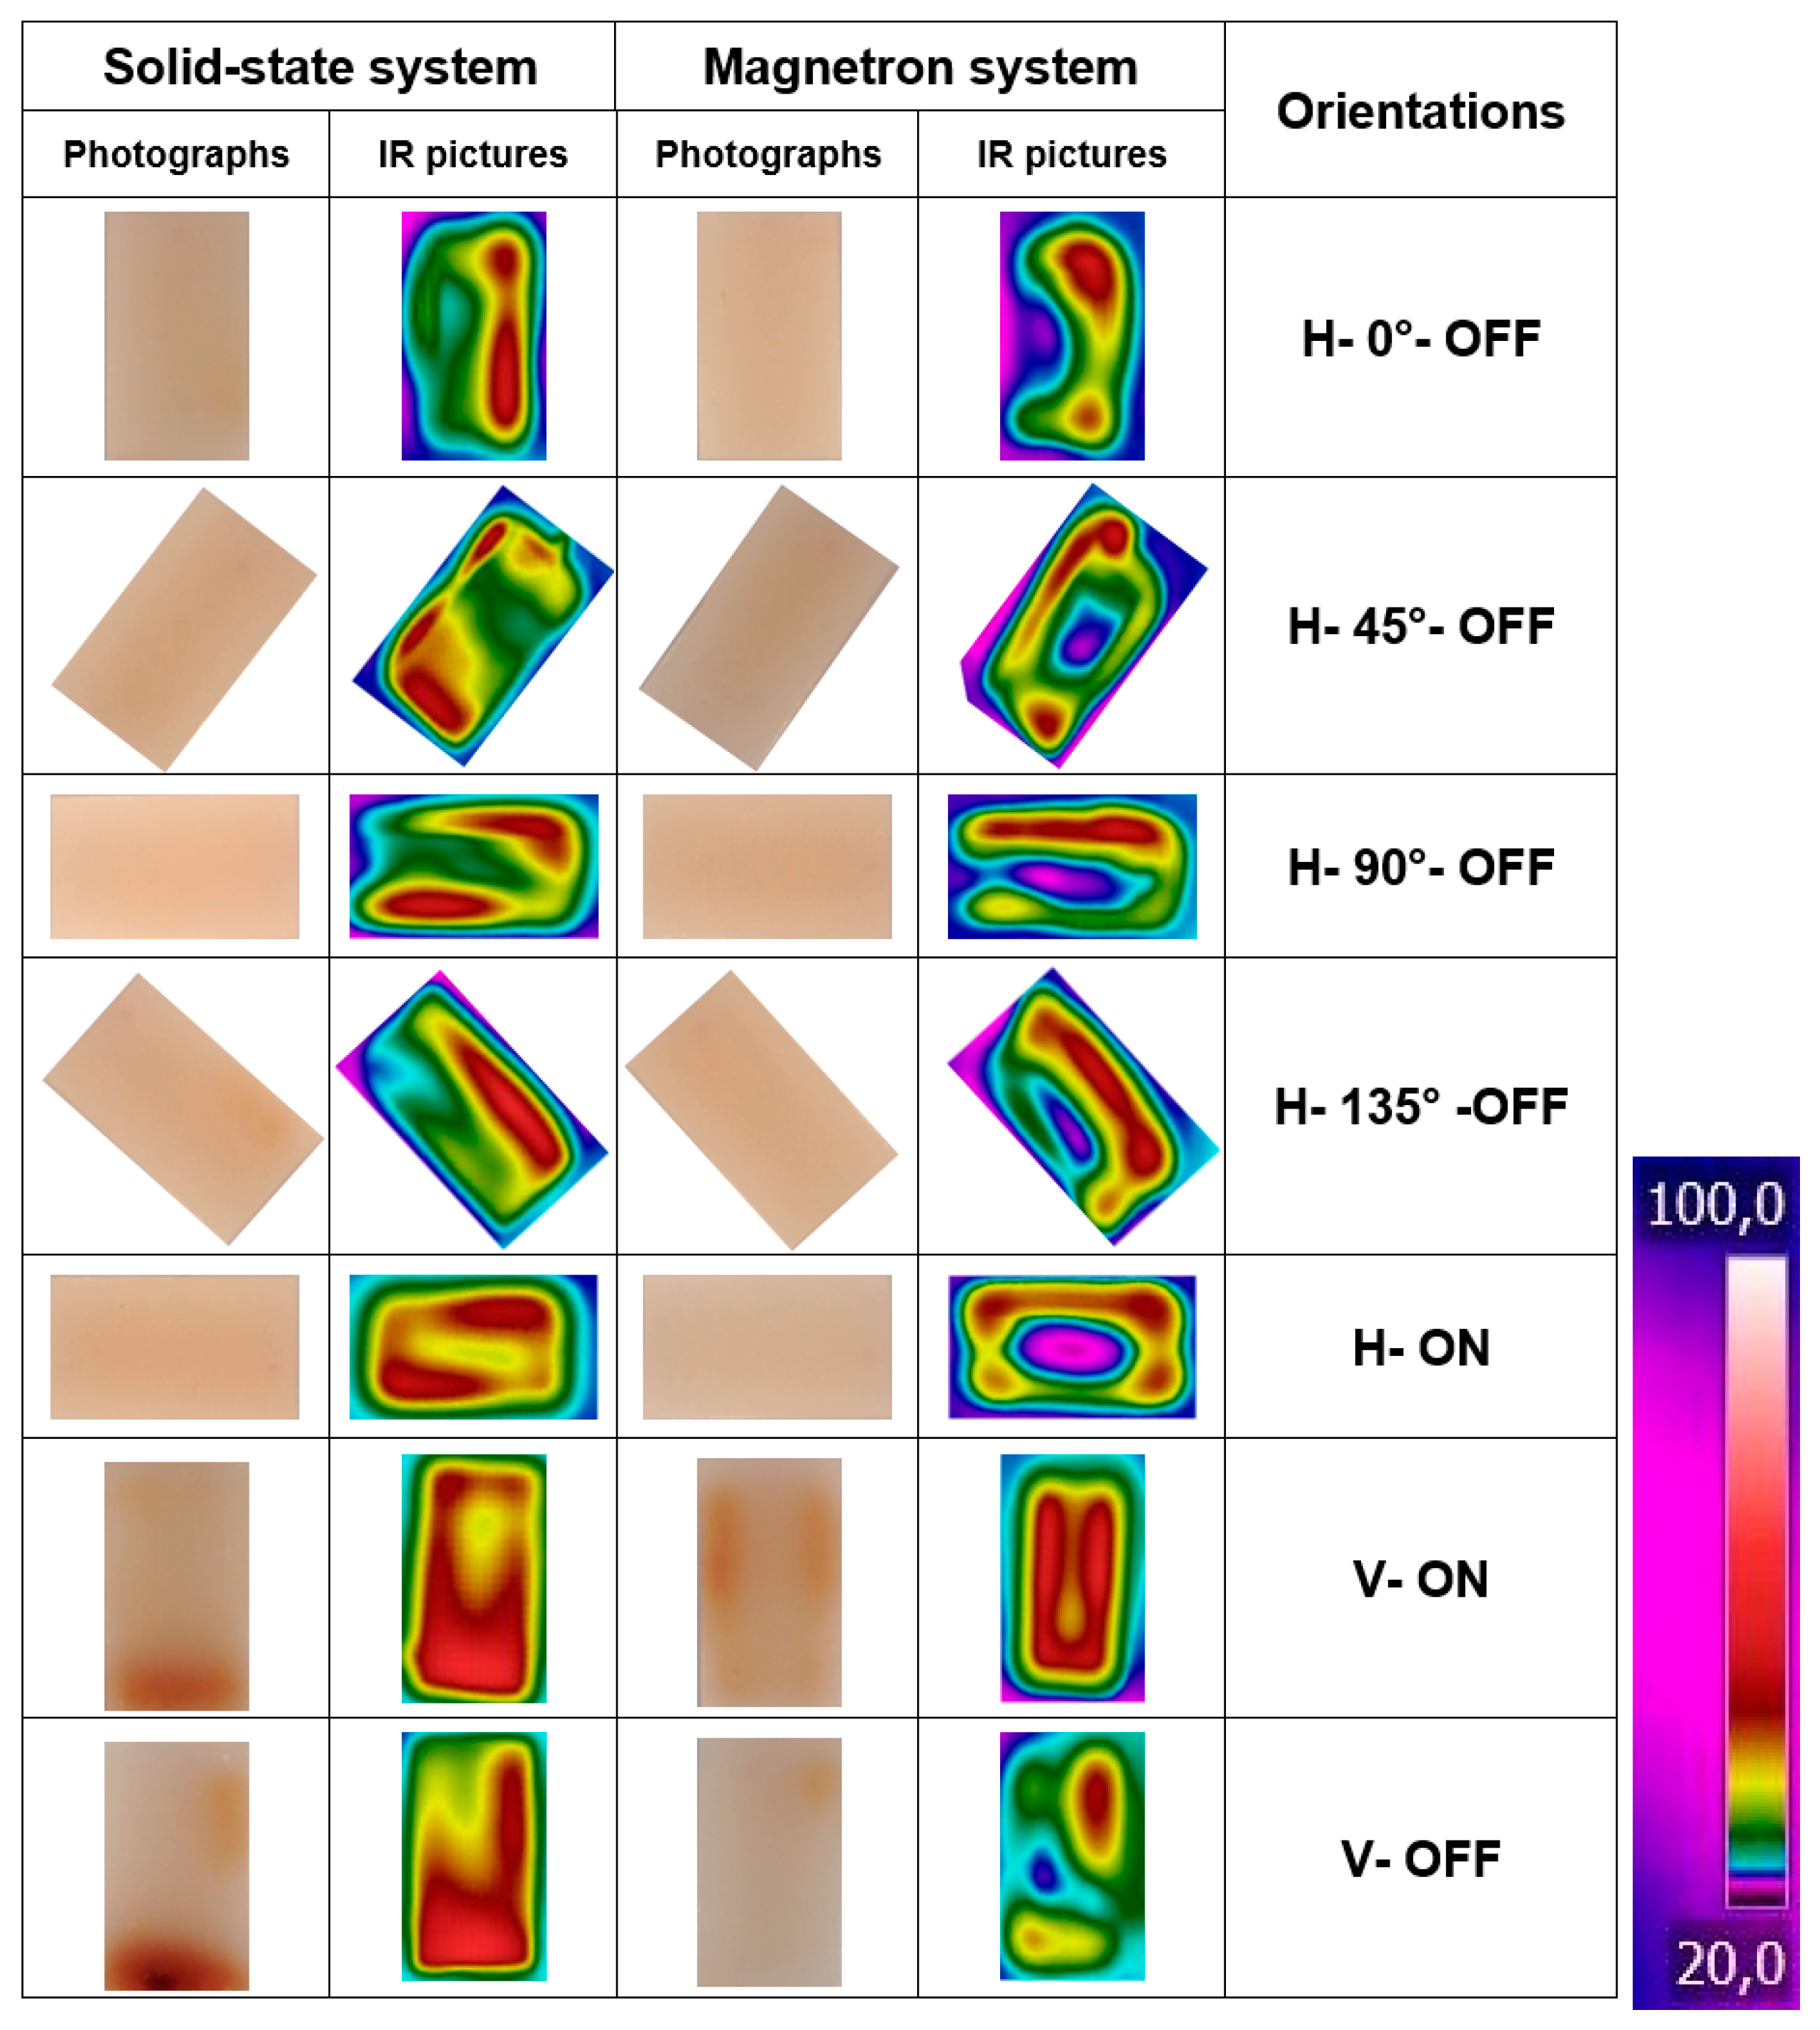
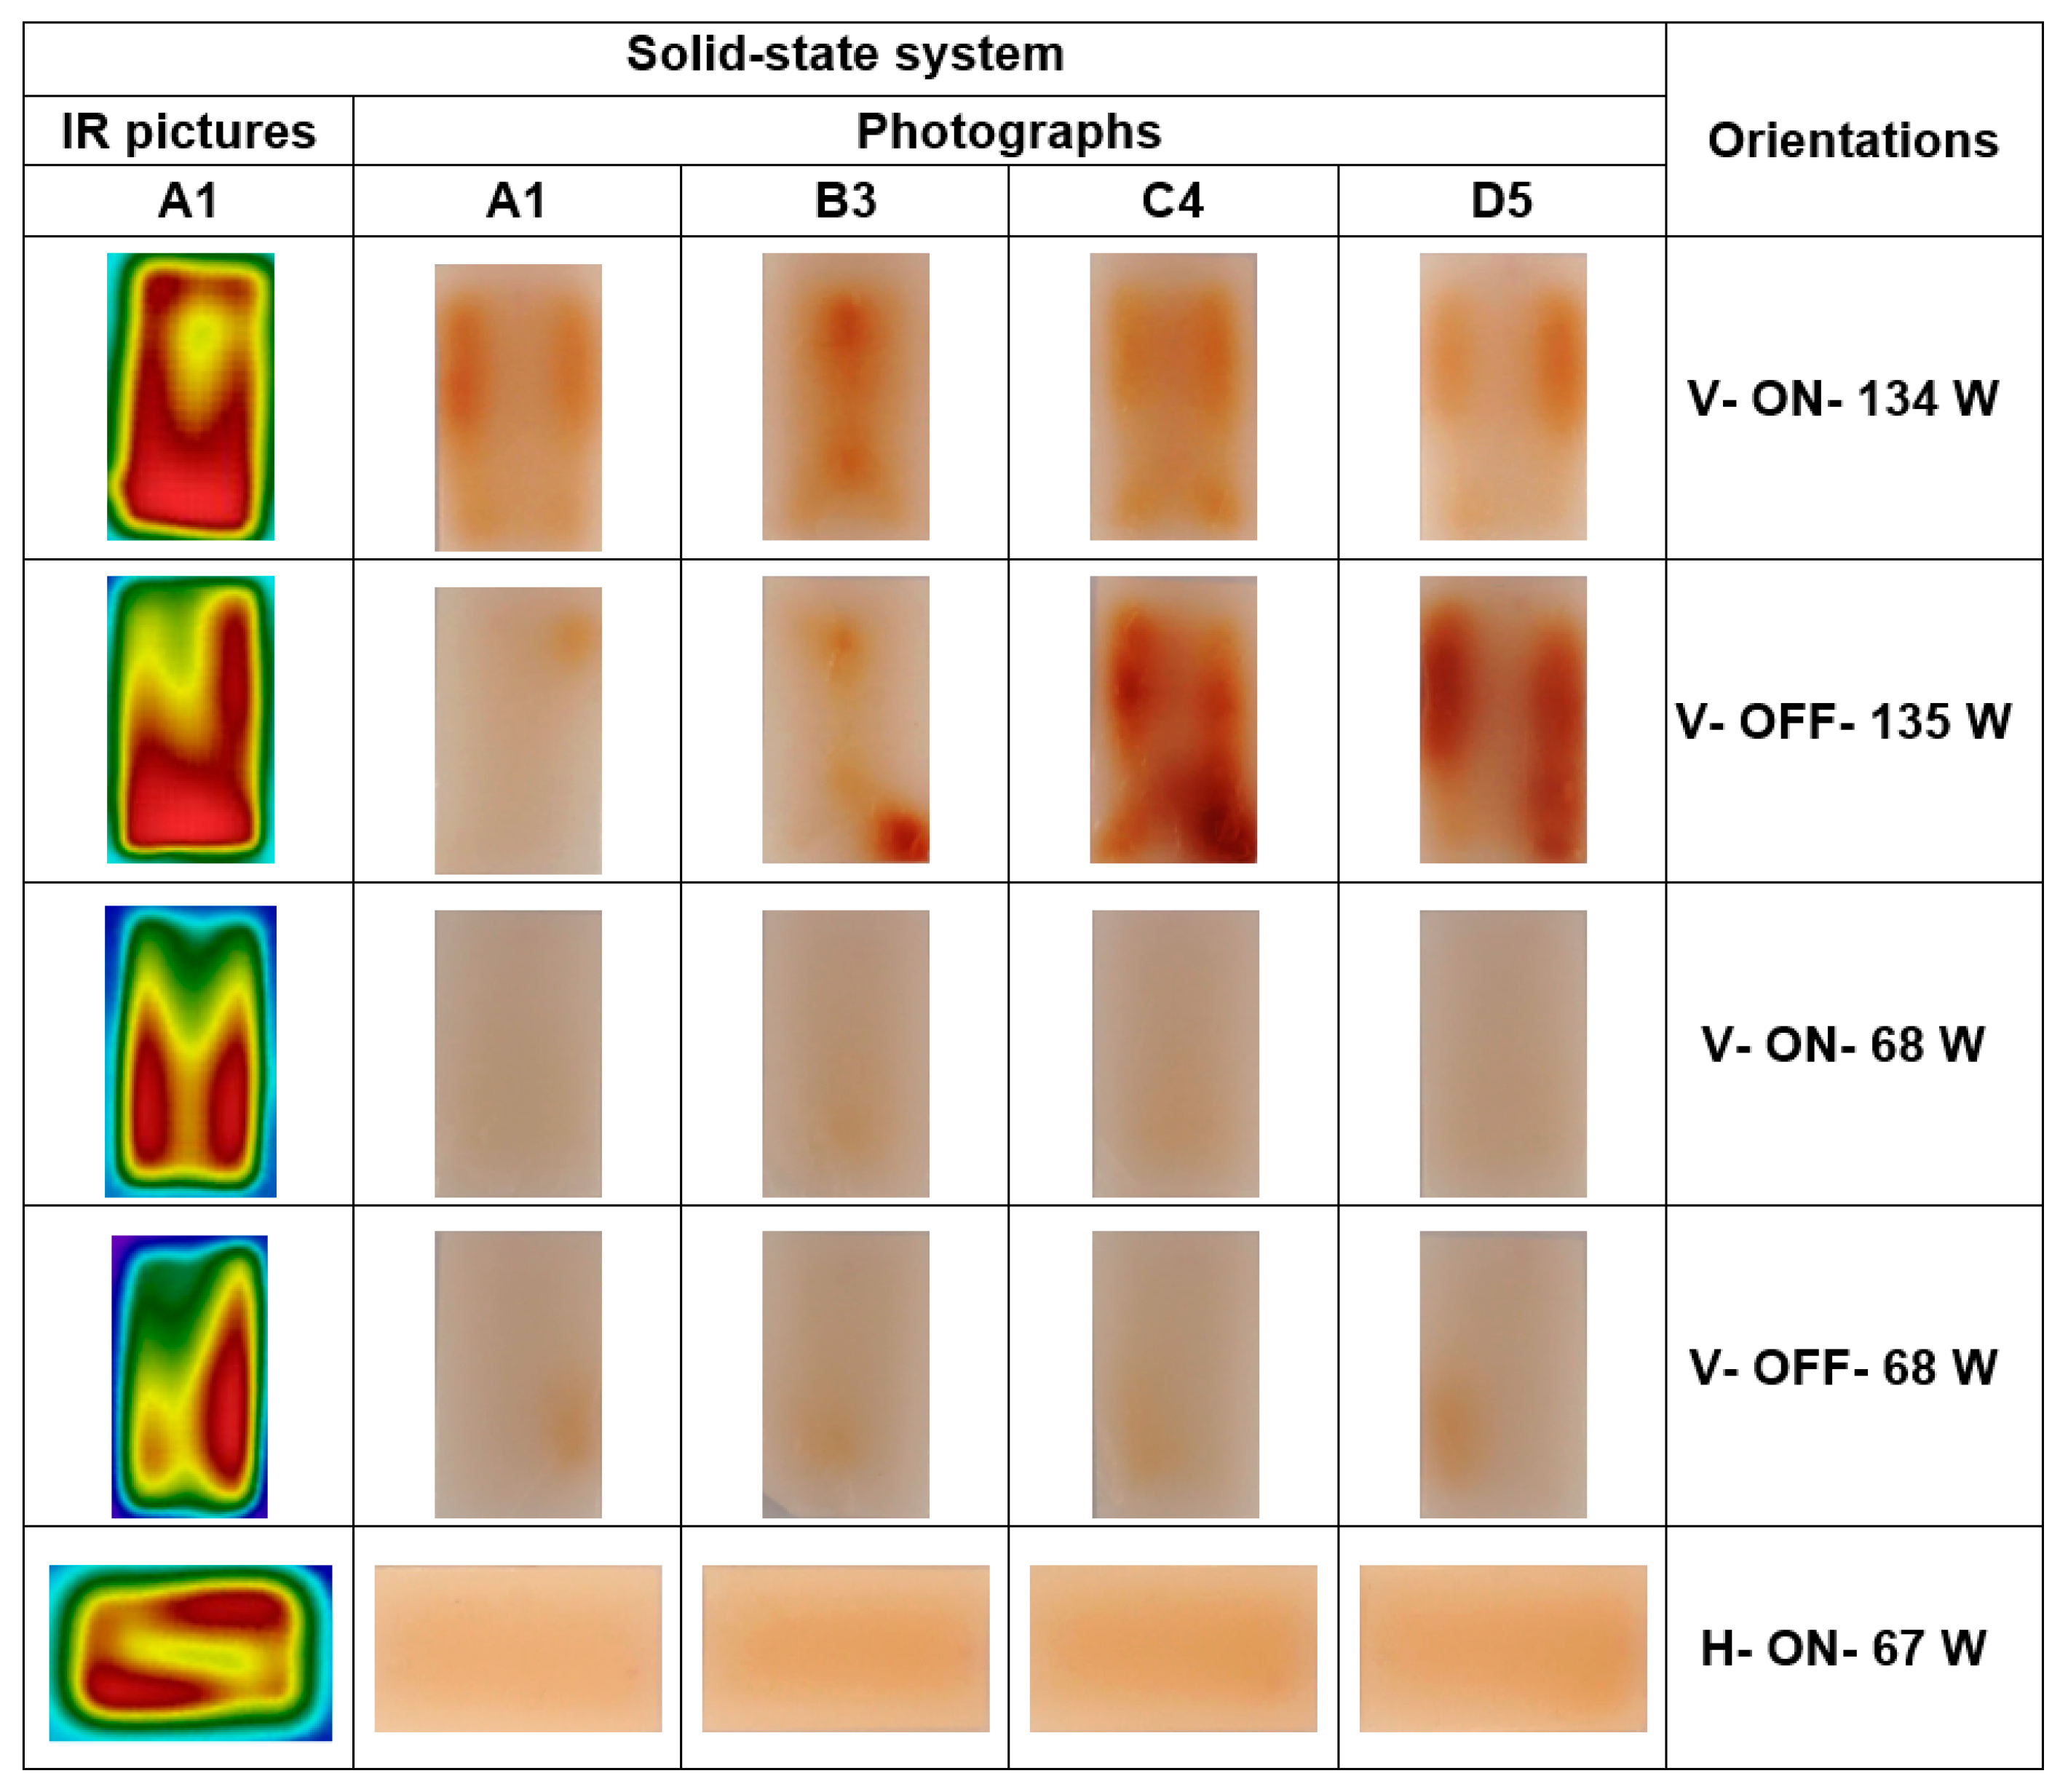
2.5. Preparation of Posters
There is a need to present the photographs and thermal pictures of each gellan gel sample in an easily accessible and understandable format. Therefore, posters containing photographs (Figure 7) or the combination of thermal pictures and photographs for the A1 surface (Figures 8 and 9), which provide an overview of different sample orientations, were created. To achieve this goal, one of three replications, which was considered the most representative of the Maillard color changes, was chosen to be displayed in the posters.
4. Conclusions
In this study, the homogeneity of microwave heat distribution within cuboid food model samples was investigated in different orientations in the solid-state and magnetron microwave systems. In more detail, seven different orientations (H–0°–OFF, H–45°–OFF, H–90°–OFF, H–135°–OFF, H–ON, V–ON, and V–OFF) were defined, and the samples were processed for 120 s. The heating patterns were assessed on gellan gel samples containing Maillard reactants using the thermal pictures and photographs of the samples. For both microwave systems, the output power calibration and measurement of efficiency were carried out. After investigating the results, it was found that the solid-state microwave system had a similar and higher heating efficiency in all investigated orientations compared to the magnetron microwave system. However, the results showed that placing the samples in vertical positions in the magnetron microwave cavity allowed them to absorb more energy than horizontal orientations, and thus for more microwave energy efficiency, the vertical positions in the magnetron microwave system can be used. This also confirms the non-uniform microwave field distribution in horizontal and vertical directions in this microwave system. The highest uniformity was achieved with H–ON in the solid-state microwave system. This orientation led to more uniform Maillard color changes and temperature distribution than the others, even for the V–ON orientation at a similar absorbed power level. Because we investigated the horizontal and vertical orientations at the bottom of the microwave cavity in this paper, further research will investigate the microwave field distribution at different vertical levels in both microwave cavities using a whole meal containing both liquid and solid phases in the package at different sizes and shapes.


