
The Effects of Olfactory Loss and Parosmia on Food and Cooking Habits, Sensory Awareness, and Quality of Life—A Possible Avenue for Regaining Enjoyment of Food


Abstract
:1. Introduction
2. Materials and Methods
2.1. Recruitment and Ethics
2.2. Data Collection
2.2.1. Part 1—Demographics and Sensory Function
2.2.2. Part 2—Liking, Recognition, and Frequency of Intake of Basic Tastants and Food Items
2.2.3. Part 3—Cooking and Food Habits
2.3. Data Analysis
3. Results
3.1. Demographics and Olfactory Deficits
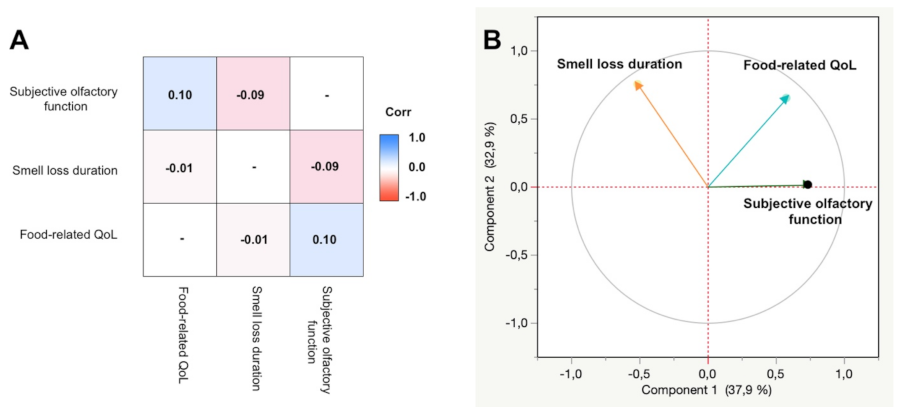
3.2. Quality of Life
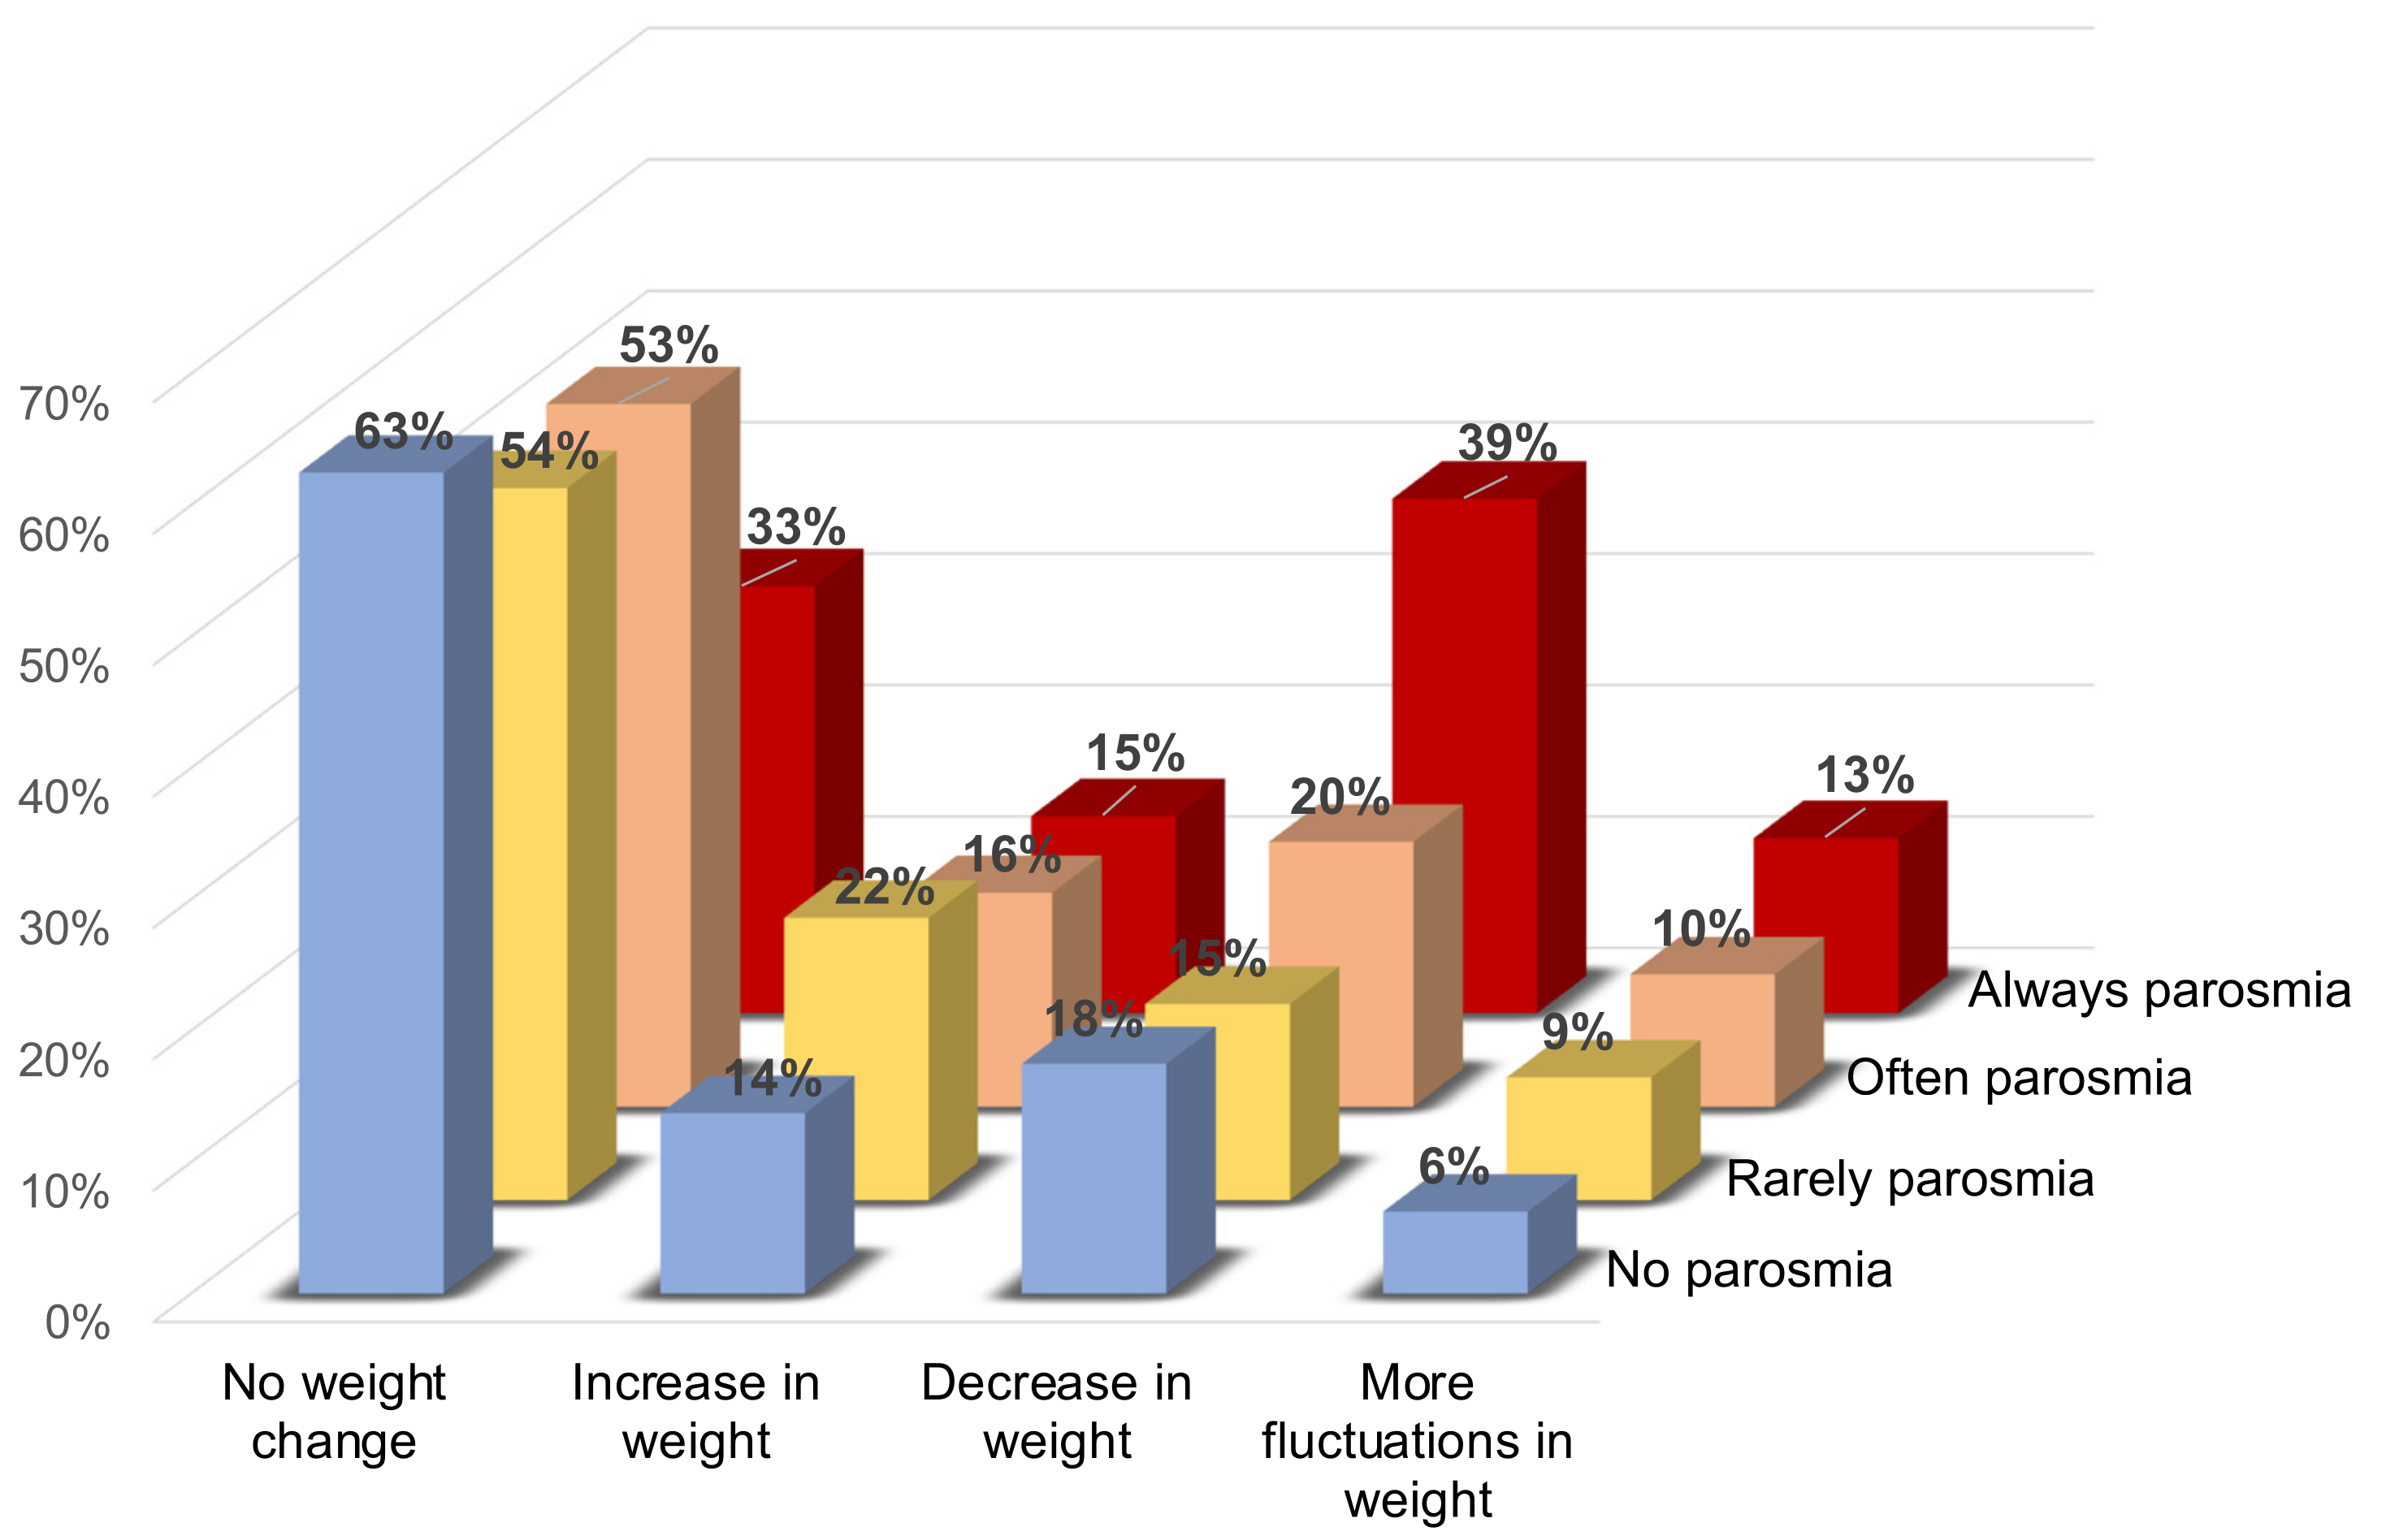
3.3. Weight Changes
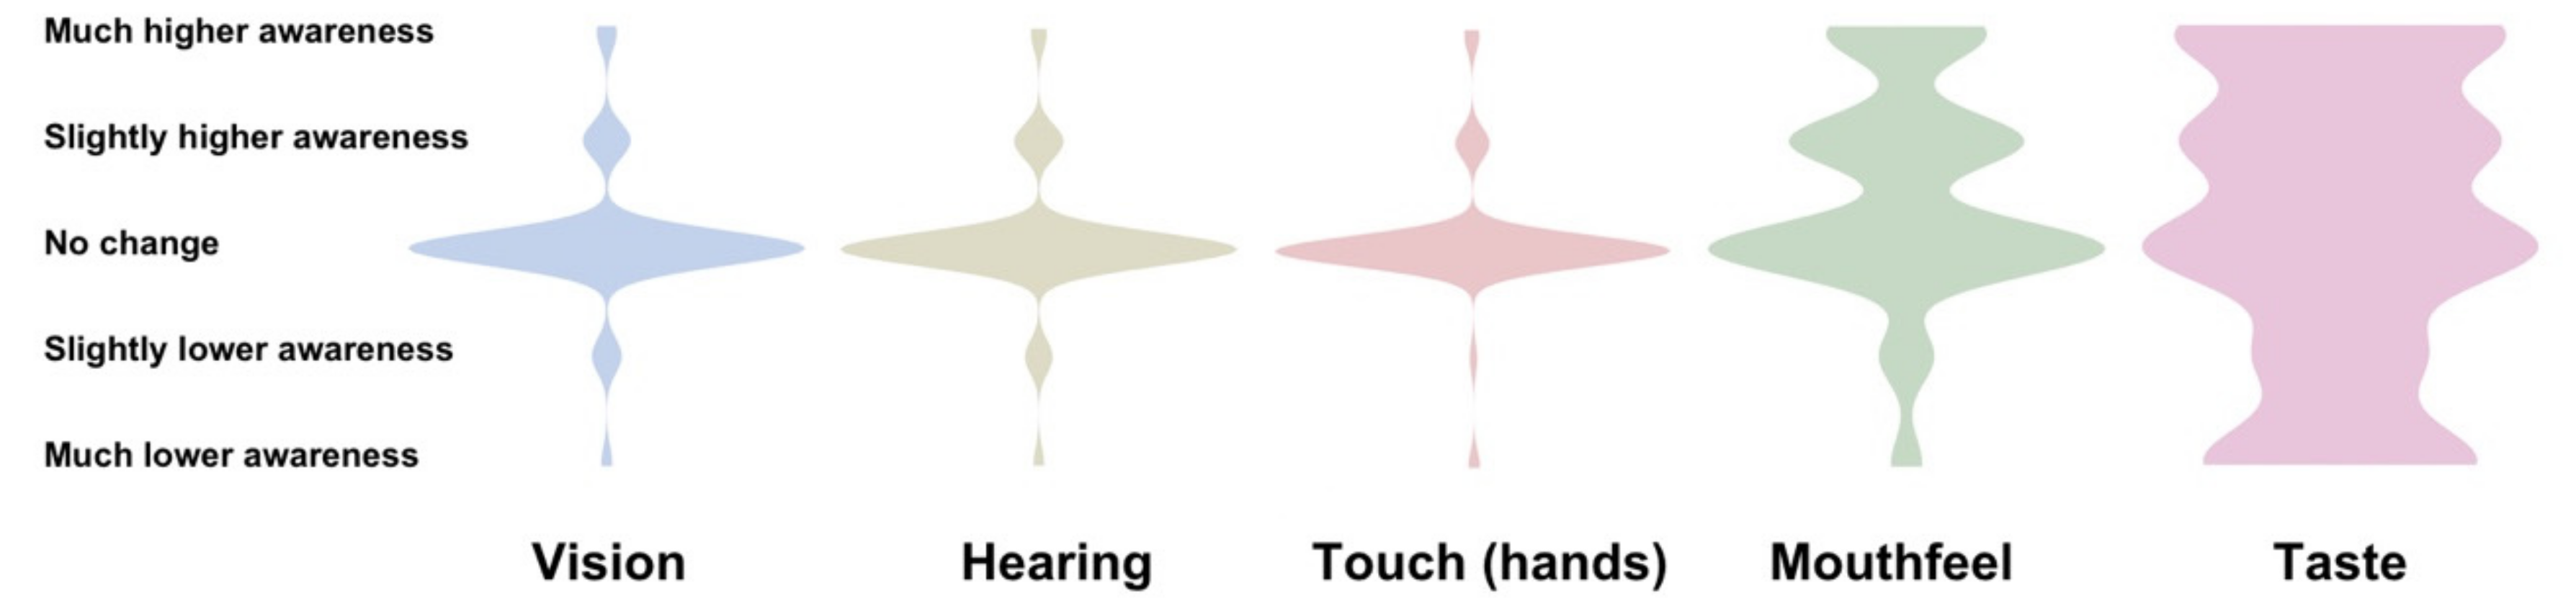
3.4. Changed Awareness of Other Senses Following Olfactory Dysfunction
3.5. Cooking and Food Habits
3.5.1. Differences between Participants with Normosmia and Olfactory Dysfunction
3.5.2. Parosmia Severity
3.6. Food Item Recognition, Liking, and Frequency of Intake
3.6.1. Recognition
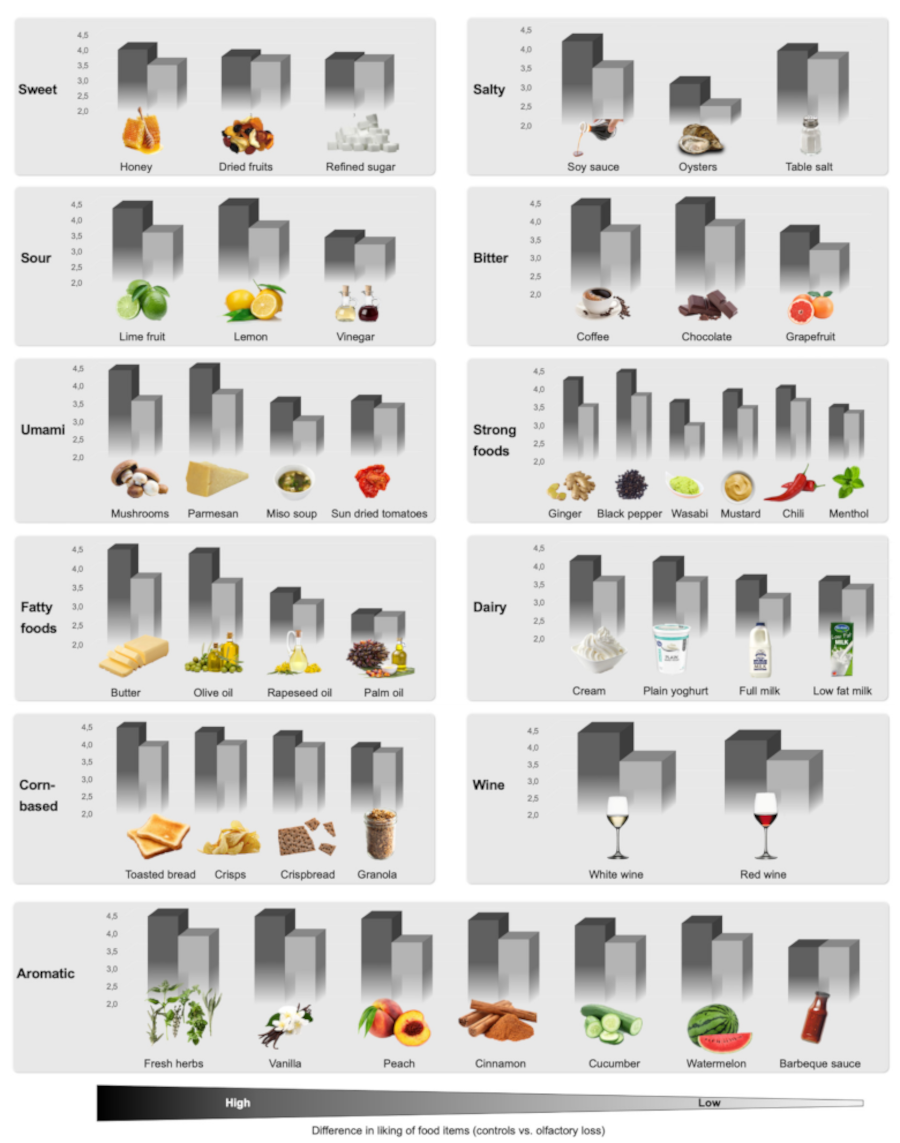
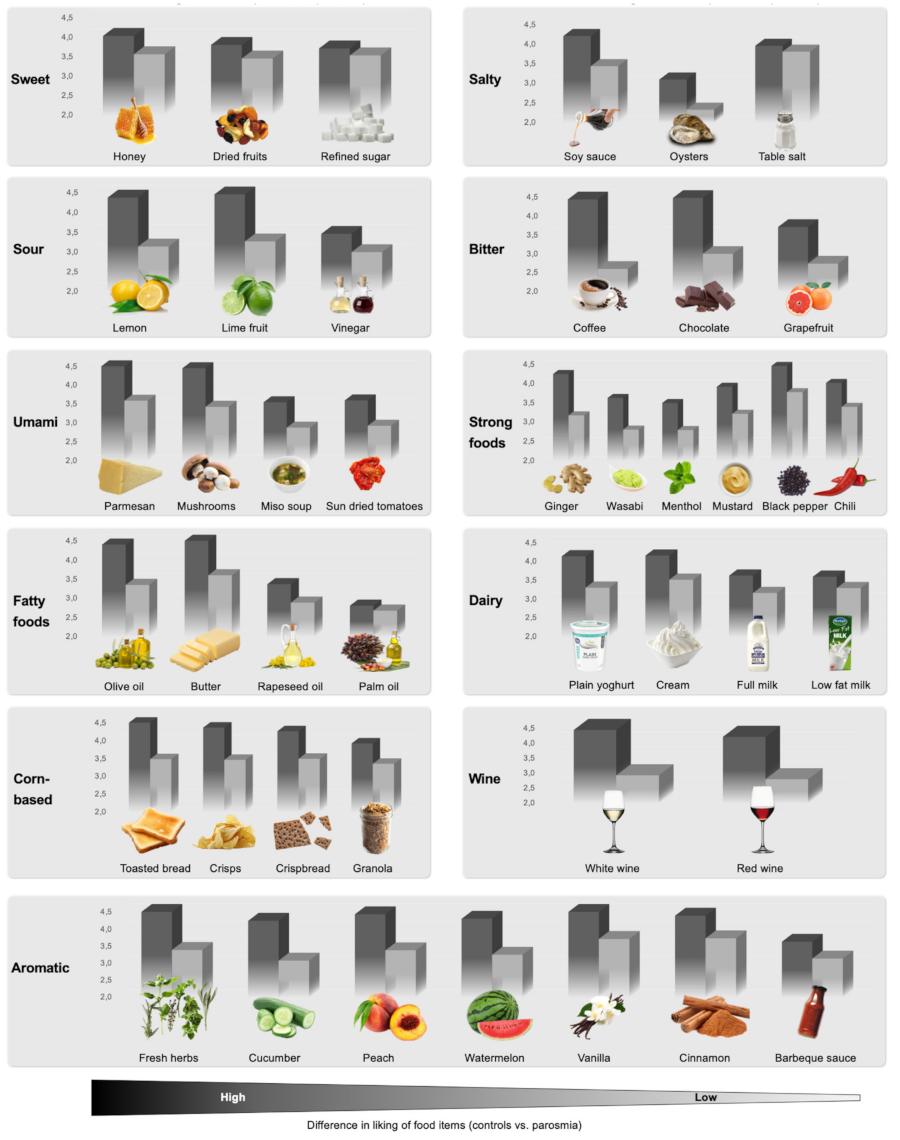
3.6.2. Liking
3.6.3. Frequency of Intake
4. Discussion
4.1. Cooking Habits
4.2. Food-Related Quality of Life and Weight Changes in Olfactory Disorders
4.3. Sensory Awareness
4.4. Food Items
4.5. Gender Differences
4.6. Limitations
5. Conclusions
Author Contributions
Funding
Institutional Review Board Statement
Informed Consent Statement
Data Availability Statement
Acknowledgments
Conflicts of Interest
References
- Vennemann, M.M.; Berger, K. The Association between Smoking and Smell and Taste Impairment in the General Population. J. Neurol. 2008, 255, 1121–1126. [Google Scholar] [CrossRef] [PubMed]
- Cooper, K.W.; Brann, D.H.; Farruggia, M.C.; Bhutani, S.; Pellegrino, R.; Tsukahara, T.; Weinreb, C.; Joseph, P.V.; Larson, E.D.; Parma, V.; et al. COVID-19 and the Chemical Senses: Supporting Players Take Center Stage. Neuron 2020, 107, 219–233. [Google Scholar] [CrossRef] [PubMed]
- Schwab, J.; Jensen, C.D.; Fjaeldstad, A.W. Sustained Chemosensory Dysfunction during the COVID-19 Pandemic. ORL J. Oto-Rhino-Laryngol. Relat. Spec. 2021, 83, 209–218. [Google Scholar] [CrossRef] [PubMed]
- Ivona, J.A.; Vega, Y.C. COVID-19-Associated Parosmia and Dysgeusia: A Case Series. Cureus 2021, 13, e17584. [Google Scholar] [CrossRef]
- Croy, I.; Negoias, S.; Novakova, L.; Landis, B.N. Learning about the Functions of the Olfactory System from People without a Sense of Smell. PLoS ONE 2012, 7, e33365. [Google Scholar] [CrossRef] [Green Version]
- Croy, I.; Nordin, S. Olfactory Disorders and Quality of Life—An Updated Review. Chem. Senses 2014, 39, 185–194. [Google Scholar] [CrossRef] [Green Version]
- Piqueras-Fiszman, B.; Fjaeldstad, A.; Spence, C.; Hartevelt, T.J.V.; Kringelbach, M.L. Pleasure of Food in the Brain. In Multisensory Flavor Perception; Woodhead Publishing: Sawston, UK, 2016; pp. 211–234. ISBN 9780081003503. [Google Scholar]
- Manesse, C.; Ferdenzi, C.; Sabri, M.; Bessy, M.; Rouby, C.; Faure, F.; Bellil, D.; Jomain, S.; Landis, B.N.; Hugentobler, M.; et al. Dysosmia-Associated Changes in Eating Behavior. Chemosens Percept 2017, 10, 104–113. [Google Scholar] [CrossRef]
- Roxbury, C.R.; Bernstein, I.A.; Lin, S.Y.; Rowan, N.R. Association Between Chemosensory Dysfunction and Diet Quality in United States Adults. Am. J. Rhinol. Allergy 2022, 36, 47–56. [Google Scholar] [CrossRef]
- Parker, J.K.; Kelly, C.E.; Gane, S.B. Molecular Mechanism of Parosmia. medRxiv 2021. [Google Scholar] [CrossRef]
- Cook, E.; Kelly, C.; Watson, D.B.; Hopkins, C. Parosmia Is Prevalent and Persistent amongst Those with COVID-19 Olfactory Dysfunction. Rhinology 2020, 59, 222–224. [Google Scholar] [CrossRef]
- Spence, C. Noise and Its Impact on the Perception of Food and Drink. Flavour 2014, 3, 9. [Google Scholar] [CrossRef] [Green Version]
- Harris, P.A.; Taylor, R.; Thielke, R.; Payne, J.; Gonzalez, N.; Conde, J.G. Research Electronic Data Capture (REDCap)—A Metadata-Driven Methodology and Workflow Process for Providing Translational Research Informatics Support. J. Biomed. Inform. 2009, 42, 377–381. [Google Scholar] [CrossRef] [PubMed] [Green Version]
- Lahne, J.; Wolfson, J.A.; Trubek, A. Development of the Cooking and Food Provisioning Action Scale (CAFPAS): A New Measurement Tool for Individual Cooking Practice. Food Qual. Prefer. 2017, 62, 96–105. [Google Scholar] [CrossRef]
- Manesse, C.; Ferdenzi, C.; Mantel, M.; Sabri, M.; Bessy, M.; Fournel, A.; Faure, F.; Bellil, D.; Landis, B.M.; Hugentobler, M.; et al. The Prevalence of Olfactory Deficits and Their Effects on Eating Behavior from Childhood to Old Age: A Large-Scale Study in the French Population. Food Qual. Prefer. 2021, 93, 104273. [Google Scholar] [CrossRef]
- Postma, E.M.; Graaf, C.D.; Boesveldt, S. Food Preferences and Intake in a Population of Dutch Individuals with Self-Reported Smell Loss: An Online Survey. Food Qual. Prefer. 2020, 79, 103771. [Google Scholar] [CrossRef]
- Aschenbrenner, K.; Hummel, C.; Teszmer, K.; Krone, F.; Ishimaru, T.; Seo, H.-S.; Hummel, T. The Influence of Olfactory Loss on Dietary Behaviors. Laryngoscope 2008, 118, 135–144. [Google Scholar] [CrossRef] [PubMed]
- Seo, H.-S.; Pramudya, R.C.; Singh, A.; Hummel, T. Recent Evidence for the Impacts of Olfactory Disorders on Food Enjoyment and Ingestive Behavior. Curr. Opin. Food Sci. 2021, 42, 187–194. [Google Scholar] [CrossRef]
- Velluzzi, F.; Deledda, A.; Onida, M.; Loviselli, A.; Crnjar, R.; Sollai, G. Relationship between Olfactory Function and BMI in Normal Weight Healthy Subjects and Patients with Overweight or Obesity. Nutrients 2022, 14, 1262. [Google Scholar] [CrossRef]
- Parma, V.; Ohla, K.; Veldhuizen, M.G.; Niv, M.Y.; Kelly, C.E.; Bakke, A.J.; Cooper, K.W.; Bouysset, C.; Pirastu, N.; Dibattista, M.; et al. More than Smell—COVID-19 Is Associated with Severe Impairment of Smell, Taste, and Chemesthesis. Chem. Senses 2020, 45, 609–622. [Google Scholar] [CrossRef]
- Nørgaard, H.J.; Fjaeldstad, A.W. Differences in Correlation between Subjective and Measured Olfactory and Gustatory Dysfunctions after Initial Ear, Nose and Throat Evaluation. Int. Arch. Otorhinolaryngol. 2021, 25, 563–569. [Google Scholar] [CrossRef]
- Parker, J.; Methven, L.; Pellegrino, R.; Smith, B.; Gane, S.; Kelly, C. Emerging Pattern of Post-COVID-19 Parosmia and Its Effect on Food Perception. Foods 2022, 11, 967. [Google Scholar] [CrossRef] [PubMed]
- Roy-Chowdhury, S.; Satishkumar, A.; Ahmed, S.H.; Mardon, A. Dietary Approach for Post-COVID Treatment of Olfactory Loss. Integr. J. Med. Sci. 2021, 8. [Google Scholar] [CrossRef]
- Hernandez, A.K.; Woosch, D.; Haehner, A.; Hummel, T. Omega-3 Supplementation in Postviral Olfactory Dysfunction: A Pilot Study. Rhinology 2022, 60, 139–144. [Google Scholar] [CrossRef] [PubMed]
- Yan, C.H.; Rathor, A.; Krook, K.; Ma, Y.; Rotella, M.R.; Dodd, R.L.; Hwang, P.H.; Nayak, J.V.; Oyesiku, N.M.; DelGaudio, J.M.; et al. Effect of Omega-3 Supplementation in Patients with Smell Dysfunction Following Endoscopic Sellar and Parasellar Tumor Resection: A Multicenter Prospective Randomized Controlled Trial. Neurosurgery 2020, 87, E91–E98. [Google Scholar] [CrossRef] [PubMed]
- Fjaeldstad, A.W.; Stankovic, J.; Onat, M.; Stankevice, D.; Ovesen, T. Patients and experiences from the first Danish flavour clinic. Dan. Med. J. 2020, 67, 1. [Google Scholar]
- Oleszkiewicz, A.; Schriever, V.A.; Croy, I.; Hähner, A.; Hummel, T. Updated Sniffin’ Sticks normative data based on an extended sample of 9139 subjects. Eur. Arch. Oto-Rhino-Laryngol. 2019, 276, 719–728. [Google Scholar] [CrossRef] [Green Version]
- Liu, D.T.; Welge-Lüssen, A.; Besser, G.; Mueller, C.A.; Renner, B. Assessment of odor hedonic perception: The Sniffin’ sticks parosmia test (SSParoT). Sci. Rep. 2020, 10, 18019. [Google Scholar] [CrossRef]


| Olfactory Dysfunction (n = 522) | Normosmic Controls (n = 166) | Olfactory Loss (n = 271) | Parosmia (n = 251) | |
|---|---|---|---|---|
| Age (mean, IQR) | 47 (34–58) | 47 (37–58) | 51 (40–63) | 42 (30–53) |
| Sex, female (n, %) | 417 (80%) | 111 (67%) | 200 (74%) | 217 (86%) |
Country of residence (n, %)
| 213 (41%) 98 (19%) 129 (25%) 82 (16%) | 85 (51%) 72 (43%) 2 (1%) 7 (5%) | 142 (53%) 36 (13%) 59 (22%) 34 (12%) | 71 (29%) 62 (25%) 70 (29% 48 (19%) |
Aetiology (n, %)
| 319 (61%) 48 (9%) 24 (5%) 25 (5%) 20 (4%) 85 (16%) | - | 121 (45%) 32 (12%) 22 (8%) 19 (7%) 16 (6%) 60 (22%) | (79%) (6%) (1%) (2%) (2%) (10%) |
| Duration (months; mean, IQR) | 35 (5–24) | - | 54 (4–48) | 15 (5–10) |
| Subjective olfactory function (VAS 0-100, IQR) | 29 (6–50) | 100 (100–100) | 22 (1–32) | 37 (19–50) |
Parosmia (n, %)
| 161 (31%) 110 (21%) 131 (25%) 120 (23%) | 161 (59%) 110 (41%) - - | - - 131 (52%) 120 (48%) | |
Weight chang
| 266 (52%) 117 (23%) 84 (16%) 49 (9%) | 158 (59%) 44 (16%) 45 (17%) 20 (7%) | 108 (43%) 73 (29%) 39 (16%) 29 (12%) | |
| Food-related QoL (mean, IQR) | 63 (41–86) | 63 (41–84) | 62 (41–87) |
| Normosmic (n = 166) | Olfactory Dysfunction (n = 367) | Δ | p-Value | Olfactory Loss (n = 191) | Parosmia (n = 176) | Δ | p-Value | |
|---|---|---|---|---|---|---|---|---|
| Want to get through cooking asap. | 2.58 (2.28; 2.88) | 3.85 (3.65; 4.06) | 1.27 | <0.0001 | 3.97 (3.68; 4.27) | 3.72 (3.41; 4.02) | 0.25 | 0.2359 |
| Cooking is a fulfilling activity | 5.70 (5.42; 5.98) | 4.74 (4.55; 4.93) | 0.96 | <0.0001 | 4.75 (4.47; 5.03) | 4.72 (4.43; 5.01) | 0.03 | 0.8692 |
| Comfortable preparing food | 6.21 (5.95; 6.47) | 5.28 (5.10; 5.45) | 0.93 | <0.0001 | 5.39 (5.12; 5.65) | 5.15 (4.88; 5.44) | 0.24 | 0.2540 |
| Inspired to cook for other people | 5.67 (5.39; 5.96) | 4.76 (4.56; 4.95) | 0.91 | <0.0001 | 4.74 (4.46; 5.02) | 4.78 (4.48; 5.07) | 0.04 | 0.8565 |
| Easy to accomplish desired results during cooking | 5.67 (5.42; 5.93) | 4.78 (4.61; 4.95) | 0.89 | <0.0001 | 4.86 (4.60; 5.11) | 4.70 (4.44; 4.97) | 0.15 | 0.4137 |
| Cooking is a waste of effort | 1.89 (1.64; 2.15) | 2.74 (2.57; 2.92) | 0.85 | <0.0001 | 2.79 (2.54; 3.05) | 2.69 (2.42; 2.96) | 0.10 | 0.5746 |
| Inability to make new foods successfully | 3.43 (3.16; 3.71) | 4.22 (4.04; 4.41) | 0.79 | <0.0001 | 4.40 (4.14; 4.66) | 4.03 (3.76; 4.30) | 0.37 | 0.0538 |
| Cooking brings little enjoyment | 3.31 (3.02; 3.61) | 4.02 (3.82; 4.22) | 0.71 | <0.0001 | 4.08 (3.81; 4.35) | 3.95 (3.66; 4.23) | 0.13 | 0.5136 |
| Confidence in ability to deal with unexpected results during cooking | 5.38 (5.11; 5.64) | 4.72 (4.54; 4.90) | 0.66 | <0.0001 | 4.93 (4.68; 5.19) | 4.49 (4.23; 4.76) | 0.44 | 0.0209 |
| Ability to decide what to eat | 4.99 (4.70; 5.28) | 4.38 (4.18; 4.57) | 0.62 | 0.0006 | 4.63 (4.34; 4.91) | 4.11 (3.81; 4.40) | 0.52 | 0.0131 |
| Cooking for others is a burden | 2.57 (2.28; 2.85) | 3.19 (3.00; 3.39) | 0.62 | 0.0004 | 3.18 (2.90; 3.45) | 3.21 (2.92; 3.50) | 0.03 | 0.8838 |
| Coping with problems during cooking | 5.67 (5.43; 5.92) | 5.07 (4.90; 5.23) | 0.61 | <0.0001 | 5.15 (4.90; 5.39) | 4.98 (4.73; 5.24) | 0.17 | 0.3651 |
| Prefer to spend time on more important things than cooking | 3.20 (2.92; 3.47) | 3.73 (3.54; 3.91) | 0.53 | 0.0020 | 3.74 (3.49; 4.00) | 3.70 (3.43; 3.98) | 0.04 | 0.8299 |
| Limited by lack of cooking knowledge | 2.36 (2.07; 2.65) | 2.78 (2.58; 2.97) | 0.42 | 0.0195 | 2.80 (2.51; 3.08) | 2.76 (2.46; 3.06) | 0.04 | 0.8709 |
| Involvement in daily meal preparations | 6.15 (5.88; 6.42) | 5.73 (5.55; 5.91) | 0.42 | 0.0109 | 5.87 (5.61; 6.14) | 5.58 (5.31; 5.85) | 0.29 | 0.1270 |
| Prefer to cook than having food prepared | 4.31 (4.01; 4.61) | 3.95 (3.75; 4.15) | 0.36 | 0.0543 | 3.91 (3.63; 4.20) | 3.99 (3.69; 4.28) | 0.08 | 0.7276 |
| Confidence in creating meals from ingredients on hand | 6.04 (5.81; 6.28) | 5.80 (5.65; 5.96) | 0.24 | 0.0982 | 5.88 (5.66; 6.10) | 5.72 (5.49; 5.96) | 0.16 | 0.3430 |
| Confidence in choosing between similar products | 5.93 (5.71; 6.16) | 5.74 (5.59; 5.89) | 0.19 | 0.1543 | 5.76 (5.54; 5.98) | 5.71 (5.49; 5.94) | 0.05 | 0.7644 |
| Reflection on what to cook and eat | 5.14 (4.88; 5.41) | 5.00 (4.83; 5.18) | 0.14 | 0.3765 | 4.84 (4.59; 5.09) | 5.18 (4.92; 5.44) | 0.34 | 0.0675 |
| Knowledge of usage of ingredients during purchasing | 6.17 (5.97; 6.38) | 6.04 (5.90; 6.18) | 0.13 | 0.2915 | 6.04 (5.84; 6.25) | 6.04 (5.83; 6.25) | 0.00 | 0.9888 |
| Difficult finding time to prepare preferred food | 3.63 (3.35; 3.90) | 3.76 (3.57; 3.94) | 0.13 | 0.4452 | 3.54 (3.29; 3.79) | 3.99 (3.73; 4.26) | 0.45 | 0.0154 |
| Knowledge of where to find needed ingredients | 6.34 (6.15; 6.53) | 6.23 (6.01; 6.35) | 0.11 | 0.3138 | 6.19 (6.01; 6.38) | 6.26 (6.07; 6.46) | 0.07 | 0.5953 |
| No time to prepare meals due to family responsibilities | 2.62 (2.36; 2.88) | 2.71 (2.54; 2.89) | 0.09 | 0.5595 | 2.67 (2.43; 2.92) | 2.76 (2.51; 3.01) | 0.09 | 0.6338 |
| No time to prepare meals due to job responsibilities | 3.31 (3.00; 3.62) | 3.24 (3.03; 3.45) | 0.07 | 0.7109 | 2.93 (2.64; 3.21) | 3.58 (3.28; 3.88) | 0.65 | 0.0022 |
| Knowledge of kitchen equipment usage | 6.37 (6.19; 6.56) | 6.33 (6.20; 6.45) | 0.04 | 0.6777 | 6.27 (6.10; 6.45) | 6.39 (6.21; 6.57) | 0.11 | 0.3639 |
| Mental plan of steps before cooking | 5.82 (5.59; 6.05) | 5.78 (5.62; 5.94) | 0.04 | 0.7814 | 5.80 (5.57; 6.02) | 5.76 (5.52; 5.99) | 0.04 | 0.8073 |
| No time to prepare meals due to social responsibilities | 2.43 (2.19; 2.66) | 2.47 (2.31; 2.63) | 0.04 | 0.7780 | 2.36 (2.15; 2.58) | 2.58 (2.36; 2.81) | 0.22 | 0.1717 |
| Wish for more time to plan meals | 3.98 (3.73; 4.24) | 4.01 (3.84; 4.18) | 0.03 | 0.8541 | 3.77 (3.53; 4.01) | 4.28 (4.03; 4.52) | 0.51 | 0.0040 |
| Recognition | Liking | Frequency of Intake | ||||||||||
|---|---|---|---|---|---|---|---|---|---|---|---|---|
| Control | OL | Parosmia | p-value | Control | OL | Parosmia | p-value | Control | OL | Parosmia | p-value | |
| Sweet food items | ||||||||||||
| Sweet foods * | 4.94 | 4.08 | 4.07 | <0.0001 | 4.37 | 4.16 | 4.06 | 0.0118 | 4.01 | 3.89 | 3.85 | 0.3121 |
| Refined sugar | 4.43 | 3.64 | 3.62 | <0.0001 | 3.71 | 3.63 | 3.53 | 0.2685 | 3.91 | 3.86 | 3.78 | 0.6250 |
| Dried fruits | 4.78 | 3.45 | 3.27 | <0.0001 | 3.80 | 3.63 | 3.45 | 0.0137 | 3.41 | 3.31 | 3.25 | 0.4866 |
| Honey | 4.78 | 3.43 | 3.49 | <0.0001 | 4.03 | 3.52 | 3.56 | <0.0001 | 3.21 | 3.07 | 3.09 | 0.5579 |
| Salty food items | ||||||||||||
| Salty foods * | 4.95 | 4.12 | 4.14 | <0.0001 | 4.31 | 4.05 | 4.08 | 0.0257 | 3.92 | 3.67 | 3.64 | 0.0340 |
| Soy sauce | 4.69 | 3.26 | 3.24 | <0.0001 | 4.21 | 3.51 | 3.44 | <0.0001 | 3.52 | 2.98 | 3.05 | <0.0001 |
| Table salt | 4.69 | 3.94 | 4.00 | <0.0001 | 3.96 | 3.74 | 3.81 | 0.0994 | 4.57 | 4.42 | 4.26 | 0.0168 |
| Oysters | 3.87 | 2.79 | 2.65 | <0.0001 | 3.10 | 2.52 | 2.33 | <0.0001 | 1.63 | 1.35 | 1.48 | 0.0018 |
| Sour food items | ||||||||||||
| Sour foods * | 4.86 | 3.85 | 3.81 | <0.0001 | 4.00 | 3.67 | 3.31 | <0.0001 | 4.26 | 3.94 | 3.53 | <0.0001 |
| Vinegar | 4.87 | 3.57 | 3.54 | <0.0001 | 3.46 | 3.23 | 3.00 | 0.0016 | 3.42 | 3.04 | 2.92 | 0.0009 |
| Lemon | 4.89 | 3.69 | 3.49 | <0.0001 | 4.46 | 3.75 | 3.27 | <0.0001 | 4.02 | 3.54 | 3.28 | <0.0001 |
| Lime | 4.62 | 3.47 | 3.37 | <0.0001 | 4.38 | 3.61 | 3.14 | <0.0001 | 3.38 | 3.00 | 2.91 | 0.0006 |
| Bitter food items | ||||||||||||
| Bitter foods * | 4.88 | 3.85 | 3.62 | <0.0001 | 3.44 | 2.94 | 2.80 | <0.0001 | 3.87 | 3.35 | 3.13 | <0.0001 |
| Grapefruit | 4.62 | 3.27 | 3.01 | <0.0001 | 3.71 | 3.22 | 2.74 | <0.0001 | 2.32 | 2.06 | 2.00 | 0.0177 |
| Coffee | 4.94 | 3.26 | 2.88 | <0.0001 | 4.44 | 3.72 | 2.60 | <0.0001 | 4.39 | 4.08 | 3.57 | <0.0001 |
| Chocolate | 4.90 | 3.45 | 3.15 | <0.0001 | 4.48 | 3.87 | 3.00 | <0.0001 | 3.69 | 3.34 | 2.95 | <0.0001 |
| Umami-rich food items | ||||||||||||
| Umami foods * | 3.87 | 3.20 | 3.05 | <0.0001 | 4.17 | 3.47 | 3.16 | <0.0001 | 4.03 | 3.45 | 3.29 | <0.0001 |
| Mushrooms | 4.61 | 3.09 | 3.05 | <0.0001 | 4.45 | 3.59 | 3.43 | <0.0001 | 3.46 | 2.95 | 3.00 | 0.0001 |
| Parmesan cheese | 4.68 | 3.18 | 3.16 | <0.0001 | 4.63 | 3.77 | 3.59 | <0.0001 | 3.55 | 3.08 | 3.10 | 0.0001 |
| Sun-dried tomato | 4.62 | 3.01 | 2.83 | <0.0001 | 3.60 | 3.38 | 2.93 | <0.0001 | 2.62 | 2.41 | 2.24 | 0.0034 |
| Miso soup | 3.61 | 2.73 | 2.74 | <0.0001 | 3.55 | 3.02 | 2.88 | <0.0001 | 1.96 | 1.66 | 1.77 | 0.0203 |
| Strong food items | ||||||||||||
| Strong foods * | 4.94 | 3.87 | 3.77 | <0.0001 | 4.15 | 3.77 | 3.55 | <0.0001 | 3.79 | 3.59 | 3.46 | 0.0269 |
| Black pepper | 4.77 | 3.65 | 3.61 | <0.0001 | 4.46 | 3.81 | 3.78 | <0.0001 | 4.62 | 4.32 | 4.11 | <0.0001 |
| Chili | 4.80 | 3.73 | 3.61 | <0.0001 | 4.02 | 3.66 | 3.40 | <0.0001 | 3.65 | 3.29 | 3.19 | 0.0017 |
| Menthol | 4.64 | 3.52 | 3.23 | <0.0001 | 3.50 | 3.33 | 2.80 | <0.0001 | 2.32 | 2.36 | 2.36 | 0.9629 |
| Ginger | 4.87 | 3.38 | 3.27 | <0.0001 | 4.25 | 3.51 | 3.18 | <0.0001 | 3.44 | 2.98 | 2.90 | 0.0001 |
| Mustard | 4.76 | 3.50 | 3.27 | <0.0001 | 3.92 | 3.46 | 3.22 | <0.0001 | 3.19 | 3.00 | 2.82 | 0.0112 |
| Wasabi | 4.42 | 3.40 | 3.19 | <0.0001 | 3.63 | 2.99 | 2.81 | <0.0001 | 2.31 | 1.96 | 1.95 | 0.0046 |
| Recognition | Liking | Frequency of intake | ||||||||||
| Control | OL | Parosmia | p-value | Control | OL | Parosmia | p-value | Control | OL | Parosmia | p-value | |
| Fatty food items | ||||||||||||
| Olive oil | 4.54 | 2.92 | 2.89 | <0.0001 | 4.40 | 3.61 | 3.35 | <0.0001 | 4.49 | 3.84 | 3.75 | <0.0001 |
| Butter | 4.69 | 3.16 | 3.21 | <0.0001 | 4.54 | 3.74 | 3.60 | <0.0001 | 4.37 | 4.16 | 3.94 | 0.0016 |
| Rapeseed oil | 3.39 | 2.58 | 2.42 | <0.0001 | 3.37 | 3.06 | 2.89 | <0.0001 | 3.13 | 2.78 | 2.44 | <0.0001 |
| Palm oil | 2.68 | 2.45 | 2.34 | 0.0229 | 2.81 | 2.74 | 2.68 | 0.3920 | 1.70 | 1.61 | 1.56 | 0.4235 |
| Dairy food items | ||||||||||||
| Cream | 4.54 | 3.17 | 3.19 | <0.0001 | 4.15 | 3.58 | 3.51 | <0.0001 | 3.27 | 3.16 | 2.89 | 0.0023 |
| Milk (low fat) | 4.19 | 3.04 | 3.02 | <0.0001 | 3.59 | 3.36 | 3.29 | 0.0666 | 3.63 | 3.39 | 3.24 | 0.1105 |
| Milk (full) | 4.31 | 3.01 | 3.13 | <0.0001 | 3.62 | 3.11 | 3.16 | 0.0002 | 2.72 | 2.38 | 2.37 | 0.0568 |
| Yoghurt (plain) | 4.55 | 3.26 | 3.26 | <0.0001 | 4.13 | 3.57 | 3.30 | <0.0001 | 3.36 | 3.19 | 3.13 | 0.3014 |
| Aromatic food items | ||||||||||||
| Fresh herbs | 4.52 | 2.96 | 2.91 | <0.0001 | 4.66 | 3.94 | 3.39 | <0.0001 | 4.37 | 3.97 | 3.69 | <0.0001 |
| Vanilla | 4.82 | 3.02 | 3.21 | <0.0001 | 4.59 | 3.92 | 3.71 | <0.0001 | 3.23 | 3.09 | 3.13 | 0.4004 |
| Cinnamon | 4.88 | 3.14 | 3.44 | <0.0001 | 4.39 | 3.85 | 3.73 | <0.0001 | 3.18 | 3.06 | 3.09 | 0.5841 |
| Barbeque sauce | 4.31 | 3.17 | 3.02 | <0.0001 | 3.63 | 3.63 | 3.14 | <0.0001 | 2.26 | 2.58 | 2.42 | 0.0194 |
| Cucumber | 4.79 | 3.33 | 3.07 | <0.0001 | 4.24 | 3.75 | 3.08 | <0.0001 | 3.82 | 3.51 | 3.01 | <0.0001 |
| Watermelon | 4.74 | 3.35 | 3.10 | <0.0001 | 4.30 | 3.81 | 3.25 | <0.0001 | 2.56 | 2.50 | 2.40 | 0.2221 |
| Peach | 4.65 | 3.20 | 3.05 | <0.0001 | 4.43 | 3.76 | 3.38 | <0.0001 | 2.45 | 2.38 | 2.29 | 0.2922 |
| Corn-based food items | ||||||||||||
| Bread (toasted) | 4.80 | 3.42 | 3.24 | <0.0001 | 4.56 | 3.95 | 3.48 | <0.0001 | 3.72 | 3.56 | 3.52 | 0.2555 |
| Crisps | 4.80 | 3.58 | 3.25 | <0.0001 | 4.36 | 3.98 | 3.46 | <0.0001 | 3.14 | 3.25 | 3.20 | 0.6423 |
| Crispbread | 4.67 | 3.41 | 3.17 | <0.0001 | 4.26 | 3.92 | 3.49 | <0.0001 | 3.35 | 3.38 | 3.21 | 0.2230 |
| Granola | 4.44 | 3.32 | 3.06 | <0.0001 | 3.92 | 3.77 | 3.35 | <0.0001 | 2.89 | 2.99 | 2.88 | 0.6201 |
| Wine | ||||||||||||
| Red wine | 4.77 | 3.30 | 2.95 | <0.0001 | 4.21 | 3.62 | 2.80 | <0.0001 | 3.13 | 2.88 | 2.55 | 0.0002 |
| White wine | 4.68 | 3.19 | 2.94 | <0.0001 | 4.44 | 3.59 | 2.93 | <0.0001 | 3.38 | 2.77 | 2.55 | <0.0001 |
Publisher’s Note: MDPI stays neutral with regard to jurisdictional claims in published maps and institutional affiliations. |
© 2022 by the authors. Licensee MDPI, Basel, Switzerland. This article is an open access article distributed under the terms and conditions of the Creative Commons Attribution (CC BY) license (https://creativecommons.org/licenses/by/4.0/).
Share and Cite
Fjaeldstad, A.W.; Smith, B. The Effects of Olfactory Loss and Parosmia on Food and Cooking Habits, Sensory Awareness, and Quality of Life—A Possible Avenue for Regaining Enjoyment of Food. Foods 2022, 11, 1686. https://doi.org/10.3390/foods11121686
Fjaeldstad AW, Smith B. The Effects of Olfactory Loss and Parosmia on Food and Cooking Habits, Sensory Awareness, and Quality of Life—A Possible Avenue for Regaining Enjoyment of Food. Foods. 2022; 11(12):1686. https://doi.org/10.3390/foods11121686
Chicago/Turabian StyleFjaeldstad, Alexander Wieck, and Barry Smith. 2022. "The Effects of Olfactory Loss and Parosmia on Food and Cooking Habits, Sensory Awareness, and Quality of Life—A Possible Avenue for Regaining Enjoyment of Food" Foods 11, no. 12: 1686. https://doi.org/10.3390/foods11121686
APA StyleFjaeldstad, A. W., & Smith, B. (2022). The Effects of Olfactory Loss and Parosmia on Food and Cooking Habits, Sensory Awareness, and Quality of Life—A Possible Avenue for Regaining Enjoyment of Food. Foods, 11(12), 1686. https://doi.org/10.3390/foods11121686