
Effects of Jet Milling Pretreatment and Esterification with Octenyl Succinic Anhydride on Physicochemical Properties of Corn Starch
 , , ,
, , ,
Abstract
:1. Introduction
2. Materials and Methods
2.1. Materials
2.2. Jet Milling Pretreatment
2.3. Preparation of Octenyl Succinate Starch
2.4. Octenyl Succinate Starch Particle Size, Degree of Substitution, and Reaction Efficiency
2.4.1. Particle Size
2.4.2. Octenyl Succinate Starch DS and RE
2.5. Microscopy Observation
2.5.1. SEM
2.5.2. CLSM
2.6. XRD and FTIR
2.6.1. XRD
2.6.2. FTIR
2.7. XPS
2.8. Nuclear Magnetic Resonance H and C Spectra
2.8.1. Nuclear Magnetic Resonance H Spectra
2.8.2. Nuclear Magnetic Resonance C Spectra
2.9. Thermodynamic Properties
2.10. Pasting Characteristics
2.11. Transparency Measurement
2.12. Emulsifying Ability and Emulsification Stability Index
2.13. Statistical Analysis
3. Results
3.1. Octenyl Succinate Starch Particle Size, Degree of Substitution, and Reaction Efficiency
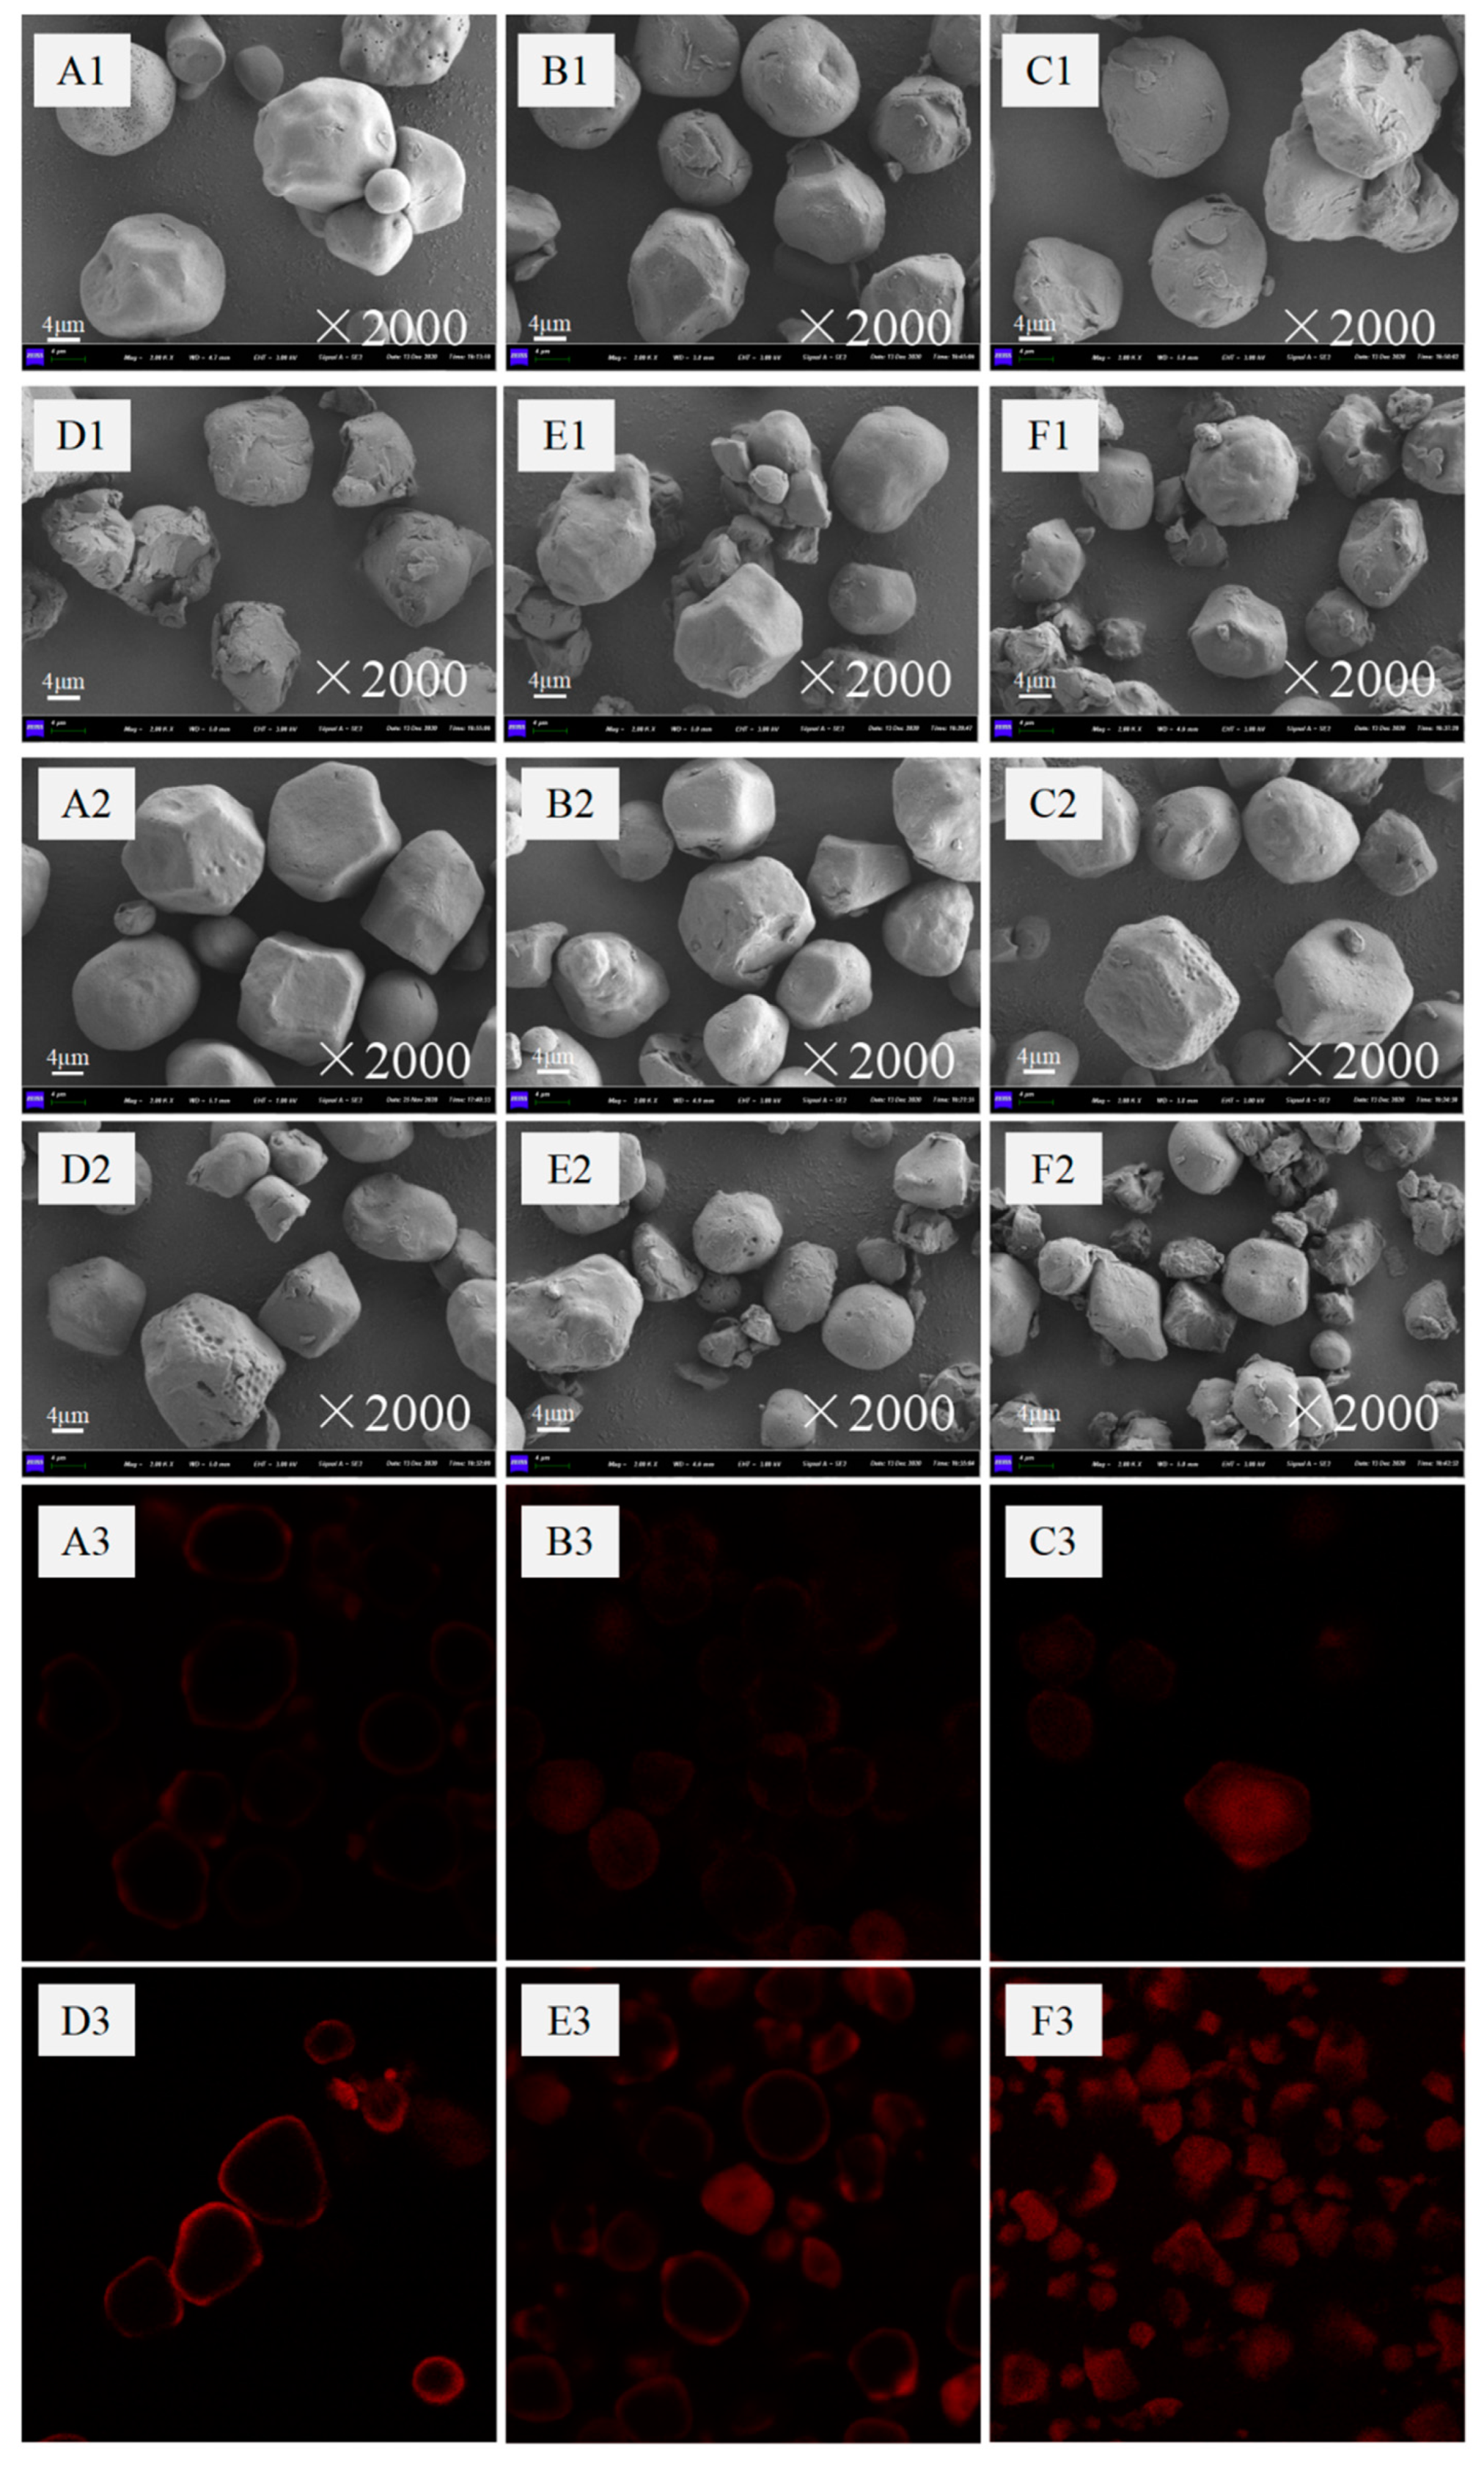
3.2. SEM and CLSM
3.3. XRD and FTIR
3.3.1. XRD
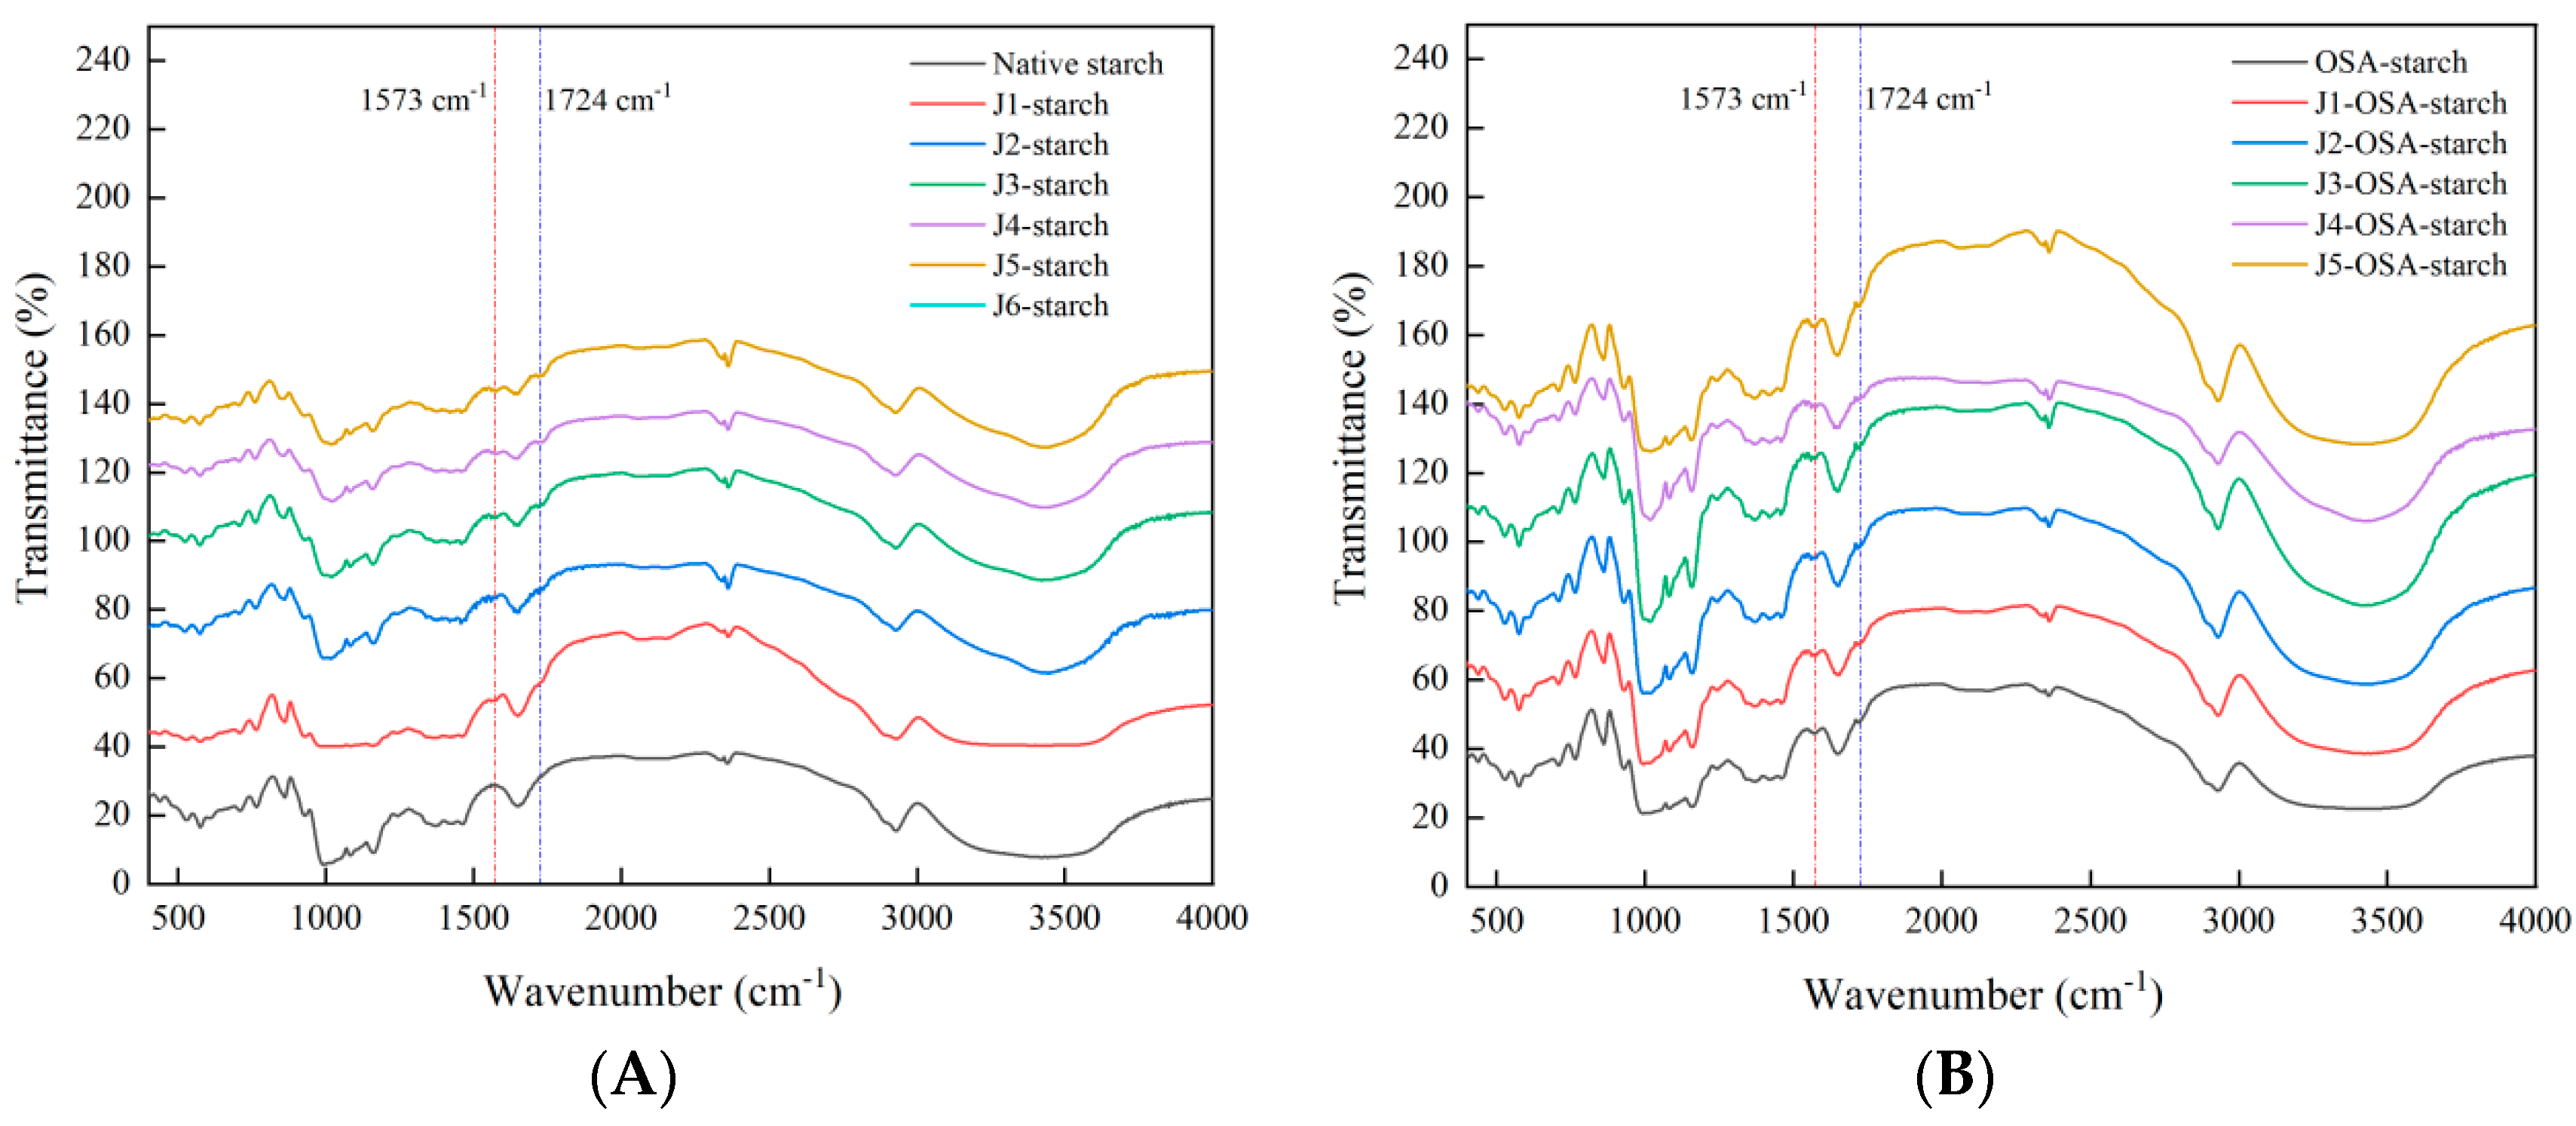
3.3.2. FTIR
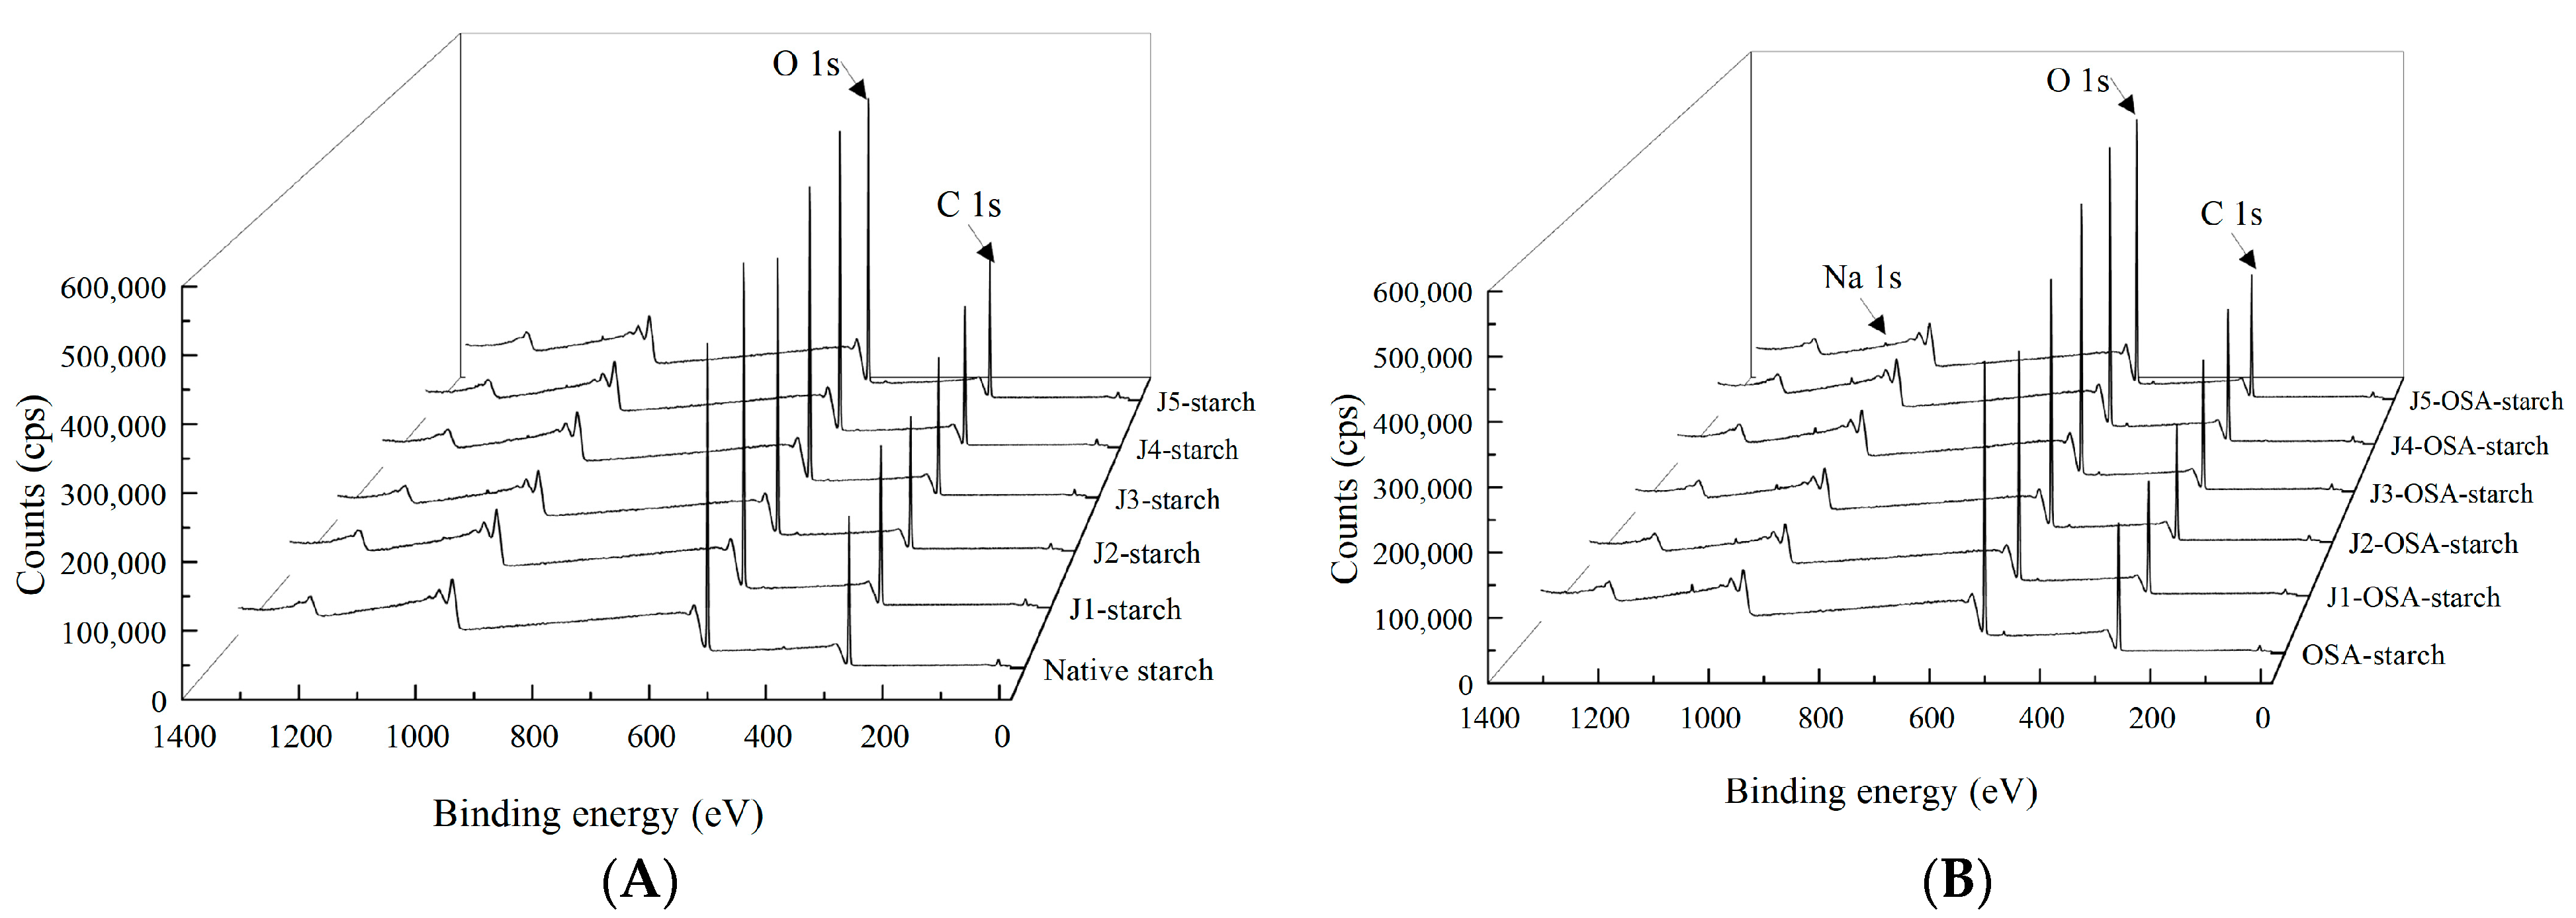
3.4. XPS
3.5. 1H-NMR and 13C-NMR
3.6. Thermodynamic Properties
3.7. Pasting Characteristics
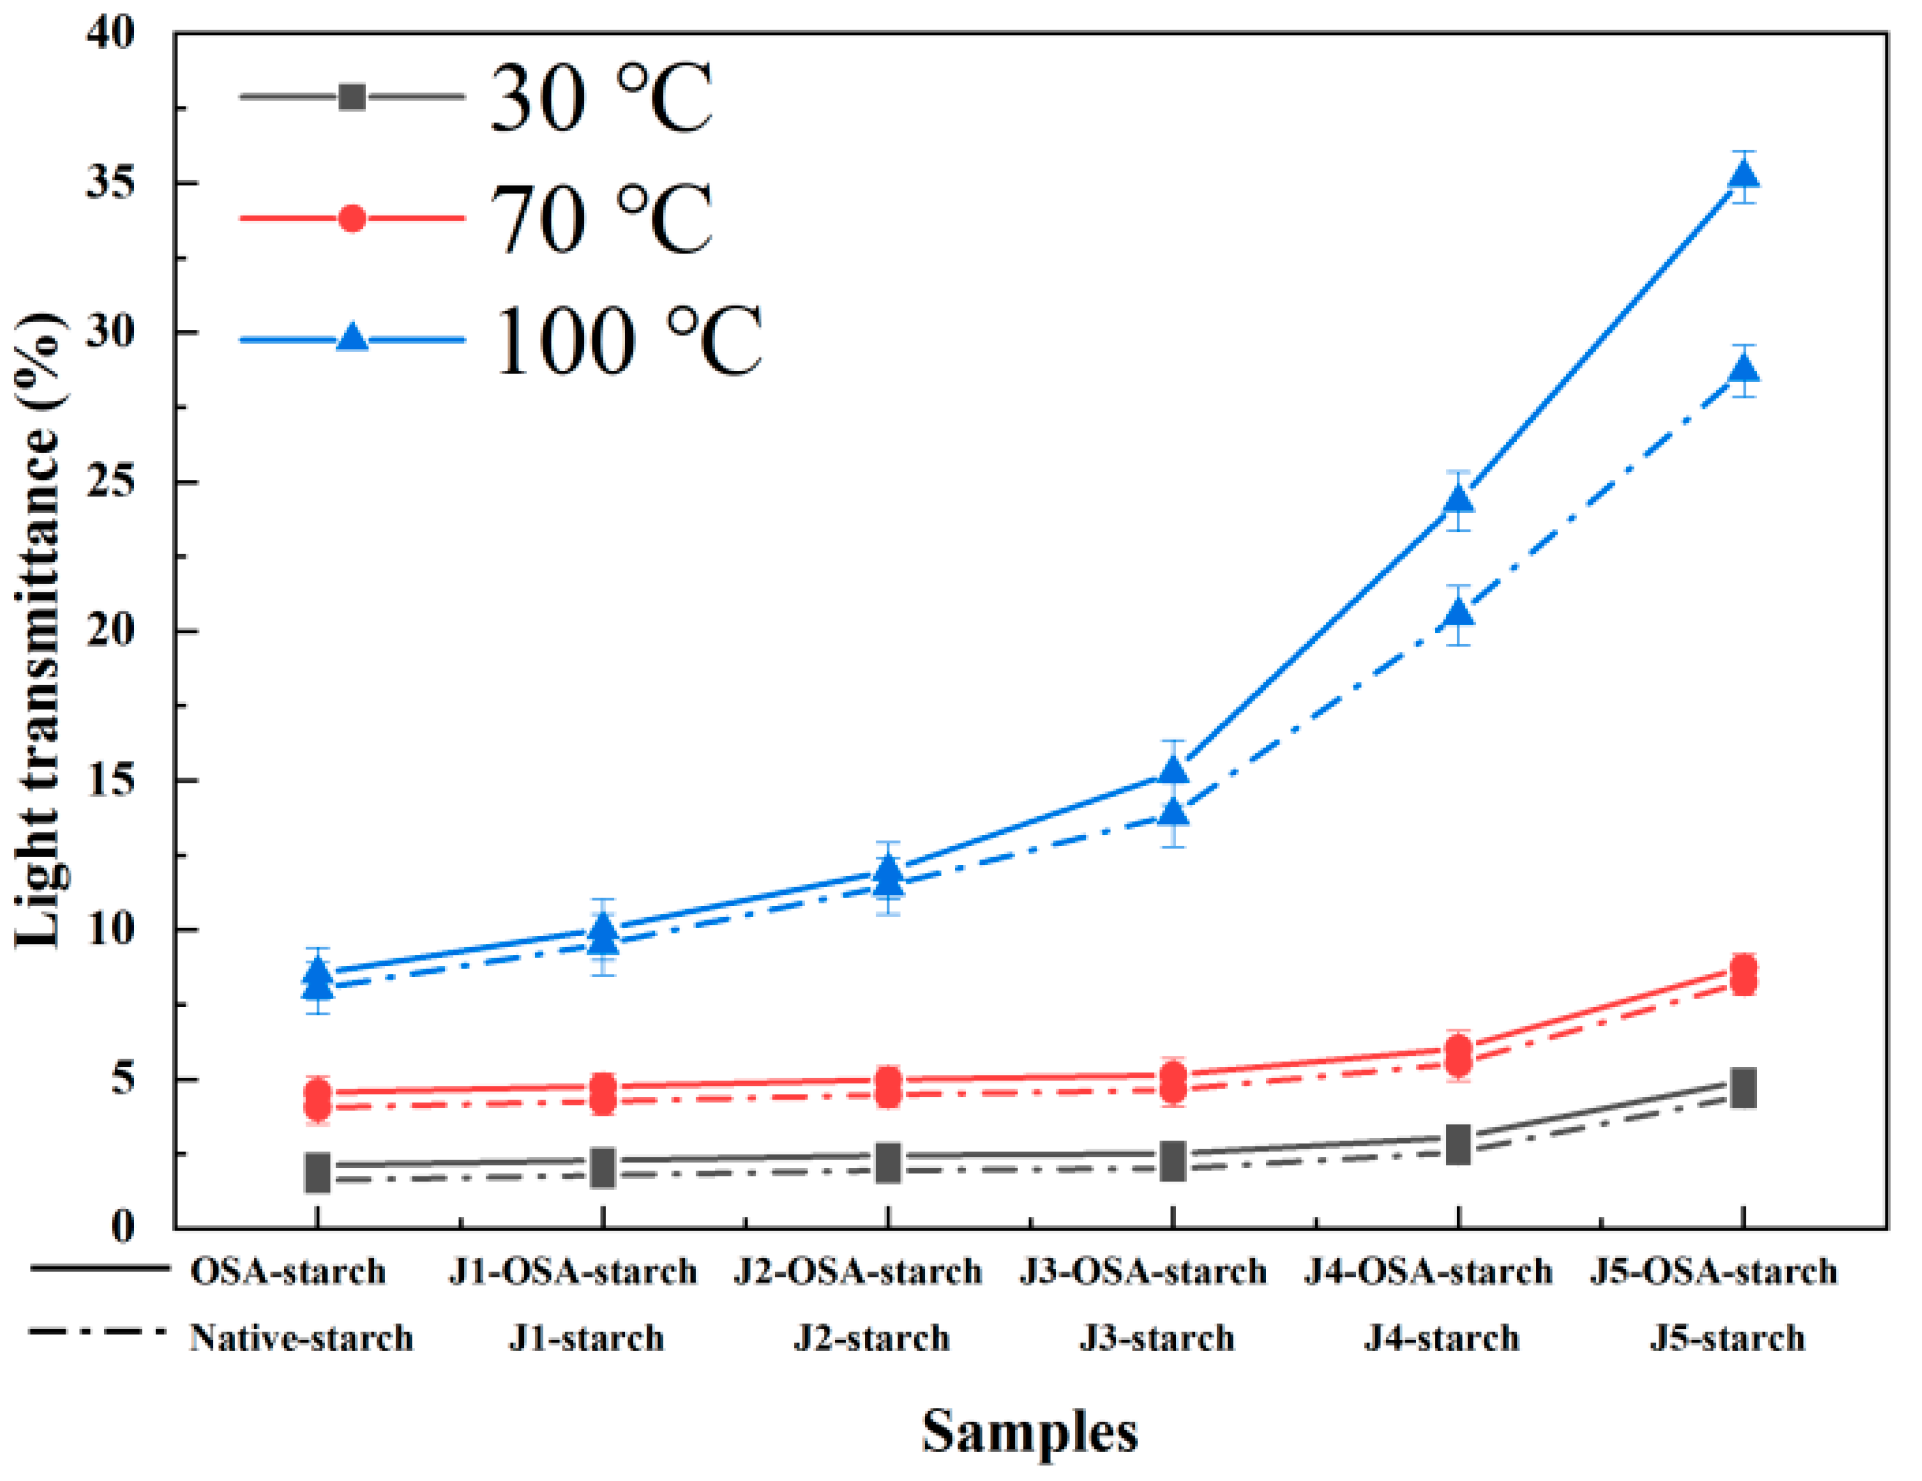
3.8. Transparency
3.9. Emulsifying Ability and Emulsification Stability Index
4. Conclusions
Author Contributions
Funding
Data Availability Statement
Conflicts of Interest
Abbreviations
| OSA | Octenyl succinic anhydride |
| OSA-starch | Octenyl succinate starch |
| J-OSA-starch | Jet milling pretreated octenyl octenyl succinate starch |
| J1-OSA-starch | 1200 rpm jet milling pretreated octenyl octenyl succinate starch |
| J2-OSA-starch | 1800 rpm jet milling pretreated octenyl octenyl succinate starch |
| J3-OSA-starch | 2400 rpm jet milling pretreated octenyl octenyl succinate starch |
| J4-OSA-starch | 3000 rpm jet milling pretreated octenyl octenyl succinate starch |
| J5-OSA-starch | 3600 rpm jet milling pretreated octenyl octenyl succinate starch |
| J-starch | Jet milling pretreated starch |
| J1-starch | 1200 rpm jet milling pretreated starch |
| J2-starch | 1800 rpm jet milling pretreated starch |
| J3-starch | 2400 rpm jet milling pretreated starch |
| J4-starch | 3000 rpm jet milling pretreated starch |
| J5-starch | 3600 rpm jet milling pretreated starch |
| D10, D50, D90 | Equivalent diameters at cumulative volumes of 10%, 50%, and 90% |
| DS | Degree of substitution |
| RE | Reaction efficiency |
| Sw | Mean weight-specific surface area |
| SEM | Scanning electron microscope |
| CLSM | Confocal laser scanning microscope |
| XRD | X-ray diffraction |
| FT-IR | Fourier transform infrared |
| XPS | X-ray photoelectron spectroscopy |
| 1H-NMR | 1H solid-state nuclear magnetic resonance |
| 13C-NMR | 13C solid-state nuclear magnetic resonance |
| DSC | Differential scanning calorimetry |
| T0 | Onset temperature |
| Tp | Peak temperature |
| Tc | Conclusion temperature |
| ΔH | Enthalpy change |
| RVA | Rapid visco analyzer |
| PV | Peak viscosity |
| TV | Trough viscosity |
| FV | Final viscosity |
| BD | Breakdown viscosity |
| SB | Setback viscosity |
| PT | Pasting temperature |
| EA | Emulsifying ability |
| ESI | Emulsification stability index |
References
- Altuna, L.; Herrera, M.L.; Foresti, M.L. Synthesis and characterization of octenyl succinic anhydride modified starches for food applications. a review of recent literature—Sciencedirect. Food Hydrocoll. 2018, 80, 97–110. [Google Scholar] [CrossRef]
- Sweedman, M.C.; Tizzotti, M.J.; Schäfer, C.; Gilbert, R.G. Structure and physicochemical properties of octenyl succinic anhydride modified starches: A review. Carbohydr. Polym. 2013, 92, 905–920. [Google Scholar] [CrossRef] [PubMed]
- Mora, P.C.; Martinez-Alejo, M.J.; Lr, D.; Roman, L.; Martinez, M.M.; Carvajal, T.; Pinal, R.; Mora-Huertas, C.E. Molecular and physical characterization of octenyl succinic anhydride-modified starches with potential applications in pharmaceutics- sciencedirect. Int. J. Pharm. 2020, 579, 119163. [Google Scholar] [CrossRef]
- Sun, S.W.; Xiong, L.; Zhao, B.B.; Wang, B.L.; Guo, Z.B. Structural properties of lotus seed starch prepared by octenyl succinic anhydride esterification assisted by high hydrostatic pressure treatment. LWT 2020, 117, 108698. [Google Scholar] [CrossRef]
- Lü, P.; Zhu, W.L.; Shi, L.F.; Zhang, J.; Li, J.D.; Chou, D. Progress in synthesis and structural characterization of sodium starch octenyl succinate. China Food Addit. 2019, 30, 6. [Google Scholar]
- Protonotariou, S.; Ritzoulis, C.; Mandala, I. Jet milling conditions impact on wheat flour particle size. J. Food Eng. 2021, 294, 110418. [Google Scholar] [CrossRef]
- Huang, Z.; Lu, J.; Li, X.; Tong, Z. Effect of mechanical activation on physico-chemical properties and structure of cassava starch. Carbohydr. Polym. 2007, 68, 128–135. [Google Scholar] [CrossRef]
- Wang, L.; Li, X.; Yu, S.; Liu, S.; Lang, S. Understanding the changes in particle size, structure, and functional properties of waxy maize starch after jet illing treatments. J. Food Process Eng. 2021, 44, 13670. [Google Scholar] [CrossRef]
- Zhang, Y.; Dai, Y.; Hou, H.; Li, X.; Zhang, H. Ultrasound-assisted preparation of octenyl succinic anhydride modified starch and its influence mechanism on the quality. Food Chem. 2020, 5, 100077. [Google Scholar] [CrossRef]
- Wang, L.; Hou, Y.; Liu, S.; Lang, S.; Xiao, Z. Effect of Jet Milling on Microstructure and Aging Characteristics of Maize Starch. Food Sci. 2020, 41, 86–93. [Google Scholar]
- Pan, Y.; Wu, Z.; Zhang, B.; Li, X.; Meng, R.; Chen, H. Preparation and characterization of emulsion stabilized by octenyl succinic anhydride-modified dextrin for improving storage stability and curcumin encapsulation. Food Chem. 2019, 294, 326–332. [Google Scholar] [CrossRef] [PubMed]
- Tian, Y.; Ying, M.; Shi, F.; Shi, J.; Xue, S. The effect of ball milling treatment on structure and porosity of maize starch granule. Innov. Food Sci. Emerg. Technol. 2011, 12, 586–593. [Google Scholar]
- Jayaraj, S.; Ramakrishnan, M. Environmental effect on the laser-excited fluorescence spectra of methylene blue and methylene green dyes. J. Incl. Phenom. Macrocycl. Chem. 2001, 40, 203–206. [Google Scholar] [CrossRef]
- Zeng, H.; Chen, P.; Chuan, J. Structural properties and prebiotic activities of fractionated lotus seed resistant starches. Food Chem. 2018, 251, 33–40. [Google Scholar] [CrossRef]
- Yuan, W.; Ling, Q.; Li, J.; Deng, C.; Zhu, H. Characterization of crystalline sicn formed during the nitridation of silicon and cornstarch powder compacts. J. Alloys Compd. 2017, 725, 326–333. [Google Scholar] [CrossRef]
- Hui, C.; Xu, K.; Xue, D.; Song, C.; Zhang, W.; Wang, P. Synthesis of dodecenyl succinic anhydride (ddsa) corn starch. Food Res. Int. 2007, 40, 232–238. [Google Scholar]
- Falk, H.; Micura, R.; Michael, S.D. Structural aspects of native and acid or enzyme degraded amylopectins—A 13c nmr study. Starch—Stärke 1996, 48, 344–346. [Google Scholar] [CrossRef]
- Gonzalez, L.; Loubes, M.; Tolaba, M. Incidence of milling energy on dry-milling attributes of rice starch modified by planetary ball milling. Food Hydrocoll. 2018, 82, 155–163. [Google Scholar] [CrossRef]
- Zhang, J. Physicochemical Properties and Heat-moisture Treatment of Black Rice Starch. Guangxi Univ. 2019, 15–18. [Google Scholar]
- Miao, M.; Li, R.; Bo, J.; Cui, S.; Tao, Z.; Jin, Z. Structure and physicochemical properties of octenyl succinic esters of sugary maize soluble starch and waxy maize starch. Food Chem. 2014, 151, 154–160. [Google Scholar] [CrossRef]
- Sun, S.; Xue, D.; Tan, Y. Preparation of Starch Octanoate and Its Emulsifying Properties. Fine Chem. 2011, 28, 120–124. [Google Scholar]
- Li, T. Effects of Different Pre-treatments on the Preparation andproperties of Starch Octenylsuccinate. Tianjin Univ. Sci. Technol. 2018, 36–39. [Google Scholar]
- Zhang, B.; Huang, Q.; Luo, F.; Xiong, F.; Jiang, H.; Jane, J. Effects of octenylsuccinylation on the structure and properties of high-amylose maize starch. Carbohydr. Polym. 2011, 84, 1276–1281. [Google Scholar] [CrossRef]
- Liu, W.; Li, Y.; Goff, H.; Nsor-Atindana, J.; Zhong, F. Distribution of octenylsuccinic groups in modified waxy maize starch: An analysis at granular level. Food Hydrocoll. 2018, 84, 210–218. [Google Scholar] [CrossRef]
- Huang, Z. Study on Mechanical Activation of Starch and Its Properties. Guangxi Univ. 2006, 26–28. [Google Scholar]
- Li, H.; Ma, Y.; Yu, L. Structure Characterization of Octenyl Succinic Anhydride Modified Porous Starch. J. Chin. Cereals Oils 2020, 35, 70–75. [Google Scholar]
- Zhang, Z. Study on Mechanically Rice Starch and Esterified by Octenyl Succinic Anhydride. Huazhong Agric. Univ. 2010, 63–71. [Google Scholar]
- Yin, S.; Huang, Q. Application of X-Ray Photoelectron Spectroscopy in Study on Surface Group Distribution of Modified Starch Granules. Cereal Feed. Ind. 2007, 6, 32–33. [Google Scholar]
- Liu, W. Correlation Analysis between Structural Characteristics and Emulsification Capacity of OSA Starch. Jiangnan Univ. 2019, 46–49. [Google Scholar]
- Han, M.; Wu, X.; Peng, Y.; Yu, H. Preparation of low degree of substitution octenyl succinic starch ester by response surface methodology and its property analysis. J. Food Processing Preserv. 2022, 46, e16125. [Google Scholar] [CrossRef]
- Ortega-Ojeda, F.; Larsson, H.; Eliasson, A. Gel formation in mixtures of hydrophobically modified potato and high amylopectin potato starch. Carbohydr. Polym. 2005, 59, 313–327. [Google Scholar] [CrossRef]
- Bao, J.; Xing, J.; Phillips, D.; Corke, H. Physical properties of octenyl succinic anhydride modified rice, wheat, and potato starches. J. Agric. Food Chem. 2003, 51, 2283–2287. [Google Scholar] [CrossRef] [PubMed]
- Thirathumthavorn, D.; Charoenrein, S. Thermal and pasting properties of native and acid-treated starches derivatized by 1-octenyl succinic anhydride. Carbohydr. Polym. 2006, 66, 258–265. [Google Scholar] [CrossRef]
- Nilsson, L.; Bergenst, H. Emulsification and adsorption properties of hydrophobically modified potato and barley starch. J. Agric. Food Chem. 2007, 55, 1469. [Google Scholar] [CrossRef] [PubMed]


| Samples | D10 (μm) | D50 (μm) | D90 (μm) | Sw (m2/g) | DS | RE (%) |
|---|---|---|---|---|---|---|
| Native starch | 5.87 ± 0.07 a | 13.43 ± 0.03 a | 20.06 ± 0.02 a | 0.237 ± 0.001 a | —— | —— |
| J1-starch | 4.78 ± 0.02 b | 12.53 ± 0.04 b | 19.21 ± 0.06 b | 0.264 ± 0.002 b | —— | —— |
| J2-starch | 4.08 ± 0.08 c | 11.59 ± 0.02 c | 18.29 ± 0.07 b | 0.286 ± 0.001 c | —— | —— |
| J3-starch | 3.15 ± 0.02 d | 10.22 ± 0.02 d | 16.57 ± 0.02 c | 0.318 ± 0.002 d | —— | —— |
| J4-starch | 2.37 ± 0.04 e | 8.85 ± 0.06 e | 14.93 ± 0.26 d | 0.368 ± 0.006 e | —— | —— |
| J5-starch | 2.08 ± 0.0.06 f | 7.70 ± 0.04 f | 13.34 ± 0.05 e | 0.403 ± 0.005 f | —— | —— |
| OSA-starch | 5.89 ± 0.09 a | 13.48 ± 0.02 a | 20.09 ± 0.01 a | 0.238 ± 0.002 a | 0.0170 ± 0.0007 a | 73.50 ± 0.90 d |
| J1-OSA-starch | 4.78 ± 0.01 b | 12.57 ± 0.05 b | 19.26 ± 0.07 b | 0.265 ± 0.001 b | 0.0172 ± 0.0004 b | 74.30 ± 0.90 d |
| J2-OSA-starch | 4.14 ± 0.09 c | 11.70 ± 0.15 c | 18.35 ± 0.08 b | 0.284 ± 0.003 c | 0.0175 ± 0.0005 c | 75.60 ± 0.40 c |
| J3-OSA-starch | 3.15 ± 0.01 d | 10.23 ± 0.01 d | 16.59 ± 0.04 c | 0.318 ± 0.001 d | 0.0179 ± 0.0002 d | 77.40 ± 0.90 b |
| J4-OSA-starch | 2.41 ± 0.06 e | 8.94 ± 0.13 e | 15.19 ± 0.37 d | 0.363 ± 0.007 e | 0.0183 ± 0.0006 e | 79.10 ± 0.90 b |
| J5-OSA-starch | 2.12 ± 0.05 f | 7.75 ± 0.06 f | 13.37 ± 0.04 e | 0.399 ± 0.006 f | 0.0186 ± 0.0003 f | 80.40 ± 1.30 a |
| Samples | Native Starch | J1 | J2 | J3 | J4 | J5 | OSA-Starch | J1-OSAh | J2-OSA | J3-OSA | J4-OSA | J5-OSA |
|---|---|---|---|---|---|---|---|---|---|---|---|---|
| C (%) | 56.50 | 57.03 | 57.18 | 56.77 | 56.32 | 56.87 | 56.9 | 57.00 | 57.60 | 57.90 | 58.40 | 58.60 |
| O (%) | 42.70 | 42.26 | 42.10 | 42.53 | 42.95 | 42.41 | 42.1 | 41.80 | 41.20 | 41.00 | 40.50 | 40.20 |
| Na (%) | 0 | 0 | 0 | 0 | 0 | 0 | 0.23 | 0.30 | 0.37 | 0.43 | 0.49 | 0.56 |
| N/(%) | 0.72 | 0.71 | 0.72 | 0.70 | 0.73 | 0.72 | 0.95 | 1.08 | 1.09 | 1.02 | 0.99 | 1.12 |
| Samples | T0 (°C) | TP (°C) | TC (°C) | ∆H (J/g) |
|---|---|---|---|---|
| Native starch | 62.58 ± 0.03 a | 68.42 ± 0.04 a | 89.12 ± 0.23 a | 17.02 ± 0.09 a |
| J1-starch | 56.48 ± 0.05 c | 68.44 ± 0.06 a | 83.15 ± 0.27 b | 9.80 ± 0.12 b |
| J2-starch | 61.44 ± 0.11 b | 66.77 ± 0.07 b | 83.61 ± 0.16 c | 8.81 ± 0.13 c |
| J3-starch | 55.83 ± 0.18 d | 65.19 ± 0.02 c | 81.80 ± 0.21 d | 5.65 ± 0.09 d |
| J4-starch | 53.81 ± 0.20 e | 61.45 ± 0.04 d | 77.65 ± 0.16 e | 2.52 ± 0.14 e |
| J5-starch | 52.74 ± 0.05 f | 61.4 ± 0.06 d | 74.63 ± 0.21 f | 1.89 ± 0.13 f |
| OSA-starch | 61.88 ± 0.03 a | 67.51 ± 0.03 a | 88.34 ± 0.05 a | 16.78 ± 0.03 a |
| J1-OSA-starch | 61.53 ± 0.03 b | 67.35 ± 0.04 a | 86.95 ± 0.33 b | 16.15 ± 0.07 b |
| J2-OSA-starch | 61.44 ± 0.09 b | 67.10 ± 0.01 b | 83.34 ± 0.12 c | 14.37 ± 0.28 c |
| J3-OSA-starch | 60.75 ± 0.18 c | 67.01 ± 0.02 c | 82.86 ± 0.21 d | 12.98 ± 0.18 d |
| J4-OSA-starch | 59.77 ± 0.18 d | 66.81 ± 0.06 d | 80.92 ± 0.15 e | 11.97 ± 0.11 e |
| J5-OSA-starch | 59.40 ± 0.05 d | 65.98 ± 0.08 e | 77.63 ± 0.11 f | 10.60 ± 0.22 f |
| Parameters | Native Starch | OSA-Starch | J1-OSA-Starch | J2-OSA-Starch | J3-OSA-Starch | J4-OSA-Starch | J5-OSA-Starch | |
|---|---|---|---|---|---|---|---|---|
| RVA | PV (cp) | 5149 ± 12 e | 8991 ± 15 a | 7771 ± 13 b | 6223 ± 9 c | 5156 ± 15 d | 4541 ± 16 f | 4012 ± 10 g |
| TV (cp) | 4013 ± 16 d | 5101 ± 12 a | 4577 ± 9 b | 4263 ± 7 c | 3626 ± 13 e | 3043 ± 5 f | 2413 ± 11 g | |
| FV (cp) | 4817 ± 5 d | 6077 ± 7 a | 5503 ± 14 b | 5072 ± 12 c | 4389 ± 18 e | 3745 ± 11 f | 3021 ± 9 g | |
| BD (cp) | 1136 ± 12 g | 3890 ± 14 a | 3194 ± 19 b | 1960 ± 9 c | 1530 ± 15 d | 1498 ± 12 e | 1599 ± 13 f | |
| SB(cp) | 804 ± 14 c | 976 ± 10 a | 926 ± 8 b | 809 ± 6 c | 763 ± 12 d | 702 ± 11 e | 608 ± 14 f | |
| PT (°C) | 74.25 ± 0.50 a | 73.14 ± 0.70 b | 72.20 ± 0.30 c | 71.04 ± 0.20 d | 70.10 ± 0.80 e | 68.55 ± 0.70 f | 66.65 ± 0.80 g | |
| EA and ESI | EA | 0.26 ± 0.02 a | 0.46 ± 0.01 b | 0.54 ± 0.01 c | 0.62 ± 0.02 d | 0.69 ± 0.01 e | 0.73 ± 0.01 f | 0.82 ± 0.01 g |
| ESI (min) | 92.5 ± 10.2 g | 152.8 ± 9.1 f | 209.2 ± 12.5 e | 264.9 ± 15.8 d | 303.3 ± 20.5 c | 352.7 ± 22.4 b | 410.1 ± 21.6 a |
Publisher’s Note: MDPI stays neutral with regard to jurisdictional claims in published maps and institutional affiliations. |
© 2022 by the authors. Licensee MDPI, Basel, Switzerland. This article is an open access article distributed under the terms and conditions of the Creative Commons Attribution (CC BY) license (https://creativecommons.org/licenses/by/4.0/).
Share and Cite
Wang, L.; Li, X.; Gao, F.; Liu, S.; Wu, Y.; Liu, Y.; Zhang, D. Effects of Jet Milling Pretreatment and Esterification with Octenyl Succinic Anhydride on Physicochemical Properties of Corn Starch. Foods 2022, 11, 2893. https://doi.org/10.3390/foods11182893
Wang L, Li X, Gao F, Liu S, Wu Y, Liu Y, Zhang D. Effects of Jet Milling Pretreatment and Esterification with Octenyl Succinic Anhydride on Physicochemical Properties of Corn Starch. Foods. 2022; 11(18):2893. https://doi.org/10.3390/foods11182893
Chicago/Turabian StyleWang, Lidong, Xiaoqiang Li, Fei Gao, Shilin Liu, Yanchun Wu, Ying Liu, and Dongjie Zhang. 2022. "Effects of Jet Milling Pretreatment and Esterification with Octenyl Succinic Anhydride on Physicochemical Properties of Corn Starch" Foods 11, no. 18: 2893. https://doi.org/10.3390/foods11182893