Article

The Quality Changes and Proteomic Analysis of Cattle Muscle Postmortem during Rigor Mortis

1
Institute of Food Science and Technology, Chinese Academy of Agricultural Sciences/Key Laboratory of Agro-Products Processing, Ministry of Agriculture and Rural Affairs, Beijing 100193, China
2
State Key Laboratory of Applied Organic Chemistry and College of Chemistry and Chemical Engineering, Lanzhou University, Lanzhou 730000, China
*
Author to whom correspondence should be addressed.
Foods 2022, 11(2), 217; https://doi.org/10.3390/foods11020217
Submission received: 25 November 2021 / Revised: 26 December 2021 / Accepted: 8 January 2022 / Published: 13 January 2022
(This article belongs to the Special Issue Postmortem Factors Affecting Meat Quality)

Abstract

:
Rigor mortis occurs in a relatively early postmortem period and is a complex biochemical process in the conversion of muscle to meat. Understanding the quality changes and biomarkers during rigor mortis can provide a theoretical basis for maintaining and improving meat quality. Herein, a tandem mass tag proteomic method is used to investigate the effects of differentially expressed proteins on the meat quality of cattle Longissimus lumborum muscle postmortem (0, 6, and 24 h). The pH, total sulfhydryl content and sarcomere length decrease significantly during storage. In contrast, meat color values (L*, a*, and b*) and the myofibril fragmentation index increase significantly. Altogether, 147 differentially expressed proteins are identified, most being categorized as metabolic enzymes, mitochondrial proteins, necroptosis and ferroptosis proteins and structural proteins. The results also reveal additional proteins that are potentially involved in rigor mortis, such as cardiac phospholamban, acetyl-coenzyme A acyltransferase, and ankyrin repeat domain 2. The current results provide proteomic insights into the changes in meat quality during rigor mortis.

Graphical Abstract

1. Introduction

Tenderness is an important indicator affecting both meat quality and the purchase intention of consumers. Decreased tenderness (the opposite of tenderness) may be due to background toughness and myofibrillar toughness [1]. Myofibrillar toughness is affected by three phases: the prerigor phase, rigor phase and tenderization phase [2]. Rigor mortis, including delayed phase and rapid phase, is one of the most important and complex biochemical processes in the conversion of muscle to meat. It occurs in a relatively early postmortem (PM) period, resulting in an increase in the toughness of the meat [3]. Even though the blood circulation that supplies oxygen and removes the end products of metabolism is exhausted, the muscles still maintain function and metabolic activity. The sole purpose of anaerobic metabolism of glycogen and high-energy phosphate compounds is to produce adenosine triphosphate (ATP) in the early postmortem muscles. Lactate and hydrogen ions (H+) are the end products of glycolysis and ATP hydrolysis, respectively. They accumulate in muscles due to the lack of an effective elimination mechanism, leading to a decrease in pH [4]. This acidification leads to the reduction of water-holding capacity (WHC) and the release of calcium, resulting in the formation of a cross bridge between myosin and actin filaments [5]. In addition, as the glycogen level in the muscle decreases after slaughter, the available energy to maintain the relaxed state of the muscle is also reduced. The combination of these factors results in the onset and development of rigor mortis [6]. Accordingly, it is particularly important to illuminate the complex biochemical mechanism of rigor mortis for the preservation of meat after slaughter and the improvement of the profitability of the meat industry.
Proteomics can be defined as the science of studying a subset of all proteins expressed in a certain cell or tissue and has been employed in meat science to explore molecular mechanisms occurring in muscle and affecting meat quality [7]. Proteomic research on beef is the first step to understanding the mechanism of the conversion from muscle to meat and the control of meat quality. The effects of complex proteolysis and the interaction of soluble muscle proteins in aging on meat quality remain major challenges. Finding new protein biomarkers that regulate muscle growth would help scientists test better experimental hypotheses, enabling the meat production industry and consumers to obtain better quality meat [8]. In recent years, scientists have discovered some metabolic enzymes, heat shock proteins (HSPs), oxidative proteins, structural proteins, and proteases related to meat tenderness, color, and WHC as protein biomarkers through proteomics. Metabolic enzymes including glyceraldehyde-3-phosphate dehydrogenase (GAPDH), glycogen phosphorylase (PYGM), pyruvate kinase isozymes M2 isoform (PKM2), adenylate kinase isoenzyme 1 (AK1), fructose-bisphosphate aldolase A isoform (ALDOA), triosephosphate isomerase (TPI1), retinal dehydrogenase 1 (ALDH1A1), malate dehydrogenase (MDH1), and lactoylglutathione lyase (GLO1) are closely correlated with meat color and pH in M longissimus lumborum during PM storage [5,9,10]. Similarly, beta-enolase (ENO3), phosphoglucomutase-1 (PGM1), protein-L-isoaspartate O-methyltransferase (PCMT1), and proteasome subunit beta type-2 (PSMB2) are correlated with the pH and a* value of meat from semitendinosus by Pearson’s correlation analysis [11]. In addition, HSPB1, αβ-crystallin, HSP40, HSP70-8 and HSP90 belong to the family of HSPs that can regulate meat quality [9,12,13]. Peroxiredoxin-1 (PRDX1), peroxiredoxin-2 (PRDX2), peroxiredoxin-6 (PRDX6), superoxide dismutase (SOD), and DJ-1 (PARK7) have a key role in the degradation of peroxide and show an increase in oxidative damage in the tender meat group compared to the intermediate and tough meat groups [14]. Structural proteins, including α-actin, titin, and myosin heavy chain (MyHC), were of great significance to discriminate the meat color classes [15]. Myosin regulatory light chain 2, keratin, and desmin significantly varied between low- and high-drip groups in the pectoralis major of geese [13]. In the process of meat aging, proteases such as calpains, caspases, lysosomal cathepsins, and proteasomes hydrolyze structural proteins to increase the tenderness of meat [16]. Of the proteins summarized above, it is possible that one protein regulates multiple characteristics of meat quality, and that there are interactions between proteins to regulate meat quality. At present, the application of proteomics is mainly focused on the aging of muscle PM. However, there are few studies focusing on protein changes in rigor mortis, and new protein biomarkers need to be explored to supplement the mechanism of rigor mortis in the process of converting from muscle to meat.
The objective of this study is to investigate protein changes in rigor mortis. Tandem mass tags (TMTs) for quantitation analysis of longissimus lumborum (LL) muscle from cattle with different rigor mortis times were executed. It is hoped that the data will provide a new perspective for the improvement of biochemical mechanisms, discovery of potential protein biomarkers in rigor mortis, and subsequent exploration of the mechanism of meat quality changes.

2. Materials and Methods

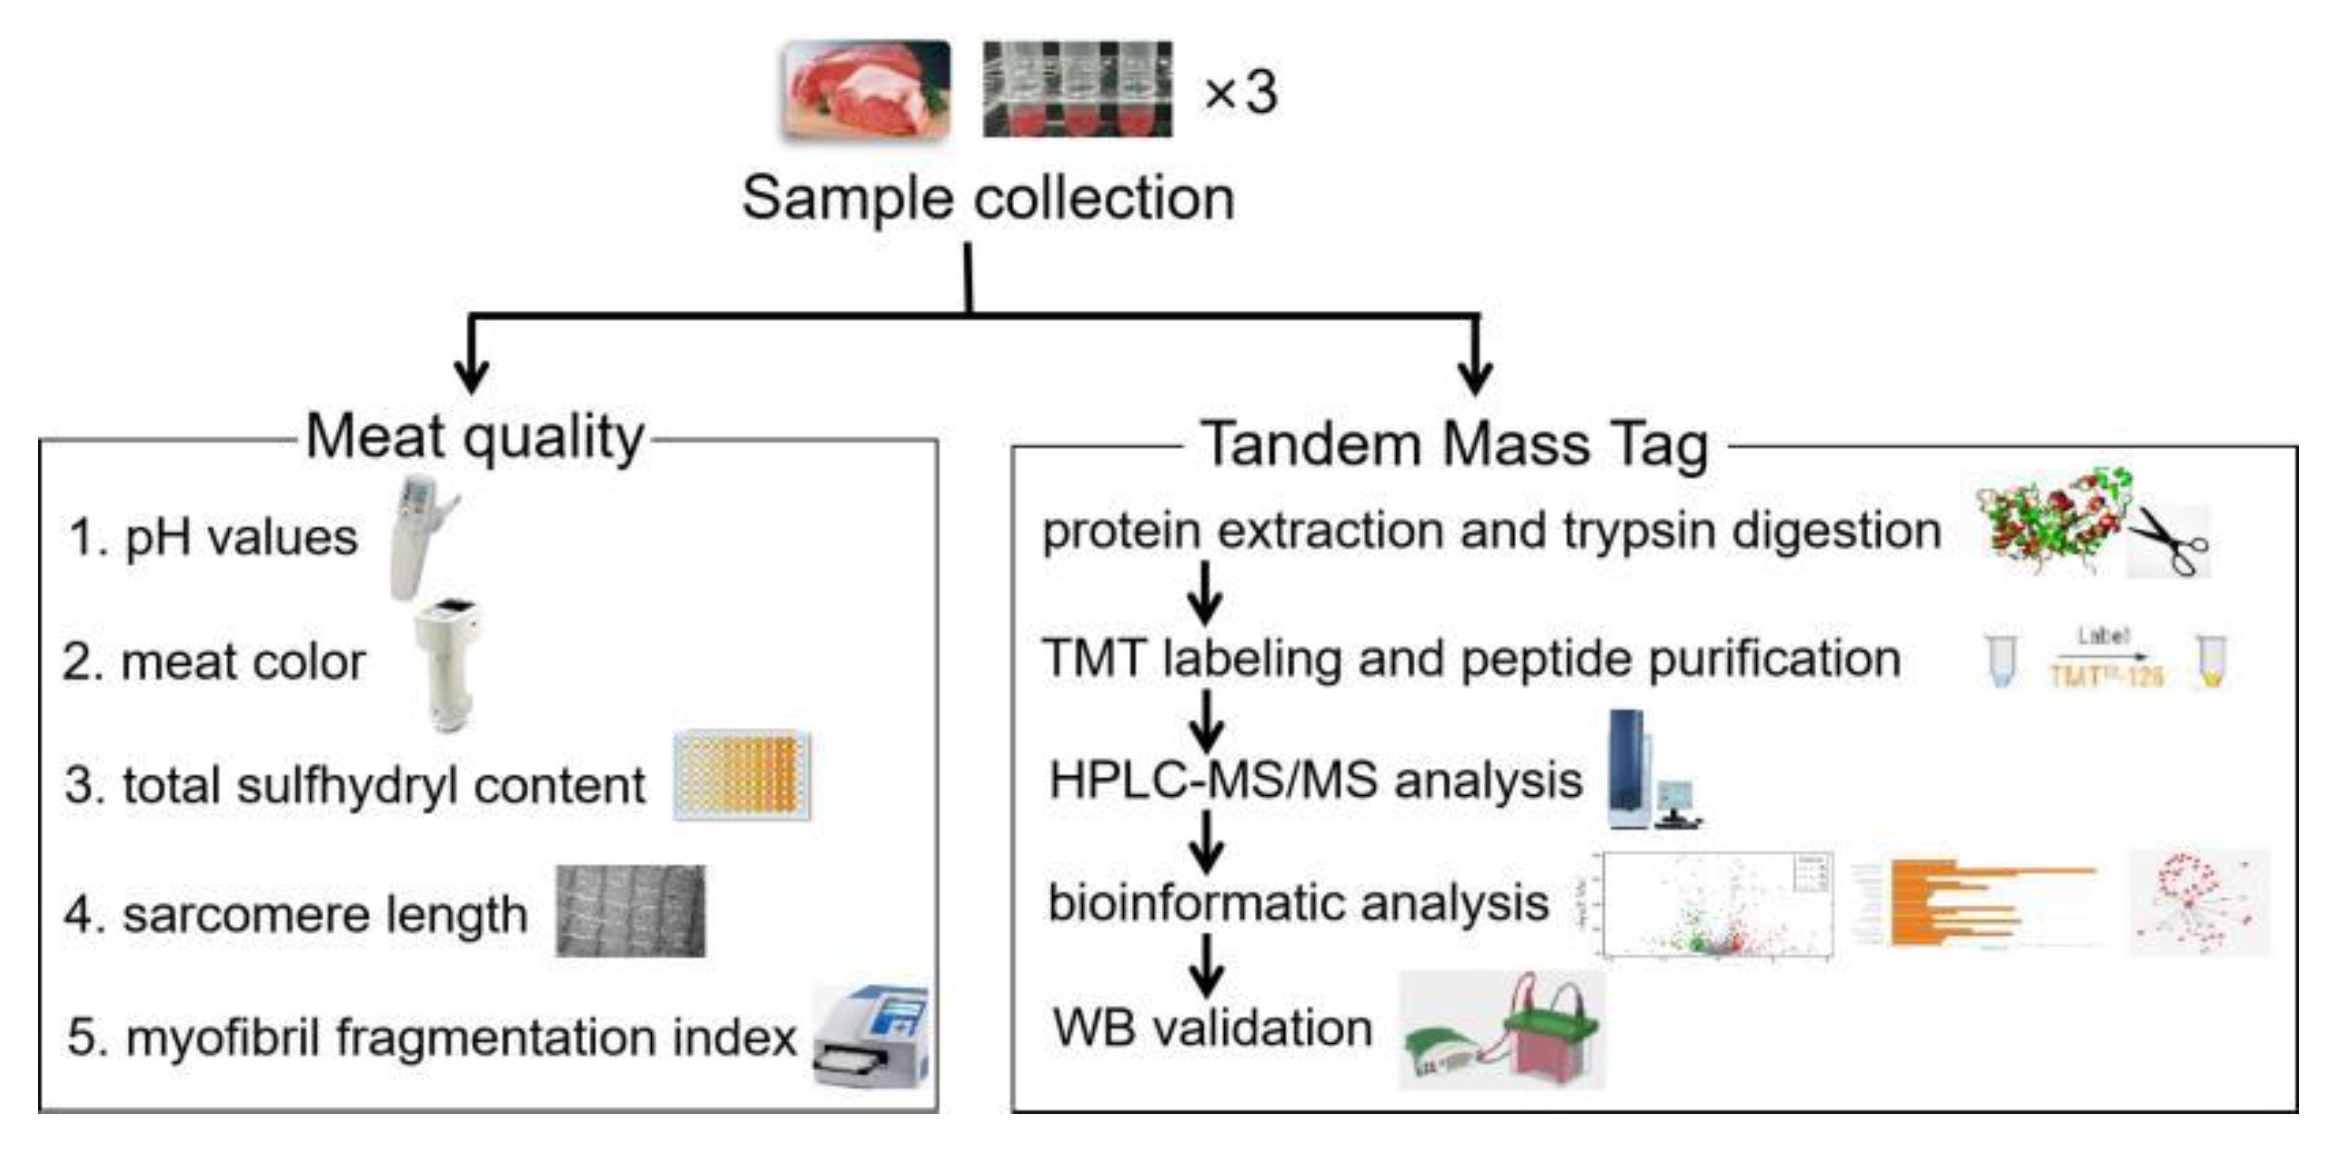
2.1. Animals and Muscle Sampling

Sixty improved cattle (Simmental × Chinese Luxi yellow cattle, an average living weight of 400 ± 50 kg, approximately 8 months old) were slaughtered on the same day by a commercial meat processing company (Beijing Zhuochen Animal Husbandry Co., Ltd., Beijing, China) without electrical stimulation in accordance with National Standards of China (GB/T 17237-2008; date: 2018). The protocol was approved by the Animal Care and Ethics Committee of Chinese Academy of Agricultural Sciences (IAS20160616; date: 2016, Beijing, China). The experimental design was summarized in Figure 1. The LL muscle was taken immediately from the carcasses within 30 min. Approximately 10 g muscle (approximately 2 cm × 2 cm × 2 cm, the sample mass for one repetition) was cut and measured for pH immediately. Another 20 g of muscle was incubated in sterilized physiological saline solution for 6 and 24 h at 4 °C to prevent the growth of microorganisms in the air and facilitate subsequent research. The muscle was subjected to measurements of color, myofibril fragmentation index (MFI), sarcomere length, total sulfhydryl content, and total protein extraction at the sampling time after the measurement of initial pH.

2.2. pH Values

The pH values were detected at 0, 6, and 24 h PM at 4–6 random locations (repeat one time per 10 g muscle) with a portable pH meter equipped with a penetration probe (Testo205 pH meter, Lenzkirch, Germany). The pH meter allowed for the automatic detection of buffer solutions and automatic temperature compensation. The probe of the pH meter was inserted directly into the meat about 1 cm deep from the meat surface, and the values averaged from 4–6 different points were taken as the final measured pH values.

2.3. Meat Color

The meat color values CIE L* (lightness), a* (redness), and b* (yellowness) were measured at 0, 6, and 24 h PM at 4–6 random locations (repeat one time per 10 g muscle) using a colorimeter (CM-600D, Osaka, Japan). The colorimeter was calibrated with a white tile (Y = 93.6, x = 0.3130, y = 0.3193) specific to the machine before measuring each sample and set to an illuminant/observer angle of D-65/2°, aperture size of 8 mm, and measurement time of 1 s. The muscle was cut (approximately 2 cm × 2 cm × 2 cm) into two pieces from the middle, and meat color values were measured on the freshly cut surface after 30 min of blooming at room temperature.

2.4. Total Sulfhydryl Content

Total protein extraction and total sulfhydryl content were measured according to our published work [12]. Total proteins were extracted with phosphate buffer containing 2% sodium dodecyl sulfate (SDS) and adjusted to a uniform protein concentration using the Bradford assay. The total sulfhydryl content was measured with 1 mM 5,5′-Dithiobis-(2-nitrobenzoic acid) (DTNB) (6 M guanidine hydrochloride, pH 8.0) by reading the absorbance at 412 nm with a microplate reader (BioTek, Winooski, VT, USA). The residual total proteins were subjected to proteomics.

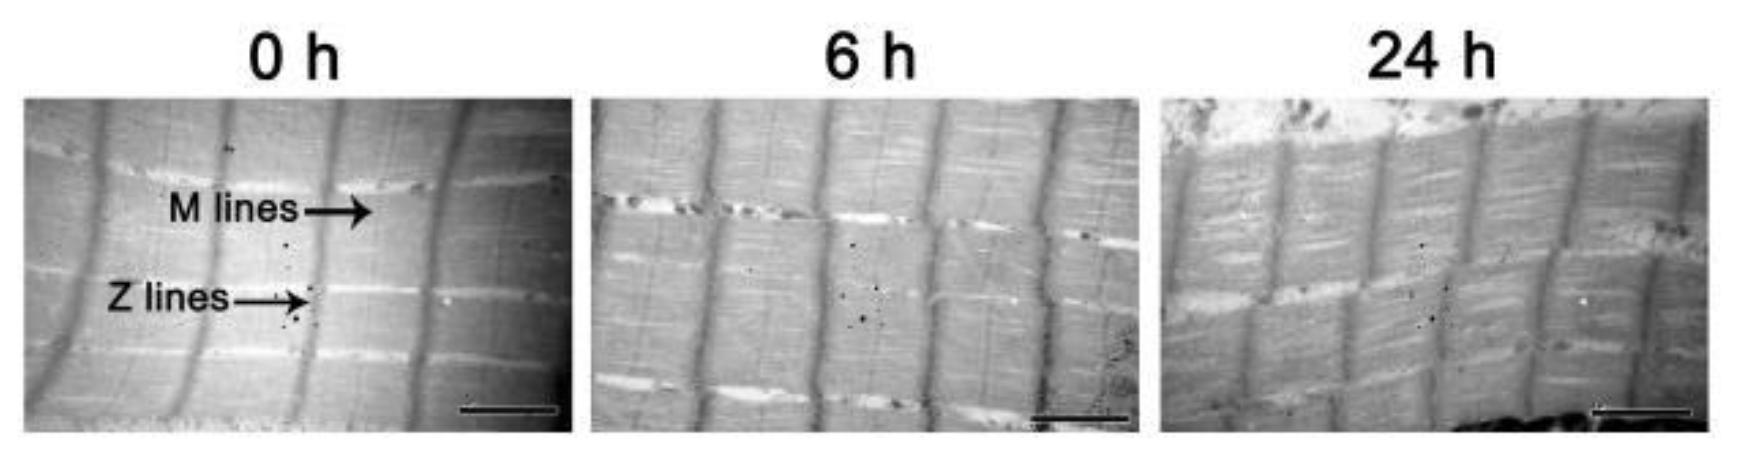
2.5. Sarcomere Length

Transmission electron microscopy (TEM) was performed according to Zhang et al. [17] with some modifications. The meat samples with a size of 2 mm × 2 mm × 4 mm were fixed with glutaraldehyde (2.5%) for 24 h, washed with phosphate buffer (pH = 7.2), dehydrated by an ethanol gradient (30%, 50%, 70%, 90%, and 100%), and exchanged in acetone. The samples were then embedded in epoxy resin and sliced using a Leica EM UC6 microtome (Leica, Solms, Germany). Ultrathin sections were stained with uranyl acetate and lead citrate and observed using a New Bio-TEM H-7500 TEM (Hitachi, Tokyo, Japan). The sarcomere length was calculated in the micrographs created using Image-Pro Plus 6.0 software (Media Cybernetics, Rockville, MD, USA).

2.6. Myofibril Fragmentation Index(MFI)

The MFI was determined according to Zhang et al. [17] with minor modifications. The minced muscle (0.5 g), trimmed of visible fat and connective tissue, was homogenized in 5 mL of ice-cold buffer (100 mM KCl, 1 mM MgCl2, 20 mM K2HPO4, and 1 mM EDTA; pH = 7.0). The samples were centrifuged for 15 min at 3000× g. The precipitate obtained was resuspended in 5 mL of ice-cold buffer and centrifuged again. The precipitate was then resuspended in buffer and filtered with a polyethylene strainer (20 mesh). The protein concentration of the filtrate was measured by the biuret method, and the concentration was then adjusted to 0.5 ± 0.05 mg/mL with buffer. The absorbance at 540 nm was measured and the result was multiplied by 200 to obtain the MFI value.

2.7. Trypsin Digestion and Tandem Mass Tag (TMT) Labeling

Each sample (approximately 100 μg of total proteins) was precipitated with 4 vol (v/v) of ice-cold acetone, and the precipitate was resuspended in reducing buffer (8 M urea, 30 mM HEPES, 1 mM PMSF, 2 mM EDTA, 10 mM DTT) and incubated at 56 °C for 1 h. Then, iodoacetamide (55 mM) was added to alkylate in the dark for 45 min. The mixture was centrifuged in a 10 kDa ultrafiltration tube for 20 min at 12,000 rpm and 4 °C, and the filter was washed twice with 200 μL of 50 mM TEAB and centrifuged at 12,000 rpm for 20 min. The proteins were digested with 3 μg trypsin/100 μg proteins overnight at 37 °C. The resulting peptides were lyophilized and then further reconstituted in 30 μL TEAB for labeling. Each TMT reagent was dissolved in 70 μL of isopropanol mixed with the peptide solution [18].

2.8. Peptide Purification and HPLC-MS/MS Analysis

The labeled peptide was diluted with solution A (0.1% formic acid, 2% ACN, 98% water) and preseparated with solution B (0.1% formic acid, 2% water, 98% ACN), and different components were collected at different times. The collected peptides were desalted and purified by C18 column according to the manufacturer’s instructions. Desalted peptide mixtures were loaded onto an Acclaim PepMap C18 reversed-phase column (75 μm × 2 cm, 3 μm) and separated with a reversed-phase C18 column (75 μm × 10 cm, 5 μm) mounted on a Dionex UltiMate 3000 Nano LC system. Peptides were eluted using a gradient of solution B (5%, 5%, 30%, 60%, 80%, 100%) at a flow rate of 300 nL/min combined with a Q Exactive mass spectrometer (Thermo Fisher Scientific, MA, USA). The eluates were directly entered into the Q Exactive MS (Thermo Fisher Scientific, Waltham, MA, USA) in positive ion mode and data-dependent manner with a full MS scan from 350–2000 m/z, full scan resolution at 70,000, and MS/MS scan resolution at 17,500. An MS/MS scan with minimum signal threshold 1 × 10⁵, isolation width at 2 Da was completed. The MS/MS acquisition mode was higher collision energy dissociation (HCD). To optimize the MS/MS acquisition efficiency of HCD, normalized collision energy (NCE) was systemically examined with a stepping of 20%.

2.9. Data Process and Bioinformatic Analysis

The obtained MS/MS data were analyzed using Proteome Discoverer 1.4 and searched using Mascot version 2.3.0. Information for the UniProt database and the reversed database was collected as follows: database, UniProt-bovine (ID: 9913); peptide mass tolerance, 15 ppm; MS/MS tolerance, 20 mmu; max missed cleavages, 1; fixed modification, carbamidomethyl (C); variable modification, oxidation (M), Gln→pyro-Glu (N-term Q), TMT 6 plex (K), TMT 6 plex (N-term); protein ratio type, median; minimum peptides, 1; normalization method, median. Based on the identified proteins, ANOVA was applied to screen out the differences in protein expression among the three groups (0, 6 and 24 h PM) with p < 0.05 and fold change > 1.5 or <2/3. Then, RStudio and Cytoscape were used to perform bioinformatic analysis of the obtained differential proteins, including gene ontology (GO, http://geneontology.org/, accessed on 10 July 2021), the Kyoto Encyclopedia of Genes and Genomes (KEGG, http://www.genome.jp/kegg/, accessed on 10 July 2021) pathway, and the protein–protein interaction (PPI, https://string-db.org/, accessed on 10 July 2021) network [18]. The significance level of the protein enrichment of a given GO term was tested by Fisher’s exact test. The significance level of protein enrichment in each pathway by Fisher’s exact test in the unit of the KEGG pathway was obtained to identify the significant metabolic and signal transduction pathways. Regarding PPI, default settings were used, i.e., medium confidence of 0.4 and 4 criteria for linkage: co-occurrence, experimental evidence, existing databases, and text mining.

2.10. SDS-PAGE and Western Blotting

To further check the changes in protein expression levels, SDS-PAGE and western blotting analysis, as well as additional quantification, were performed according to our published work [12]. The expression levels of pyruvate kinase (PKM), troponin T (TNNT1), cytochrome c oxidase subunit 5A (COX5A), mitochondrial fission 1 protein (FIS1), cytochrome c oxidase subunit 4 isoform 1 (COX4I1), and NADH dehydrogenase [ubiquinone] 1 beta subcomplex subunit 11 (NDUFB11) were detected through SDS-PAGE and western blotting. Total proteins were extracted according to our previous study [12]. The minced muscle was homogenized in 1.5 mL of ice-cold 2% SDS in 10 mM phosphate buffer (pH 7.2) and quantified using the Bradford assay. 12.5% polyacrylamide separating gels and 4.5% polyacrylamide stacking gels were used, and 40 μg samples were loaded per well. The gels were electrophoresed on the Bio-Rad Mini-PROTEAN II system (Bio-Rad Laboratories, Hercules, CA, USA) at a voltage of 80 V for 0.5 h, followed by 120 V until the indicator line reached the bottom of the gel. After electrophoresis, proteins were transferred to a membrane at 200 mA and 4 °C for 60 min and then blocked with 5% (w/v) nonfat dry milk in TBST (20 mM Tris, 137 mM NaCl, 5 mM KCl, and 0.05% (v/v) Tween 20), and the membrane was then incubated with anti-PKM2 (D220008, Sangon Biotech, Shanghai, China, 1:1000), anti-troponin T (clone JLT-12, Sigma, Saint Louis, MO, USA, 1:2000), anti-COX5A (ab110262, Abcam, Cambridge, UK, 1:2000), anti-FIS1 (D222377, Sangon Biotech, Shanghai, China, 1:1000), anti-COX4I1 (ab16056, Abcam, Cambridge, UK, 1:2000), and anti-NDUFB11 (D223630, Sangon Biotech, Shanghai, China, 1:1000) according to the manufacturers’ instructions. The membranes were incubated with secondary antibodies (A9044, Sigma, Saint Louis, MO, USA, 1:4000) after washing four times with TBST buffer, and then the proteins were visualized by immobilon western chemilum HRP (ECL) substrate (Bio-Rad, Hercules, CA, USA) after washing four times with TBST buffer. The membranes were imaged by ChemiDocTMMP Imaging System (Bio-Rad, Hercules, CA, USA).

2.11. Statistical Analysis

The significant differences among different PM storage times were analyzed by the SPSS statistical software package (17.0, IBM, Chicago, IL, USA). LSD and Duncan’s multiple range test were used to compare individual mean differences (p < 0.05). The data in all experiments were expressed as the mean ± SD (standard deviation) from 4–6 replicates. The densities of targeted bands were analyzed using Quantity One software (Bio-Rad, Hercules, CA, USA). The protein densities at 0 h were used as the control when comparing the differentially expressed proteins at 0 h vs. 6 h PM. Protein densities of 6 h were used as the control when comparing the differentially expressed proteins of 6 h vs. 24 h PM. Statistical differences between the two groups were determined by Student’s t-test.

3. Results and Discussion

3.1. pH and Meat Color

The pH values of skeletal muscle during rigor mortis are shown in Table 1. The pH values significantly decreased within 24 h PM. This may be due to the accumulation of lactate acid and H+, which are the final products of glycolysis and ATP hydrolysis, respectively [4]. The rapid decrease in the pH values PM affected not only the onset and development of rigor mortis [19] but also protein degradation and endogenous enzyme activity during aging [20], which in turn regulated meat tenderness.
Meat color is the most intuitive indicator for consumers to evaluate meat product quality. The L* value of skeletal muscle increased significantly from 6 to 24 h, while there was no significant difference from 0 to 6 h (Table 1). The a* value of skeletal muscle continued to increase from 0 to 24 h after slaughter (p < 0.05) (Table 1). The b* value increased significantly from 0 to 24 h (Table 1). The sarcoplasmic protein degeneration and myofibril shrinkage that occurred in the early stage of PM increased the scattering of meat and caused meat to become lighter. In addition, myoglobin was oxygenated to oxymyoglobin when atmospheric oxygen permeated the meat surface, resulting in the meat appearing bright red [21].

3.2. Total Sulfhydryl Content, Sarcomere Length and MFI

As an important reactive group of proteins or small biological molecules in cells, sulfhydryl groups are oxidized to form disulfide bonds, sulfonic acid, and other oxidative derivatives by oxidizing agents produced during meat storage, resulting in meat quality deterioration [12]. Therefore, the oxidation state has an important biological function for molecular activity. Total sulfhydryl content was measured found to gradually decrease during rigor mortis (Table 2). Total sulfhydryl content is a good indicator of protein oxidation level. A study of refrigerated turkey meat revealed similarly reduced sulfhydryl content during storage [14].
Proteolysis after slaughter can lead to ultrastructural changes of myofibrils, including Z-lines, M-lines, and A-bands, which are related to the tenderization of muscle into meat [22]. TEM images of myofibrils PM are shown in Figure 2. The apparent Z-lines and M-lines were clearly perceived, and the sarcomere structure was neatly arranged in the 0 h sample. Some misalignment of the sarcomeres was perceived in the 6 h PM samples. The ultrastructure of the muscle at 24 h after slaughter showed obvious changes compared with 0 h, mainly reflected in the obscured Z-lines and M-lines and the complete misalignment of the sarcomere structure. The destruction of the sarcomere structure may be caused by changes in the interaction of F-actin, actomyosin, and tropomyosin [23]. In addition, sarcomere length, determined from the TEM images, was shown in Table 2. The sarcomere length of skeletal muscle decreased significantly from 0 to 24 h PM. Similar results were reported by Wang et al. [24], who concluded that the sarcomere length of the Longissimus lumborum, semimembranosus and Psoas major muscles evidently decreased from 0.5 to 24 h PM. The sarcomere length of breast muscles from reared broilers decreased significantly until 3 h PM [25]. This may be caused by the formation of cross-links between myosin S-1 heads and actin, resulting in actomyosin in rigor mortis [26]. Additionally, the decrease in sarcomere length may also be related to cold shortening caused by diminished functioning of the calcium pumps in the sarcoplasmic reticulum at low temperatures [27].
MFI is a useful index that reflects the degree of proteolysis, thereby characterizing tenderness, indicating I-band breakage and intermyofibril linkages [17]. As shown in Table 2, MFI increased significantly with the increase of time PM, which is consistent with the previous result that MFI of meat from breast and thigh increased significantly 12 h PM [17]. The overlap of myosin filaments from one sarcomere with actin filaments to the next may form a continuously linked actomyosin after formation of rigor crossbridges. At very short sarcomere lengths, myofibrils within a sarcomere can be ruptured by the shortening of neighboring sarcomeres [26].

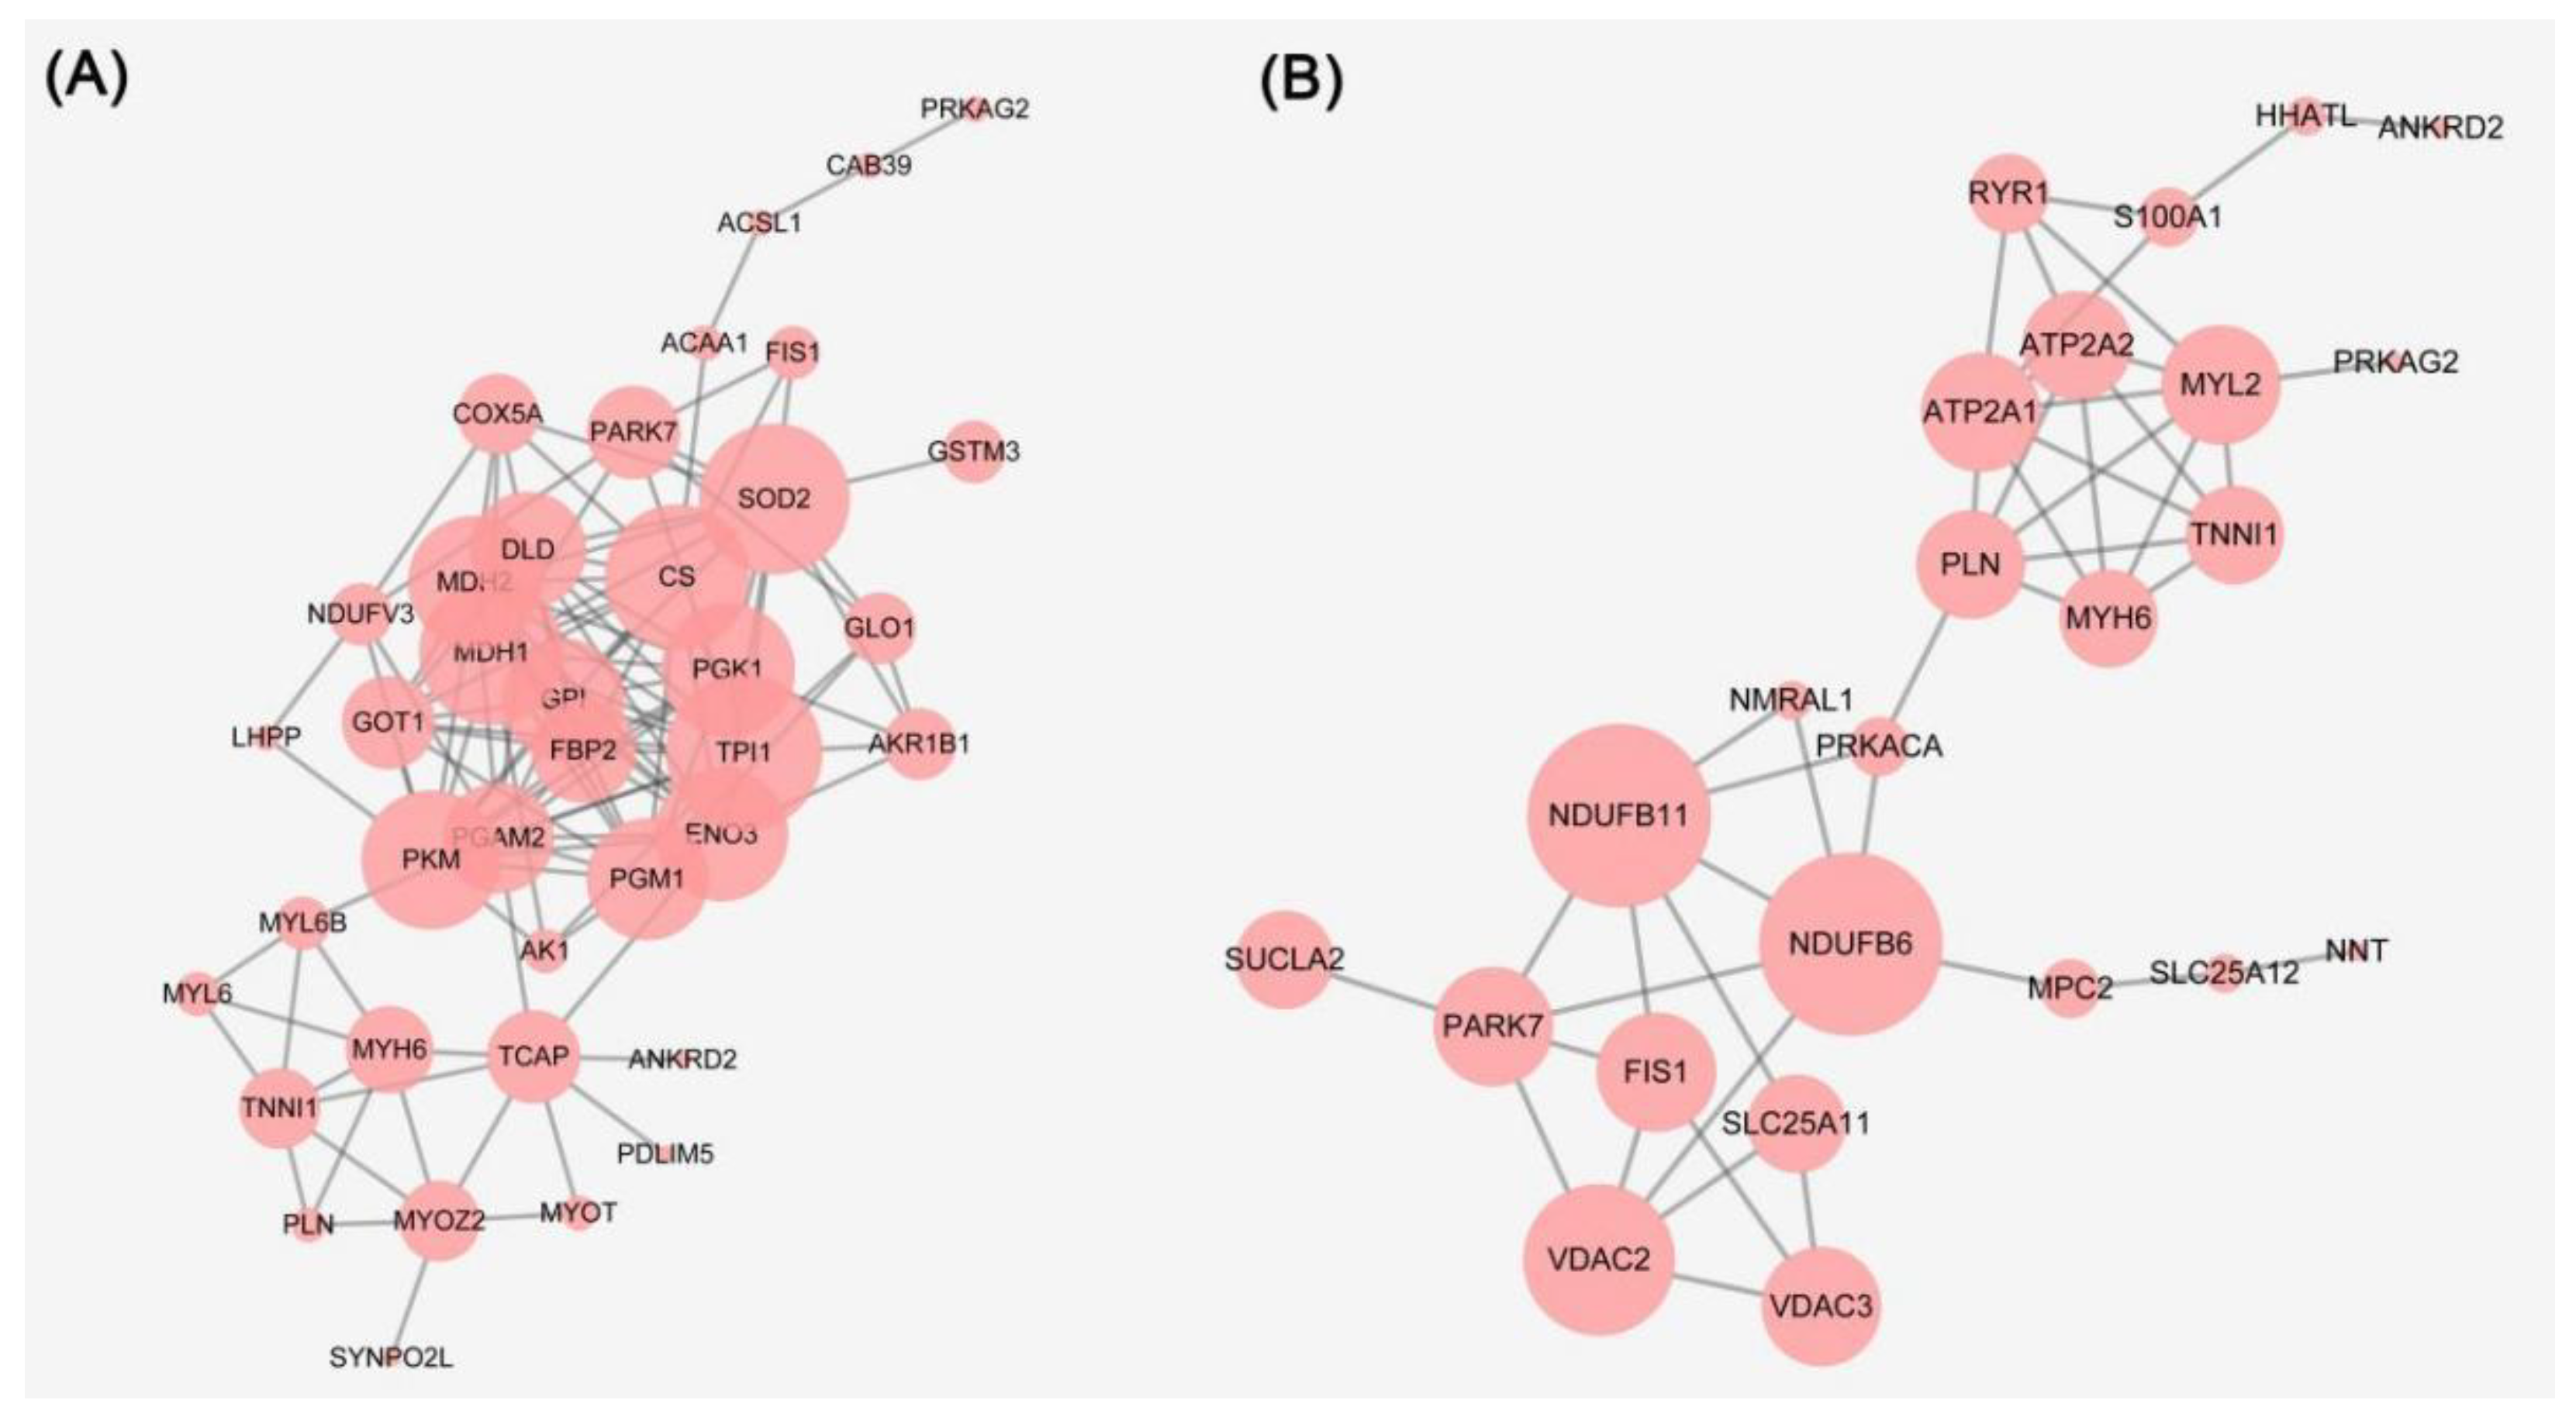
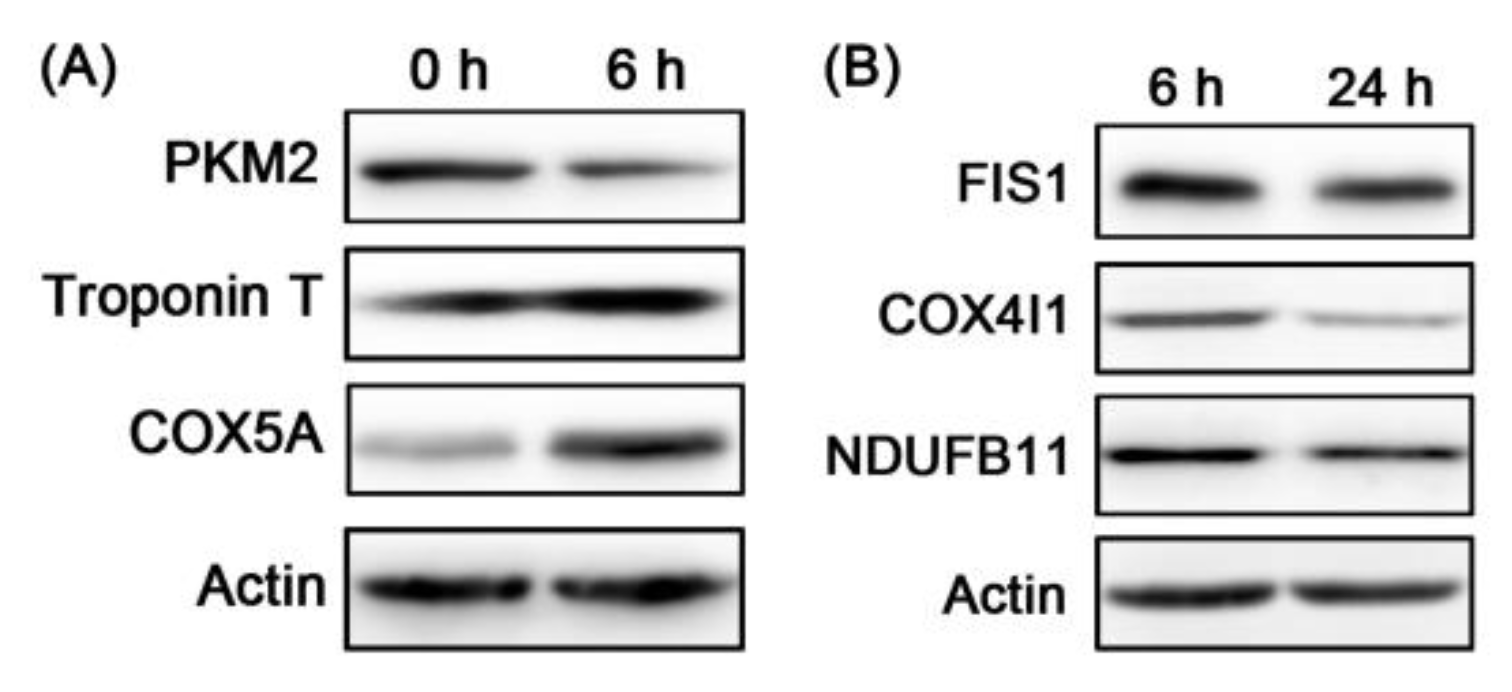
3.3. Bioinformatics Analysis of the Differential Proteins and WB Validation

Proteome analysis based on tandem mass tags (TMTs) has been widely used in meat science due to its proteome coverage, accurate quantification, and high technical reproducibility [5]. According to TMT analysis, 83 differentially expressed proteins were identified between 6 h and 0 h PM, including 36 upregulated and 47 downregulated proteins, which are summarized in Table S1. In total, 71 proteins were determined to be different in abundance between 24 h and 6 h PM, of which 12 proteins were upregulated and 59 were downregulated in the 24 h PM group, as summarized in Table S2.
GO annotation, consisting of biological processes, cellular components, and molecular functions, was performed to obtain information about the mechanism of rigor mortis. The top 10 specific items of the three categories of differential proteins between 6 h and 0 h PM are shown in Table 3. For biological processes, ADP (adenosine diphosphate) metabolic process (GO:0046031), ATP generation from ADP (GO:0006757), nucleoside diphosphate metabolic process (GO:0009185), ribonucleoside diphosphate metabolic process (GO:0009185), pyruvate biosynthetic process (GO:0042866), and other biological processes related to metabolism were significantly enriched. Cellular components were enriched in contractile fiber (GO:0043292), I band (GO:0031674), myofibril (GO:0030016), and sarcomere (GO:0030017), which are related to myofibrillar proteins and sarcomere structure. For molecular function, the major classes of proteins were magnesium ion binding (GO:0000287), superoxide dismutase activity (GO:0004784), and transferase activity (GO:0016740). From each of the three categories of differential proteins, the 10 most-observed proteins between 24 h and 6 h PM are shown in Table 4. For biological processes, drug transport (GO:0015893), establishment of localization (GO:0051234), ion transport (GO:0006811) and other biological processes related to transport were significantly enriched. Cellular components were mainly enriched in various membrane parts, such as the integral component of membrane (GO:0016021), intrinsic component of membrane (GO:0031224), mitochondrial membrane (GO:0031966), and organelle membrane (GO:0031090). For molecular function, the major classes of these proteins were active transmembrane transporter activity (GO:0022804), inorganic molecular entity transmembrane transporter activity (GO:0015318), and ion transmembrane transporter activity (GO:0015075). These GO analyses of the differentially expressed proteins of 6 h vs. 0 h and 24 h vs. 6 h are displayed in Tables S3 and S4, respectively.
KEGG pathway enrichment was performed to clarify the biological pathways involved in the differentially expressed proteins during rigor mortis. The top 20 specific differential proteins between 6 h and 0 h PM are shown in Table 5, including biosynthesis of amino acids (map01230), carbon metabolism, glycolysis/gluconeogenesis (map00010), insulin signaling pathway (map04910), and pyruvate metabolism (map00620). The top 13 significantly enriched pathways of differential proteins between 24 h and 6 h PM were selected (Table 6), including the calcium signaling pathway (map04020), cGMP-PKG signaling pathway (map04022), necroptosis (map04217), and oxidative phosphorylation (map00190). These KEGG pathway analyses of the differentially expressed proteins of 6 h vs. 0 h and 24 h vs. 6 h are displayed in Tables S5 and S6, respectively. These biological processes may involve the onset and development of rigor mortis.
The PPI network of the differentially expressed proteins of 6 h vs. 0 h and 24 h vs. 6 h was constructed and shown in Figure 3A,B, respectively. The proteins at 6 h vs. 0 h that were pyruvate kinase (PKM), dihydrolipoyl dehydrogenase (DLD), phosphoglycerate mutase 2 (PGAM2), fructose-1,6-bisphosphatase isozyme 2 (FBP2), phosphoglycerate kinase 1 (PGK1), glucose-6-phosphate isomerase (GPI), beta-enolase (ENO3), triosephosphate isomerase (TPI1), lactoylglutathione lyase (GLO1), and malate dehydrogenase (MDH1/2). These proteins were implicated in glycolysis/gluconeogenesis, pyruvate metabolism, carbon metabolism, citrate cycle, and oxidative phosphorylation. The proteins at 24 h vs. 6 h were cardiac phospholamban (PLN), ryanodine receptor 1 (RYR1), calcium-transporting ATPase (ATP2A2), cAMP-dependent protein kinase catalytic subunit alpha (PRKACA), voltage-dependent anion-selective channel protein 2 (VDAC2), sarcoplasmic/endoplasmic reticulum calcium ATPase 1 (ATP2A1), voltage-dependent anion-selective channel protein 3 (VDAC3), myosin heavy chain 6 (MYH6), myosin regulatory light chain 2 (MYL2), and protein kinase AMP-activated non-catalytic subunit gamma 2 (PRKAG2). These proteins were implicated in the calcium signaling pathway, cGMP-PKG signaling pathway, ferroptosis, necroptosis, tight junction, cardiac muscle contraction, vascular smooth muscle contraction, and focal adhesion.
Several different upregulated and downregulated proteins were selected to validate the TMT results by western blotting, including pyruvate kinase (PKM), troponin T (TNNT1), cytochrome c oxidase subunit 5A (COX5A), mitochondrial fission 1 protein (FIS1), cytochrome c oxidase subunit 4 isoform 1 (COX4I1), and NADH dehydrogenase [ubiquinone] 1 beta subcomplex subunit 11 (NDUFB11). As shown in Figure 4 and Table 7, the changes in these protein levels were consistent with the results of TMT analysis, indicating that the TMT results in this study are reliable.

3.4. Metabolic Enzymes

The changes in metabolic enzymes after slaughter were significantly related to the pH and meat color in rigor mortis [18,20]. PKM2, DLD, PGAM2, GAPDH, PGM, FBP2, PGK1/2, GPI, ENO3, and TPI1 are all involved in the glycolysis/gluconeogenesis pathway, and were detected in the differential proteins of samples between 0 h and 6 h after slaughter in this study. In particular, PKM2 is a key rate-limiting enzyme for glycolysis, catalyzing the transfer of the phosphate group of phosphoenolpyruvate (PEP) to ADP to generate pyruvate and ATP. Higher PKM2 activity is a sign of faster glycolytic metabolism, and various posttranslational modifications (phosphorylation, acetylation, oxidation, and methylation) affect PKM2 activity [28]. Phosphorylation levels of PKM2 at Thr155 were significantly different under different glycolysis rates in ovine muscles [29]. TPI1 is an important glycolytic enzyme that catalyzes the mutual conversion of dihydroxy-acetone phosphate and glyceraldehyde 3-phosphate to provide energy for muscle cells. It has been proposed as a potential biomarker to regulate the development and stability of beef color and pH during storage [30]. TPI1, including its phosphorylated form, has an effect on the accumulation of lactate and hydrogen protons, which may regulate the level of electrostatic rejection of myofibrillar and filament proteins, thereby affecting the transverse contraction of muscle fibers and lengthening of sarcomeres [5]. In addition to some of the aforementioned proteins, GLO1 and MDH were detected in the pyruvate metabolism pathway. MDH, as a component of the tricarboxylic acid cycle, catalyzed the reaction that regenerates oxaloacetate and was related to the malate–aspartate shuttle system through the mitochondrial membrane to transport reductants. The L-lactate dehydrogenase (LDH)/MDH ratio was used to reflect the oxidation level of muscle, and the lower ratio was similar to active oxidative metabolism [31].

3.5. Mitochondrial Electron Transport Chain

Protein subunits of complex I (NDUFB6 and NDUFB11), complex II (SDHC and SDHD), complex IV (COX2, COX4I1, COX7C, and COX6C), and complex V (ATP5PO and ATP5MF) of the mitochondrial electron transport chain were detected in the differentially expressed proteins of 24 h vs. 6 h PM. The results of Beldarrain et al. [21] suggested that the electrons located between complex III and IV may reduce metmyoglobin. In addition, complex I and complex II regulated the production of NADH, which can be used for the reduction of metmyoglobin through electron transport mediation and enzymatic pathways, thereby affecting meat color [32]. Complex V converted ADP into ATP under the premise of a proton gradient, and the degradation degree of complex V was directly related to the ATP/ADP homeostasis and affected the stability of meat color [12].

3.6. Necroptosis and Ferroptosis

As a new type of cell death mode, necroptosis was first proposed by Degterev et al. [33], and it has the characteristics of both apoptosis and necrosis. Histone H2A type 2-C (H2AC20) and ADP/ATP translocase 1 (SLC25A4) belong to the necroptosis pathway and were detected in the differentially expressed proteins of 24 h vs. 6 h PM. SLC25A4 participated in muscle contraction and the calcium-mediated signaling pathway and was abundant in transcription in muscle tissue from two pig breeds [34]. Ferroptosis is a unique iron-dependent form of nonapoptotic cell death caused by the lethal small molecule erastin [35]. VDAC2 and VDAC3 belong to the ferroptosis pathway and were detected in the differentially expressed proteins of 24 h vs. 6 h PM. VDAC3 participated in the ferroptosis pathway characterized by iron-dependent lipid peroxidation accumulation and regulated cell death in longissimus dorsi muscle from Xidu black pigs [36]. Ubiquitination of VDAC2/3 by Nedd4 inhibited ferroptosis in melanoma induced by erastin [37]. Interestingly, SLC25A4 interacted with VDAC2, VDAC3, and NDUFB11 (Figure 3). NDUFB11 participated in mitochondrial function and was associated with apoptosis, indicating that there is a certain correlation between necroptosis, apoptosis, and ferroptosis. Similarly, cytochrome c was released from the mitochondria into the cytoplasm, leading to the activation of caspases, which can regulate the adenine nucleotide translocator encoded by SLC25A4 and VDAC1/2 [38].

3.7. Structural Proteins

The degradation of myofibrillar proteins was related to tenderness, and more fragments than intact structures were observed in tender meat [12]. Some structural proteins identified in this study are known to be related to tenderness, including troponin (TNNC1, TNNT1, and TNNT3), myosin (MYL2, MYL6, MYL6B), and keratin (KRT10, KRT14). Troponin is a heterotrimeric complex composed of troponin T, troponin I, and troponin C subunits, and plays a central regulatory role in the process of striated muscle contraction [12]. Calcium ions bound to the nh2 domain of troponin C, promoting its interaction with troponin I, leading to its dissociation from actin during muscle contraction. Finally, the troponin I-troponin T complex anchored to the tropomyosin-actin filaments and enhanced actomyosin bonds [21]. Thus, degradation of troponin means that the interacting proteins are destroyed, and the thin filaments in the sarcomeric I band may be broken. The myosin family depended on ATP to participate in muscle contraction and various intracellular functions, such as cell migration and adhesion, signal transduction, intracellular transportation, and localization of macromolecules [11]. Myosin light chains (MYL3 and MYL6B) and regulatory light chain 2 isoforms (MYL2 and MYLPF) were involved in the conversion of muscle to meat, and myosin was a major structural protein related to actin and other contractile proteins. Denaturation of the head of myosin can cause myofibrils to shrink laterally and reduce the WHC [39]. Keratin, as a kind of myofibril protein, was found to be a differentially expressed protein between high and low drip loss groups from geese, which was related to WHC [13].

3.8. Potential Markers during Rigor Mortis

In addition to the aforementioned proteins, some distinctly different proteins were detected in this study, which may serve as markers that affect the onset and development of rigor mortis. PLN was detected in the differentially expressed proteins of 24 h vs. 6 h PM and participated in some pathways related to calcium ions (calcium signaling pathway and cGMP-PKG signaling pathway) and cardiac contraction and relaxation (adrenergic signaling in cardiomyocytes, thyroid hormone signaling pathway, and dilated cardiomyopathy). PLN controlled the storage level of sarcoplasmic reticulum calcium ions in human hearts and can also act as a regulatory protein for adrenaline. Calcium ion transportation in cells could be affected by mutations of PLN, leading to abnormal myocardial function. Similar to troponin T, PLN is considered a candidate gene for dilated cardiomyopathy because of its role in myofibril calcium sensitivity [40]. In addition, acetyl-coenzyme A acyltransferase (ACAA) includes two subtypes: ACAA1 and ACAA2. ACAA1 was detected in the differentially expressed proteins and mainly involved in physiological and biochemical processes, such as long-chain fatty acid oxidation, bile acid metabolism, and regulation of peroxisome proliferation [41]. The study has shown that increasing ACAA activity can promote peroxisomal fatty acid β-oxidation, and the accumulation of oxidized polyunsaturated fatty acids is the main cause of ferroptosis [35]. Ankyrin repeat domain 2 (ANKRD2), which belongs to the muscle ankyrin repeat protein (MARP) family, was detected among the differentially expressed proteins. The MARP family plays a key role in the integration of cytoskeletal structure, communication between the sarcoplasm and the nucleus, and stress response [42]. ANKRD2 is a skeletal muscle protein involved in skeletal muscle hypertrophy and located in the I band [43]. The expression profile of porcine ANKRD2 indicated that it may be related to meat quality regulated by muscle fiber type [44]. Moreover, the differential proteins obtained in this study still contained a small number of unknown proteins. These proteins may also play an important role in the rigor mortis of beef, and further research is needed.

3.9. Meat Quality and Differentially Expressed Proteins

Glycolysis is an important biochemical pathway affecting meat quality in PM muscles [5]. Glycolytic enzymes, including PKM2 (6 h vs. 0 h), TPI1 (6 h vs. 0 h), ENO3 (6 h vs. 0 h) and LDH-B (24 h vs. 6 h) were detected in the differential proteins, and the expression levels were basically downregulated to half. Rosenvold et al. revealed that these proteins led to changes in pH [45]. Consumers regard meat color as the main criterion to judge whether meat is fresh or not. Both hemoglobin and myoglobin are the main pigment proteins, and the key substances that determine meat color [46]. Interestingly, downregulation of hemoglobin in the differential proteins between 6 h and 24 h PM was detected in this study. Moreover, downregulation of NDUFB6, NDUFB11, SDHC, SDHD, COX2, COX4I1, COX7C, COX6C, ATP5PO, and ATP5MF in the differential proteins between 6 h and 24 h PM were detected. They can be classified as belonging to complex I, II, IV, and V, which were involved in the mitochondrial electron transport chain. Previous research suggested that the complex can participate in the regulation of myoglobin, thereby affecting the meat color [29,47]. GAPDH, PRDX6, PGM1, and SOD detected in the differential protein between 0 h and 6 h were potential predictors of meat color traits, consistent with the results of Wu et al. [48]. Thus, metabolic enzymes, oxidative proteins and mitochondrial electron transport chain complex may be involved in the regulation of meat color at different stages of rigor mortis. Additionally, the change in sarcomere length and MFI may depend primarily on the structural proteins in the differential proteins. Notably, as a new type of cell death mode, ferroptosis has received enthusiastic attention from scientists. VDAC2 and VDAC3 proteins involved in ferroptosis were detected in the differential proteins in this study. ACAA1 was also speculated to participate in ferroptosis because of its function on the regulation and accumulation of long-chain fatty acid oxidation. This provides a new perspective for the study of the mechanism of ferroptosis in the regulation of meat quality.

4. Conclusions

The quality and protein changes of PM meat used to elucidate the biochemical mechanism of rigor mortis were explored. The beef meat quality including pH, meat color, total sulfhydryl content, sarcomere length, and MFI changed significantly within 24 h after slaughter. A total of 147 differentially expressed proteins involved in a certain number of signaling pathways were analyzed using TMT quantitative proteomics. Several proteins that may play a key role in rigor mortis were also proposed. Further verification of differential proteins and new strategies are needed to supplement the presented theories in the development of rigor mortis.

Supplementary Materials

The following supporting information can be downloaded at: https://www.mdpi.com/article/10.3390/foods11020217/s1, Table S1: differentially expressed proteins were identified between 6 h and 0 h PM; Table S2: differentially expressed proteins were identified between 24 h and 6 h PM; Table S3: GO analyses of the differentially expressed proteins between 6 h and 0 h PM; Table S4: GO analyses of the differentially expressed proteins between 24 h and 6 h PM; Table S5: KEGG pathway analyses of the differentially expressed proteins between 6 h and 0 h PM; Table S6: KEGG pathway analyses of the differentially expressed proteins between 24 h and 6 h PM.

Author Contributions

Conceptualization, Z.D. and F.H.; methodology, Q.W.; software, C.L.; validation, Z.D., Q.W. and C.L.; formal analysis, Z.D.; investigation, H.Z.; resources, F.H.; data curation, F.H.; writing—original draft preparation, Z.D.; writing—review and editing, F.H.; visualization, Z.D.; supervision, F.H.; project administration, H.Z.; funding acquisition, F.H. All authors have read and agreed to the published version of the manuscript.

Funding

This research received no external funding.

Institutional Review Board Statement

The protocol was approved by National Standards of China (protocol code, GB/T 17237-2008; date: 2008) and the Animal Care and Ethics Committee of Chinese Academy of Agricultural Sciences (IAS20160616; date: 2016, Beijing, China).

Informed Consent Statement

The study did not involve humans.

Data Availability Statement

The study did not report any data.

Acknowledgments

This research was funded by the National Natural Science Foundation of China (Grant No. 32072244) and Key Scientific and Technological Projects of Xinjiang Production and Construction Corps (Grant No. 2020AB012).

Conflicts of Interest

The authors declare no conflict of interest.

References

  1. Hertzman, C.; Olsson, U.; Tornberg, E. The influence of high temperature, type of muscle and electrical stimulation on the course of rigor, ageing and tenderness of beef muscles. Meat Sci. 1993, 35, 119–141. [Google Scholar] [CrossRef]
  2. Ouali, A.; Herrera-Mendez, C.; Coulis, G.; Becila, S.; Boudjellal, A.; Aubry, L. Revisiting the conversion of muscle into meat and the underlying mechanisms. Meat Sci. 2006, 74, 44–58. [Google Scholar] [CrossRef]
  3. Li, C.; Shi, P.; Chang, X.; Xu, X.; Zhou, G. Tracing processes of rigor mortis and subsequent resolution of chicken breast muscle using a texture analyzer. J. Food Eng. 2010, 99, 388–391. [Google Scholar] [CrossRef]
  4. Matarneh, S.; England, E.; Scheffler, T.; Gerrard, D. The conversion of muscle to meat. In Lawrie´s Meat Science (eight edition); Woodhead Publishing Series in Food Science, Technology and Nutrition; Elsevier: Amsterdam, The Netherlands, 2017; pp. 159–185. [Google Scholar]
  5. Huang, C.; Hou, C.; Ijaz, M.; Yan, T.; Li, X.; Li, Y.; Zhang, D. Proteomics discovery of protein biomarkers linked to meat quality traits in post-mortem muscles: Current trends and future prospects: A review. Trends Food Sci. Technol. 2020, 105, 416–432. [Google Scholar] [CrossRef]
  6. Paredi, G.; Raboni, S.; Bendixen, E.; Almeida, A.; Mozzarelli, A. “Muscle to meat” molecular events and technological transformations: The proteomics insight. J. Proteom. 2012, 75, 4275–4289. [Google Scholar] [CrossRef]
  7. Poleti, M.D.; Moncau, C.T.; Silva-Vignato, B.; Rosa, A.F.; Lobo, A.R.; Cataldi, T.R.; Negrão, J.A.; Silva, S.L.; Eler, J.P.; Balieiro, J.C.D.C. Label-free quantitative proteomic analysis reveals muscle contraction and metabolism proteins linked to ultimate pH in bovine skeletal muscle. Meat Sci. 2018, 145, 209–219. [Google Scholar] [CrossRef]
  8. Bendixen, E. The use of proteomics in meat science. Meat Sci. 2005, 71, 138–149. [Google Scholar] [CrossRef]
  9. Gagaoua, M.; Bonnet, M.; Ellies-Oury, M.P.; De Koning, L.; Picard, B. Reverse phase protein arrays for the identification/validation of biomarkers of beef texture and their use for early classification of carcasses. Food Chem. 2018, 250, 245–252. [Google Scholar] [CrossRef] [PubMed]
  10. Wu, W.; Yu, Q.; Fu, Y.; Tian, X.; Jia, F.; Li, X.; Dai, R. Towards muscle-specific meat color stability of Chinese Luxi yellow cattle: A proteomic insight into post-mortem storage. J. Proteom. 2016, 147, 108–118. [Google Scholar] [CrossRef]
  11. Yu, Q.; Wu, W.; Tian, X.; Hou, M.; Dai, R.; Li, X. Unraveling proteome changes of Holstein beef M. semitendinosus and its relationship to meat discoloration during post-mortem storage analyzed by label-free mass spectrometry. J. Proteom. 2017, 154, 85–93. [Google Scholar] [CrossRef]
  12. Ding, Z.; Wei, Q.; Zhang, C.; Zhang, H.; Huang, F. Influence of oxidation on Heat Shock Protein 27 translocation, caspase-3 and calpain activities and myofibrils degradation in postmortem beef muscles. Food Chem. 2020, 340, 127914. [Google Scholar] [CrossRef]
  13. Zhang, M.; Wang, D.; Xu, X.; Xu, W. Comparative proteomic analysis of proteins associated with water holding capacity in goose muscles. Food Res. Int. 2018, 116, 354–361. [Google Scholar] [CrossRef] [PubMed]
  14. Malheiros, J.; Braga, C.; Grove, R.; Ribeiro, F.; Calkins, C.; Adamec, J.; Chardulo, L. Influence of oxidative damage to proteins on meat tenderness using a proteomics approach. Meat Sci. 2019, 148, 64–71. [Google Scholar] [CrossRef]
  15. Gagaoua, M.; Bonnet, M.; De Koning, L.; Picard, B. Reverse phase protein array for the quantification and validation of protein biomarkers of beef qualities: The case of meat color from Charolais breed. Meat Sci. 2018, 145, 308–319. [Google Scholar] [CrossRef] [PubMed]
  16. Sentandreu, M.A.; Coulis, G.; Ouali, A. Role of muscle endopeptidases and their inhibitors in meat tenderness. Trends Food Sci. Technol. 2002, 13, 400–421. [Google Scholar] [CrossRef]
  17. Zhang, M.; Wang, D.; Huang, W.; Liu, F.; Zhu, Y.; Xu, W.; Cao, J. Apoptosis during postmortem conditioning and its relationship to duck meat quality. Food Chem. 2013, 138, 96–100. [Google Scholar] [CrossRef] [PubMed]
  18. He, J.; Xia, C.; He, Y.; Pan, D.; Cao, J.; Sun, Y.; Zeng, X. Proteomic responses to oxidative damage in meat from ducks exposed to heat stress. Food Chem. 2019, 295, 129–137. [Google Scholar] [CrossRef]
  19. Alvarado, C.Z.; Sams, A.R. Rigor mortis development in Turkey breast muscle and the effect of electrical stunning. Poult. Sci. 2000, 79, 1694–1698. [Google Scholar] [CrossRef] [PubMed]
  20. Li, S.; Yu, Q.; Han, L.; Zhang, Y.; Tian, X.; Zhao, S. Effects of proteome changes on the tenderness of yak rumen smooth muscle during postmortem storage based on the label-free mass spectrometry. Food Res. Int. 2019, 116, 1336–1343. [Google Scholar] [CrossRef]
  21. Beldarrain, L.R.; Aldai, N.; Picard, B.; Sentandreu, E.; Navarro, J.L.; Sentandreu, M.A. Use of liquid isoelectric focusing (OFFGEL) on the discovery of meat tenderness biomarkers. J. Proteom. 2018, 183, 25–33. [Google Scholar] [CrossRef]
  22. Zhang, Y.; Zhang, B.; Huang, Y.; Chen, L.; Bao, P.; Fang, H.; Zhou, C. L-arginine and L-lysine degrade troponin-T, and L-arginine dissociates actomyosin: Their roles in improving the tenderness of chicken breast. Food Chem. 2020, 318, 126516. [Google Scholar] [CrossRef]
  23. Merino, F.; Pospich, S.; Funk, J.; Wagner, T.; Raunser, S. Structural transitions of F-actin upon ATP hydrolysis at near-atomic resolution revealed by cryo-EM. Nat. Struct. Mol. Biol. 2018, 25, 528–537. [Google Scholar] [CrossRef] [PubMed]
  24. Wang, Y.; Li, X.; Li, Z.; Li, M.; Zhu, J.; Zhang, D. Changes in degradation and phosphorylation level of titin in three ovine muscles during postmortem. Int. J. Food Sci. Technol. 2018, 53, 913–920. [Google Scholar] [CrossRef]
  25. Yu, L.H.; Lee, E.S.; Jeong, J.Y.; Choi, J.H.; Kim, C.J. Effects of Post-mortem Temperature on the Physicochemical Properties of Hot-boned Chicken Breast Muscles. Food Sci. Anim. Resour. 2009, 29, 55–61. [Google Scholar] [CrossRef]
  26. Ertbjerg, P.; Puolanne, E. Muscle structure, sarcomere length and influences on meat quality: A review. Meat Sci. 2017, 132, 139–152. [Google Scholar] [CrossRef] [PubMed] [Green Version]
  27. Cornforth, D.; Pearson, A.; Merkel, R. Relationship of mitochondria and sarcoplasmic reticulum to cold shortening. Meat Sci. 1980, 4, 103–121. [Google Scholar] [CrossRef]
  28. Alquraishi, M.; Puckett, D.L.; Alani, D.S.; Humidat, A.S.; Bettaieb, A. Pyruvate kinase M2: A simple molecule with complex functions. Free Radic. Biol. Med. 2019, 143, 176–192. [Google Scholar] [CrossRef]
  29. Marsh, B.B. Rigor mortis in beef. J. Sci. Food Agric. 2010, 5, 70–75. [Google Scholar] [CrossRef]
  30. Gagaoua, M.; Couvreur, S.; Bec, G.L.; Aminot, G.; Picard, B. Associations among protein biomarkers and pH and color traits in longissimus thoracis and rectus abdominis muscles in protected designation of origin maine-Anjou cull cows. J. Agric. Food Chem. 2017, 65, 3569–3580. [Google Scholar] [CrossRef] [PubMed]
  31. Yu, Q.; Feng, D.; Xiao, J.; Wu, F.; Zuo, J.J. Studies on meat color, myoglobin content, enzyme activities, and genes associated with oxidative potential of pigs slaughtered at different growth stages. Asian-Australas. J. Anim. Sci. 2017, 30, 1739–1750. [Google Scholar] [CrossRef] [Green Version]
  32. Belskie, K.M.; Buiten, C.; Ramanathan, R.; Mancini, R.A. Reverse electron transport effects on NADH formation and metmyoglobin reduction. Meat Sci. 2015, 105, 89–92. [Google Scholar] [CrossRef] [PubMed]
  33. Degterev, A.; Huang, Z.; Boyce, M.; Li, Y.; Jagtap, P.; Mizushima, N.; Cuny, G.D.; Mitchison, T.J.; Moskowitz, M.A.; Yuan, J. Chemical inhibitor of nonapoptotic cell death with therapeutic potential for ischemic brain injury. Nat. Chem. Biol. 2005, 1, 112–119. [Google Scholar] [CrossRef] [PubMed]
  34. Ropka-Molik, K.; Żukowski, K.; Eckert, R.; Gurgul, A.; Piórkowska, K.; Oczkowicz, M. Comprehensive analysis of the whole transcriptomes from two different pig breeds using RNA-Seq method. Anim. Genet. 2015, 45, 674–684. [Google Scholar] [CrossRef] [PubMed]
  35. Dixon, S.J.; Lemberg, K.M.; Lamprecht, M.R.; Skouta, R.; Zaitsev, E.M. Ferroptosis: An Iron-Dependent Form of Nonapoptotic Cell Death. Cell 2012, 149, 1060–1072. [Google Scholar] [CrossRef] [Green Version]
  36. Zhou, J.; Zhang, Y.; Wu, J.; Qiao, M.; Mei, S. Proteomic and lipidomic analyses reveal saturated fatty acids, phosphatidylinositol, phosphatidylserine, and associated proteins contributing to intramuscular fat deposition. J. Proteom. 2021, 241, 104235. [Google Scholar] [CrossRef] [PubMed]
  37. Yang, Y.; Luo, M.; Zhang, K.; Zhang, J.; Chen, W. Nedd4 ubiquitylates VDAC2/3 to suppress erastin-induced ferroptosis in melanoma. Nat. Commun. 2020, 11, 433. [Google Scholar] [CrossRef] [Green Version]
  38. Siragusa, M.; Sessa, W.C. Telmisartan exerts pleiotropic effects in endothelial cells and promotes endothelial cell quiescence and survival. Arter. Thromb. Vasc. Biol. 2013, 33, 1852–1860. [Google Scholar] [CrossRef] [Green Version]
  39. Zuo, H.; Han, L.; Yu, Q.; Niu, K.; Zhao, S.; Shi, H. Proteome changes on water-holding capacity of yak longissimus lumborum during postmortem aging. Meat Sci. 2016, 121, 409–419. [Google Scholar] [CrossRef]
  40. Gustafson, P.; Lin, K.C.; Xu, J.; Kamara, D.; Geng, T.; Gyenai, K.; Reed, K.M.; Smith, E.J. DNA sequence and haplotype variation in two candidate genes for dilated cardiomyopathy in the turkey Meleagris gallopavo. Genome 2015, 50, 463–469. [Google Scholar]
  41. Krishnamoorthy, S.; Jin, R.; Cai, Y.; Maddipati, K.R.; Nie, D.; Pagès, G.; Tucker, S.C.; Honn, K.V. 12-Lipoxygenase and the regulation of hypoxia-inducible factor in prostate cancer cells. Exp. Cell Res. 2010, 316, 1706–1715. [Google Scholar] [CrossRef] [Green Version]
  42. Wang, L.; Lei, M.; Xiong, Y. Molecular Characterization and Different Expression Patterns of the Muscle Ankyrin Repeat Protein (MARP) Family During Porcine Skeletal Muscle Development in vitro and in vivo. Anim. Biotechnol. 2011, 22, 87–99. [Google Scholar] [CrossRef] [PubMed]
  43. Pallavicini, A.; Kojić, S.; Bean, C.; Vainzof, M.; Salamon, M.; Ievolella, C.; Bortoletto, G.; Pacchioni, B.; Zatz, M.; Lanfranchi, G. Characterization of Human Skeletal Muscle Ankrd2. Biochem. Biophys. Res. Commun. 2001, 285, 378–386. [Google Scholar] [CrossRef] [PubMed]
  44. Sun, L.; Dong, X.; Fan, B.; Liu, B. The Association of ANKRD2 with Loin Depth and Muscle Firmness in Pigs. J. Anim. Vet. Adv. 2011, 10, 1462–1468. [Google Scholar] [CrossRef] [Green Version]
  45. Rosenvold, K.; Petersen, J.; Laerke, H.; Jensen, S.; Therkildsen, M.; Karlsson, A.; Moller, H.; Andersen, H. Muscle glycogen stores and meat quality as affected by strategic finishing feeding of slaughter pigs. J. Anim. Sci. 2001, 79, 382–391. [Google Scholar] [CrossRef] [PubMed]
  46. Suman, S.; Joseph, P. Myoglobin chemistry and meat color. Annu. Rev. Food Sci. Technol. 2013, 4, 79–99. [Google Scholar] [CrossRef] [PubMed] [Green Version]
  47. Chen, L.; Li, Z.; Everaert, N.; Lametsch, R.; Zhang, D. Quantitative phosphoproteomic analysis of ovine muscle with different postmortem glycolytic rates. Food Chem. 2019, 280, 203–209. [Google Scholar] [PubMed]
  48. Wu, W.; Gao, X.; Dai, Y.; Fu, Y.; Li, X.; Dai, R. Post-mortem changes in sarcoplasmic proteome and its relationship to meat color traits in M. semitendinosus of Chinese Luxi yellow cattle. Food Res. Int. 2015, 72, 98–105. [Google Scholar] [CrossRef]
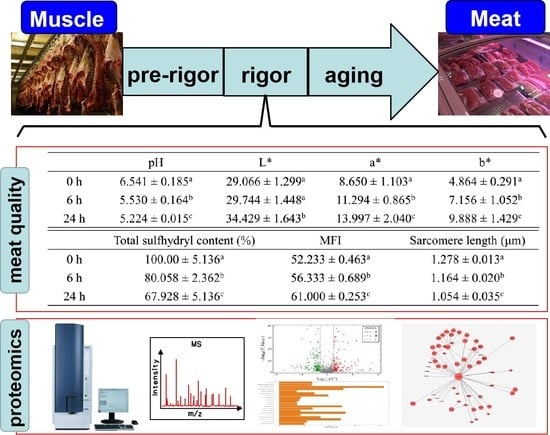
Figure 1. Experimental design and workflow. TMT: tandem mass tags, HPLC-MS/MS: liquid-chromatography tandem mass spectrometry, WB: western blot.
Foods 11 00217 g001
Figure 2. Transmission electron microscopy (TEM) images of longissimus lumborum muscles during postmortem storage.
Foods 11 00217 g002
Figure 3. (A) Protein-protein interaction networks of differentially expressed proteins of 6 h vs. 0 h PM. (B) Protein-protein interaction networks of differentially expressed proteins of 24 h vs. 6 h PM.
Foods 11 00217 g003
Figure 4. (A) Validation of the differentially expressed proteins of 0 h vs. 6 h PM by western blotting. (B) Validation of the differentially expressed proteins of 6 h vs. 24 h PM by western blotting.
Foods 11 00217 g004
Table 1. pH and meat color of Longissimus lumborum muscles during postmortem storage.
pHL*a*b*
0 h6.541 ± 0.185 a29.066 ± 1.299 a8.650 ± 1.103 a4.864 ± 0.291 a
6 h5.530 ± 0.164 b29.744 ± 1.448 a11.294 ± 0.865 b7.156 ± 1.052 b
24 h5.224 ± 0.015 c34.429 ± 1.643 b13.997 ± 2.040 c9.888 ± 1.429 c
L*, a*, and b* represent lightness, redness, and yellowness, respectively; different letters (a–c) in the same column indicate significant differences at different postmortem storage times (p < 0.05). The data were expressed as the mean ± SD.
Table 2. Total sulfhydryl content, MFI (myofibril fragmentation index), and sarcomere length of Longissimus lumborum muscles during postmortem storage.
Total Sulfhydryl Content (%)MFISarcomere Length (μm)
0 h100.00 ± 5.136 a52.233 ± 0.463 a1.278 ± 0.013 a
6 h80.058 ± 2.362 b56.333 ± 0.689 b1.164 ± 0.020 b
24 h67.928 ± 5.136 c61.000 ± 0.253 c1.054 ± 0.035 c
Different letters (a–c) in the same column indicate significant differences at different postmortem storage times (p < 0.05). The data were expressed as the mean ± SD.
Table 3. Gene ontology classification results of differentially expressed proteins of 6 h vs. 0 h PM.
TermDescriptionp Value
Biological ProcessGO:0046031ADP metabolic process6.10 × 109
GO:0006757ATP generation from ADP3.02 × 108
GO:0009132Nucleoside diphosphate metabolic process1.02 × 108
GO:0006165Nucleoside diphosphate phosphorylation2.03 × 109
GO:0046939Nucleotide phosphorylation2.03 × 109
GO:0046434Organophosphate catabolic process3.67 × 108
GO:0009135Purine nucleoside diphosphate metabolic process6.10 × 109
GO:0009179Purine ribonucleoside diphosphate metabolic process6.10 × 109
GO:0042866Pyruvate biosynthetic process3.02 × 108
GO:0009185Ribonucleoside diphosphate metabolic process6.10 × 109
Cellular ComponentGO:0005903Brush border0.043
GO:1990584Cardiac troponin complex0.037
GO:0043292Contractile fiber0.009
GO:0044449Contractile fiber part0.008
GO:0098850Extrinsic component of synaptic vesicle membrane0.020
GO:0097452GAIT complex0.037
GO:0031674I band0.037
GO:0030016Myofibril 0.009
GO:0030017Sarcomere 0.006
GO:0005861Troponin complex0.015
Molecular FunctionGO:0051373FATZ binding4.58 × 105
GO:0016866Intramolecular transferase activity2.14 × 104
GO:0016868Intramolecular transferase activity, phosphotransferases0.002
GO:0000287Magnesium ion binding0.006
GO:0004784Superoxide dismutase activity0.007
GO:0016532Superoxide dismutase copper chaperone activity0.007
GO:0031433Telethonin binding0.002
GO:0016740Transferase activity9.75 × 104
GO:0016769Transferase activity, transferring nitrogenous groups0.001
GO:0009041Uridylate kinase activity 0.007
Table 4. Gene ontology classification results of differentially expressed proteins of 24 h vs. 6 h PM.
TermDescriptionp Value
Biological ProcessGO:0098656Anion transmembrane transport2.42 × 10−5
GO:0006820Anion transport 9.35 × 10⁻⁵
GO:1905039Carboxylic acid transmembrane transport 3.52 × 10⁻⁴
GO:0015893Drug transport9.31 × 10−6
GO:0051234Establishment of localization3.68 × 10−4
GO:0034220Ion transmembrane transport 6.68 × 10⁻⁴
GO:0006811Ion transport2.37 × 10−5
GO:0021675Nerve development3.52 × 10−4
GO:1903825Organic acid transmembrane transport3.52 × 10−4
GO:0006810Transport 3.42 × 10⁻⁴
Cellular ComponentGO:0031975Envelope 4.82 × 10⁻⁴
GO:0016021Integral component of membrane3.94 × 10−10
GO:0031301Integral component of organelle membrane5.38 × 10−4
GO:0031224Intrinsic component of membrane5.74 × 10−10
GO:0098573Intrinsic component of mitochondrial membrane5.38 × 10−4
GO:0044425Membrane part1.88 × 10−4
GO:0005740Mitochondrial envelope3.47 × 10−4
GO:0031966Mitochondrial membrane3.52 × 10−4
GO:0031967Organelle envelope4.82 × 10−4
GO:0031090Organelle membrane1.49 × 10−4
Molecular FunctionGO:0022804Active transmembrane transporter activity6.62 × 10−5
GO:0008509Anion transmembrane transporter activity7.26 × 10−7
GO:0046943Carboxylic acid transmembrane transporter activity3.52 × 10−4
GO:0015238Drug transmembrane transporter activity3.52 × 10−4
GO:0015318Inorganic molecular entity transmembrane transporter activity8.75 × 10−6
GO:0015075Ion transmembrane transporter activity8.75 × 10−6
GO:0008514Organic anion transmembrane transporter activity2.42 × 10−5
GO:0015291Secondary active transmembrane transporter activity2.42 × 10−5
GO:0022857Transmembrane transporter activity3.15 × 10−6
GO:0005215Transporter activity6.38 × 10−6
Table 5. KEGG pathway enrichment of differentially expressed proteins of 6 h vs. 0 h PM.
PathwayPathway Namep Value
map00220Arginine biosynthesis0.037
map01230Biosynthesis of amino acids2.39 × 10−5
map01200Carbon metabolism7.47 × 10−6
map05204Chemical carcinogenesis0.005
map00270Cysteine and methionine metabolism0.006
map00982Drug metabolism-cytochrome P450 0.009
map00051Fructose and mannose metabolism0.009
map00052Galactose metabolism0.037
map00480Glutathione metabolism0.006
map00010Glycolysis/Gluconeogenesis7.77 × 10−9
map04910Insulin signaling pathway0.029
map04213Longevity regulating pathway-multiple species0.009
map01100Metabolic pathways3.48 × 10−7
map00980Metabolism of xenobiotics by cytochrome P4500.015
map00030Pentose phosphate pathway0.004
map04146Peroxisome0.023
map00360Phenylalanine metabolism0.037
map00620Pyruvate metabolism0.001
map00500Starch and sucrose metabolism0.032
map00750Vitamin B6 metabolism0.007
Table 6. KEGG pathway enrichment of differentially expressed proteins of 24 h vs. 6 h PM.
PathwayPathway Namep Value
map05010Alzheimer’s disease0.013
map04020Calcium signaling pathway8.00 × 10−5
map04022cGMP-PKG signaling pathway4.70 × 10−4
map05166HTLV-I infection0.002
map05016Huntington’s disease0.002
map04657IL-17 signaling pathway0.044
map04211Longevity regulating pathway0.044
map05144Malaria0.027
map04217Necroptosis0.039
map00190Oxidative phosphorylation0.006
map05012Parkinson’s disease6.80 × 10−5
map04742Taste transduction0.005
map00130Ubiquinone and other terpenoid–quinone biosynthesis0.014
Table 7. Validation of the differentially expressed proteins (PKM, TNNT1, COX5A, FIS1, COX4I1, and NDUFB11) by western blotting.
AccessionGene NamesTMT (6/0 h)WB (6/0 h)TMT (24/6 h)WB (24/6 h)
FCp ValueFCp ValueFCp ValueFCp Value
A5D984PKM0.6400.640.0056
Q8MKH6-2TNNT11.472.15 × 10331.570.0024
P00426COX5A2.280.00011.720.0017
Q3T0I5FIS1 0.782.58 × 1060.650.0031
P00423COX4I10.493.34 × 10−360.610.0318
Q8HXG5NDUFB110.870.03870.660.0216
FC indicates the fold change of each differentially expressed protein of 6/0 h PM or 24/6 h PM. TMT: tandem mass tags; WB: western blotting.
Publisher’s Note: MDPI stays neutral with regard to jurisdictional claims in published maps and institutional affiliations.

