
Untargeted Profiling and Differentiation of Volatiles in Varieties of Meat Using GC Orbitrap MS
 ,
,
Abstract
:1. Introduction
2. Reagents and Materials
2.1. Chemicals
2.2. Sample Handling and SPME Procedure
2.3. Analysis of Volatile Compounds by GC-HRMS
2.4. Method Validation
2.5. Statistical Analysis
3. Results and Discussions
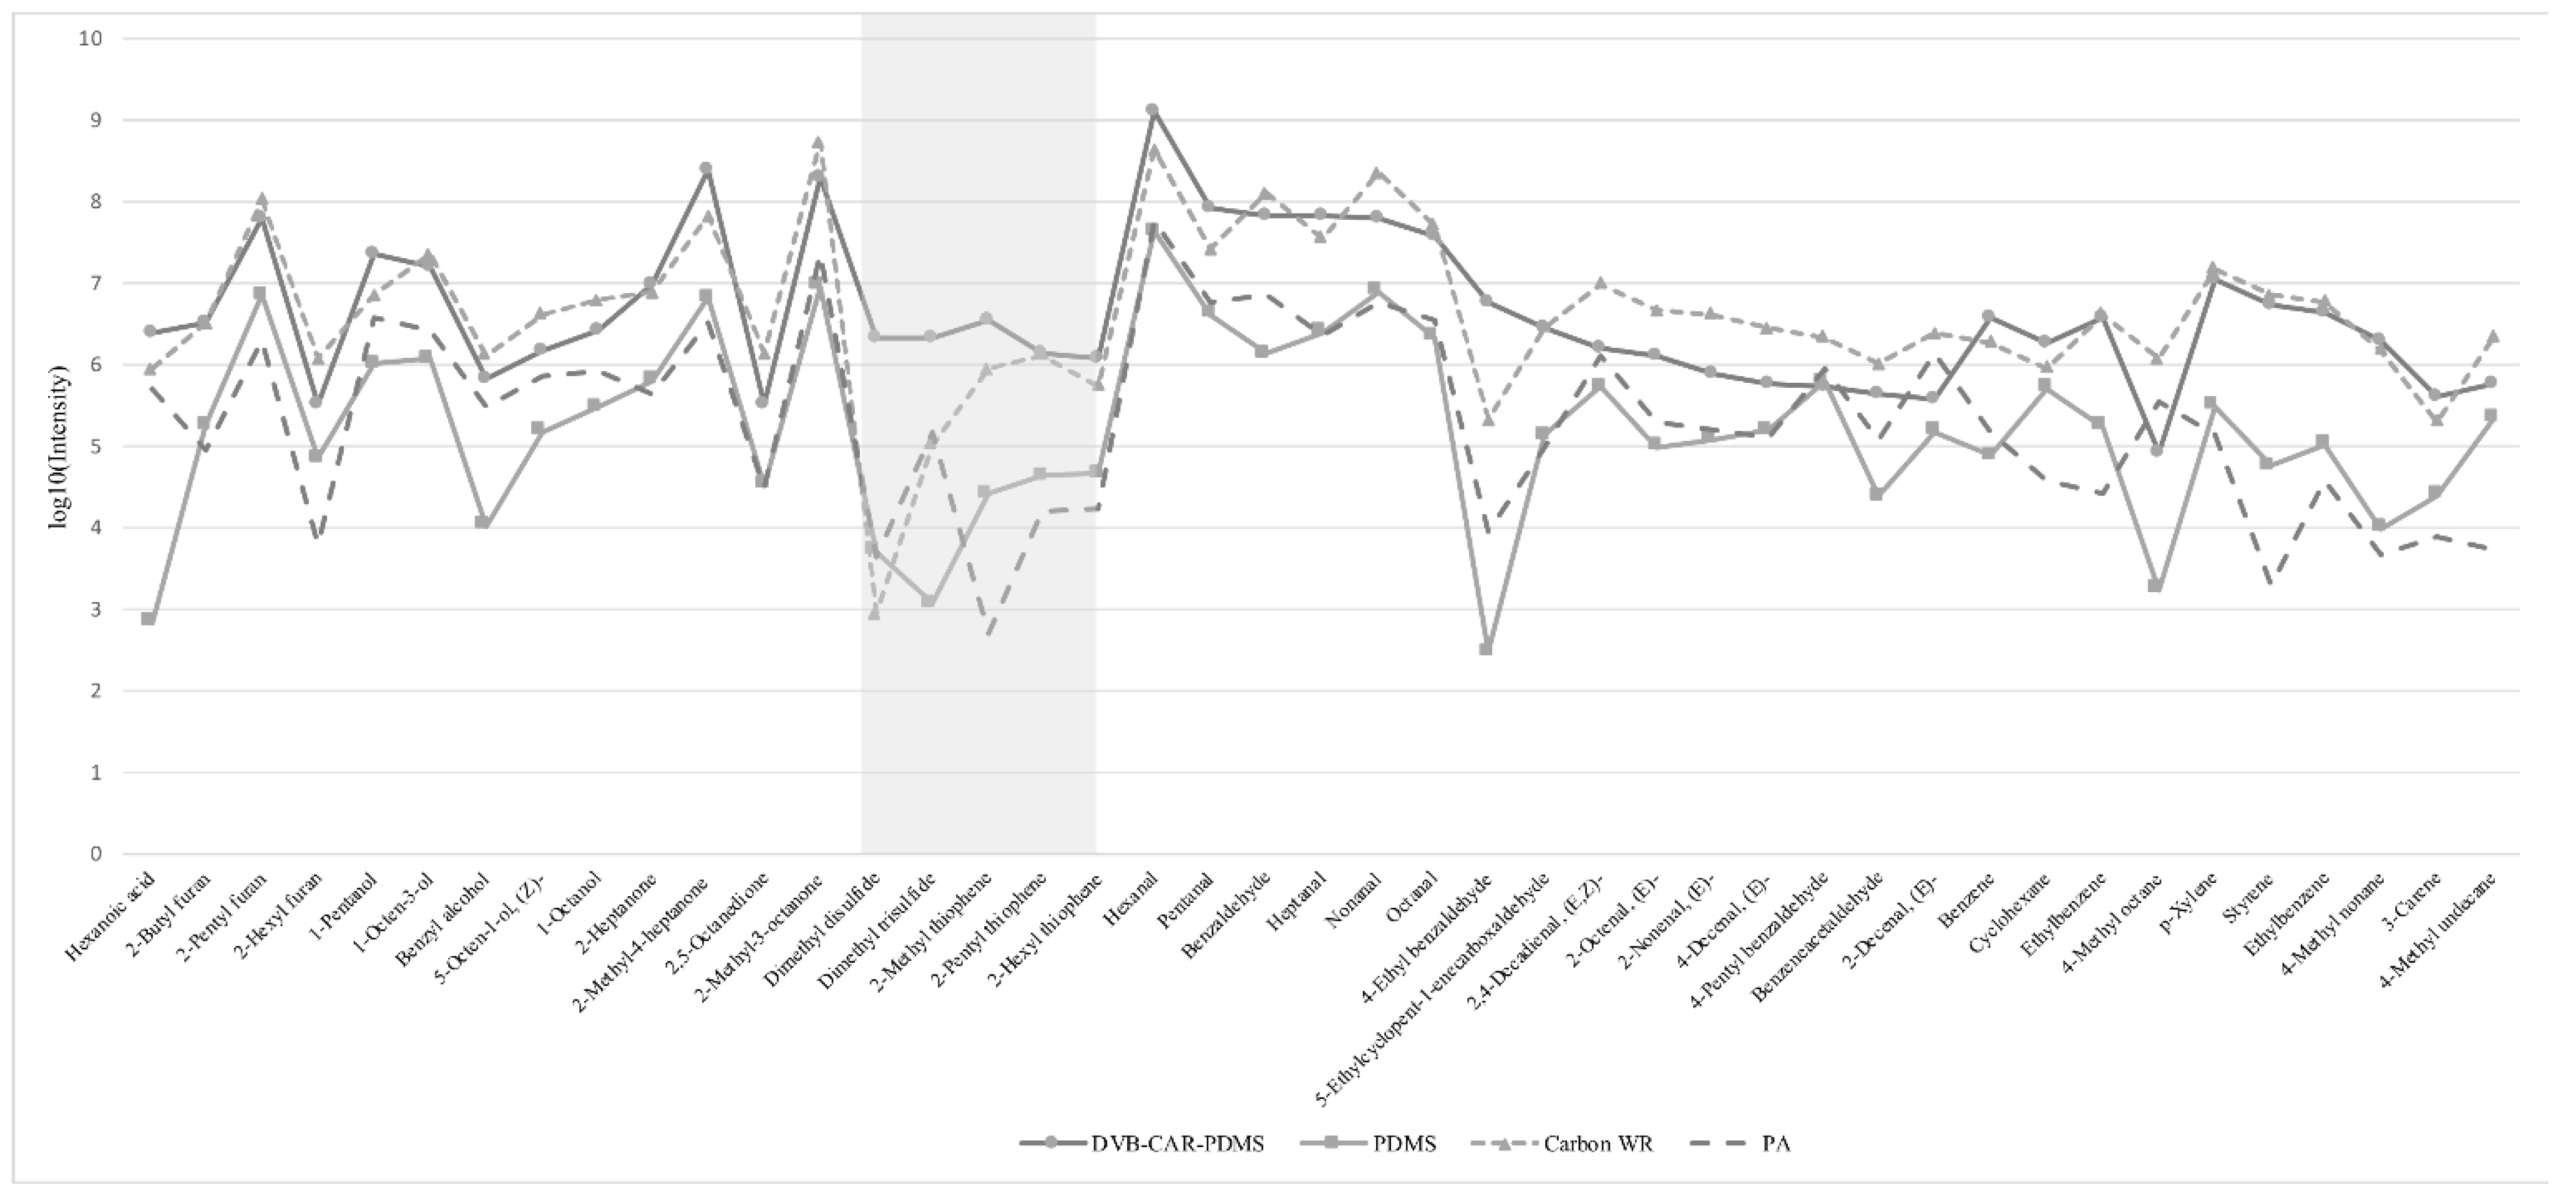
3.1. Optimization of Separation
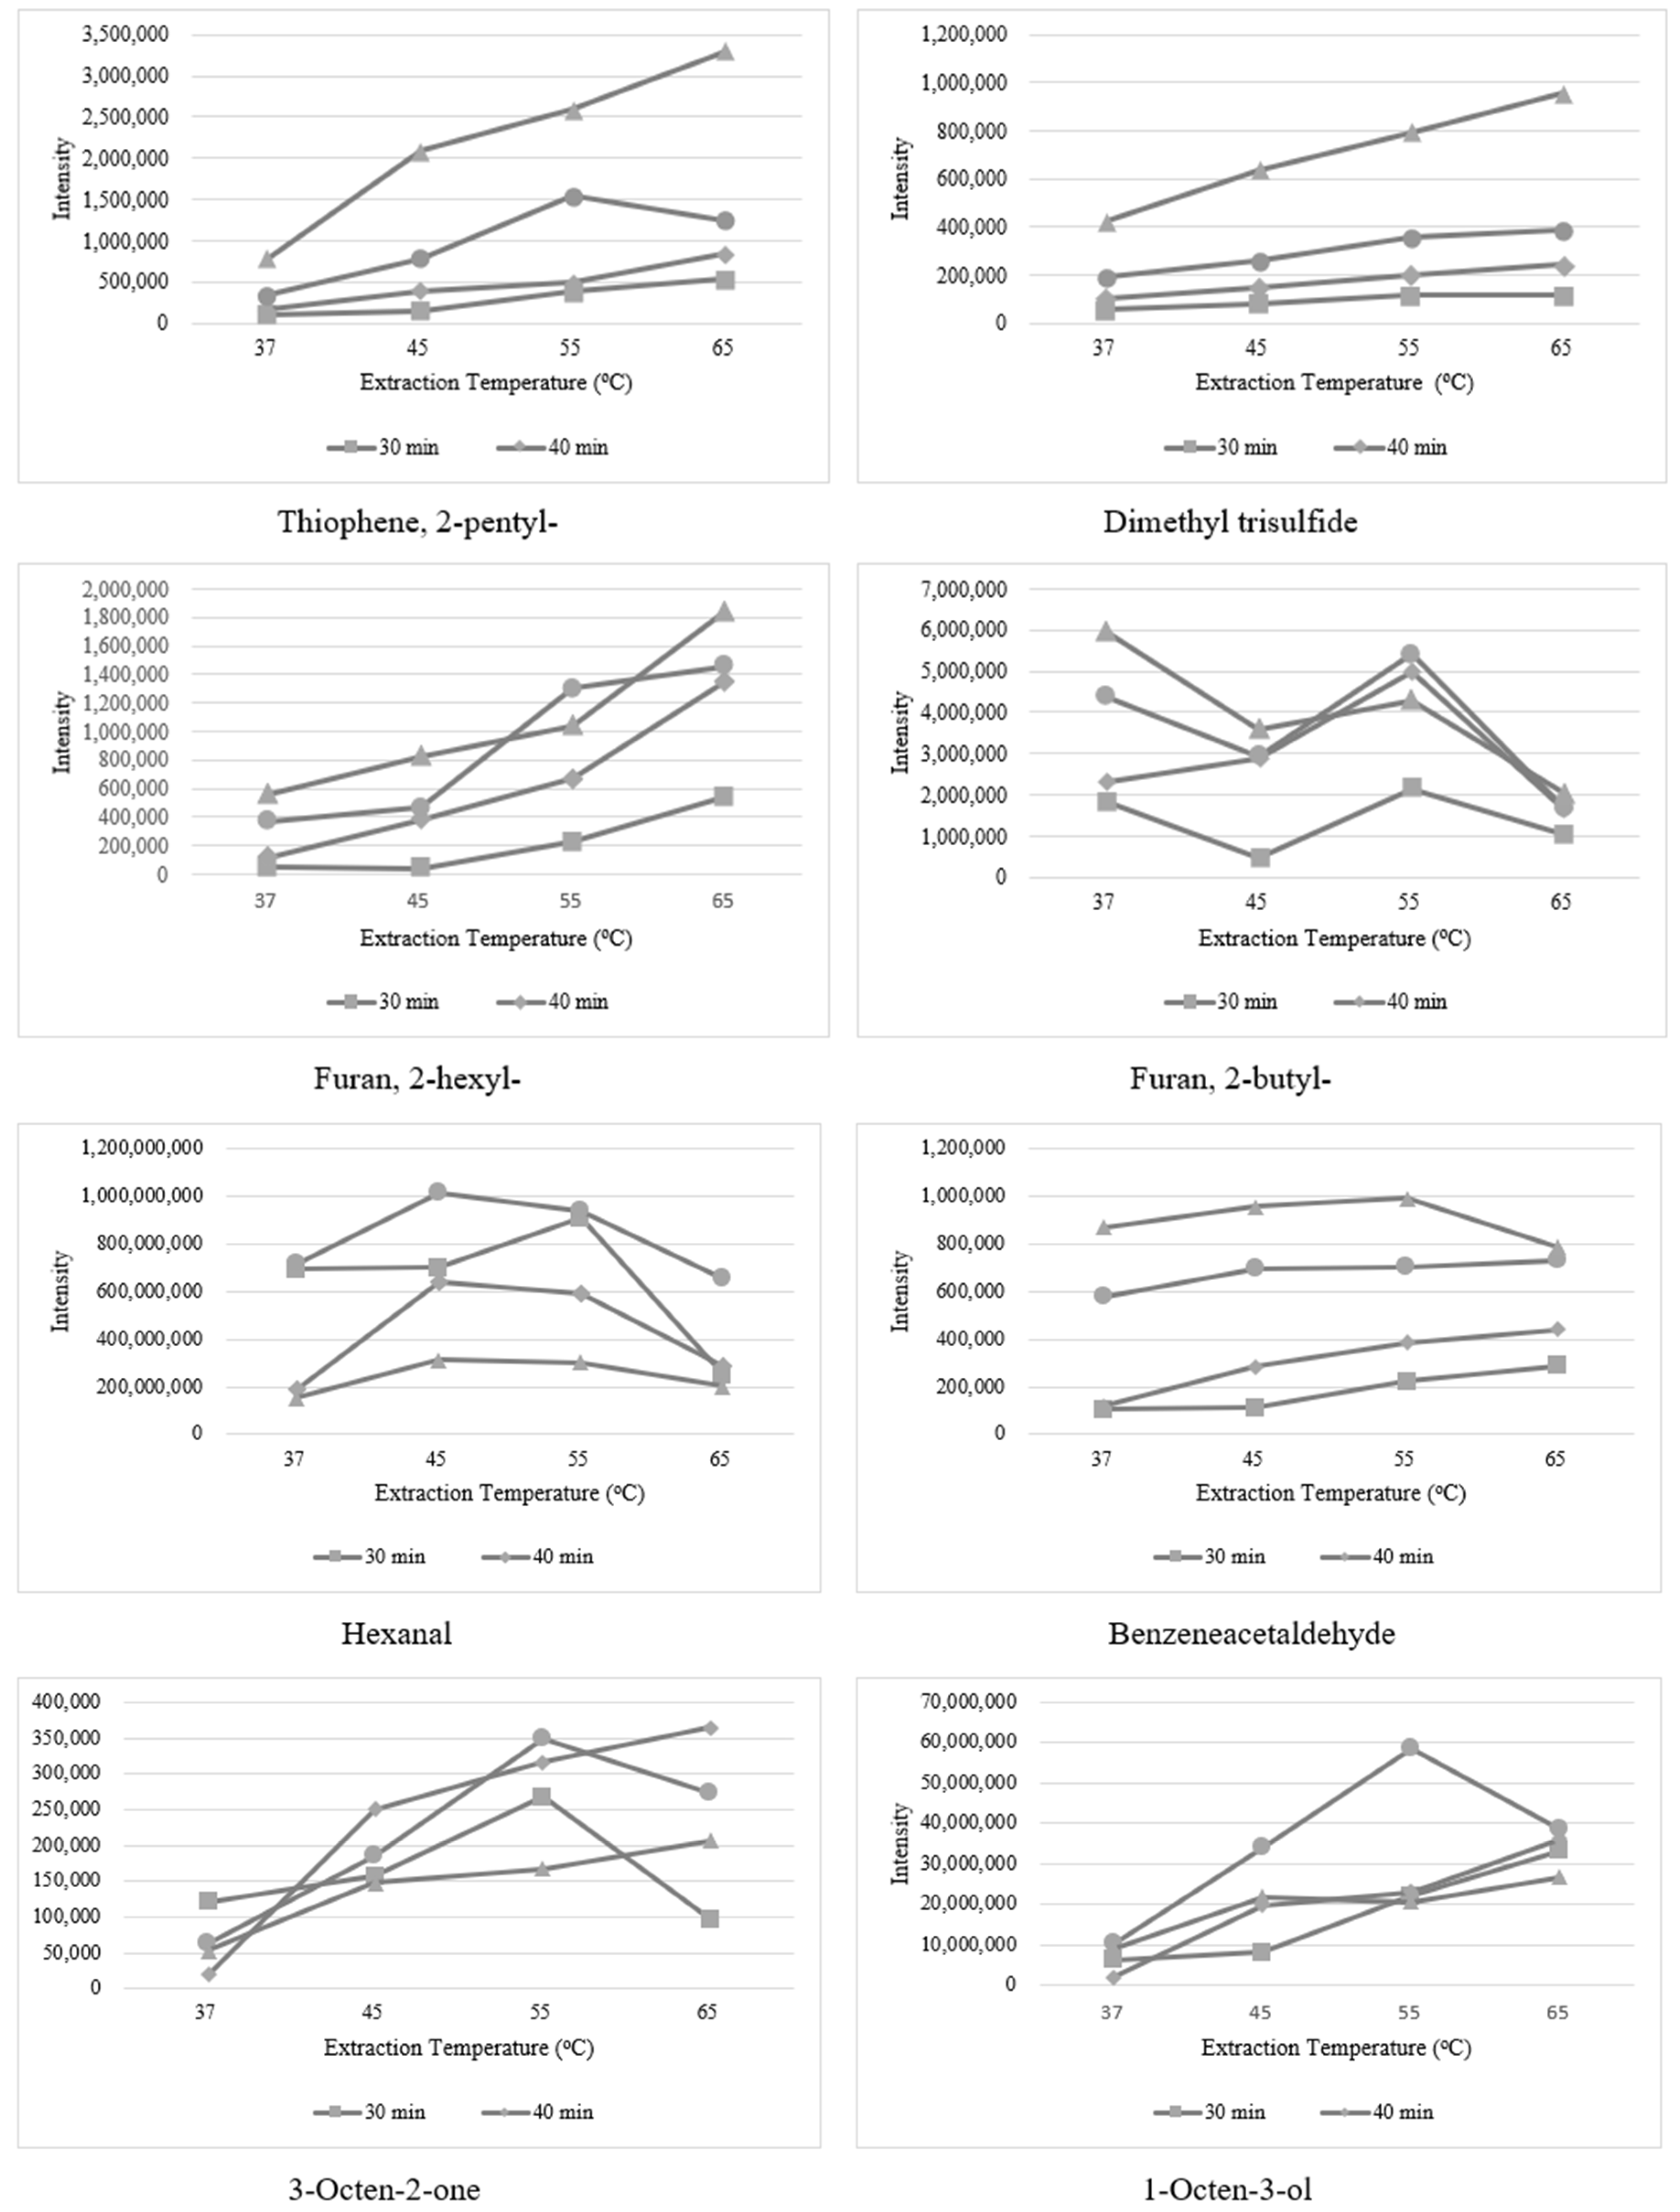
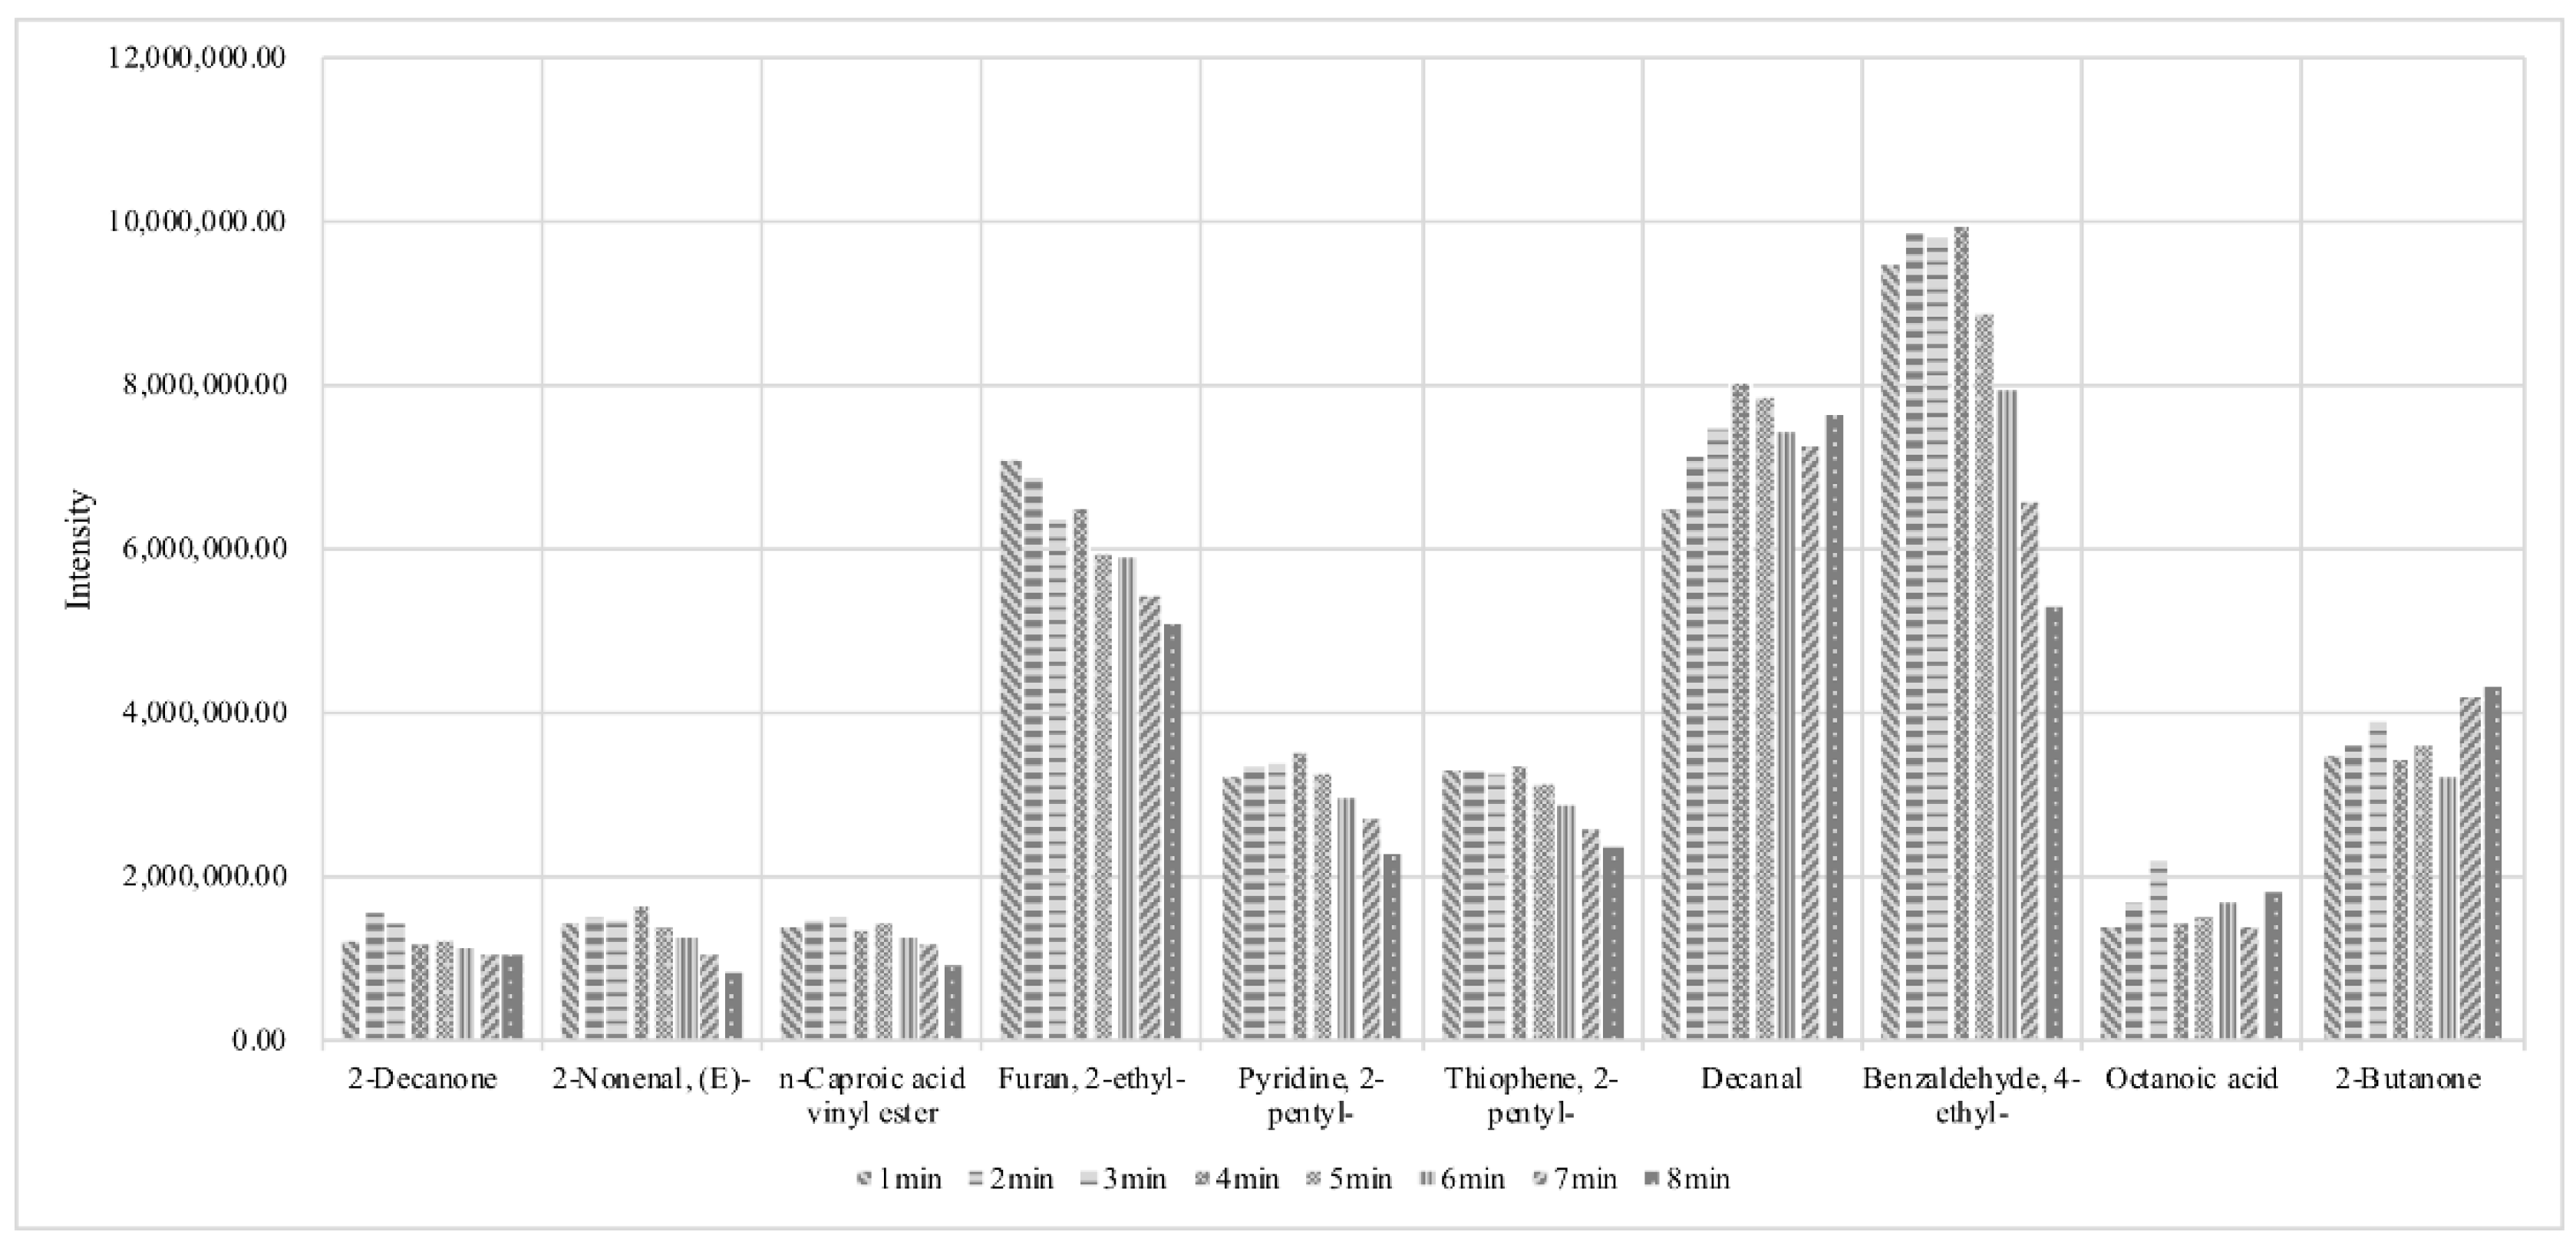
3.2. Optimization of Extraction
3.3. Method Validation
3.4. Identification of Volatile Compounds in Different Meats
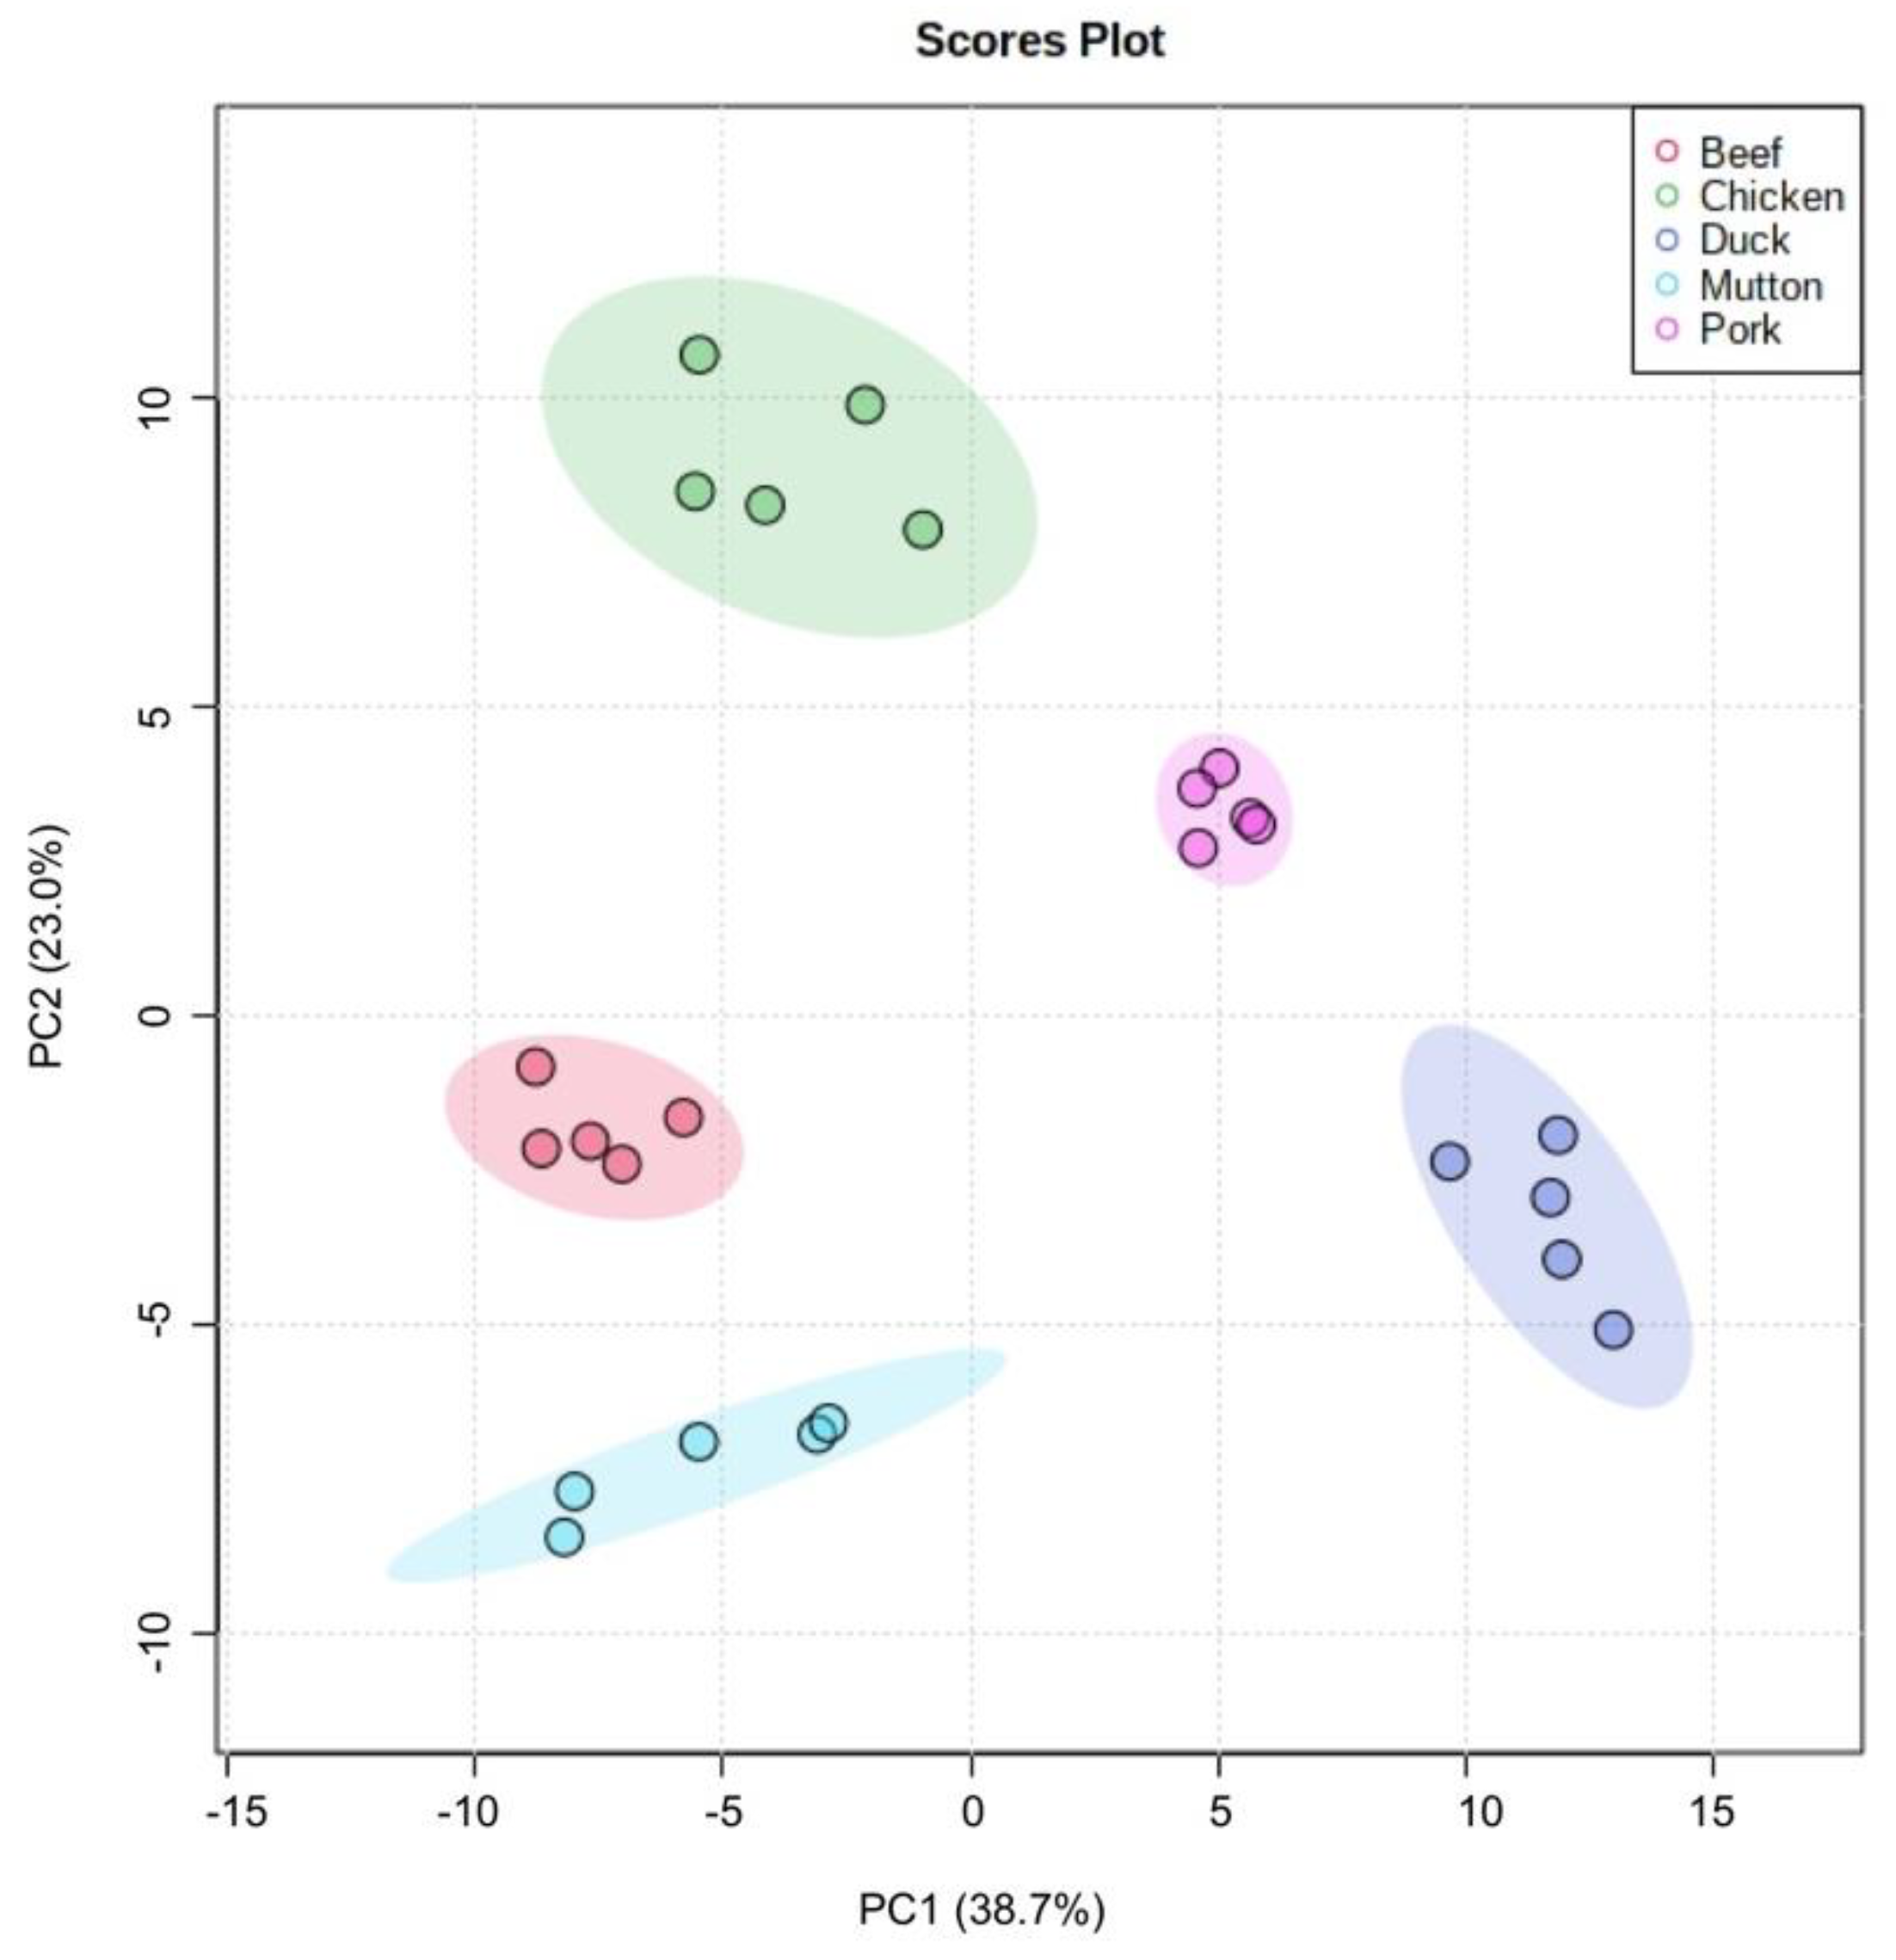
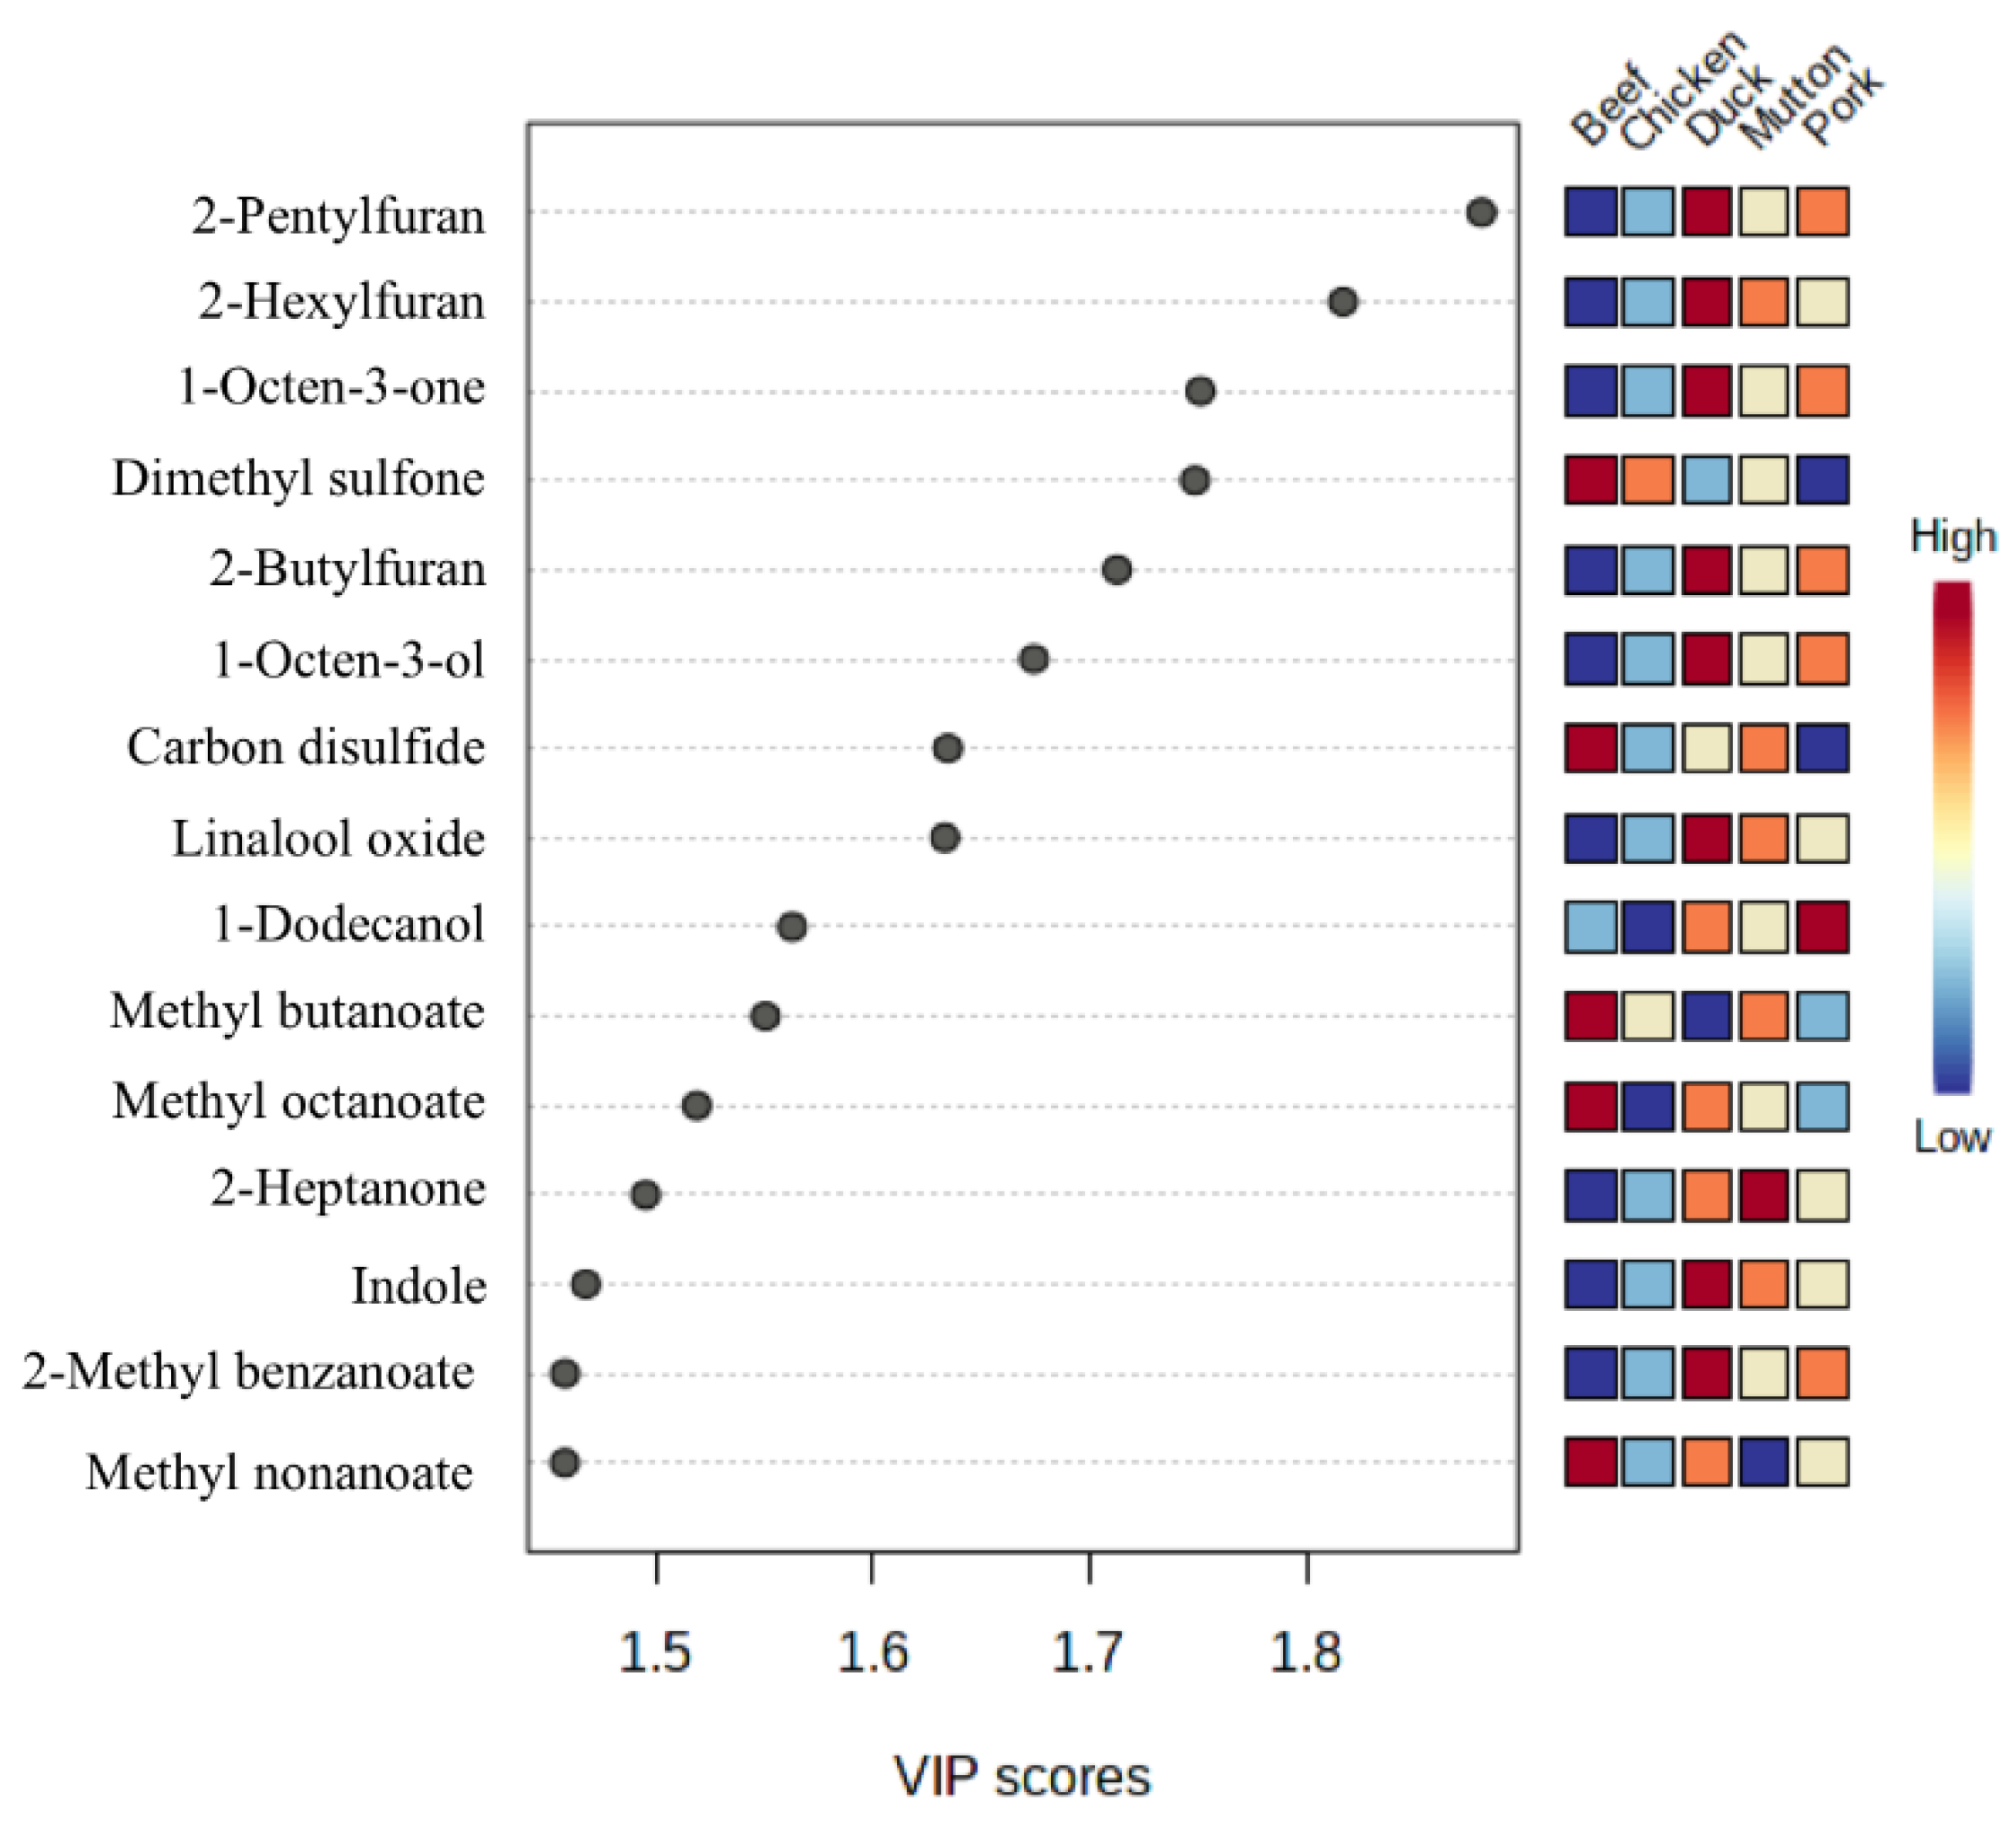
3.5. Statistical Analysis
4. Conclusions
Author Contributions
Funding
Data Availability Statement
Conflicts of Interest
References
- Xiaojun, J.; Jingting, S.; Ming, Z.; Yifan, L.; Yunjie, T.; Gaige, J.; Yanju, S.; Jianmin, Z. Comparison Analysis of Meat Quality and Flavor of Different Breeds and Feeding Periods of Broilers. Chin. J. Anim. Nutr. 2018, 30, 2421–2430. [Google Scholar] [CrossRef]
- Menis-Henrique, M.E.C. Methodologies to Advance the Understanding of Flavor Chemistry. Curr. Opin. Food Sci. 2020, 33, 131–135. [Google Scholar] [CrossRef]
- Resconi, V.C.; Bueno, M.; Escudero, A.; Magalhaes, D.; Ferreira, V.; Campo, M.M. Ageing and Retail Display Time in Raw Beef Odour According to the Degree of Lipid Oxidation. Food Chem. 2018, 242, 288–300. [Google Scholar] [CrossRef] [Green Version]
- Rasinska, E.; Rutkowska, J.; Czarniecka-Skubina, E.; Tambor, K. Effects of Cooking Methods on Changes in Fatty Acids Contents, Lipid Oxidation and Volatile Compounds of Rabbit Meat. LWT 2019, 110, 64–70. [Google Scholar] [CrossRef]
- Zhao, J.; Wang, T.; Xie, J.; Xiao, Q.; Du, W.; Wang, Y.; Cheng, J.; Wang, S. Meat Flavor Generation from Different Composition Patterns of Initial Maillard Stage Intermediates Formed in Heated Cysteine-Xylose-Glycine Reaction Systems. Food Chem. 2019, 274, 79–88. [Google Scholar] [CrossRef]
- Drakula, S.; Mustač, N.Č.; Novotni, D.; Voučko, B.; Krpan, M.; Hruškar, M.; Ćurić, D. Optimization and Validation of a HS-SPME/GC–MS Method for the Analysis of Gluten-Free Bread Volatile Flavor Compounds. Food Anal. Methods 2022, 15, 1155–1170. [Google Scholar] [CrossRef]
- Gao, G.; Liu, M.; Li, J.; Li, Y.; Li, H.; Xu, G. Headspace Solid-Phase Micro-Extraction for Determination of Volatile Organic Compounds in Apple Using Gas Chromatography–Mass Spectrometry. Food Anal. Methods 2022, 15, 2734–2743. [Google Scholar] [CrossRef]
- Wang, J.; Gambetta, J.M.; Jeffery, D.W. Comprehensive Study of Volatile Compounds in Two Australian Rosé Wines: Aroma Extract Dilution Analysis (AEDA) of Extracts Prepared Using Solvent-Assisted Flavor Evaporation (SAFE) or Headspace Solid-Phase Extraction (HS-SPE). J. Agric. Food Chem. 2016, 64, 3838–3848. [Google Scholar] [CrossRef]
- Barba, C.; Thomas-Danguin, T.; Guichard, E. Comparison of Stir Bar Sorptive Extraction in the Liquid and Vapour Phases, Solvent-Assisted Flavour Evaporation and Headspace Solid-Phase Microextraction for the (Non)-Targeted Analysis of Volatiles in Fruit Juice. LWT-Food Sci. Technol. Food Sci. Technol. 2017, 85, 334–344. [Google Scholar] [CrossRef]
- Frank, D.; Watkins, P.; Ball, A.; Krishnamurthy, R.; Piyasiri, U.; Sewell, J.; Ortuño, J.; Stark, J.; Warner, R. Impact of Brassica and Lucerne Finishing Feeds and Intramuscular Fat on Lamb Eating Quality and Flavor. A Cross-Cultural Study Using Chinese and Non-Chinese Australian Consumers. J. Agric. Food Chem. 2016, 64, 6856–6868. [Google Scholar] [CrossRef]
- Kataoka, H.; Lord, H.L.; Pawliszyn, J. Applications of Solid-Phase Microextraction in Food Analysis. J. Chromatogr. A 2000, 880, 35–62. [Google Scholar] [CrossRef]
- Balasubramanian, S.; Panigrahi, S. Solid-Phase Microextraction (SPME) Techniques for Quality Characterization of Food Products: A Review. Food Bioproc. Tech. 2011, 4, 1–26. [Google Scholar] [CrossRef]
- Moon, S.-Y.; Li-Chan, E.C.Y. Development of Solid-Phase Microextraction Methodology for Analysis of Headspace Volatile Compounds in Simulated Beef Flavour. Food Chem. 2004, 88, 141–149. [Google Scholar] [CrossRef]
- Watanabe, A.; Ueda, Y.; Higuchi, M.; Shiba, N. Analysis of Volatile Compounds in Beef Fat by Dynamic-Headspace Solid-Phase Microextraction Combined with Gas Chromatography–Mass Spectrometry. J. Food Sci. 2008, 73, C420–C425. [Google Scholar] [CrossRef]
- Rivas-Cañedo, A.; Juez-Ojeda, C.; Nuñez, M.; Fernández-García, E. Volatile Compounds in Ground Beef Subjected to High Pressure Processing: A Comparison of Dynamic Headspace and Solid-Phase Microextraction. Food Chem. 2011, 124, 1201–1207. [Google Scholar] [CrossRef]
- Zuloaga, O.; Etxebarria, N.; González-Gaya, B.; Olivares, M.; Prieto, A.; Usobiaga, A. Stir-Bar Sorptive Extraction. In Solid-Phase Extraction; Poole, C.F., Ed.; Handbooks in Separation Science; Elsevier: Amsterdam, The Netherlands, 2020; pp. 493–530. ISBN 978-0-12-816906-3. [Google Scholar]
- López, P.; Huerga, M.A.; Batlle, R.; Nerin, C. Use of Solid Phase Microextraction in Diffusive Sampling of the Atmosphere Generated by Different Essential Oils. Anal. Chim. Acta 2006, 559, 97–104. [Google Scholar] [CrossRef]
- Bicchi, C.; Iori, C.; Rubiolo, P.; Sandra, P. Headspace Sorptive Extraction (HSSE), Stir Bar Sorptive Extraction (SBSE), and Solid Phase Microextraction (SPME) Applied to the Analysis of Roasted Arabica Coffee and Coffee Brew. J. Agric. Food Chem. 2002, 50, 449–459. [Google Scholar] [CrossRef]
- Liu, H.; Wang, Z.; Zhang, D.; Shen, Q.; Pan, T.; Hui, T.; Ma, J. Characterization of Key Aroma Compounds in Beijing Roasted Duck by Gas Chromatography-Olfactometry-Mass Spectrometry, Odor-Activity Values, and Aroma-Recombination Experiments. J. Agric. Food Chem. 2019, 67, 5847–5856. [Google Scholar] [CrossRef]
- Mansur, A.R.; Seo, D.-H.; Song, E.-J.; Song, N.-E.; Hwang, S.H.; Yoo, M.; Nam, T.G. Identifying Potential Spoilage Markers in Beef Stored in Chilled Air or Vacuum Packaging by HS-SPME-GC-TOF/MS Coupled with Multivariate Analysis. LWT 2019, 112, 108256. [Google Scholar] [CrossRef]
- Wang, W.; Feng, X.; Zhang, D.; Li, B.; Sun, B.; Tian, H.; Liu, Y. Analysis of Volatile Compounds in Chinese Dry-Cured Hams by Comprehensive Two-Dimensional Gas Chromatography with High-Resolution Time-of-Flight Mass Spectrometry. Meat Sci. 2018, 140, 14–25. [Google Scholar] [CrossRef]
- Zhu, S.; Lu, X.; Ji, K.; Guo, K.; Li, Y.; Wu, C.; Xu, G. Characterization of Flavor Compounds in Chinese Liquor Moutai by Comprehensive Two-Dimensional Gas Chromatography/Time-of-Flight Mass Spectrometry. Anal. Chim. Acta 2007, 597, 340–348. [Google Scholar] [CrossRef]
- Diez-Simon, C.; Mumm, R.; Hall, R.D. Mass Spectrometry-Based Metabolomics of Volatiles as a New Tool for Understanding Aroma and Flavour Chemistry in Processed Food Products. Metabolomics 2019, 15, 1–20. [Google Scholar] [CrossRef] [Green Version]
- Zhou, J.; Han, Y.; Zhuang, H.; Feng, T.; Xu, B. Influence of the Type of Extraction Conditions and Fiber Coating on the Meat of Sauced Duck Neck Volatile Compounds Extracted by Solid-Phase Microextraction (SPME). Food Anal. Methods 2015, 8, 1661–1672. [Google Scholar] [CrossRef]
- Khan, M.I.; Jo, C.; Tariq, M.R. Meat Flavor Precursors and Factors Influencing Flavor Precursors—A Systematic Review. Meat Sci. 2015, 110, 278–284. [Google Scholar] [CrossRef]
- Lorenzo, J.M. Influence of the Type of Fiber Coating and Extraction Time on Foal Dry-Cured Loin Volatile Compounds Extracted by Solid-Phase Microextraction (SPME). Meat Sci. 2014, 96, 179–186. [Google Scholar] [CrossRef]
- Casaburi, A.; Piombino, P.; Nychas, G.-J.; Villani, F.; Ercolini, D. Bacterial Populations and the Volatilome Associated to Meat Spoilage. Food Microbiol. 2015, 45, 83–102. [Google Scholar] [CrossRef]
- Li, J.; Yang, Y.; Tang, C.; Yue, S.; Zhao, Q.; Li, F.; Zhang, J. Changes in Lipids and Aroma Compounds in Intramuscular Fat from Hu Sheep. Food Chem. 2022, 383, 132611. [Google Scholar] [CrossRef]
- Flores, M. Chapter 13—The Eating Quality of Meat: III—Flavor. In Lawrie´s Meat Science, 8th ed.; Toldra, F., Ed.; Woodhead Publishing Series in Food Science, Technology and Nutrition; Woodhead Publishing: Cambridge, UK, 2017; pp. 383–417. ISBN 978-0-08-100694-8. [Google Scholar]
- Shahidi, F.; Abad, A. Lipid-Derived Flavours and off-Flavours in Food. Encycl. Food Chem. 2018, 2, 182–192. [Google Scholar] [CrossRef]
- Lund, M.N.; Ray, C.A. Control of Maillard Reactions in Foods: Strategies and Chemical Mechanisms. J. Agric. Food Chem. 2017, 65, 4537–4552. [Google Scholar] [CrossRef] [Green Version]
- Mottram, D.S.; Mottram, H.R. An Overview of the Contribution of Sulfur-Containing Compounds to the Aroma in Heated Foods. ACS Symp. Ser. 2002, 826, 73–92. [Google Scholar]
- Chen, C.; Liu, Z.; Yu, H.; Xu, Z.; Tian, H. Flavoromic Determination of Lactones in Cheddar Cheese by GC–MS–Olfactometry, Aroma Extract Dilution Analysis, Aroma Recombination and Omission Analysis. Food Chem. 2022, 368, 130736. [Google Scholar] [CrossRef]
- Fox, P.F.; Wallace, J.M. Formation of Flavor Compounds in Cheese. Adv. Appl. Microbiol. 1997, 45, 17–85. [Google Scholar]
- Zhao, J.; Xing, Q.; Lu, Y.; Wang, Z. Fatty Acid Composition in Different Animal Products. J. Hyg. Res. 2018, 47, 254–259. [Google Scholar] [CrossRef]
- Sohail, A.; Al-Dalali, S.; Wang, J.; Xie, J.; Shakoor, A.; Asimi, S.; Shah, H.; Patil, P. Aroma Compounds Identified in Cooked Meat: A Review. Food Res. Int. 2022, 157, 111385. [Google Scholar] [CrossRef]
- Cecchi, L.; Migliorini, M.; Giambanelli, E.; Cane, A.; Zanoni, B.; Canuti, V.; Mulinacci, N.; Melani, F. Is the Volatile Compounds Profile a Suitable Tool for Authentication of Virgin Olive Oils (Olea Europaea L.) According to Cultivars? A Study by Using HS-SPME-GC-MS and Chemometrics. Food Control 2022, 139, 109092. [Google Scholar] [CrossRef]
- Zhu, M.; Sun, J.; Zhao, H.; Wu, F.; Xue, X.; Wu, L.; Cao, W. Volatile Compounds of Five Types of Unifloral Honey in Northwest China: Correlation with Aroma and Floral Origin Based on HS-SPME/GC–MS Combined with Chemometrics. Food Chem. 2022, 384, 132461. [Google Scholar] [CrossRef] [PubMed]

| Component Name | CAS Number | Retention Time (min) | Formula | RI | ΔRI | Identification Method |
|---|---|---|---|---|---|---|
| hydrocarbons | ||||||
| (3Z)-Octene | 14850-22-7 | 6.819 | C8H16 | 858 | 0 | RI a, Nist, HRF b |
| Decane | 124-18-5 | 9.841 | C10H22 | 1002 | 2 | RI, Nist, HRF |
| (E,E)-1,3,5-Undecatriene | 19883-29-5 | 22.704 | C11H18 | 1390 | 2 | RI, Nist, HRF |
| 1,2,4-Trimethylbenzene | 95-63-6 | 18.995 | C9H12 | 1282 | 1 | RI, Nist, HRF |
| 1-Ethyl-3-methylbenzene | 620-14-4 | 16.947 | C9H12 | 1222 | 3 | RI, Nist, HRF |
| 1-Ethyl-2-methyl-benzene | 611-14-3 | 18.294 | C9H12 | 1261 | 3 | RI, Nist, HRF |
| 2-Methyl-5-(1-methylethyl)-bicyclo [3.1.0]hex-2-ene | 2867-05-2 | 10.568 | C10H16 | 1025 | 3 | RI, Nist, HRF |
| 1-Methyl-(1E)-propenyl- benzene | 768-00-3 | 25.719 | C10H12 | 1483 | 3 | RI, Nist, HRF |
| (Z,E)-1,3,5-Undecatriene | 19883-27-3 | 23.154 | C11H18 | 1404 | 4 | RI, Nist, HRF |
| Benzene | 71-43-2 | 8.475 | C6H6 | 944 | 5 | RI, Homeflavor, HRF |
| 2,2,4,6,6-Pentamethylheptane | 13475-82-6 | 8.687 | C12H26 | 954 | 5 | RI, Nist, HRF |
| α-Methylstyrene | 98-83-9 | 20.791 | C9H10 | 1333 | 5 | RI, Nist, HRF |
| Toluene | 108-88-3 | 11.106 | C7H8 | 1043 | 6 | RI, Homeflavor, HRF |
| 1,4-Diethylbenzene | 105-05-5 | 19.642 | C10H14 | 1299 | 6 | RI, Nist, HRF |
| 1-Ethyl-3,5-dimethylbenzene | 934-74-7 | 20.517 | C10H14 | 1325 | 6 | RI, Nist, HRF |
| Ethylbenzene | 100-41-4 | 13.572 | C8H10 | 1122 | 7 | RI, Nist, HRF |
| 1-Ethyl-2,4-dimethylbenzene | 874-41-9 | 21.536 | C10H14 | 1355 | 7 | RI, Nist, HRF |
| 1,3-Dimethylbenzene | 108-38-3 | 14.008 | C8H10 | 1135 | 8 | RI, Nist, HRF |
| p-Xylene | 106-42-3 | 13.819 | C8H10 | 1129 | 9 | RI, Nist, HRF |
| Propylbenzene | 103-65-1 | 16.311 | C9H12 | 1203 | 9 | RI, Nist, HRF |
| Mesitylene | 108-67-8 | 17.607 | C9H12 | 1241 | 10 | RI, Nist, HRF |
| 1-Methyl-4-propylbenzene | 1074-55-1 | 19.843 | C10H14 | 1306 | 10 | RI, Nist, HRF |
| 1,2,4,5-Tetramethylbenzene | 95-93-2 | 24.442 | C10H14 | 1443 | 10 | RI, Nist, HRF |
| 1-Methylethylbenzene | 98-82-8 | 15.044 | C9H12 | 1167 | 11 | RI, Nist, HRF |
| 4-Methylundecane | 2980-69-0 | 15.393 | C12H26 | 1178 | 31 | RI, Nist, HRF |
| 4-Octyne | 1942-45-6 | 8.755 | C8H14 | 956 | 44 | RI, Nist, HRF |
| 2-Ethyl-1,3-dimethylbenzene | 2870-04-4 | 22.04 | C10H14 | 1370 | 11 | RI, Nist, HRF |
| Indane | 496-11-7 | 22.21 | C9H10 | 1376 | 11 | RI, Nist, HRF |
| Styrene | 100-42-5 | 18.196 | C8H8 | 1258 | 12 | RI, Homeflavor, HRF |
| p-Cymene | 99-87-6 | 18.471 | C10H14 | 1266 | 17 | RI, Homeflavor, HRF |
| o-Xylene | 95-47-6 | 15.512 | C8H10 | 1181 | 18 | RI, Homeflavor, HRF |
| dl-Limonene | 138-86-3 | 15.761 | C10H16 | 1187 | 24 | RI, Homeflavor, HRF |
| alcohols | ||||||
| 1-Pentanol | 71-41-0 | 18.029 | C5H12O | 1253 | 0 | RI, Homeflavor, HRF |
| 1-Octanol | 111-87-5 | 27.993 | C8H18O | 1554 | 3 | RI, Nist, HRF |
| (5Z)-Octen-1-ol | 64275-73-6 | 29.75 | C8H16O | 1612 | 3 | RI, Nist, HRF |
| 1-Hexanol | 111-27-3 | 21.337 | C6H14O | 1350 | 5 | RI, Homeflavor, HRF |
| 1-Octen-3-ol | 53907-72-5 | 24.581 | C8H16O | 1446 | 5 | RI, Homeflavor, HRF |
| 1-Dodecanol | 112-53-8 | 39.491 | C12H26O | 1964 | 5 | RI, Homeflavor, HRF |
| α-Terpineol | 98-55-5 | 32.337 | C10H18O | 1700 | 6 | RI, Homeflavor, HRF |
| 1-Undecanol | 112-42-5 | 36.803 | C11H24O | 1861 | 9 | RI, Nist, HRF |
| Benzenemethanol | 100-51-6 | 37.313 | C7H8O | 1880 | 10 | RI, Homeflavor, HRF |
| Benzeneethanol | 60-12-8 | 38.257 | C8H10O | 1916 | 10 | RI, Homeflavor, HRF |
| Phenol | 108-95-2 | 40.655 | C6H6O | 2010 | 10 | RI, Nist, HRF |
| 5-Methyl-1-hexanol | 627-98-5 | 24.695 | C7H16O | 1451 | 15 | RI, Nist, HRF |
| 3-Methylphenol | 108-39-4 | 42.526 | C7H8O | 2086 | 13 | RI, Homeflavor, HRF |
| esters | ||||||
| Methyl hexadecanoate | 112-39-0 | 45.681 | C17H34O2 | 2222 | 0 | RI, Homeflavor, HRF |
| Methyl nonanoate | 1731-84-6 | 26.025 | C10H20O2 | 1494 | 3 | RI, Nist, HRF |
| Methyl propionate | 554-12-1 | 7.671 | C4H8O2 | 909 | 4 | RI, Nist, HRF |
| Methyl 2-methylbutanoate | 868-57-5 | 10.146 | C6H12O2 | 1012 | 4 | RI, Nist, HRF |
| Methyl decanoate | 110-42-9 | 29.308 | C11H22O2 | 1597 | 4 | RI, Nist, HRF |
| Methyl octanoate | 111-11-5 | 22.661 | C9H18O2 | 1391 | 5 | RI, Homeflavor, HRF |
| Ethyl acetate | 141-78-6 | 7.291 | C4H8O2 | 890 | 6 | RI, Homeflavor, HRF |
| Methyl butanoate | 623-42-7 | 9.485 | C5H10O2 | 988 | 6 | RI, Homeflavor, HRF |
| Methyl tetradecanoate | 124-10-7 | 40.685 | C15H30O2 | 2012 | 7 | RI, Nist, HRF |
| Vinyl hexanoate | 3050-69-9 | 16.871 | C8H14O2 | 1220 | 13 | RI, Homeflavor, HRF |
| Octyl formate | 112-32-3 | 23.917 | C9H18O2 | 1424 | 13 | RI, Homeflavor, HRF |
| furans | ||||||
| 2-n-Butyl furan | 4466-24-4 | 13.642 | C8H12O | 1124 | 1 | RI, Nist, HRF |
| 2-Hexylfuran | 3777-70-6 | 20.606 | C10H16O | 1327 | 6 | RI, Nist, HRF |
| 2-n-Octylfuran | 4179-38-8 | 27.509 | C12H20O | 1540 | 20 | RI, Nist, HRF |
| 2-n-Heptylfuran | 3777-71-7 | 24.127 | C11H18O | 1433 | 12 | RI, Nist, HRF |
| 2-Pentylfuran | 3777-69-3 | 17.014 | C9H14O | 1224 | 17 | RI, Homeflavor, HRF |
| trans-2-(2-Pentenyl)furan | 70424-14-5 | 19.597 | C9H12O | 1298 | 16 | RI, Nist, HRF |
| acids | ||||||
| Octanoic acid | 124-07-2 | 41.818 | C8H16O2 | 2059 | 1 | RI, Nist, HRF |
| Pentanoic acid | 109-52-4 | 33.403 | C5H10O2 | 1739 | 6 | RI, Nist, HRF |
| Decanoic acid | 334-48-5 | 46.775 | C10H20O2 | 2272 | 17 | RI, Homeflavor, HRF |
| Hexanoic acid | 142-62-1 | 36.336 | C6H12O2 | 1846 | 18 | RI, Homeflavor, HRF |
| Heptanoic acid | 111-14-8 | 39.151 | C7H14O2 | 1952 | 18 | RI, Homeflavor, HRF |
| Propanoic acid | 79-09-4 | 27.569 | C3H6O2 | 1542 | 19 | RI, Homeflavor, HRF |
| Butanoic acid | 107-92-6 | 30.247 | C4H8O2 | 1629 | 20 | RI, Homeflavor, HRF |
| 2-Ethylhexanoic acid | 149-57-5 | 39.11 | C8H16O2 | 1949 | 15 | RI, Homeflavor, HRF |
| Benzoic acid | 65-85-0 | 50.72 | C7H6O2 | 2451 | 39 | RI, Nist, HRF |
| sulfur-containing compounds | ||||||
| Dimethyl sulfide | 75-18-3 | 5.559 | C2H6S | 752 | 2 | RI, Nist, HRF |
| Dimethyl sulfoxide | 67-68-5 | 28.535 | C2H6OS | 1571 | 2 | RI, Nist, HRF |
| Carbon disulfide | 75-15-0 | 5.428 | CS2 | 736 | 6 | RI, Homeflavor, HRF |
| 2-Acetyl-2-thiazoline | 29926-41-8 | 34.315 | C5H7NOS | 1769 | 9 | RI, Homeflavor, HRF |
| Benzothiazole | 95-16-9 | 39.7 | C7H5NS | 1972 | 9 | RI, Homeflavor, HRF |
| Dimethyl sulfone | 67-71-0 | 38.08 | C2H6O2S | 1909 | 11 | RI, Homeflavor, HRF |
| 3-Methylthiopropanal | 3268-49-3 | 25.067 | C4H8OS | 1462 | 7 | RI, Homeflavor, HRF |
| ketones | ||||||
| 2-Pentanone | 107-87-9 | 9.292 | C5H10O | 979 | 2 | RI, Nist, HRF |
| 3,5-Octadien-2-one | 38284-27-4 | 27.051 | C8H12O | 1524 | 2 | RI, Nist, HRF |
| 2-Butanone | 78-93-3 | 7.551 | C4H8O | 905 | 3 | RI, Homeflavor, HRF |
| Acetoin | 513-86-0 | 19.532 | C4H8O2 | 1295 | 3 | RI, Homeflavor, HRF |
| 3-Nonanone | 925-78-0 | 21.577 | C9H18O | 1357 | 3 | RI, Nist, HRF |
| Nerylacetone | 3879-26-3 | 36.726 | C13H22O | 1859 | 4 | RI, Homeflavor, HRF |
| 2,5-Octanedione | 3214-41-3 | 20.45 | C8H14O2 | 1324 | 5 | RI, Nist, HRF |
| 2,3-Pentanedione | 600-14-6 | 11.567 | C5H8O2 | 1059 | 6 | RI, Homeflavor, HRF |
| 2-Nonanone | 821-55-6 | 22.72 | C9H18O | 1391 | 6 | RI, Homeflavor, HRF |
| 3-Undecanone | 2216-87-7 | 28.345 | C11H22O | 1567 | 6 | RI, Homeflavor, HRF |
| 2-Heptanone | 110-43-0 | 15.582 | C7H14O | 1183 | 7 | RI, Homeflavor, HRF |
| 6-Methyl-5-hepten-2-one | 110-93-0 | 20.958 | C8H14O | 1339 | 7 | RI, Homeflavor, HRF |
| 1-Octen-3-one | 4312-99-6 | 19.744 | C8H14O | 1302 | 8 | RI, Homeflavor, HRF |
| 6-Methyl-2-heptanone | 928-68-7 | 17.46 | C8H16O | 1236 | 9 | RI, Homeflavor, HRF |
| 2-Octanone | 111-13-7 | 19.141 | C8H16O | 1284 | 9 | RI, Homeflavor, HRF |
| 4-Octanone | 589-63-9 | 17.097 | C8H16O | 1224 | 10 | RI, Nist, HRF |
| 3-Octanone | 106-68-3 | 17.984 | C8H16O | 1253 | 11 | RI, Homeflavor, HRF |
| aldehydes | ||||||
| 2-Methylbenzaldehyde | 529-20-4 | 30.424 | C8H8O | 1636 | 4 | RI, Nist, HRF |
| (2E,4E)-Nonadienal | 5910-87-2 | 32.584 | C9H14O | 1709 | 4 | RI, Homeflavor, HRF |
| (2E,4E)-Decadienal | 25152-84-5 | 35.647 | C10H16O | 1819 | 4 | RI, Homeflavor, HRF |
| Hexadecanal | 629-80-1 | 43.834 | C16H32O | 2142 | 5 | RI, Homeflavor, HRF |
| 2-Octenal | 2363-89-5 | 24.15 | C8H14O | 1434 | 6 | RI, Homeflavor, HRF |
| (2E,4E)-Heptadienal | 4313-03-5 | 26.297 | C7H10O | 1501 | 6 | RI, Homeflavor, HRF |
| (2E)-Nonenal | 18829-56-6 | 27.555 | C9H16O | 1541 | 6 | RI, Homeflavor, HRF |
| (2E)-Heptenal | 18829-55-5 | 20.629 | C7H12O | 1328 | 7 | RI, Homeflavor, HRF |
| Nonanal | 124-19-6 | 22.911 | C9H18O | 1395 | 7 | RI, Homeflavor, HRF |
| Decanal | 112-31-2 | 26.306 | C10H20O | 1501 | 7 | RI, Homeflavor, HRF |
| Benzaldehyde | 100-52-7 | 27.374 | C7H6O | 1534 | 7 | RI, Homeflavor, HRF |
| Benzeneacetaldehyde | 122-78-1 | 30.977 | C8H8O | 1654 | 7 | RI, Homeflavor, HRF |
| (2E)-Undecenal | 53448-07-0 | 34.04 | C11H20O | 1759 | 7 | RI, Homeflavor, HRF |
| Pentanal | 110-62-3 | 9.357 | C5H10O | 982 | 9 | RI, Homeflavor, HRF |
| (2E)-Decenal | 3913-81-3 | 30.846 | C10H18O | 1650 | 9 | RI, Homeflavor, HRF |
| Dodecanal | 112-54-9 | 32.741 | C12H24O | 1715 | 9 | RI, Homeflavor, HRF |
| Heptanal | 111-71-7 | 15.634 | C7H14O | 1182 | 10 | RI, Homeflavor, HRF |
| Acetaldehyde | 75-07-0 | 5.212 | C2H4O | 709 | 11 | RI, Homeflavor, HRF |
| Octanal | 124-13-0 | 19.251 | C8H16O | 1288 | 10 | RI, Homeflavor, HRF |
| Hexanal | 66-25-1 | 12.384 | C6H12O | 1084 | 14 | RI, Homeflavor, HRF |
| 2-Undecenal | 2463-77-6 | 34.327 | C11H20O | 1771 | 20 | RI, Nist, HRF |
| 4-Pentylbenzaldehyde | 6853-57-2 | 40.865 | C12H16O | 2019 | 16 | RI, Nist, HRF |
| (2E,4Z)-Decadienal | 25152-83-4 | 34.34 | C10H16O | 1771 | 17 | RI, Nist, HRF |
| 5-Ethylcyclopent-1-enecarboxaldehyde | 36431-60-4 | 23.814 | C8H12O | 1424 | 14 | RI, Nist, HRF |
| lactones | ||||||
| γ-Hexalactone | 695-06-7 | 32.725 | C6H10O2 | 1715 | 8 | RI, Homeflavor, HRF |
| γ-Octalactone | 104-50-7 | 38.574 | C8H14O2 | 1930 | 8 | RI, Homeflavor, HRF |
| γ-Nonanolactone | 104-61-0 | 41.418 | C9H16O2 | 2043 | 8 | RI, Homeflavor, HRF |
| Butyrolactone | 96-48-0 | 30.624 | C4H6O2 | 1642 | 10 | RI, Homeflavor, HRF |
| others | ||||||
| Furfural | 98-01-1 | 25.323 | C5H4O2 | 1470 | 7 | RI, Homeflavor, HRF |
| 5-Ethyl-2-furaldehyde | 23074-10-4 | 30.713 | C7H8O2 | 1645 | 0 | RI, Nist, HRF |
| Butylated Hydroxytoluene | 128-37-0 | 38.275 | C15H24O | 1917 | 8 | RI, Nist, HRF |
| 2,4-Di-tert-butylphenol | 96-76-4 | 47.638 | C14H22O | 2309 | 9 | RI, Nist, HRF |
| Camphor | 76-22-2 | 27.144 | C10H16O | 1528 | 10 | RI, Nist, HRF |
| 1,8-Cineole | 470-82-6 | 16.37 | C10H18O | 1206 | 11 | RI, Homeflavor, HRF |
| 2-phenoxyethanol | 122-99-6 | 44.005 | C8H10O2 | 2148 | 12 | RI, Homeflavor, HRF |
| 2-Methoxy-4-vinylphenol | 7786-61-0 | 45.29 | C9H10O2 | 2204 | 12 | RI, Homeflavor, HRF |
| 4-ethyl-1,2-dimethylbenzene | 934-80-5 | 21.747 | C10H14 | 1362 | 14 | RI, Nist, HRF |
| Indole | 120-72-9 | 50.997 | C8H7N | 2462 | 17 | RI, Nist, HRF |
| 2-hydroxybenzaldehyde | 90-02-8 | 32.095 | C7H6O2 | 1692 | 20 | RI, Nist, HRF |
| 2,6-Di-tert-butyl-4-hydroxy-4-methylcyclohexa-2,5-dien-1-one | 10396-80-2 | 42.772 | C15H24O2 | 2096 | 20 | RI, Nist, HRF |
| trans-Linalool oxide | 34995-77-2 | 25.392 | C10H18O2 | 1473 | 21 | RI, Nist, HRF |
| 2,6,6-Trimethyl-1-cyclohexene-1-carboxaldehyde | 432-25-7 | 30.337 | C10H16O | 1632 | 21 | RI, Nist, HRF |
| (-)-Epicedrol | 19903-73-2 | 43.728 | C15H26O | 2137 | 25 | RI, Nist, HRF |
| Benzonitrile | 100-47-0 | 29.92 | C7H5N | 1617 | 28 | RI, Nist, HRF |
| 2-Methylbenzonitrile | 529-19-1 | 38.869 | C8H7N | 1940 | 28 | RI, Nist, HRF |
| 4-(5-Methyl-2-furanyl)-2-butanone | 13679-56-6 | 32.083 | C9H12O2 | 1691 | 14 | RI, Nist, HRF |
| Formamide | 75-12-7 | 34.621 | CH3NO | 1780 | 2 | RI, Nist, HRF |
| 4-Ethylpyridine | 536-75-4 | 22.599 | C7H9N | 1386 | 1 | RI, Nist, HRF |
| Isoquinoline | 119-65-3 | 39.215 | C9H7N | 1953 | 4 | RI, Nist, HRF |
| Tributyl phosphate | 126-73-8 | 43.309 | C12H27O4P | 2121 | 7 | RI, Nist, HRF |
| N,N-Dibutylformamide | 761-65-9 | 34.483 | C9H19NO | 1776 | 19 | RI, Nist, HRF |
| N-ethylbenzenamine | 103-69-5 | 33.38 | C8H11N | 1736 | 13 | RI, Nist, HRF |
| Comparison Type | Number of Differentiating Compounds |
|---|---|
| beef vs. mutton | 38 |
| pork vs. mutton | 58 |
| pork vs. beef | 57 |
| beef vs. chicken | 61 |
| chicken vs. mutton | 61 |
| chicken vs. pork | 46 |
| duck vs. mutton | 71 |
| pork vs. duck | 41 |
| chicken vs. duck | 73 |
| beef vs. duck | 74 |
Publisher’s Note: MDPI stays neutral with regard to jurisdictional claims in published maps and institutional affiliations. |
© 2022 by the authors. Licensee MDPI, Basel, Switzerland. This article is an open access article distributed under the terms and conditions of the Creative Commons Attribution (CC BY) license (https://creativecommons.org/licenses/by/4.0/).
Share and Cite
Yang, Y.; Li, J.; Xing, J.; Xing, W.; Tang, C.; Rao, Z.; Zhang, J. Untargeted Profiling and Differentiation of Volatiles in Varieties of Meat Using GC Orbitrap MS. Foods 2022, 11, 3997. https://doi.org/10.3390/foods11243997
Yang Y, Li J, Xing J, Xing W, Tang C, Rao Z, Zhang J. Untargeted Profiling and Differentiation of Volatiles in Varieties of Meat Using GC Orbitrap MS. Foods. 2022; 11(24):3997. https://doi.org/10.3390/foods11243997
Chicago/Turabian StyleYang, Youyou, Jing Li, Jiangtao Xing, Weihai Xing, Chaohua Tang, Zhenghua Rao, and Junmin Zhang. 2022. "Untargeted Profiling and Differentiation of Volatiles in Varieties of Meat Using GC Orbitrap MS" Foods 11, no. 24: 3997. https://doi.org/10.3390/foods11243997