
Changes in Milk Fat Globules and Membrane Proteins Prepared from pH-Adjusted Bovine Raw Milk


Abstract
:1. Introduction
2. Materials and Methods
2.1. Materials
2.2. Preparation of Samples
2.3. Compositions Analysis
2.4. Particle Size Analysis
2.5. Zeta Potential
2.6. Sodium Dodecyl Sulphate Polyacrylamide Gel Electrophoresis (SDS–PAGE)
2.7. Confocal Laser Scanning Microscopy (CLSM)
2.8. Statistical Analysis
3. Results
3.1. Composition Analysis
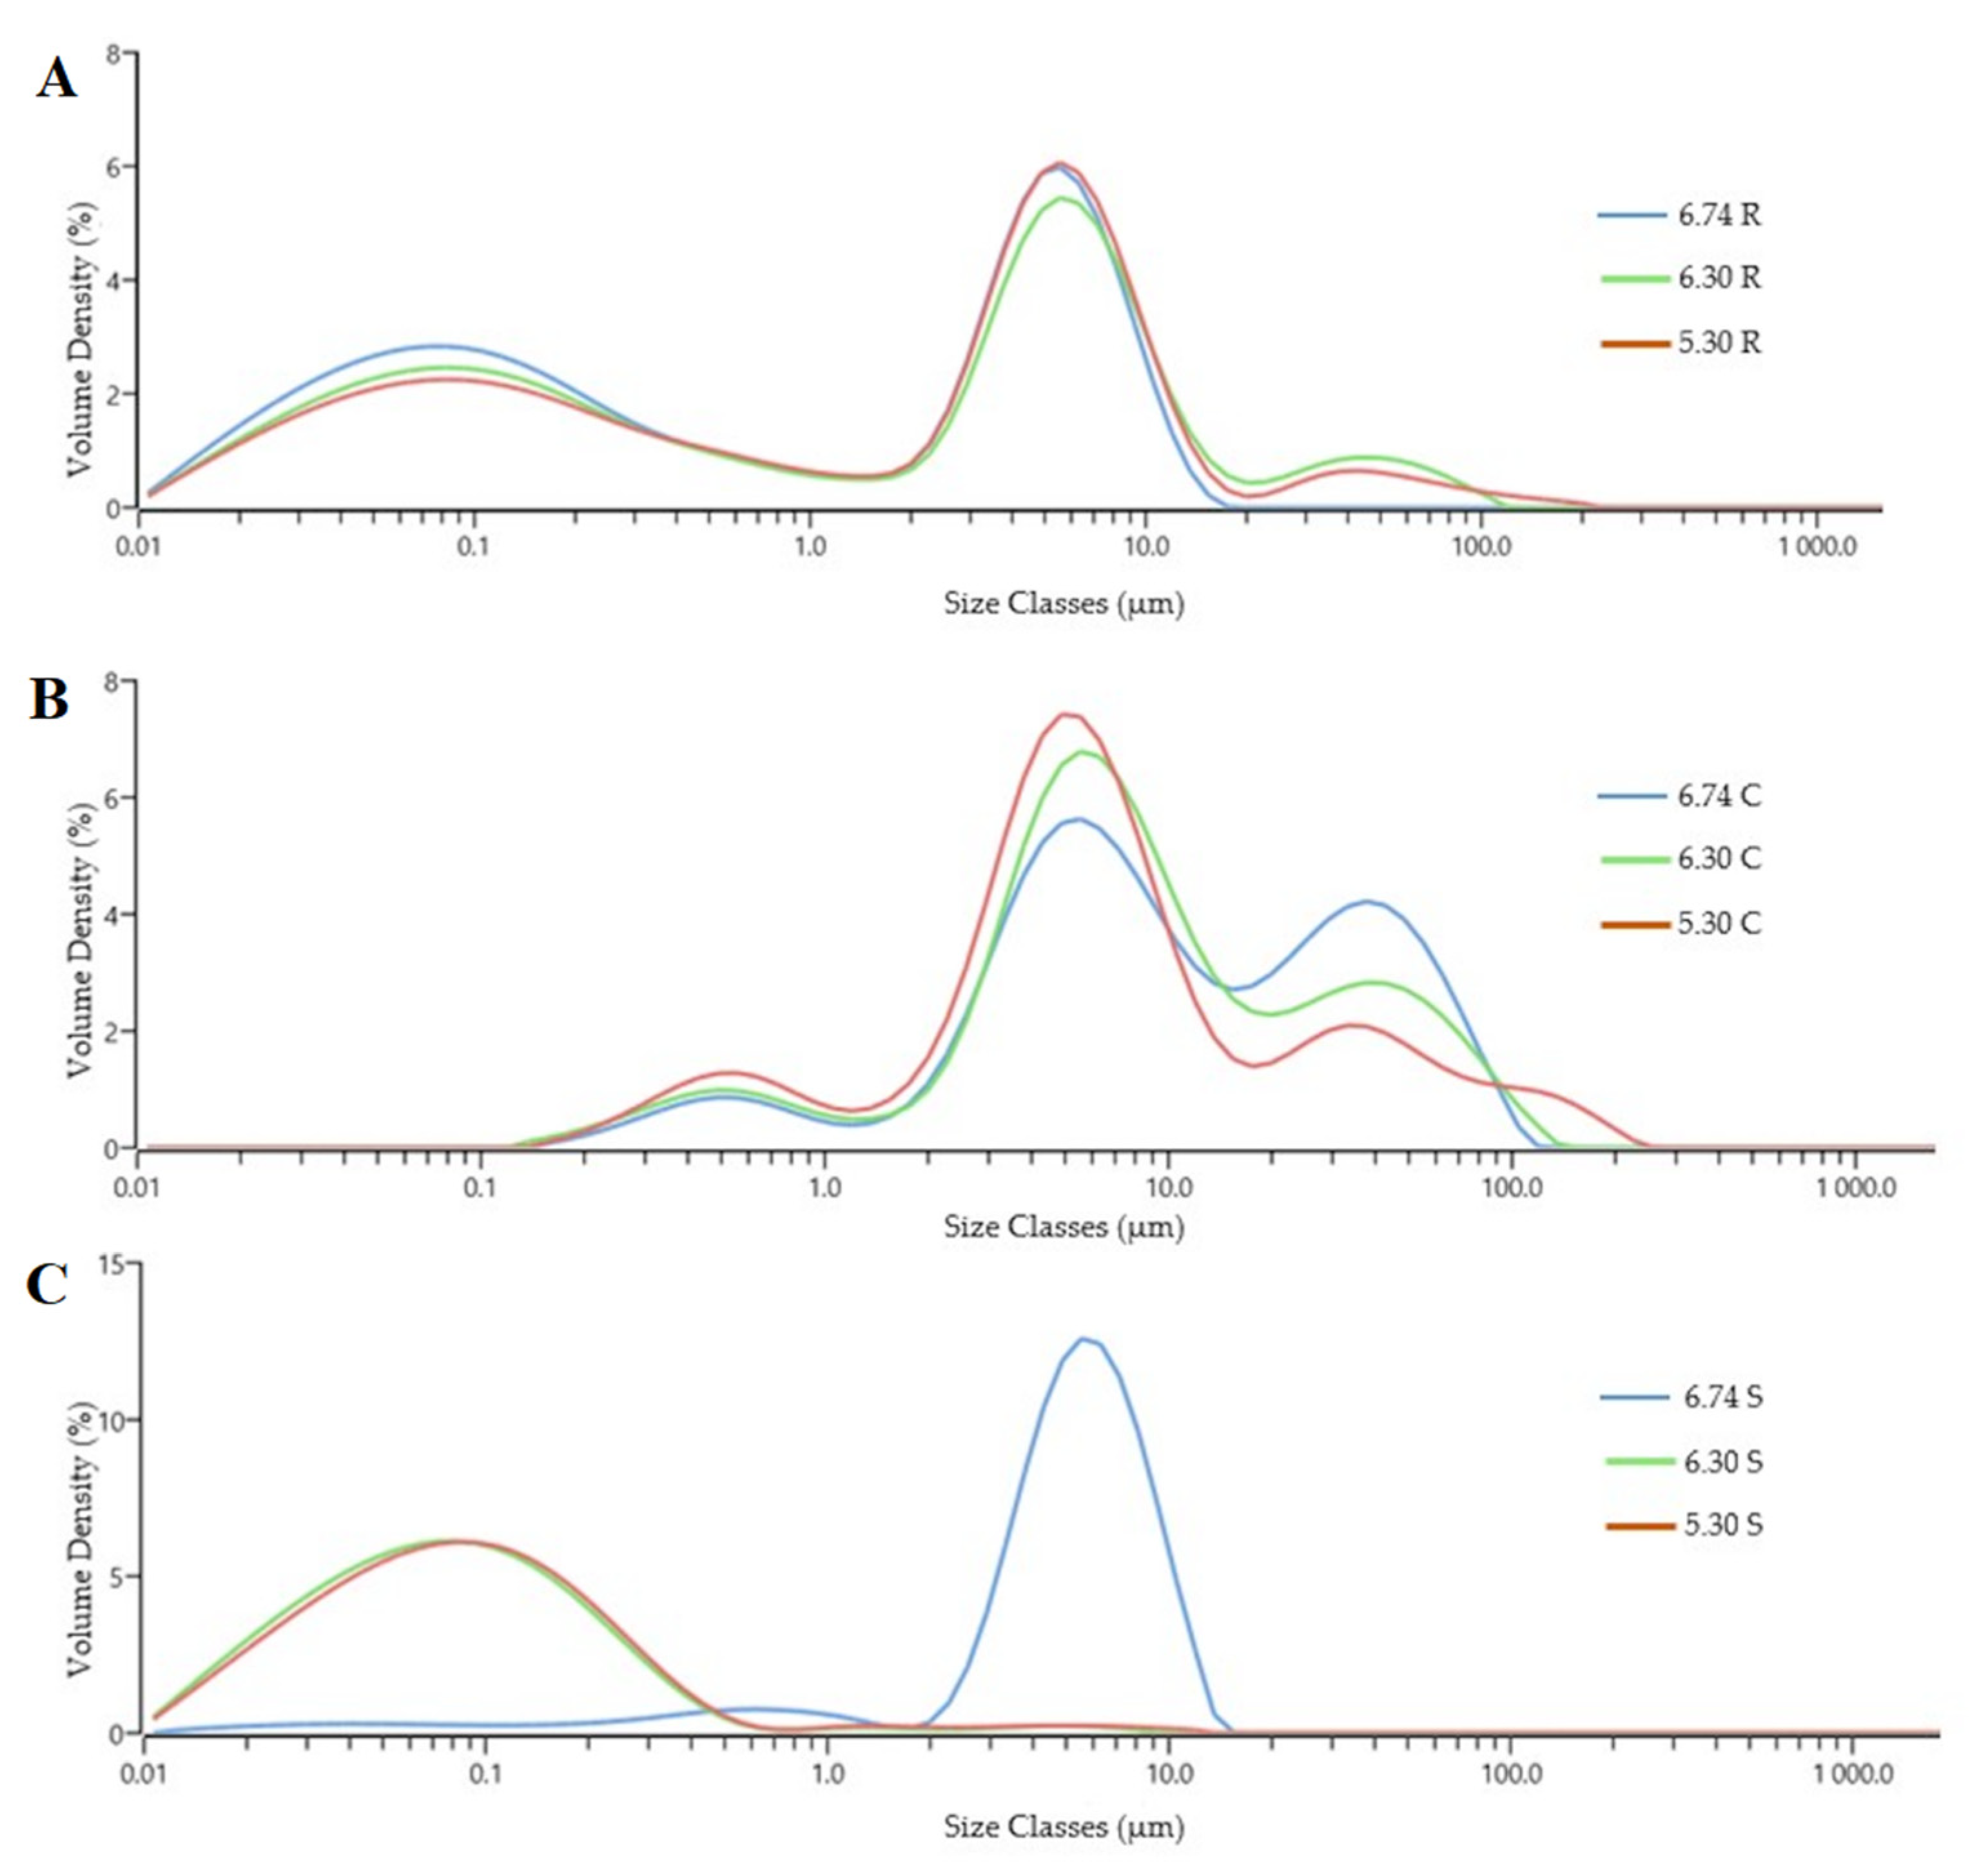
3.2. Particle Size
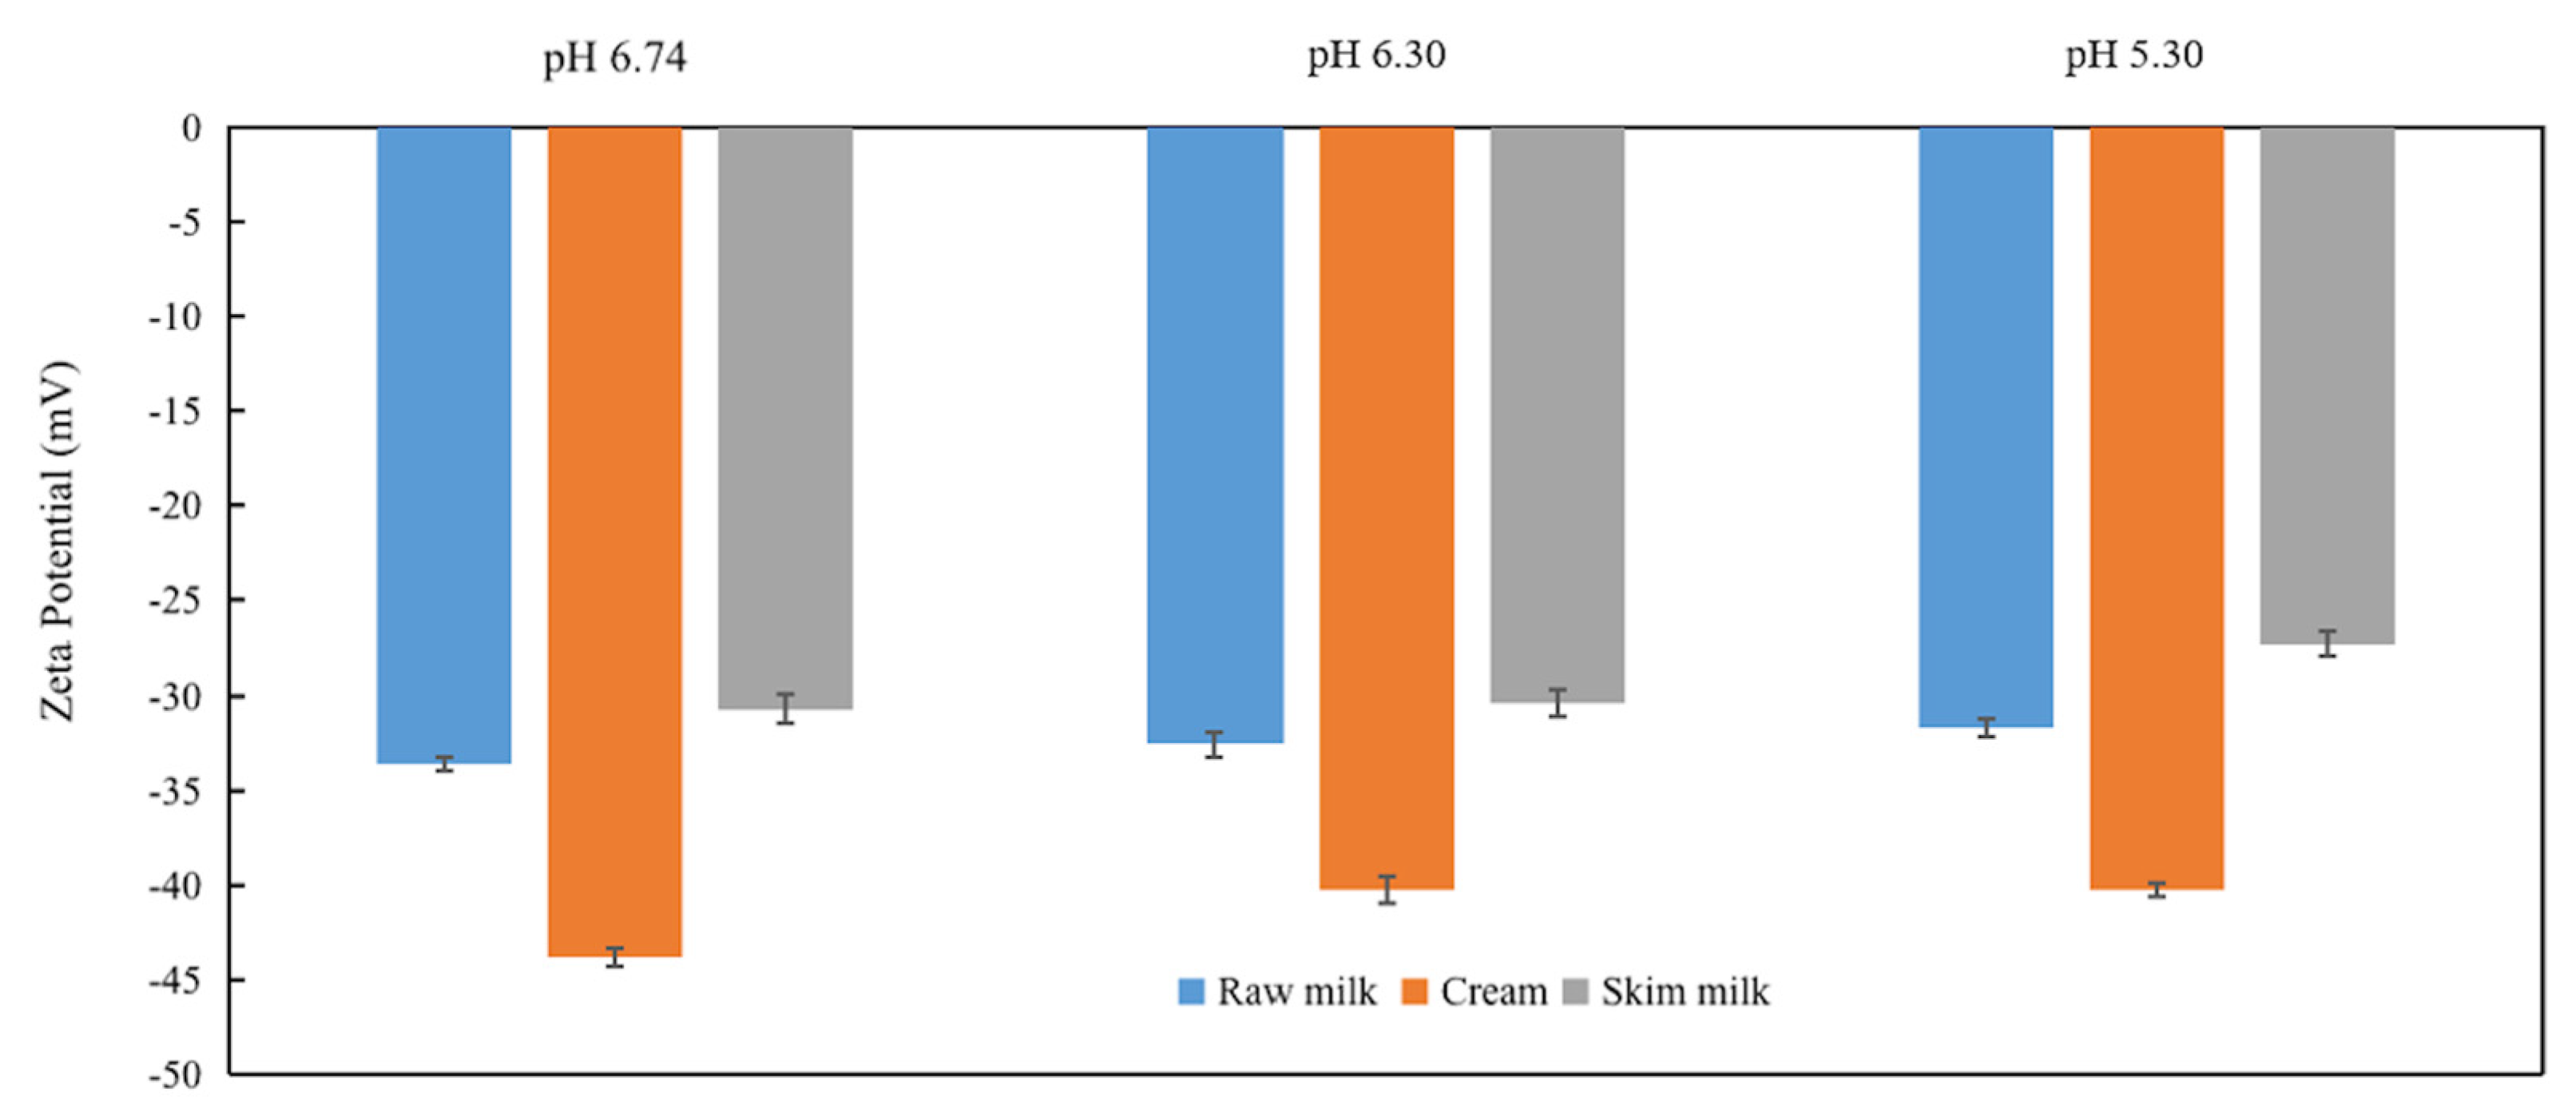
3.3. Zeta Potential
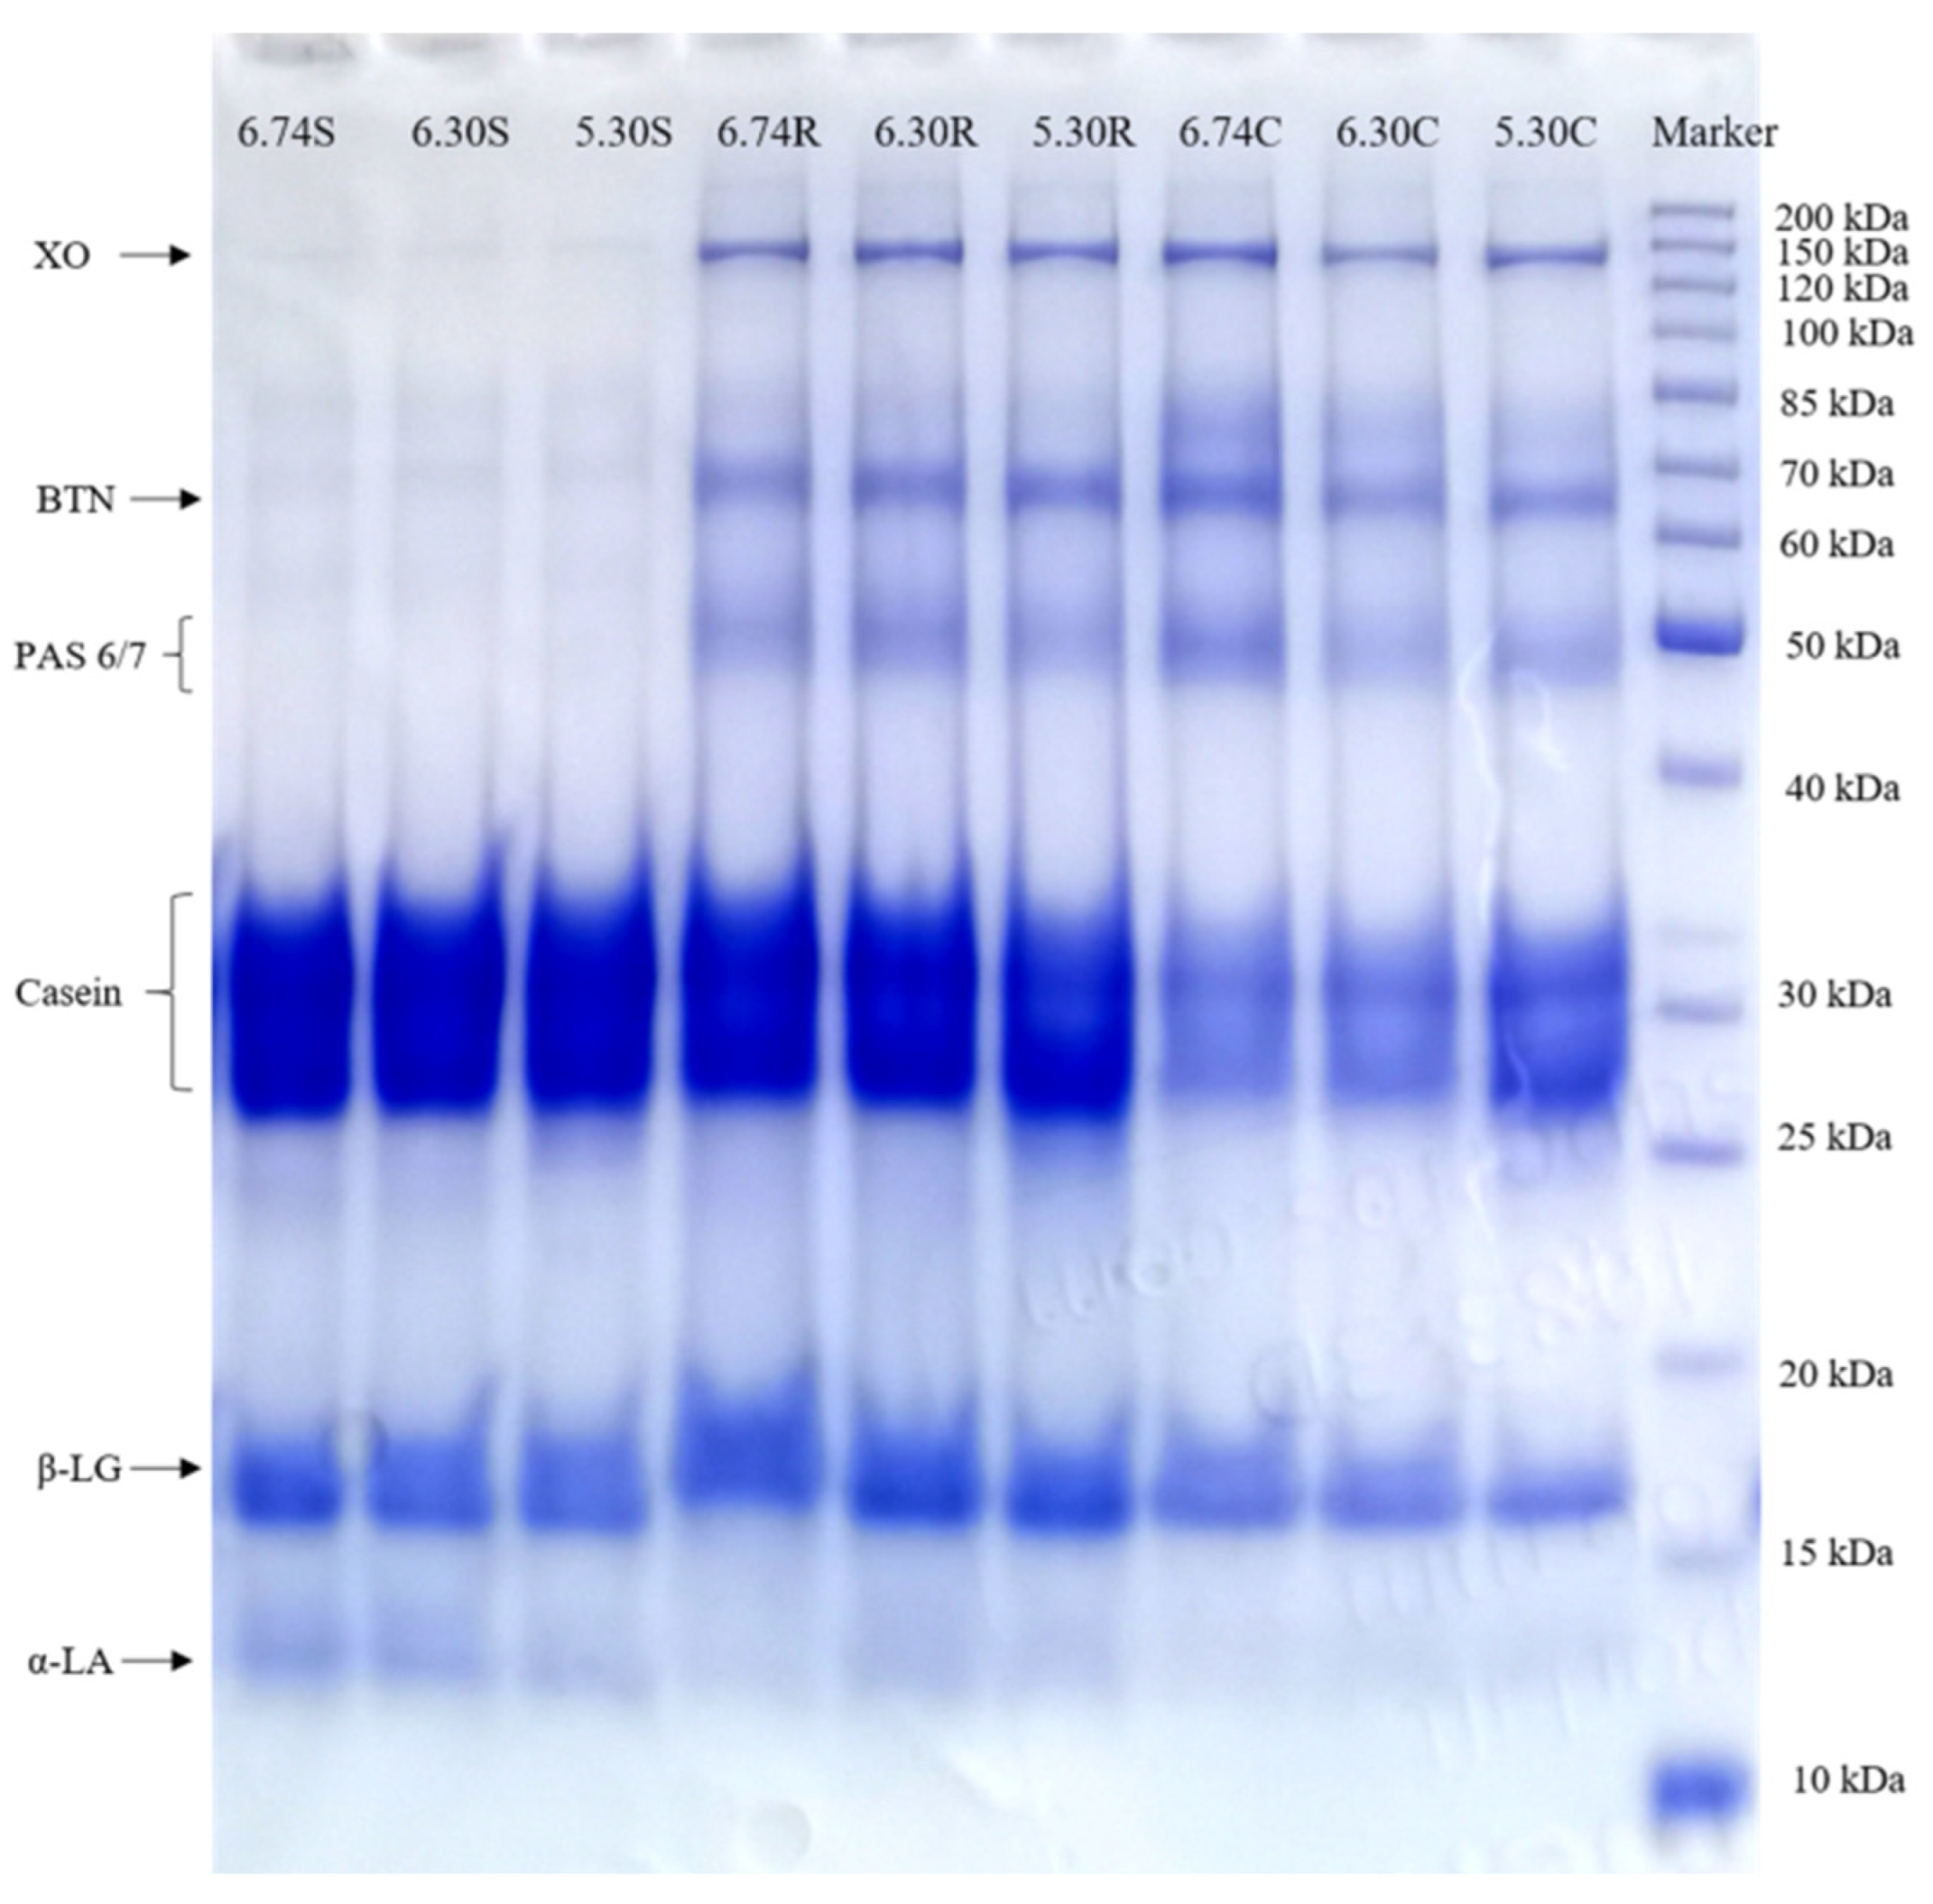
3.4. SDS-PAGE
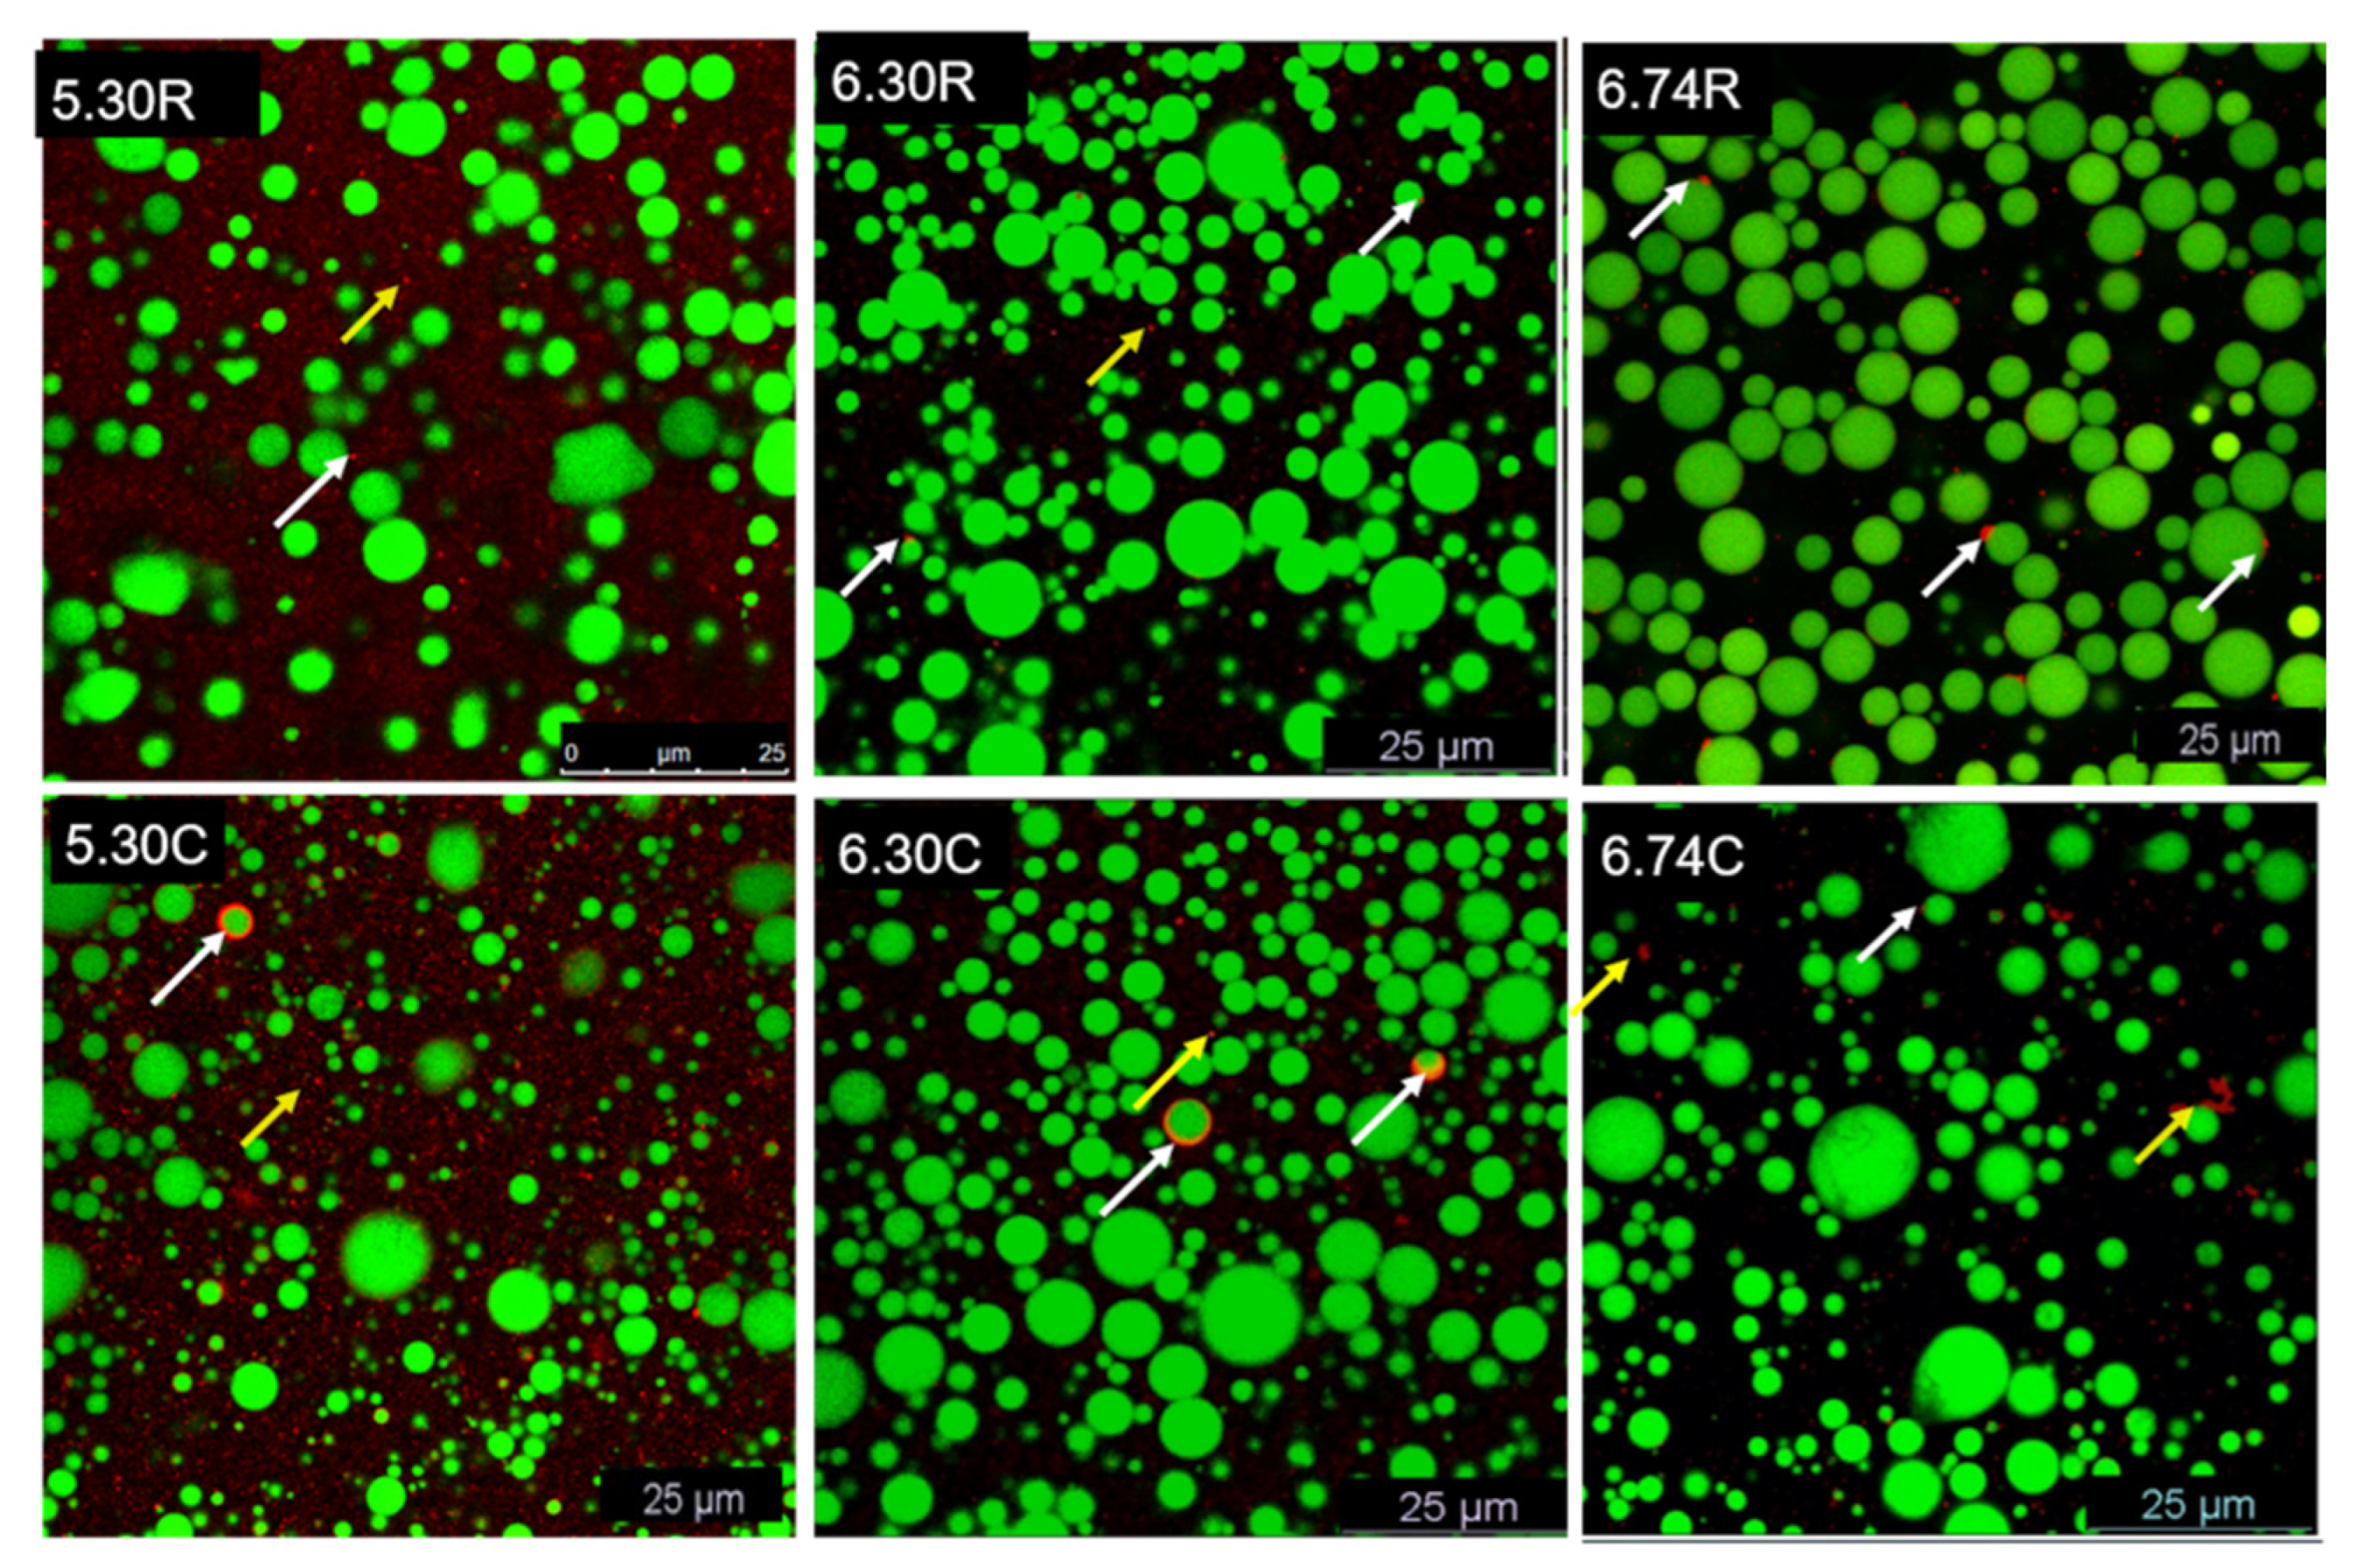
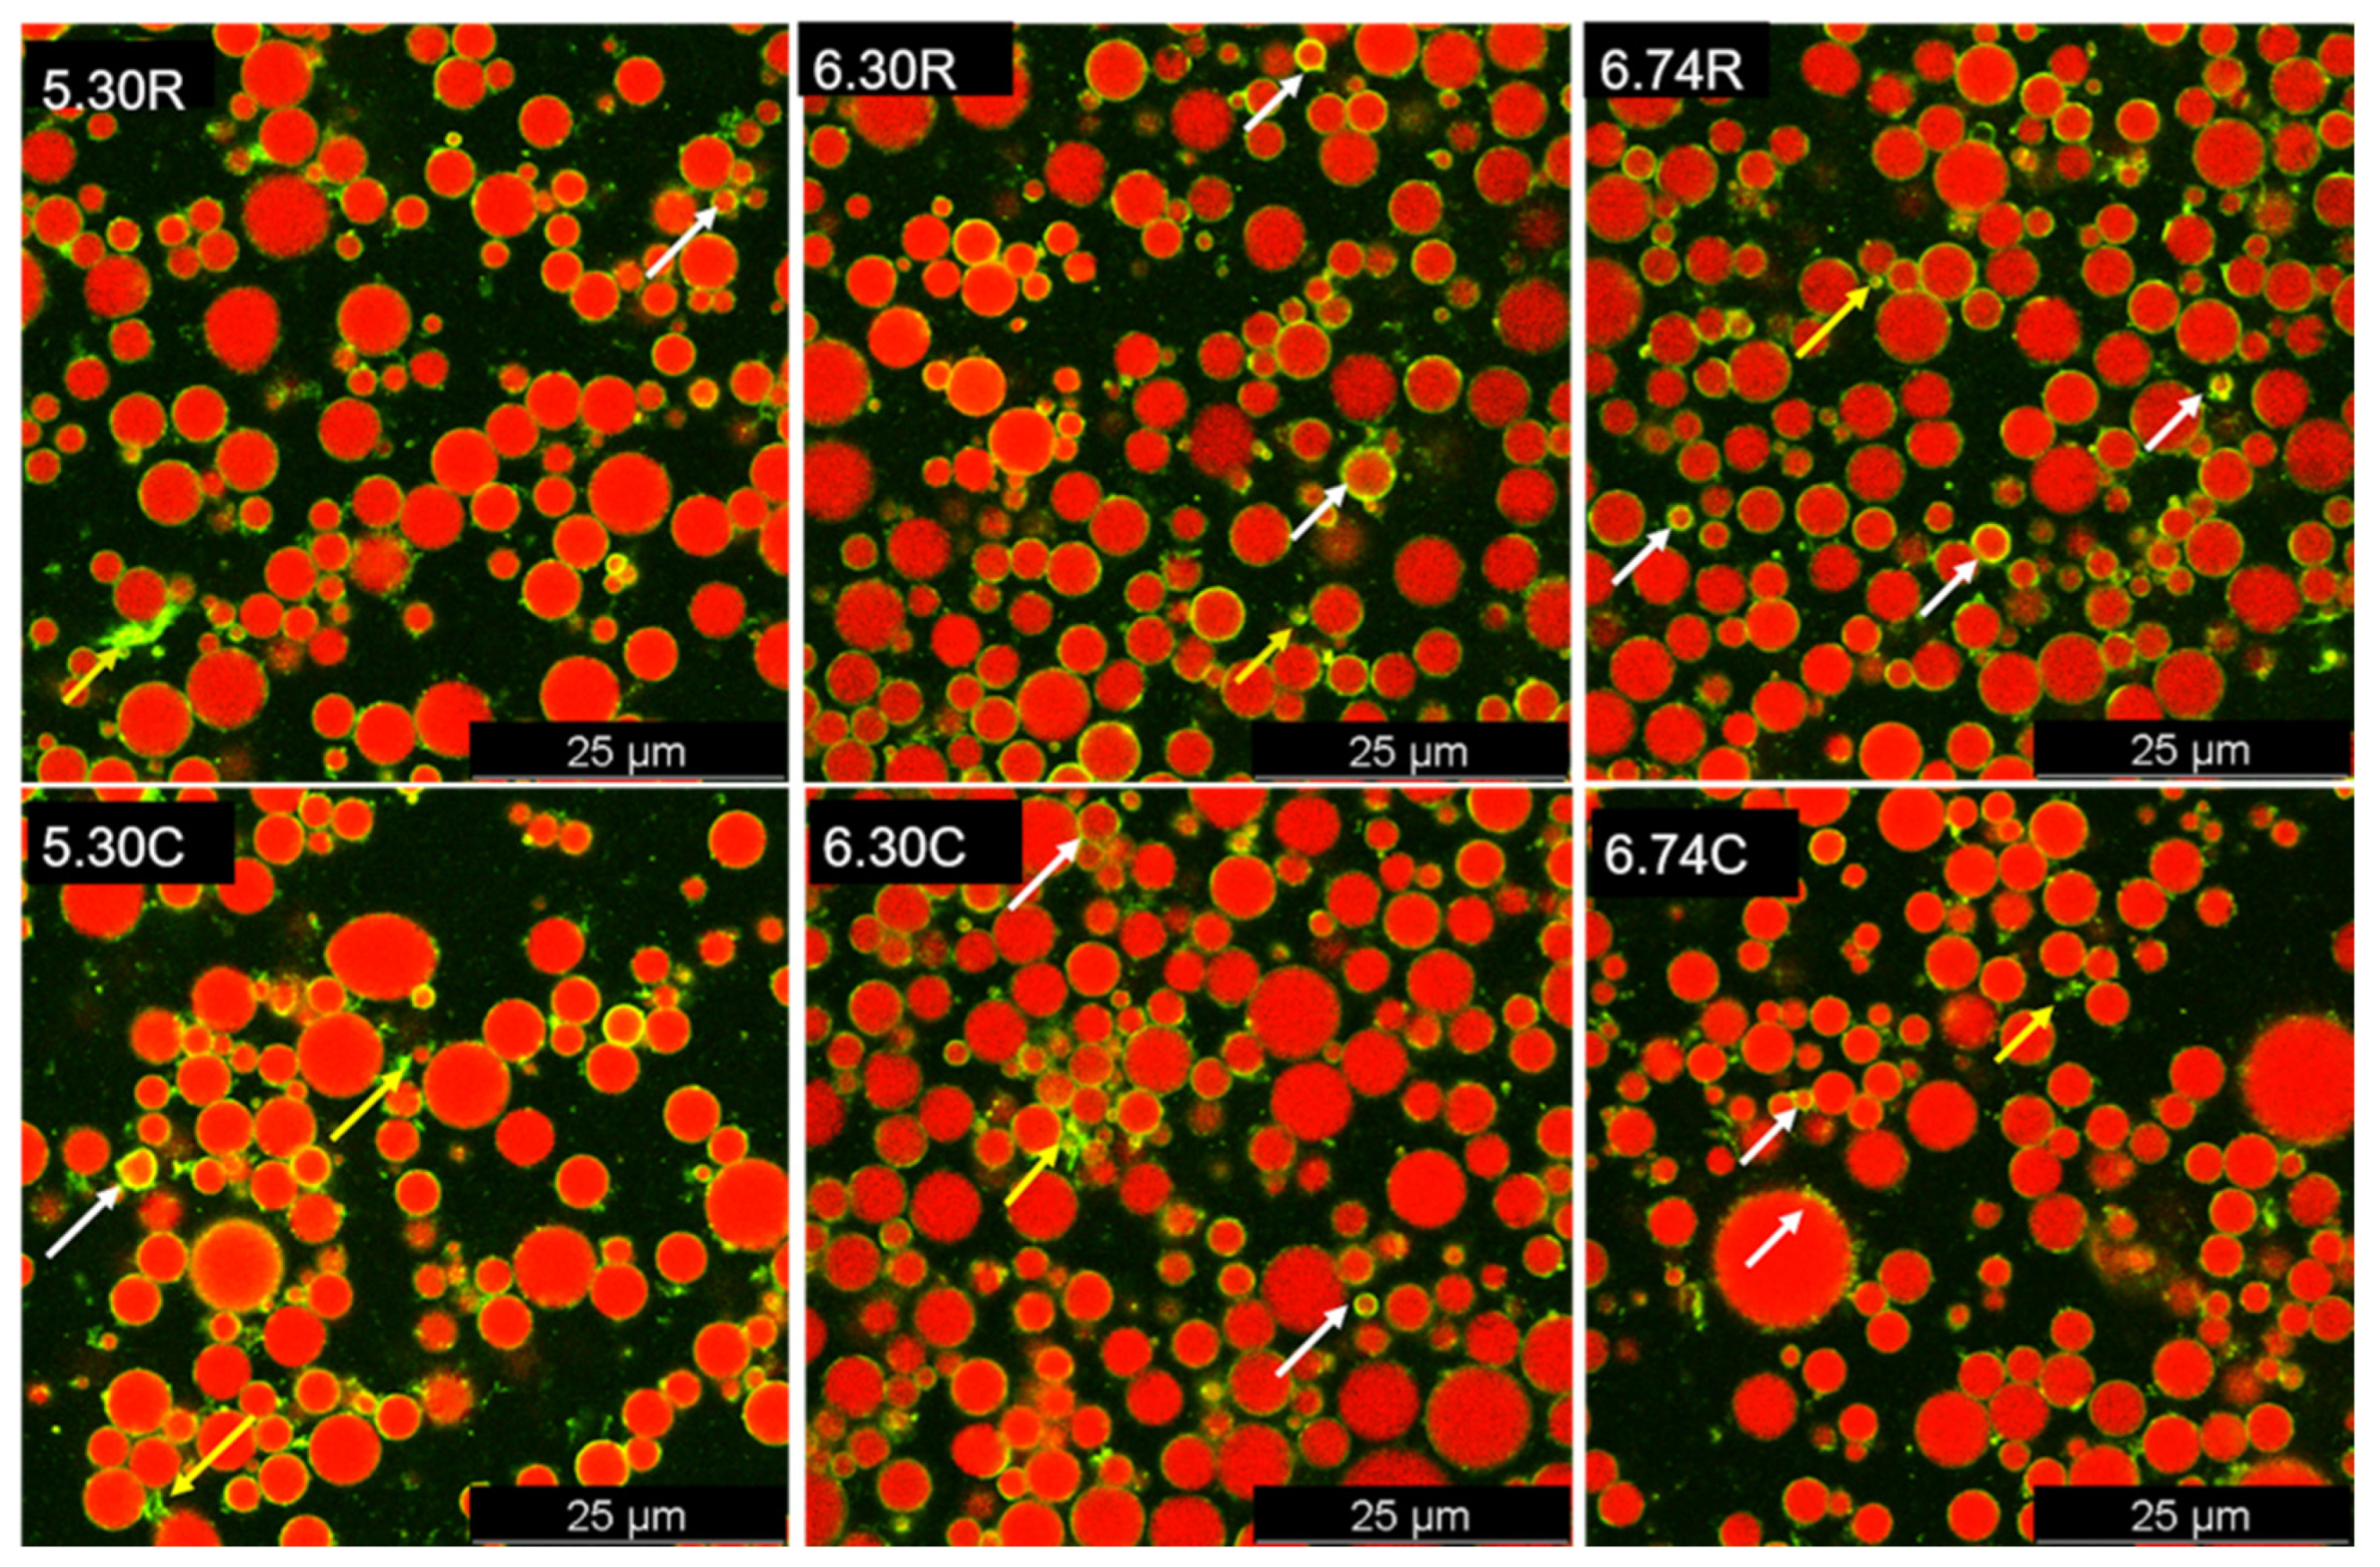
3.5. CLSM
4. Conclusions
Author Contributions
Funding
Data Availability Statement
Conflicts of Interest
References
- Liao, Y.; Alvarado, R.; Phinney, B.; Lönnerdal, B. Proteomic Characterization of Human Milk Fat Globule Membrane Proteins during a 12 Month Lactation Period. J. Proteome Res. 2011, 10, 3530–3541. [Google Scholar] [CrossRef] [PubMed]
- Singh, H.; Gallier, S. Nature’s complex emulsion: The fat globules of milk. Food Hydrocoll. 2017, 68, 81–89. [Google Scholar] [CrossRef]
- Vanderghem, C.; Bodson, P.; Danthine, S.; Paquot, M.; Deroanne, C.; Blecker, C. Milk fat globule membrane and buttermilks from composition to valorization. Biotechnol. Agron. Soc. Environ. 2010, 14, 485–500. [Google Scholar]
- Holzmüller, W.; Müller, M.; Himbert, D.; Kulozik, U. Impact of cream washing on fat globules and milk fat globule membrane proteins. Int. Dairy J. 2016, 59, 52–61. [Google Scholar] [CrossRef]
- Fong, B.Y.; Norris, C.S.; MacGibbon, A.K.H. Protein and lipid composition of bovine milk-fat-globule membrane. Int. Dairy J. 2007, 17, 275–288. [Google Scholar] [CrossRef]
- Gorewit, V.L.S.a.R.C. Isolation, Purification and Characterization of Fatty-Acid-Binding Protein from Milk. Pak. J. Nutr. 2002, 1, 43–48. [Google Scholar]
- Mana, P.; Goodyear, M.; Bernard, C.; Tomioka, R.; Freire-Garabal, M.; Linares, D. Tolerance induction by molecular mimicry: Prevention and suppression of experimental autoimmune encephalomyelitis with the milk protein butyrophilin. Int. Immunol. 2004, 16, 489–499. [Google Scholar] [CrossRef] [Green Version]
- Timby, N.; Hernell, O.; Vaarala, O.; Melin, M.; Lonnerdal, B.; Domellof, M. Infections in infants fed formula supplemented with bovine milk fat globule membranes. J. Pediatr. Gastroenterol. Nutr. 2015, 60, 384–389. [Google Scholar] [CrossRef]
- Lopez, C.; Cauty, C.; Rousseau, F.; Blot, M.; Margolis, A.; Famelart, M.H. Lipid droplets coated with milk fat globule membrane fragments: Microstructure and functional properties as a function of pH. Food Res. Int. 2017, 91, 26–37. [Google Scholar] [CrossRef]
- Peterson, J.A.; Patton, S.; Hamosh, M. Glycoproteins of the human milk fat globule in the protection of the breast-fed infant against infections. Neonatology 1998, 74, 143–162. [Google Scholar] [CrossRef]
- Ross, S. Targeting the Glycome of the Milk Fat Globule Membrane for Anti-Infective Properties. Doctoral Thesis, National University of Ireland, Galway, Ireland, October 2016. [Google Scholar]
- Spitsberg, V.L. Invited Review: Bovine Milk Fat Globule Membrane as a Potential Nutraceutical. J. Dairy Sci. 2005, 88, 2289–2294. [Google Scholar] [CrossRef] [PubMed]
- Holzmüller, W.; Kulozik, U. Technical difficulties and future challenges in isolating membrane material from milk fat globules in industrial settings—A critical review. Int. Dairy J. 2016, 61, 51–66. [Google Scholar] [CrossRef]
- Murthy, A.V.R.; Guyomarc’h, F.; Lopez, C. The temperature-dependent physical state of polar lipids and their miscibility impact the topography and mechanical properties of bilayer models of the milk fat globule membrane. Biochim. Biophys. Acta. Biomembr. 2016, 1858, 2181–2190. [Google Scholar] [CrossRef] [PubMed]
- Lopez, C.; Blot, M.; Briard-Bion, V.; Cirie, C.; Graulet, B. Butter serums and buttermilks as sources of bioactive lipids from the milk fat globule membrane: Differences in their lipid composition and potentialities of cow diet to increase n-3 PUFA. Food Res. Int. 2017, 100, 864–872. [Google Scholar] [CrossRef] [PubMed]
- Holzmüller, W.; Gmach, O.; Griebel, A.; Kulozik, U. Casein precipitation by acid and rennet coagulation of buttermilk: Impact of pH and temperature on the isolation of milk fat globule membrane proteins. Int. Dairy J. 2016, 63, 115–123. [Google Scholar] [CrossRef]
- Gassi, J.Y.; Blot, M.; Beaucher, E.; Robert, B.; Leconte, N.; Camier, B.; Rousseau, F.; Bourlieu, C.; Jardin, J.; Briard-Bion, V. Preparation and characterisation of a milk polar lipids enriched ingredient from fresh industrial liquid butter serum: Combination of physico-chemical modifications and technological treatments. Int. Dairy J. 2016, 52, 26–34. [Google Scholar] [CrossRef]
- De Kruif, C. Casein micelle interactions. Int. Dairy J. 1999, 9, 183–188. [Google Scholar] [CrossRef]
- Sharma, P.; Oey, I.; Everett, D.W. Interfacial properties and transmission electron microscopy revealing damage to the milk fat globule system after pulsed electric field treatment. Food Hydrocoll. 2015, 47, 99–107. [Google Scholar] [CrossRef]
- Jukkola, A.; Partanen, R.; Rojas, O.J.; Heino, A. Separation of milk fat globules via microfiltration: Effect of diafiltration media and opportunities for stream valorization. J. Dairy Sci. 2016, 99, 8644–8654. [Google Scholar] [CrossRef] [Green Version]
- ISO 8968-1: 2001; Milk–Determination of Nitrogen Content–Part 1: Kjeldahl Method. ISO: Geneva, Switzerland, 2001.
- Michalski, M.-C.; Briard, V.; Michel, F. Optical parameters of milk fat globules for laser light scattering measurements. Lait 2001, 81, 787–796. [Google Scholar] [CrossRef] [Green Version]
- Mercan, E.; Sert, D.; Akın, N. Effect of high-pressure homogenisation on viscosity, particle size and microbiological characteristics of skim and whole milk concentrates. Int. Dairy J. 2018, 87, 93–99. [Google Scholar] [CrossRef]
- Van Oss, C.J. Forces Interfaciales en Milieux Aqueux; Masson: Issy Les Moulineaux, France, 1996. [Google Scholar]
- Ye, A.; Singh, H.; Taylor, M.W.; Anema, S. Interactions of whey proteins with milk fat globule membrane proteins during heat treatment of whole milk. Lait 2004, 84, 269–283. [Google Scholar] [CrossRef]
- Jukkola, A.; Partanen, R.; Rojas, O.J.; Heino, A. 4-2(CLSM)Effect of heat treatment and pH on the efficiency of micro-diafiltration for the separation of native fat globules from cream in butter production. J. Membr. Sci. 2018, 548, 99–107. [Google Scholar] [CrossRef]
- Lopez, C.; Madec, M.-N.; Jimenez-Flores, R. Lipid rafts in the bovine milk fat globule membrane revealed by the lateral segregation of phospholipids and heterogeneous distribution of glycoproteins. Food Chem. 2010, 120, 22–33. [Google Scholar] [CrossRef] [Green Version]
- Smoczyński, M. Role of phospholipid flux during milk secretion in the mammary gland. J. Mammary Gland Biol. Neoplasia 2017, 22, 117–129. [Google Scholar] [CrossRef] [Green Version]
- Wong, D.W.; Camirand, W.M.; Pavlath, A.E.; Parris, N.; Friedman, M. Structures and functionalities of milk proteins. Crit. Rev. Food Sci. Nutr. 1996, 36, 807–844. [Google Scholar] [CrossRef]
- Evers, J.M. The milkfat globule membrane—Compositional and structural changes post secretion by the mammary secretory cell. Int. Dairy J. 2004, 14, 661–674. [Google Scholar] [CrossRef]
- Zheng, H.; Jimenez-Flores, R.; Everett, D.W. Bovine milk fat globule membrane proteins are affected by centrifugal washing processes. J. Agric. Food Chem. 2013, 61, 8403–8411. [Google Scholar] [CrossRef]
- Michalski, M.-C.; Cariou, R.; Michel, F.; Garnier, C. Native vs. damaged milk fat globules: Membrane properties affect the viscoelasticity of milk gels. J. Dairy Sci. 2002, 85, 2451–2461. [Google Scholar] [CrossRef] [Green Version]
- Michalski, M.-C.; Michel, F.; Sainmont, D.; Briard, V. Apparent ζ-potential as a tool to assess mechanical damages to the milk fat globule membrane. Colloids Surf. B Biointerfaces 2002, 23, 23–30. [Google Scholar] [CrossRef]
- Gülseren, İ.; Alexander, M.; Corredig, M. Probing the colloidal properties of skim milk using acoustic and electroacoustic spectroscopy. Effect of concentration, heating and acidification. J. Colloid Interface Sci. 2010, 351, 493–500. [Google Scholar] [CrossRef] [PubMed]
- Kühnl, W.; Piry, A.; Kaufmann, V.; Grein, T.; Ripperger, S.; Kulozik, U. Impact of colloidal interactions on the flux in cross-flow microfiltration of milk at different pH values: A surface energy approach. J. Membr. Sci. 2010, 352, 107–115. [Google Scholar] [CrossRef]
- Anderson, M.; Cawston, T. The milk-fat globule membrane. J. Dairy Res. 1975, 42, 459–483. [Google Scholar] [CrossRef]
- Sejersen, M.T.; Salomonsen, T.; Ipsen, R.; Clark, R.; Rolin, C.; Engelsen, S.B. Zeta potential of pectin-stabilised casein aggregates in acidified milk drinks. Int. Dairy J. 2007, 17, 302–307. [Google Scholar] [CrossRef]
- Tuinier, R.; De Kruif, C. Stability of casein micelles in milk. Chem. Phys. 2002, 117, 1290–1295. [Google Scholar] [CrossRef] [Green Version]
- Roy, M.T.; Gallardo, M.; Estelrich, J. Influence of size on electrokinetic behavior of phosphatidylserine and phosphatidylethanolamine lipid vesicles. J. Colloid Interface Sci. 1998, 206, 512–517. [Google Scholar] [CrossRef]
- Dewettinck, K.; Rombaut, R.; Thienpont, N.; Le, T.T.; Messens, K.; Van Camp, J. Nutritional and technological aspects of milk fat globule membrane material. Int. Dairy J. 2008, 18, 436–457. [Google Scholar] [CrossRef]
- Jiménez-Flores, R.; Brisson, G. The milk fat globule membrane as an ingredient: Why, how, when? Dairy Sci. Technol. 2008, 88, 5–18. [Google Scholar] [CrossRef] [Green Version]
- Singh, H. The milk fat globule membrane—A biophysical system for food applications. Curr. Opin. Colloid Interface Sci. 2006, 11, 154–163. [Google Scholar] [CrossRef]
- Smoczyński, M.; Staniewski, B.; Kiełczewska, K. Composition and Structure of the Bovine Milk Fat Globule Membrane—Some Nutritional and Technological Implications. Food Reviews Int. 2012, 28, 188–202. [Google Scholar] [CrossRef]
- Dalgleish, D.G.; Corredig, M. The structure of the casein micelle of milk and its changes during processing. Annu. Rev. Food Sci. Technol. 2012, 3, 449–467. [Google Scholar] [CrossRef] [PubMed]
- Yamauchi, K.; Shimizu, M.; Kanno, C. Effect of preparation on properties of a soluble glycoprotein fraction of milk fat globule membrane. J. Dairy Sci. 1978, 61, 688–696. [Google Scholar] [CrossRef]
- Le, T.T.; Van Camp, J.; Rombaut, R.; van Leeckwyck, F.; Dewettinck, K. Effect of washing conditions on the recovery of milk fat globule membrane proteins during the isolation of milk fat globule membrane from milk. J. Dairy Sci. 2009, 92, 3592–3603. [Google Scholar] [CrossRef] [PubMed] [Green Version]
- Waninge, R.; Nylander, T.; Paulsson, M.; Bergenståhl, B. Milk membrane lipid vesicle structures studied with Cryo-TEM. Colloids Surf. B: Biointerfaces 2003, 31, 257–264. [Google Scholar] [CrossRef]
- Nguyen, H.T.H.; Ong, L.; Beaucher, E.; Madec, M.-N.; Kentish, S.E.; Gras, S.L.; Lopez, C. Buffalo milk fat globules and their biological membrane: In situ structural investigations. Food Res. Int. 2015, 67, 35–43. [Google Scholar] [CrossRef]


| Samples | Fat (g/100 g) | Protein (g/100 g) | SNF (Solid Non-Fat; g/100 g) |
|---|---|---|---|
| 6.74 R | 4.85 ± 0.04 a | 3.55 ± 0.00 a | 12.36 ± 0.10 a |
| 6.30 R | 4.83 ± 0.02 a | 3.66 ± 0.04 a | 12.33 ± 0.12 a |
| 5.30 R | 4.90 ± 0.01 a | 3.63 ± 0.00 a | 12.23 ± 0.01 a |
| 6.74 S | 0.14 ± 0.00 b | 3.74 ± 0.03 b | 12.79 ± 0.06 a |
| 6.30 S | 0.23 ± 0.02 a | 3.76 ± 0.05 b | 12.84 ± 0.07 a |
| 5.30 S | 0.27 ± 0.01 a | 3.82 ± 0.01 a | 12.76 ± 0.02 a |
| 6.74 C | 40.50 ± 0.80 a | 1.50 ± 0.01 c | 0.40 ± 0.01 a |
| 6.30 C | 40.40 ± 1.02 b | 2.01 ± 0.02 a | 0.49 ± 0.02 a |
| 5.30 C | 39.90 ± 1.01 b | 1.76 ± 0.03 b | 0.43 ± 0.01 a |
| Samples | Dv(10) (μm) | Dv(50) (μm) | Dv(90) (μm) | Specific Surface Area (cm2/g) | Span | Uniformity |
|---|---|---|---|---|---|---|
| 6.74 R | 0.03 ± 0.00 e | 0.65 ± 0.21 f | 7.65 ± 0.06 e | 65.41 ± 1.06 c | 5.51 ± 0.81 d | 2.14 ± 0.23 b |
| 6.30 R | 0.04 ± 0.00 e | 2.52 ± 0.19 e | 12.37 ± 2.13 d | 56.96 ± 2.03 d | 6.41 ± 0.55 c | 2.49 ± 0.11 b |
| 5.30 R | 0.04 ± 0.00 e | 2.96 ± 0.20 e | 10.53 ± 0.07 c | 47.68 ± 4.11 e | 8.05 ± 0.29 b | 4.41 ± 0.30 a |
| 6.74 C | 2.16 ± 0.00 a | 8.93 ± 0.11 a | 51.42 ± 0.73 a | 1.69 ± 0.13 h | 3.62 ± 0.31 d | 1.67 ± 0.01 d |
| 6.30 C | 1.57 ± 0.02 b | 7.28 ± 0.10 b | 48.21 ± 2.10 b | 2.04 ± 0.05 g | 4.88 ± 0.20 e | 1.78 ± 0.09 d |
| 5.30 C | 0.97 ± 0.04 c | 5.86 ± 0.26 c | 48.14 ± 8.50 b | 2.28 ± 0.02 g | 12.65 ± 0.41 a | 2.43 ± 0.25 b |
| 6.74 S | 0.02 ± 0.00 e | 0.07 ± 0.01 g | 0.25 ± 0.01 f | 110.10 ± 2.35 a | 3.06 ± 0.06 f | 1.97 ± 0.24 c |
| 6.30 S | 0.02 ± 0.00 e | 0.08 ± 0.02 g | 0.28 ± 0.00 f | 103.62 ± 10.24 b | 3.15 ± 0.13 f | 2.57 ± 0.07 b |
| 5.30 S | 0.81 ± 0.02 d | 5.29 ± 0.52 d | 9.18 ± 0.24 c | 8.32 ± 0.21 f | 1.59 ± 0.08 g | 0.43 ± 0.00 e |
Publisher’s Note: MDPI stays neutral with regard to jurisdictional claims in published maps and institutional affiliations. |
© 2022 by the authors. Licensee MDPI, Basel, Switzerland. This article is an open access article distributed under the terms and conditions of the Creative Commons Attribution (CC BY) license (https://creativecommons.org/licenses/by/4.0/).
Share and Cite
Sun, Y.; Roos, Y.H.; Miao, S. Changes in Milk Fat Globules and Membrane Proteins Prepared from pH-Adjusted Bovine Raw Milk. Foods 2022, 11, 4107. https://doi.org/10.3390/foods11244107
Sun Y, Roos YH, Miao S. Changes in Milk Fat Globules and Membrane Proteins Prepared from pH-Adjusted Bovine Raw Milk. Foods. 2022; 11(24):4107. https://doi.org/10.3390/foods11244107
Chicago/Turabian StyleSun, Yanjun, Yrjö H. Roos, and Song Miao. 2022. "Changes in Milk Fat Globules and Membrane Proteins Prepared from pH-Adjusted Bovine Raw Milk" Foods 11, no. 24: 4107. https://doi.org/10.3390/foods11244107