
Encapsulation of Pomegranate Peel Extract (Punica granatum L.) by Double Emulsions: Effect of the Encapsulation Method and Oil Phase

 ,
,  and
and
Abstract
:
1. Introduction
2. Materials and Methods
2.1. Materials
2.2. Sample Preparation
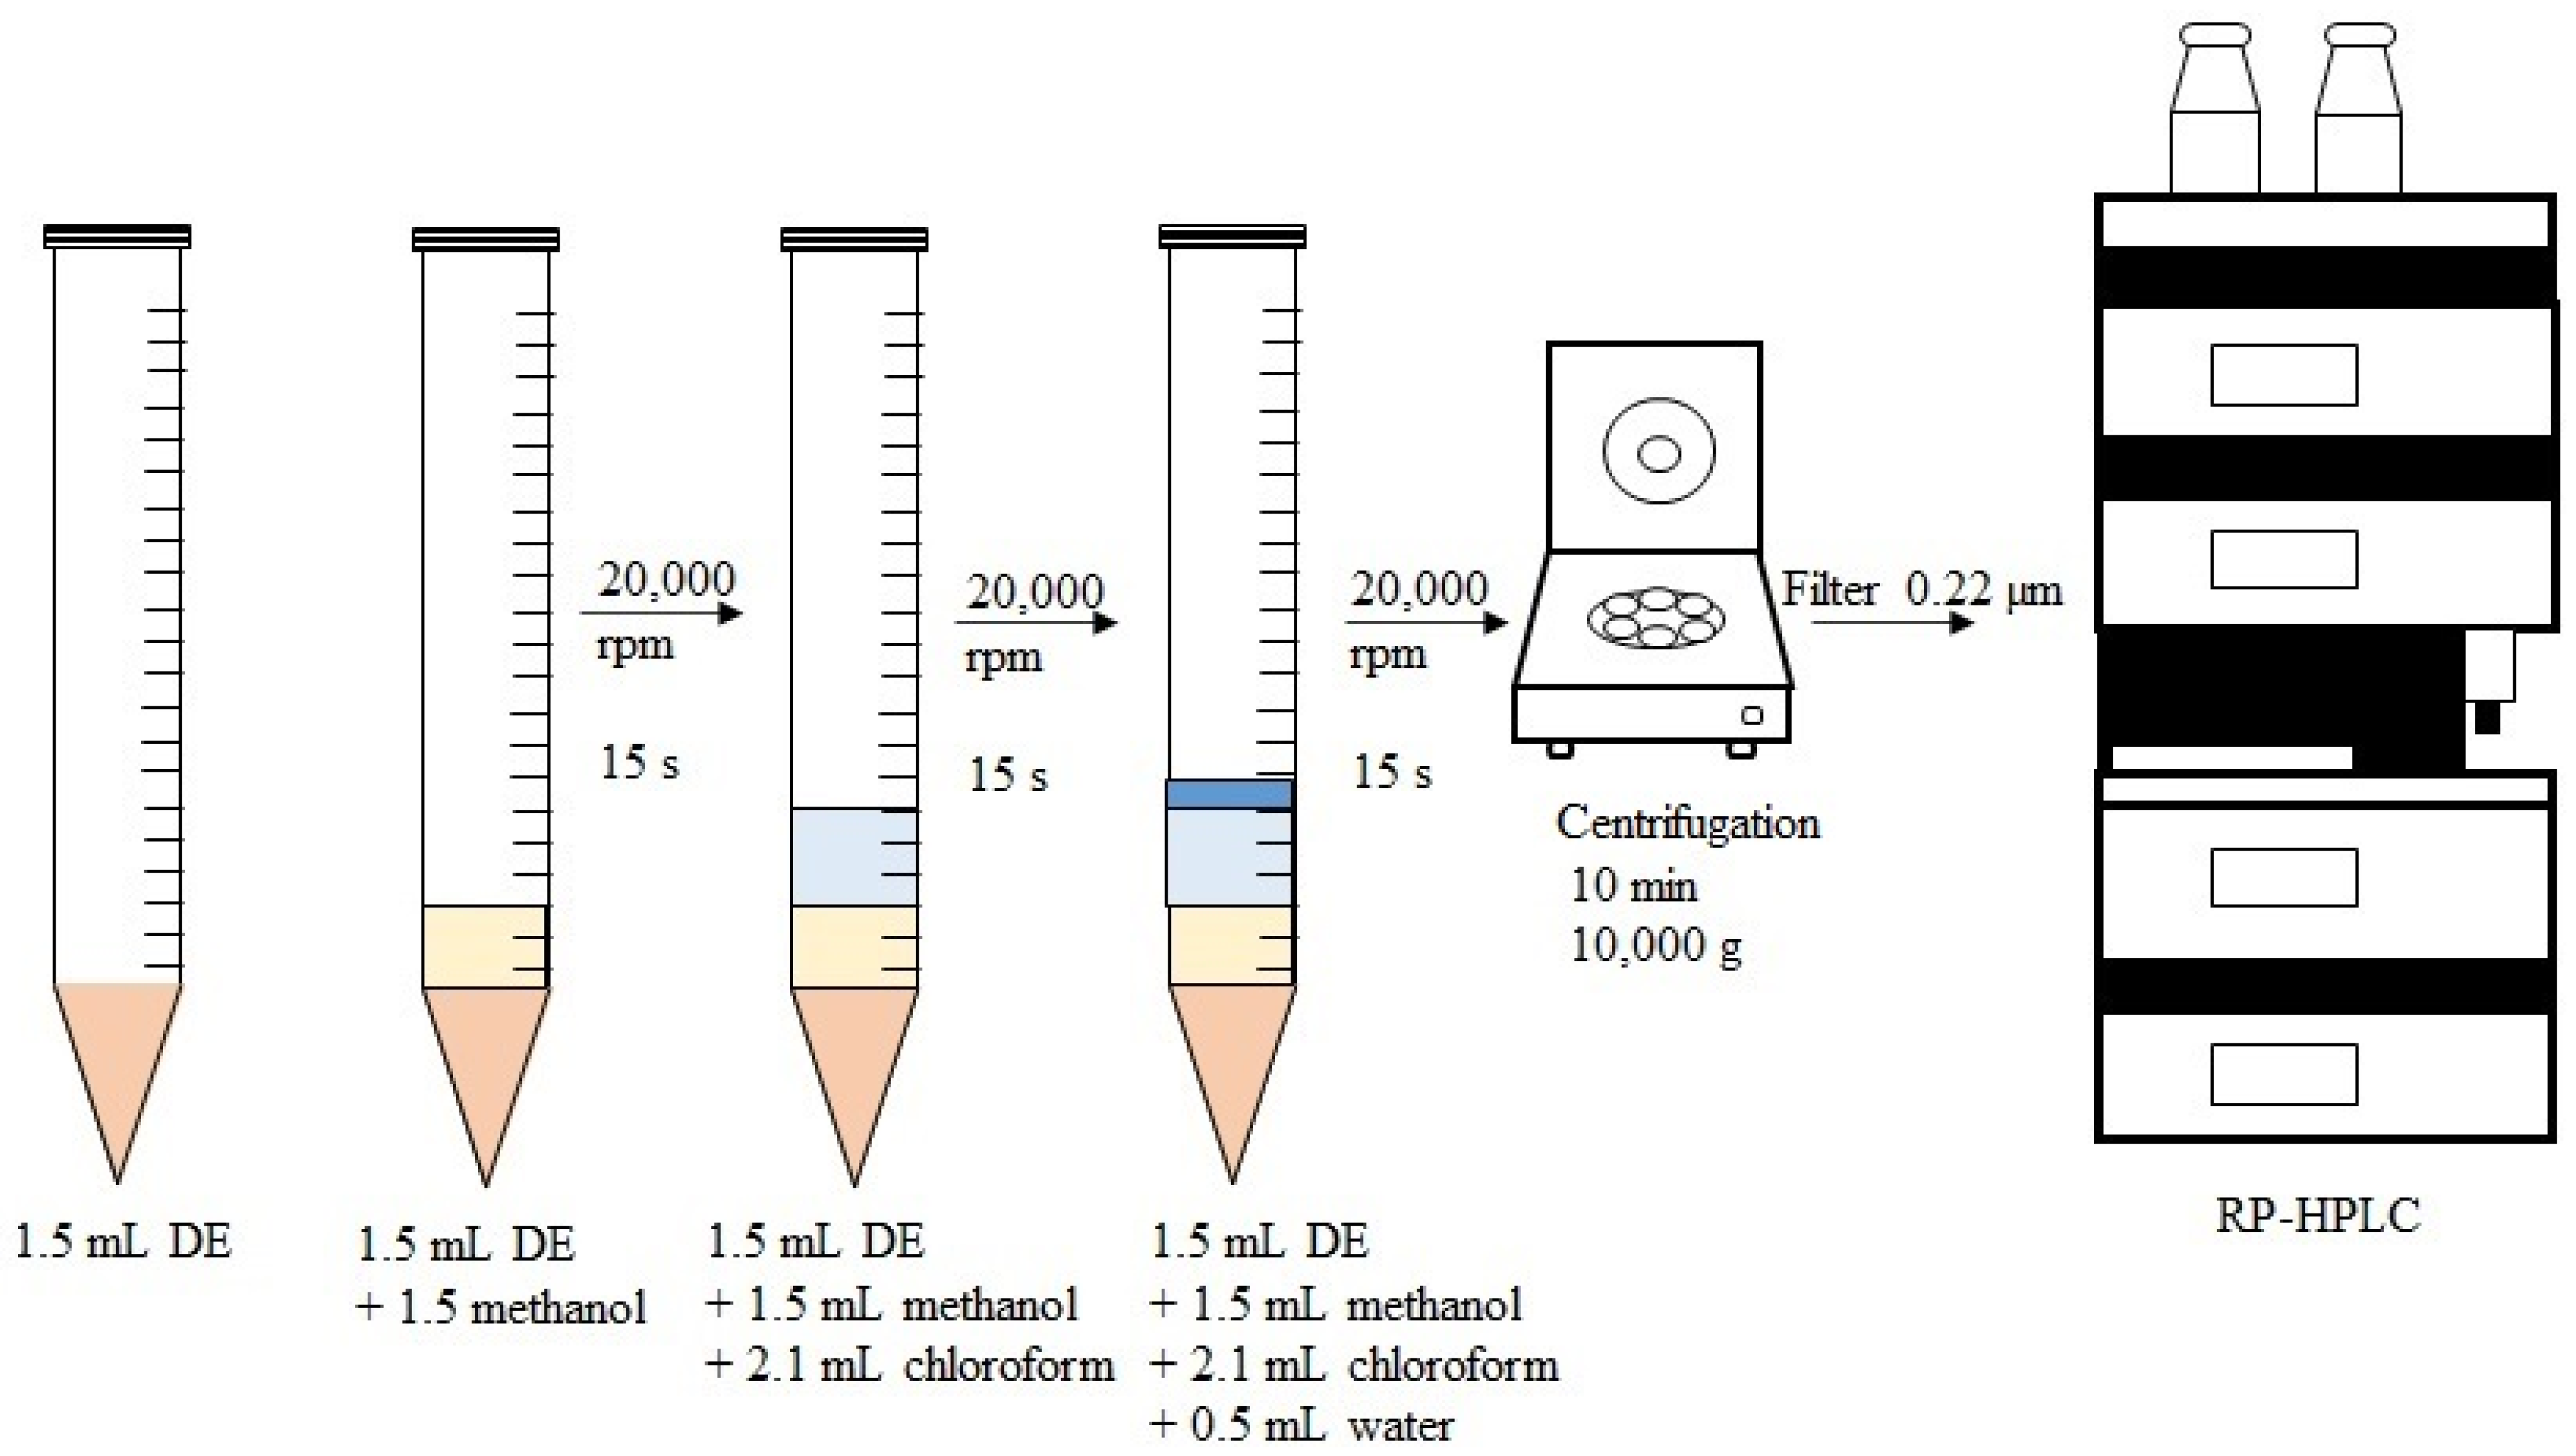
2.3. Pomegranate Peel Extract Preparation
2.4. Water-in-Oil (W1/O) Emulsions Preparation
2.5. Water-in-Oil-in-Water (W1/O/W2) DE Preparation
2.5.1. Preparation of DEs by Mechanical Agitation (MA)
2.5.2. Preparation of DEs by Direct Membrane Emulsification (DME)
2.6. Viscosity Measurement of Oils
2.7. Characterization of DEs
2.7.1. Droplet Size Distribution (DSD)
2.7.2. Microscopic Studies
2.7.3. Stability
2.7.4. Encapsulation Efficiency (EE)
2.8. Statistical Analysis
3. Results
3.1. Viscosity Measurements of the Oils
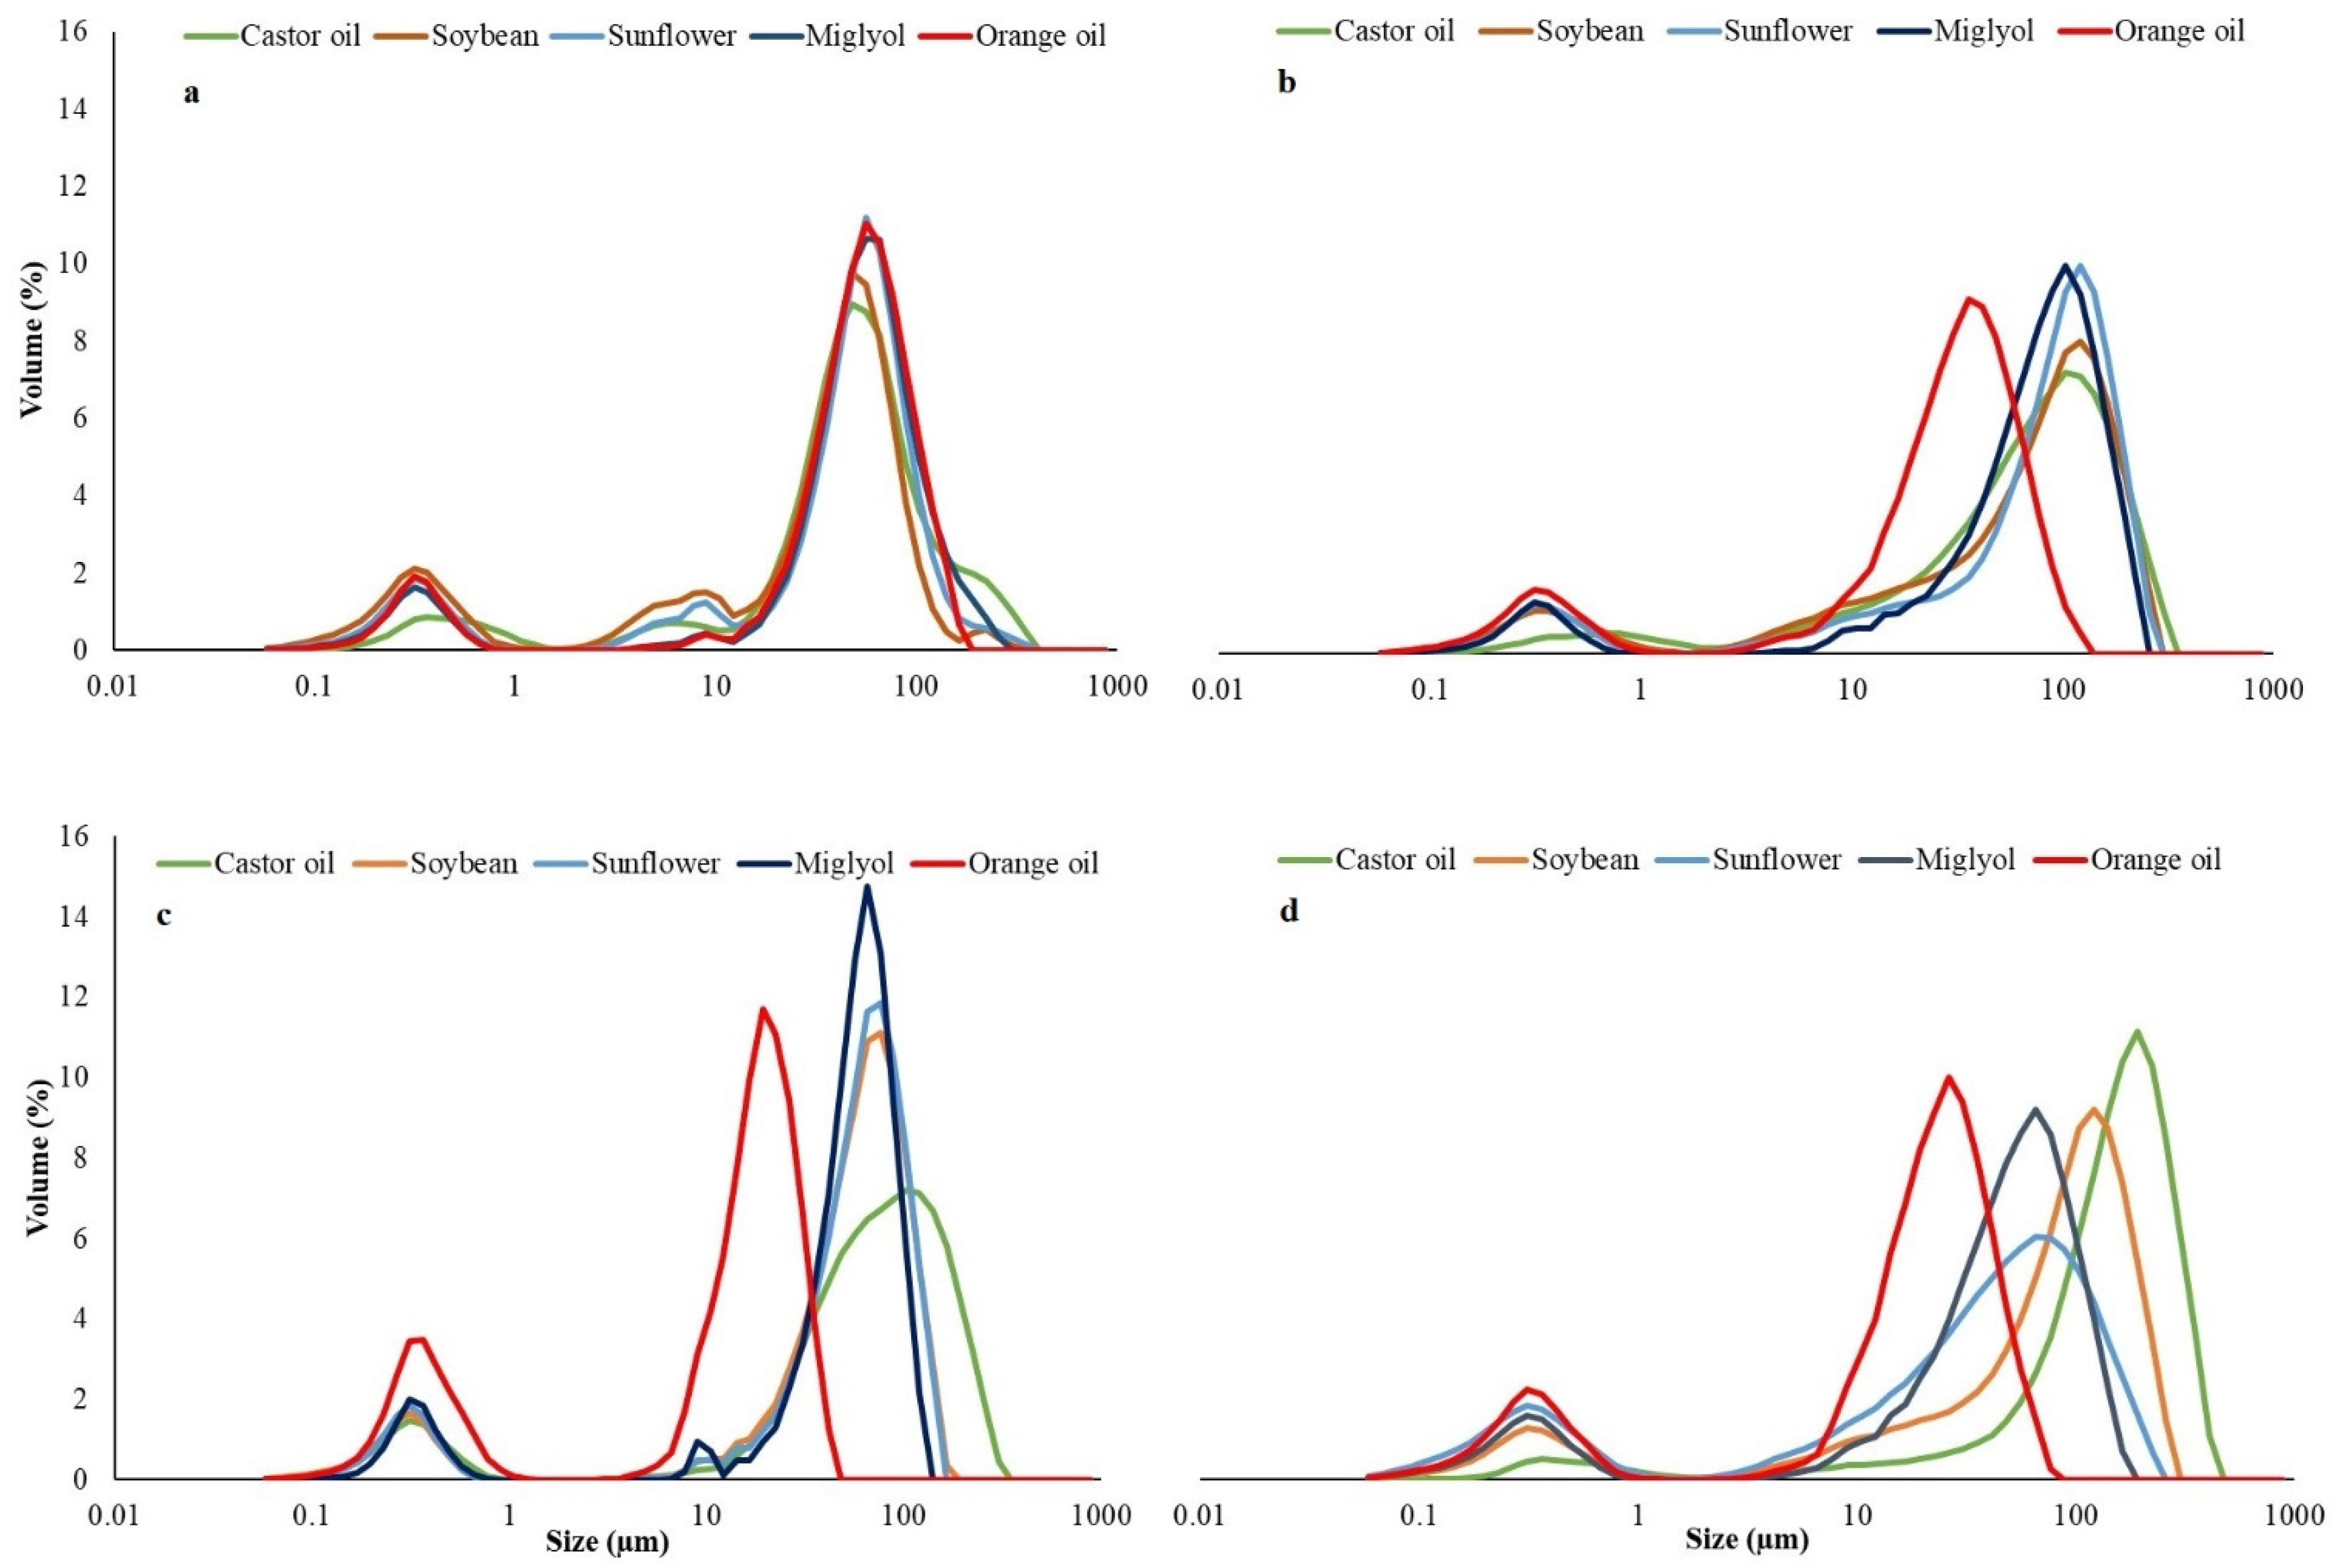
3.2. Droplet Size Distribution (DSD)
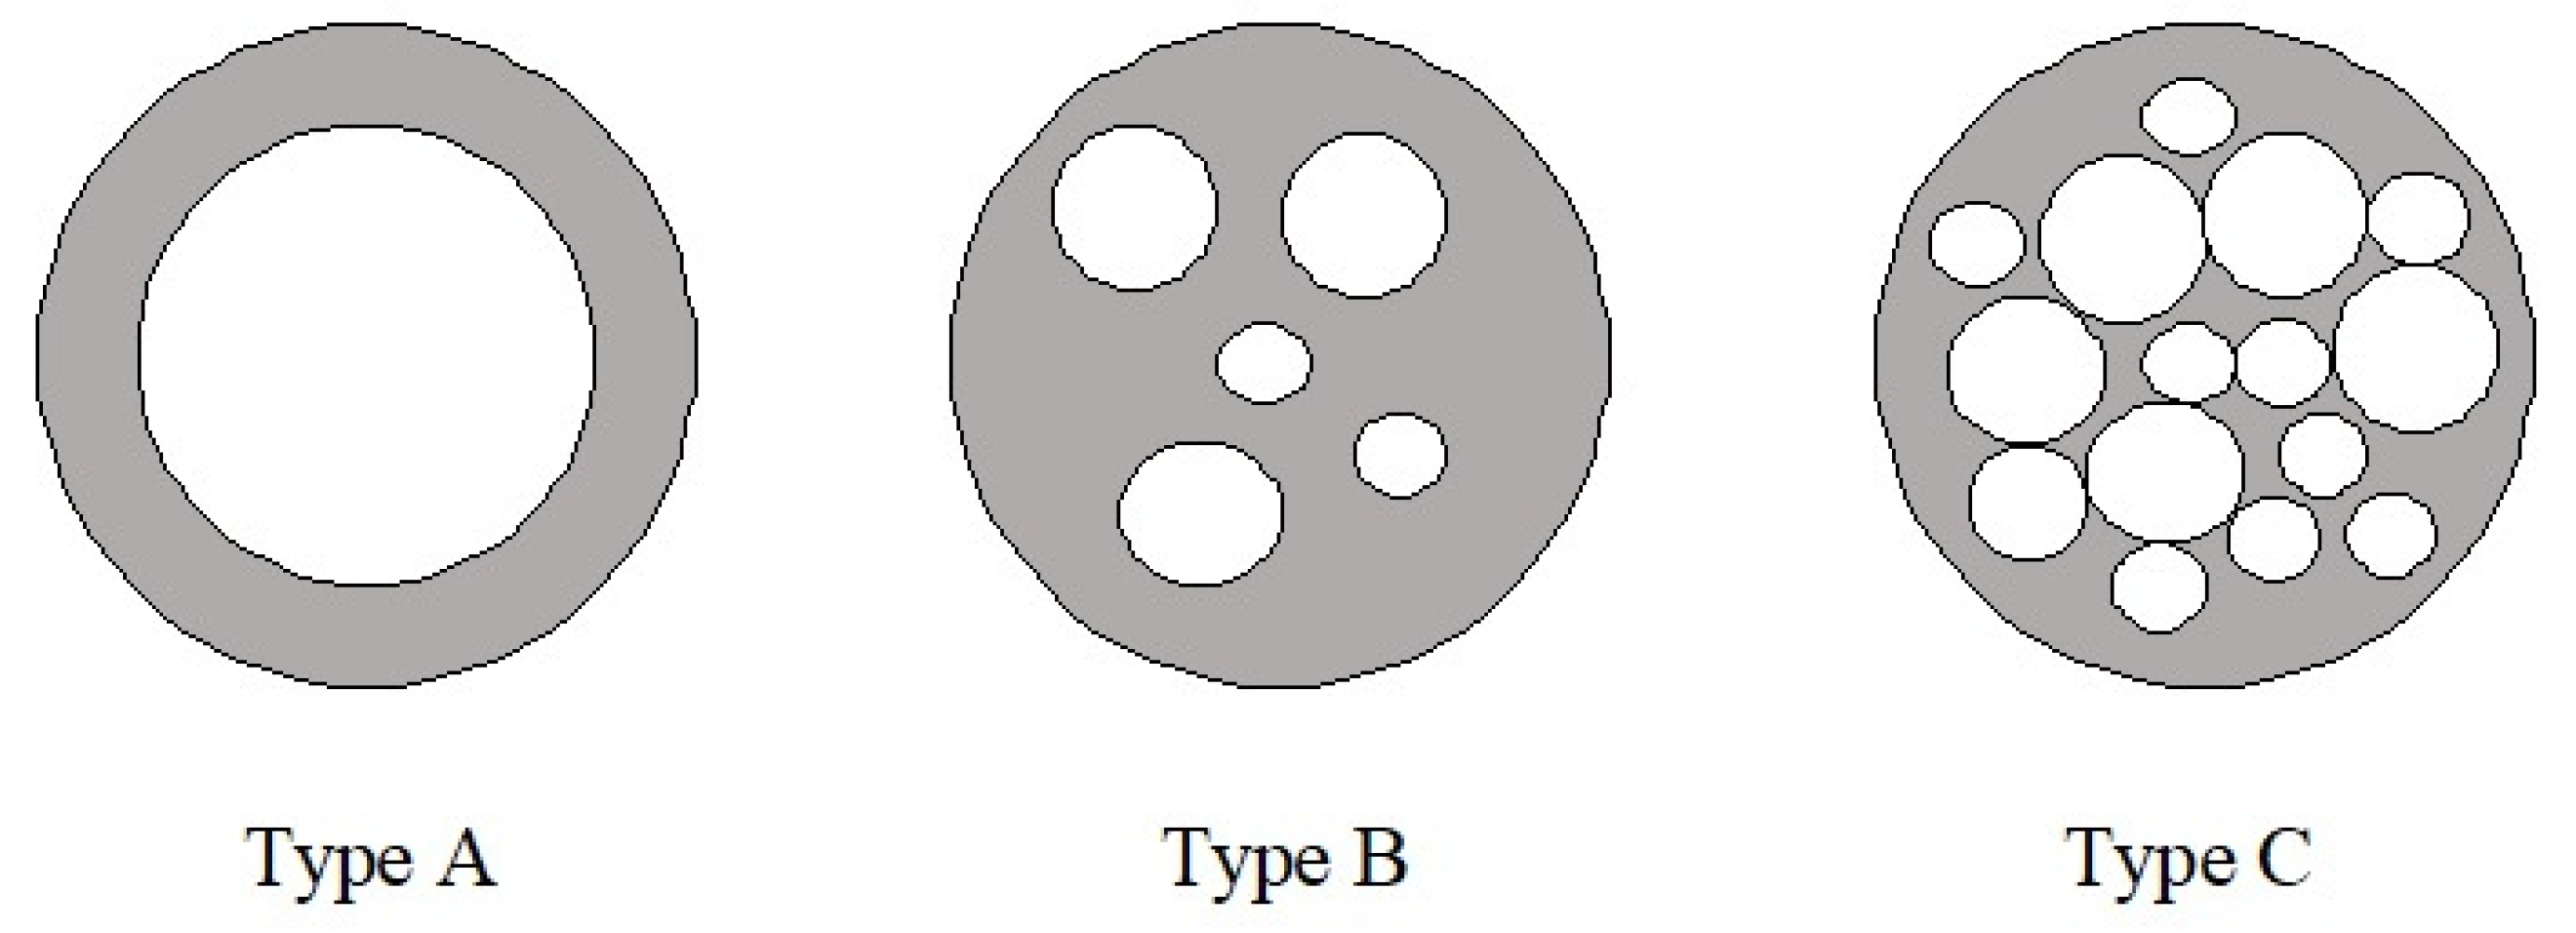
3.3. Morphology
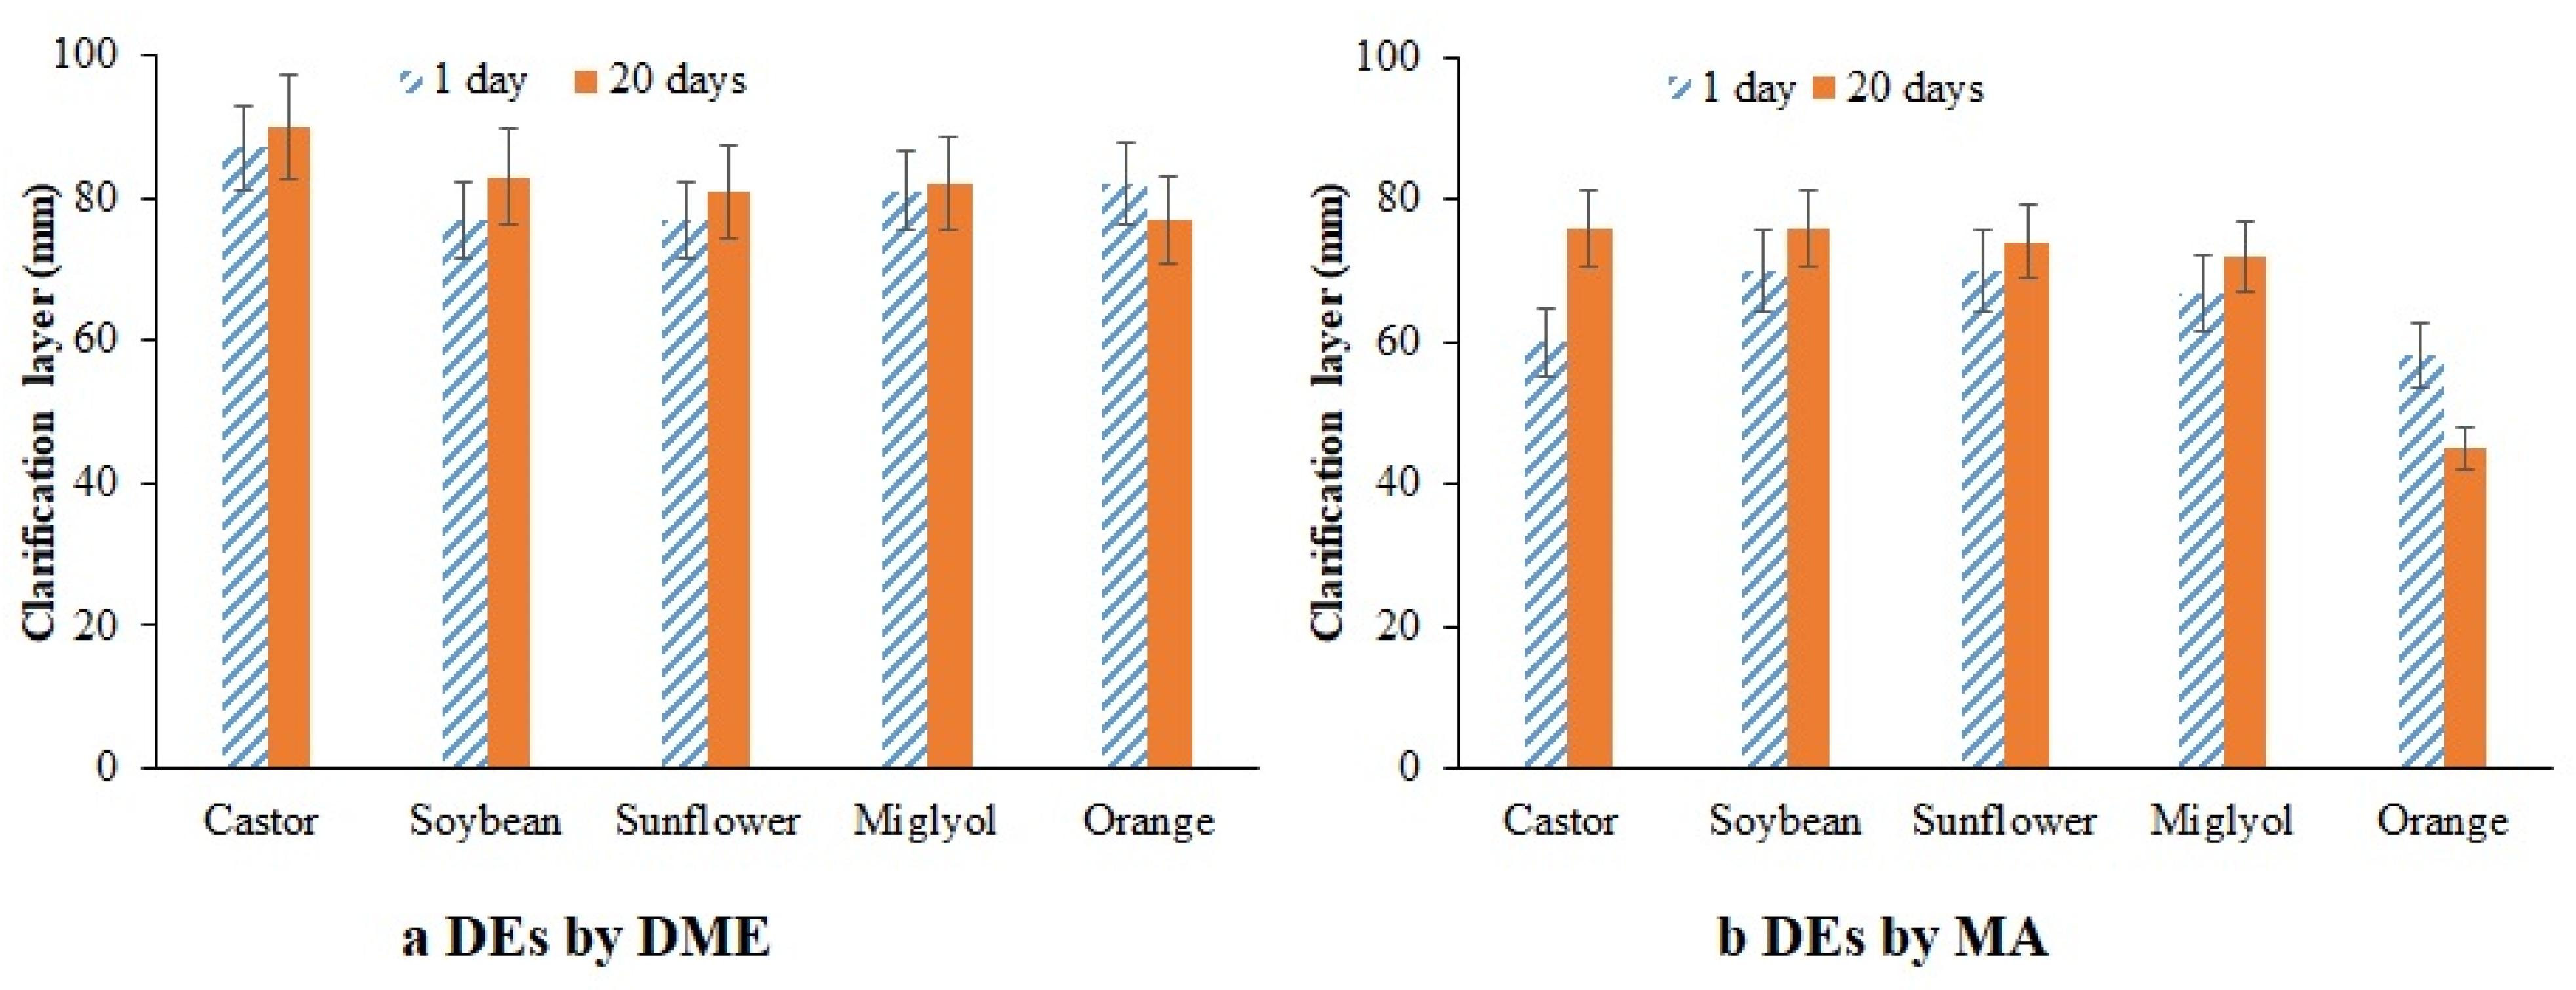
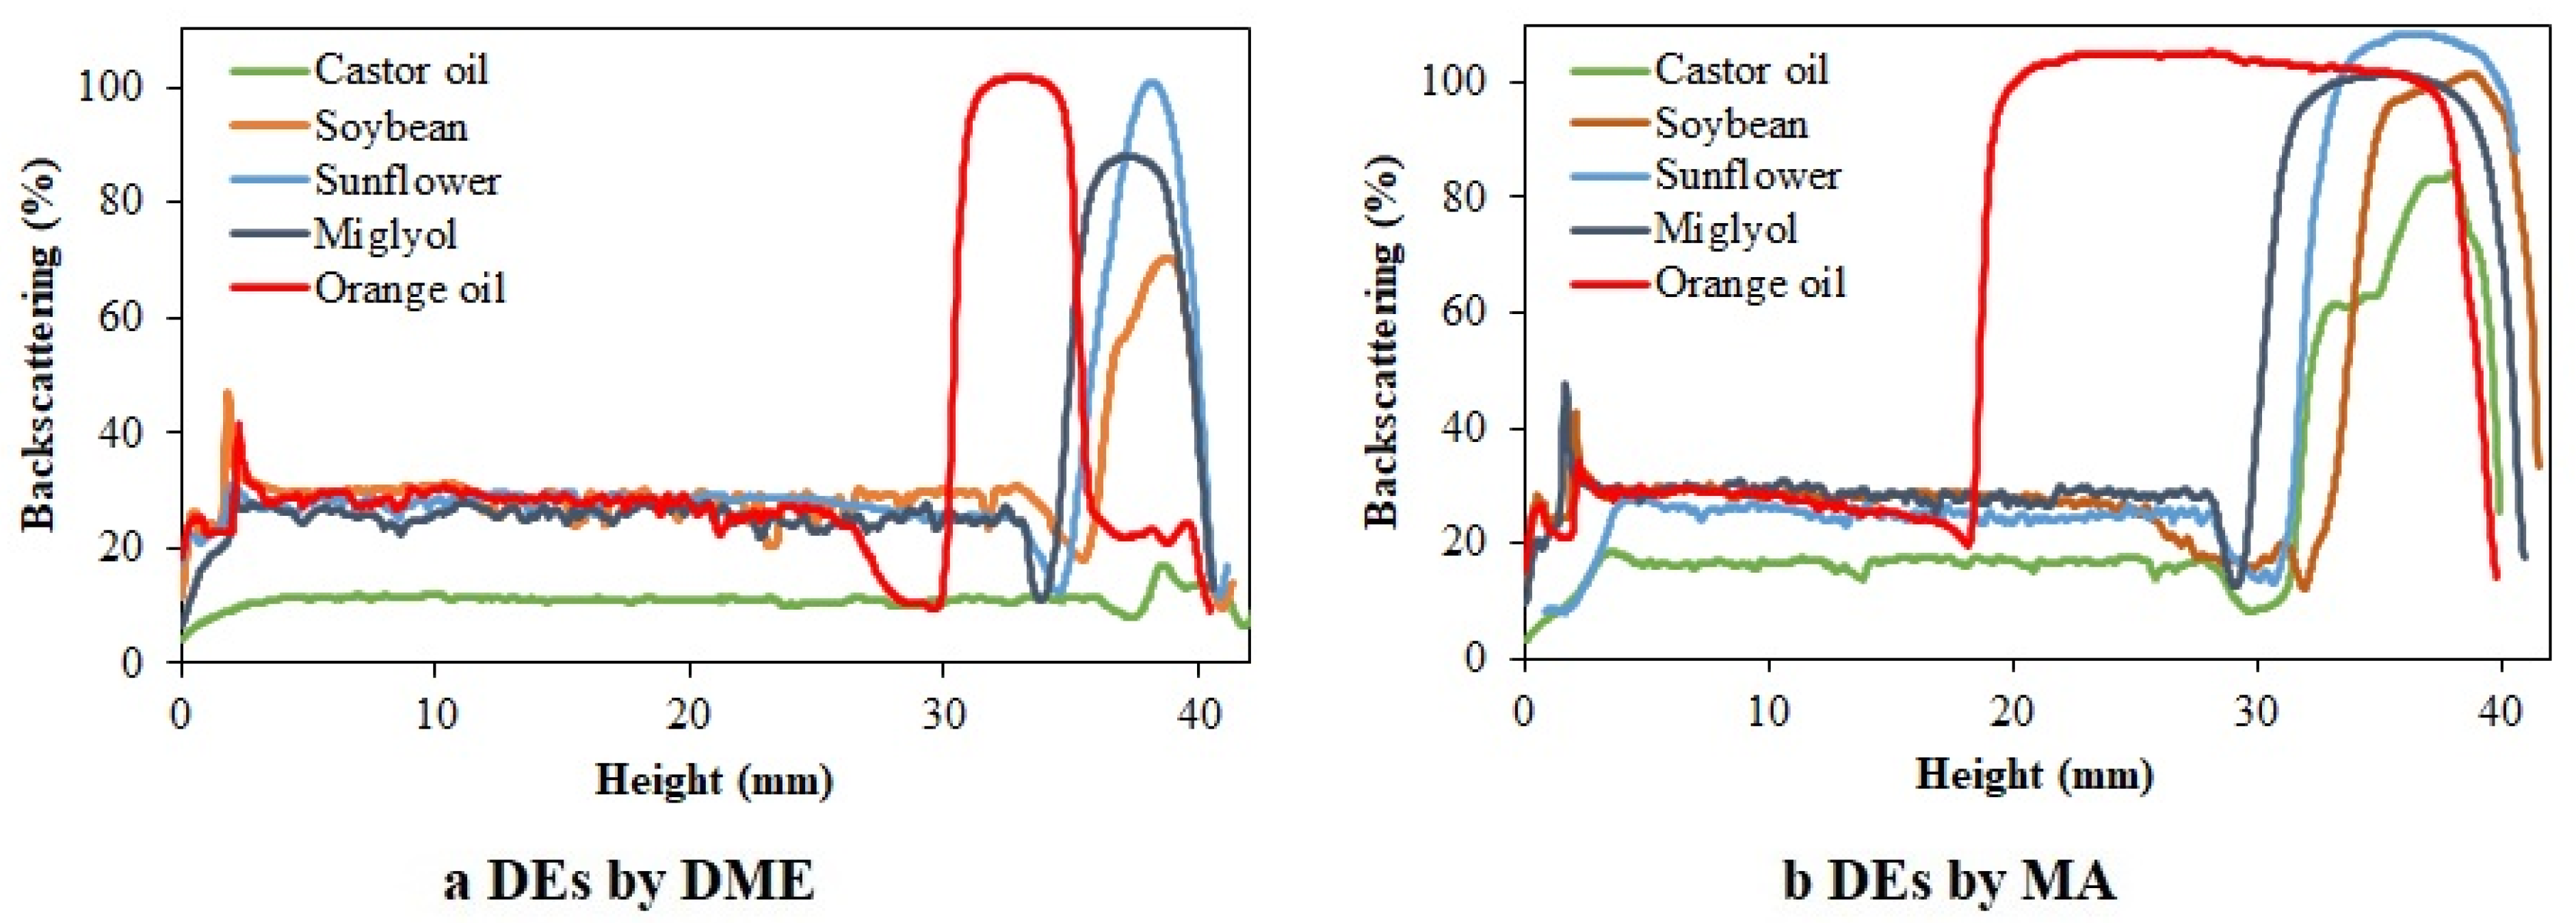
3.4. Stability
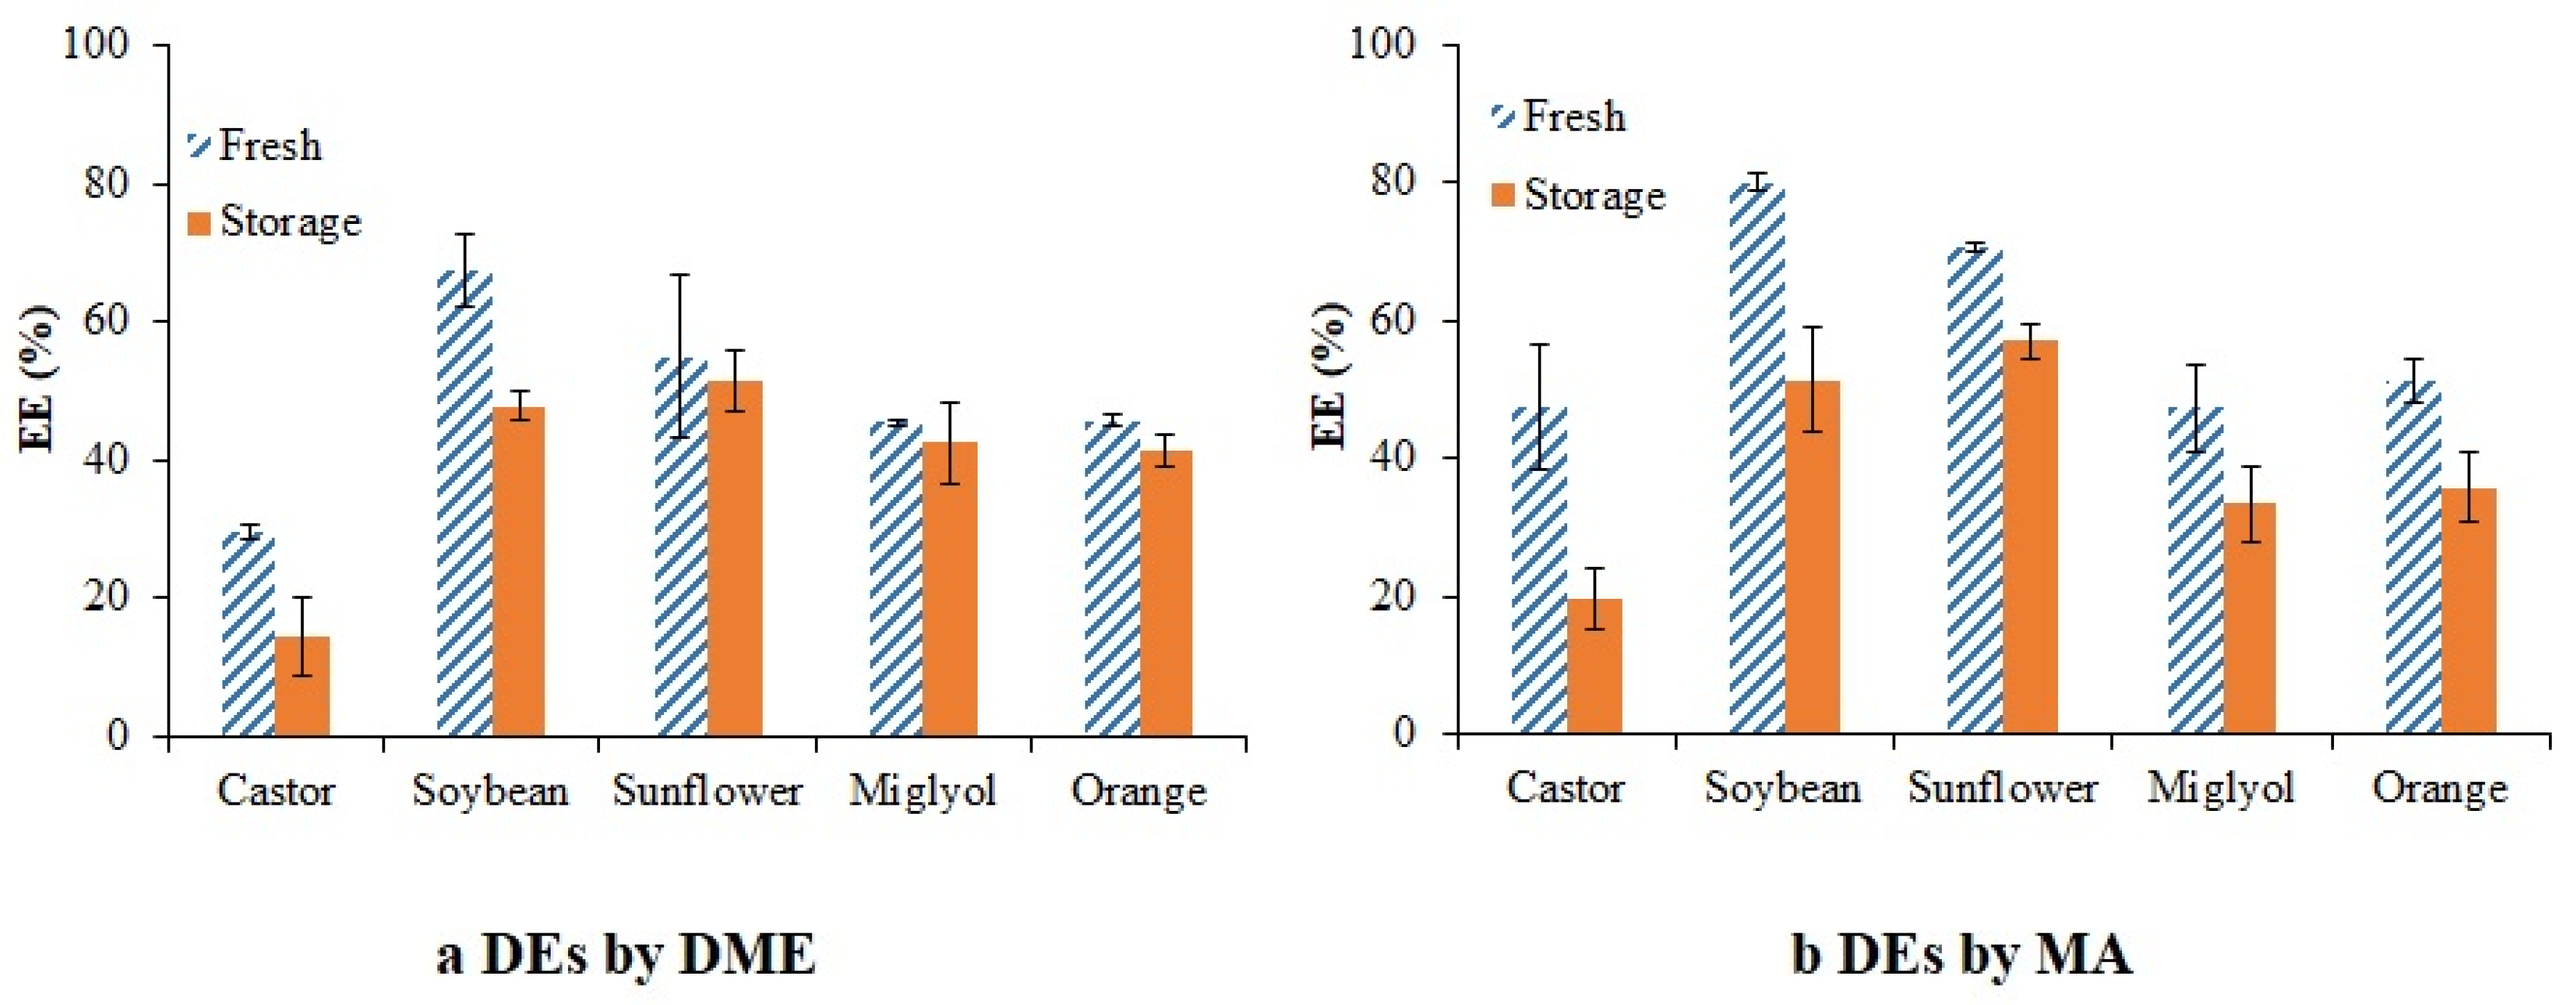
3.5. Encapsulation Efficiency (EE)
4. Conclusions
Supplementary Materials
Author Contributions
Funding
Data Availability Statement
Conflicts of Interest
References
- Akhtar, S.; Ismail, T.; Fraternale, D.; Sestili, P. Pomegranate peel and peel extracts: Chemistry and food features. Food Chem. 2015, 174, 417–425. [Google Scholar] [CrossRef] [PubMed]
- García, P.; Fredes, C.; Cea, I.; Lozano-Sánchez, J.; Leyva-Jiménez, F.; Robert, P.; Vergara, C.; Jimenez, P. Recovery of Bioactive Compounds from Pomegranate (Punica granatum L.) Peel Using Pressurized Liquid Extraction. Foods 2021, 10, 203. [Google Scholar] [CrossRef] [PubMed]
- Gustavsson, J.; Cederberg, C.; Sonesson, U.; van Otterdijk, R.; Meybeck, A. (Eds.) Global Food Losses and Food Waste: Extent, Causes and Prevention; Food and Agriculture Organization of the United Nations: Rome, Italy, 2011; 29p. [Google Scholar]
- United Nations. Sustainable Consumption and Production. United Nations Sustainable Development. Available online: https://www.un.org/sustainabledevelopment/sustainable-consumption-production/ (accessed on 27 June 2021).
- Fischer, U.A.; Carle, R.; Kammerer, D.R. Identification and quantification of phenolic compounds from pomegranate (Punica granatum L.) peel, mesocarp, aril and differently produced juices by HPLC-DAD–ESI/MSn. Food Chem. 2011, 127, 807–821. [Google Scholar] [CrossRef] [PubMed]
- Çam, M.; Hışıl, Y. Pressurised water extraction of polyphenols from pomegranate peels. Food Chem. 2010, 123, 878–885. [Google Scholar] [CrossRef]
- Kaderides, K.; Goula, A.M.; Adamopoulos, K.G. A process for turning pomegranate peels into a valuable food ingredient using ultrasound-assisted extraction and encapsulation. Innov. Food Sci. Emerg. Technol. 2015, 31, 204–215. [Google Scholar] [CrossRef]
- Quattrucci, A.; Ovidi, E.; Tiezzi, A.; Vinciguerra, V.; Balestra, G.M. Biological control of tomato bacterial speck using Punica gran-atum fruit peel extract. Crop Prot. 2013, 46, 18–22. [Google Scholar] [CrossRef]
- Reddy, M.; Gupta, S.; Jacob, M.; Khan, S.; Ferreira, D. Antioxidant, Antimalarial and Antimicrobial Activities of Tannin-Rich Frac-tions, Ellagitannins and Phenolic Acids from Punica granatum L. Planta Med. 2007, 73, 461–467. [Google Scholar] [CrossRef]
- Viuda-Martos, M.; Ruiz-Navajas, Y.; Fernández-López, J.; Sendra, E.; Sayas-Barberá, E.; Pérez-Álvarez, J.A. Antioxidant properties of pomegranate (Punica granatum L.) bagasses obtained as co-product in the juice extraction. Food Res. Int. 2011, 44, 1217–1223. [Google Scholar] [CrossRef]
- Kharchoufi, S.; Licciardello, F.; Siracusa, L.; Muratore, G.; Hamdi, M.; Restuccia, C. Antimicrobial and antioxidant features of ‘Gabsi’ pomegranate peel extracts. Ind. Crops Prod. 2018, 111, 345–352. [Google Scholar] [CrossRef]
- Molva, C.; Baysal, A.H. Evaluation of bioactivity of pomegranate fruit extract against Alicyclobacillus acidoterrestris DSM 3922 vegetative cells and spores in apple juice. LWT Food Sci. Technol. 2015, 62, 989–995. [Google Scholar] [CrossRef] [Green Version]
- Çam, M.; Içyer, N.C.; Erdoğan, F. Pomegranate peel phenolics: Microencapsulation, storage stability and potential ingredient for functional food development. LWT Food Sci. Technol. 2014, 55, 117–123. [Google Scholar] [CrossRef]
- Comunian, T.A.; da Silva Anthero, A.G.; Bezerra, E.O.; Moraes, I.C.F.; Hubinger, M.D. Encapsulation of Pomegranate Seed Oil by Emulsification Followed by Spray Drying: Evaluation of Different Biopolymers and Their Effect on Particle Properties. Food Bioprocess Technol. 2020, 13, 53–66. [Google Scholar] [CrossRef]
- Endo, E.H.; Ueda-Nakamura, T.; Nakamura, C.V.; Filho, B.P.D. Activity of Spray-dried Microparticles Containing Pomegranate Peel Extract against Candida albicans. Molecules 2012, 17, 10094–10107. [Google Scholar] [CrossRef] [PubMed]
- Goula, A.; Adamopoulos, K. A method for pomegranate seed application in food industries: Seed oil encapsulation. Food Bioprod. Process. 2012, 90, 639–652. [Google Scholar] [CrossRef]
- Robert, P.; Gorena, T.; Romero, N.; Sepulveda, E.; Chavez, J.; Saenz, C. Encapsulation of polyphenols and anthocyanins from pomegranate (Punica granatum) by spray drying: Encapsulation of polyphenols and anthocyanins. Int. J. Food Sci. Technol. 2010, 45, 1386–1394. [Google Scholar] [CrossRef]
- Zam, W. Fortification of dairy products by microcapsules of polyphenols extracted from pomegranate peels. In New Polymers for Encapsulation of Nutraceutical Compounds; Ruiz, J.C.R., Campos, M.R.S., Eds.; John Wiley&Sons, Ltd.: Chichester, UK, 2017; pp. 145–157. Available online: http://doi.wiley.com/10.1002/9781119227625.ch7 (accessed on 27 November 2021).
- Zam, W.; Bashour, G.; Abdelwahed, W.; Khayata, W. Alginate-pomegranate peels’ polyphenols beads: Effects of formulation parameters on loading efficiency. Braz. J. Pharm. Sci. 2014, 50, 741–748. [Google Scholar] [CrossRef] [Green Version]
- Heidari, F.; Jafari, S.M.; Ziaiifar, A.M.; Malekjani, N. Stability and release mechanisms of double emulsions loaded with bioactive compounds; a critical review. Adv. Colloid Interface Sci. 2022, 299, 102567. [Google Scholar] [CrossRef] [PubMed]
- Robert, P.; Zamorano, M.; González, E.; Silva-Weiss, A.; Cofrades, S.; Giménez, B. Double emulsions with olive leaves extract as fat replacers in meat systems with high oxidative stability. Food Res. Int. 2019, 120, 904–912. [Google Scholar] [CrossRef] [Green Version]
- Van der Graaf, S.; Schroën, C.; Boom, R.M. Preparation of double emulsions by membrane emulsification—A review. J. Membr. Sci. 2005, 251, 7–15. [Google Scholar] [CrossRef]
- Garti, N. Progress in Stabilization and Transport Phenomena of Double Emulsions in Food Applications. LWT Food Sci. Technol. 1997, 30, 222–235. [Google Scholar] [CrossRef]
- Berendsen, R.; Güell, C.; Henry, O.; Ferrando, M. Premix membrane emulsification to produce oil-in-water emulsions stabilized with various interfacial structures of whey protein and carboxymethyl cellulose. Food Hydrocoll. 2014, 38, 1–10. [Google Scholar] [CrossRef]
- Joscelyne, S.M.; Trägårdh, G. Membrane emulsification—A literature review. J. Membr. Sci. 2000, 169, 107–117. [Google Scholar] [CrossRef]
- Anarakdim, K.; Gutiérrez, G.; Cambiella, Á.; Senhadji-Kebiche, O.; Matos, M. The Effect of Emulsifiers on the Emulsion Stability and Extraction Efficiency of Cr(VI) Using Emulsion Liquid Membranes (ELMs) Formulated with a Green Solvent. Membranes 2020, 10, 76. [Google Scholar] [CrossRef] [PubMed] [Green Version]
- Matos, M.; Gutiérrez, G.; Coca, J.; Pazos, C. Preparation of water-in-oil-in-water (W1/O/W2) double emulsions containing trans-resveratrol. Colloids Surf. A Physicochem. Eng. Asp. 2014, 442, 69–79. [Google Scholar] [CrossRef]
- Matos, M.; Gutiérrez, G.; Iglesias, O.; Coca, J.; Pazos, C. Enhancing encapsulation efficiency of food-grade double emulsions con-taining resveratrol or vitamin B12 by membrane emulsification. J. Food Eng. 2015, 166, 212–220. [Google Scholar] [CrossRef]
- Matos, M.; Gutiérrez, G.; Martínez-Rey, L.; Iglesias, O.; Pazos, C. Encapsulation of resveratrol using food-grade concentrated double emulsions: Emulsion characterization and rheological behaviour. J. Food Eng. 2018, 226, 73–81. [Google Scholar] [CrossRef]
- Berendsen, R.; Güell, C.; Ferrando, M. A procyanidin-rich extract encapsulated in water-in-oil-in-water emulsions produced by premix membrane emulsification. Food Hydrocoll. 2015, 43, 636–648. [Google Scholar] [CrossRef]
- Suárez, M.A.; Gutiérrez, G.; Coca, J.; Pazos, C. Geometric parameters influencing production of O/W emulsions using flat metallic membranes and scale-up. J. Membr. Sci. 2013, 430, 140–149. [Google Scholar] [CrossRef]
- Gutiérrez, G.; Matos, M.; Benito, J.M.; Coca, J.; Pazos, C. Preparation of HIPEs with controlled droplet size containing lutein. Colloids Surf. A Physicochem. Eng. Asp. 2014, 442, 111–122. [Google Scholar] [CrossRef]
- Matos, M.; Gutiérrez, G.; Lobo, A.; Coca, J.; Pazos, C.; Benito, J.M. Surfactant effect on the ultrafiltration of oil-in-water emulsions using ceramic membranes. J. Membr. Sci. 2016, 520, 749–759. [Google Scholar] [CrossRef]
- Evans, J.; Hammond, E.; Gigiel, A.; Fostera, A.; Reinholdt, L.; Fikiin, K.; Zilio, C. Assessment of methods to reduce the energy consumption of food cold stores. Appl. Therm. Eng. 2014, 62, 697–705. [Google Scholar] [CrossRef]
- Glazer, I.; Masaphy, S.; Marciano, P.; Bar-Ilan, I.; Holland, D.; Kerem, Z.; Amir, R. Partial Identification of Antifungal Compounds from Punica granatum Peel Extracts. J. Agric. Food Chem. 2012, 60, 4841–4848. [Google Scholar] [CrossRef] [PubMed]
- Silva, W.; Torres-Gatica, M.F.; Oyarzun-Ampuero, F.; Silva-Weiss, A.; Robert, P.; Cofrades, S.; Giménez, B. Double emulsions as potential fat replacers with gallic acid and quercetin nanoemulsions in the aqueous phases. Food Chem. 2018, 253, 71–78. [Google Scholar] [CrossRef] [PubMed]
- Robert, P.; Vergara, C.; Silva-Weiss, A.; Osorio, F.A.; Santander, R.; Sáenz, C.; Giménez, B. Influence of gelation on the retention of purple cactus pear extract in microencapsulated double emulsions. PLoS ONE 2020, 15, e0227866. [Google Scholar] [CrossRef] [PubMed] [Green Version]
- Omotosho, J.A.; Whateley, T.L.; Law, T.K.; Florence, A.T. The Nature of the Oil Phase and the Release of Solutes from Multiple (w/o/w) Emulsions. J. Pharm. Pharmacol. 1986, 38, 865–870. [Google Scholar] [CrossRef] [PubMed]
- Raynal, S.; Grossiord, J.L.; Seiller, M.; Clausse, D. A topical W/O/W multiple emulsion containing several active substances: For-mulation, characterization and study of release. J. Controlled Release 1993, 26, 129–140. [Google Scholar] [CrossRef]
- Smułek, W.; Siejak, P.; Fathordoobady, F.; Masewicz, Ł.; Guo, Y.; Jarzębska, M.; Kitts, D.D.; Kowalczewski, P.Ł.; Baranowska, H.M.; Stangierski, J.; et al. Whey Proteins as a Potential Co-Surfactant with Aesculus hippocastanum L. as a Stabilizer in Nanoemulsions Derived from Hempseed Oil. Molecules 2021, 26, 5856. [Google Scholar] [CrossRef]
- Jarzębski, M.; Smułek, W.; Siejak, P.; Rezler, R.; Pawlicz, J.; Trzeciak, T.; Jarzębska, M.; Majchrzak, O.; Kaczorek, E.; Kazemian, P.; et al. Aesculus hippocastanum L. as a Stabilizer in Hemp Seed Oil Nanoemulsions for Potential Biomedical and Food Applications. Int. J. Mol. Sci. 2021, 22, 887. [Google Scholar] [CrossRef]
- Lamba, H.; Sathish, K.; Sabikhi, L. Double Emulsions: Emerging Delivery System for Plant Bioactives. Food Bioprocess Technol. 2015, 8, 709–728. [Google Scholar] [CrossRef]
- Yuan, Q.; Aryanti, N.; Gutiérrez, G.; Williams, R.A. Enhancing the Throughput of Membrane Emulsification Techniques to Manufacture Functional Particles. Ind. Eng. Chem. Res. 2009, 7, 8872–8880. [Google Scholar] [CrossRef]
- Díaz-Ruiz, R.; Valdeón, I.; Álvarez, J.R.; Matos, M.; Gutiérrez, G. Simultaneous encapsulation of trans-resveratrol and vitamin D3 in highly concentrated double emulsions. J. Sci. Food Agric. 2021, 101, 3654–3664. [Google Scholar] [CrossRef] [PubMed]
- Khadem, B.; Khellaf, M.; Sheibat-Othman, N. Investigating swelling-breakdown in double emulsions. Colloids Surf. Physicochem. Eng. Asp. 2020, 585, 124181. [Google Scholar] [CrossRef]
- Florence, A.T.; Whitehill, D. Some features of breakdown in water-in-oil-in-water multiple emulsions. J. Colloid Interface Sci. 1981, 79, 243–256. [Google Scholar] [CrossRef]
- Florence, A.T.; Whitehill, D. Stability and Stabilization of Water-in-Oil-in-Water Multiple Emulsions. In Macro- and Microemulsions; Shah, D.O., Ed.; ACS Symposium Series; American Chemical Society: Washington, DC, USA, 1985; Volume 272, pp. 359–380. Available online: https://pubs.acs.org/doi/abs/10.1021/bk-1985-0272.ch023 (accessed on 25 July 2020).
- Park, J.; Lee, J.; McClements, D.J.; Choi, S.J. Inhibition of Droplet Growth in Model Beverage Emulsions Stabilized Using Poly (ethylene glycol) Alkyl Ether Surfactants Having Various Hydrophilic Head Sizes: Impact of Ester Gum. Appl. Sci. 2020, 10, 5588. [Google Scholar] [CrossRef]
- Matos, M.; Marefati, A.; Barrero, P.; Rayner, M.; Gutiérrez, G. Resveratrol loaded Pickering emulsions stabilized by OSA modified rice starch granules. Food Res. Int. 2021, 139, 109837. [Google Scholar] [CrossRef]
- McClements, D.; Henson, L.; Popplewell, L.M.; Decker, E.A.; Choi, S.J. Inhibition of Ostwald Ripening in Model Beverage Emulsions by Addition of Poorly Water Soluble Triglyceride Oils. J. Food Sci. 2012, 77, C33–C38. [Google Scholar] [CrossRef] [PubMed]
- Park, S.H.; Hong, C.R.; Choi, S.J. Prevention of Ostwald ripening in orange oil emulsions: Impact of surfactant type and Ostwald ripening inhibitor type. LWT 2020, 134, 110180. [Google Scholar] [CrossRef]
- Pays, K. Double emulsions: How does release occur? J. Control. Release 2002, 79, 193–205. [Google Scholar] [CrossRef]
- Charcosset, C. Preparation of emulsions and particles by membrane emulsification for the food processing industry. J. Food Eng. 2009, 92, 241–249. [Google Scholar] [CrossRef]
- Okochi, H.; Nakano, M. Comparative Study of Two Preparation Methods of w/o/w Emulsions: Stirring and Membrane Emulsi-fication. Chem. Pharm. Bull. 1997, 45, 1323–1326. [Google Scholar] [CrossRef] [Green Version]


| Oil | Viscosity (Pa·s) X ± SD |
|---|---|
| Castor | 0.517 ± 0.004 d |
| Soybean | 0.055 ± 0.009 c |
| Sunflower | 0.029 ± 0.007 b |
| Miglyol | 0.006 ± 0.004 a |
| Orange | 0.005 ± 0.004 a |
| Oil | DME | MA | ||||||
|---|---|---|---|---|---|---|---|---|
| Span (X ± SD) | MDS (µm) | Span (X ± SD) | MDS (µm) | Span (X ± SD) | MDS (µm) | Span (X ± SD) | MDS (µm) | |
| Fresh | 20 Days | Fresh | 20 Days | |||||
| Castor | 2.7 ± 0.4 b,Y,w | 56.23 | 2.8 ± 0.5 a,X,w | 103.6 | 2.7 ± 0.3 b,X,w | 103.6 | 1.8 ± 0.2 a,X,z | 190.8 |
| Soybean | 2.2 ± 0.2 ab,Y,w | 48.13 | 2.5 ± 0.2 a,X,w | 103.6 | 1.73 ± 0.01 a,X,w | 76.3 | 2.7 ± 0.9 ab,X,z | 120.7 |
| Sunflower | 2.1 ± 0.1 ab,Y,w | 56.23 | 2.3 ± 0.5 a,X,w | 120.7 | 1.64 ± 0.04 a,X,w | 76.3 | 3.5 ± 0.6 b,X,z | 76.3 |
| Miglyol | 1.9 ± 0.1 ab,Y,w | 65.5 | 2.1 ± 0.4 a,X,w | 76.3 | 1.5 ± 0.1 a,X,w | 65.5 | 2.2 ± 0.2 ab,X,z | 65.5 |
| Orange | 1.6 ± 0.1 a,Y,w | 56.23 | 2.2 ± 0.1 a,X,w | 41.4 | 1.80 ± 0.03 a,X,w | 19.3 | 2.2 ± 0.2 ab,X,z | 26.2 |
Publisher’s Note: MDPI stays neutral with regard to jurisdictional claims in published maps and institutional affiliations. |
© 2022 by the authors. Licensee MDPI, Basel, Switzerland. This article is an open access article distributed under the terms and conditions of the Creative Commons Attribution (CC BY) license (https://creativecommons.org/licenses/by/4.0/).
Share and Cite
Sanhueza, L.; García, P.; Giménez, B.; Benito, J.M.; Matos, M.; Gutiérrez, G. Encapsulation of Pomegranate Peel Extract (Punica granatum L.) by Double Emulsions: Effect of the Encapsulation Method and Oil Phase. Foods 2022, 11, 310. https://doi.org/10.3390/foods11030310
Sanhueza L, García P, Giménez B, Benito JM, Matos M, Gutiérrez G. Encapsulation of Pomegranate Peel Extract (Punica granatum L.) by Double Emulsions: Effect of the Encapsulation Method and Oil Phase. Foods. 2022; 11(3):310. https://doi.org/10.3390/foods11030310
Chicago/Turabian StyleSanhueza, Leyla, Paula García, Begoña Giménez, José Manuel Benito, María Matos, and Gemma Gutiérrez. 2022. "Encapsulation of Pomegranate Peel Extract (Punica granatum L.) by Double Emulsions: Effect of the Encapsulation Method and Oil Phase" Foods 11, no. 3: 310. https://doi.org/10.3390/foods11030310
APA StyleSanhueza, L., García, P., Giménez, B., Benito, J. M., Matos, M., & Gutiérrez, G. (2022). Encapsulation of Pomegranate Peel Extract (Punica granatum L.) by Double Emulsions: Effect of the Encapsulation Method and Oil Phase. Foods, 11(3), 310. https://doi.org/10.3390/foods11030310