Drying Behavior and Curcuminoids Changes in Turmeric Slices during Drying under Simulated Solar Radiation as Influenced by Different Transparent Cover Materials

 , , and
Abstract
:
1. Introduction
2. Materials and Methods
2.1. Materials
2.2. Turmeric Rhizomes
2.3. Simulated Light Exposure during Drying Experiments
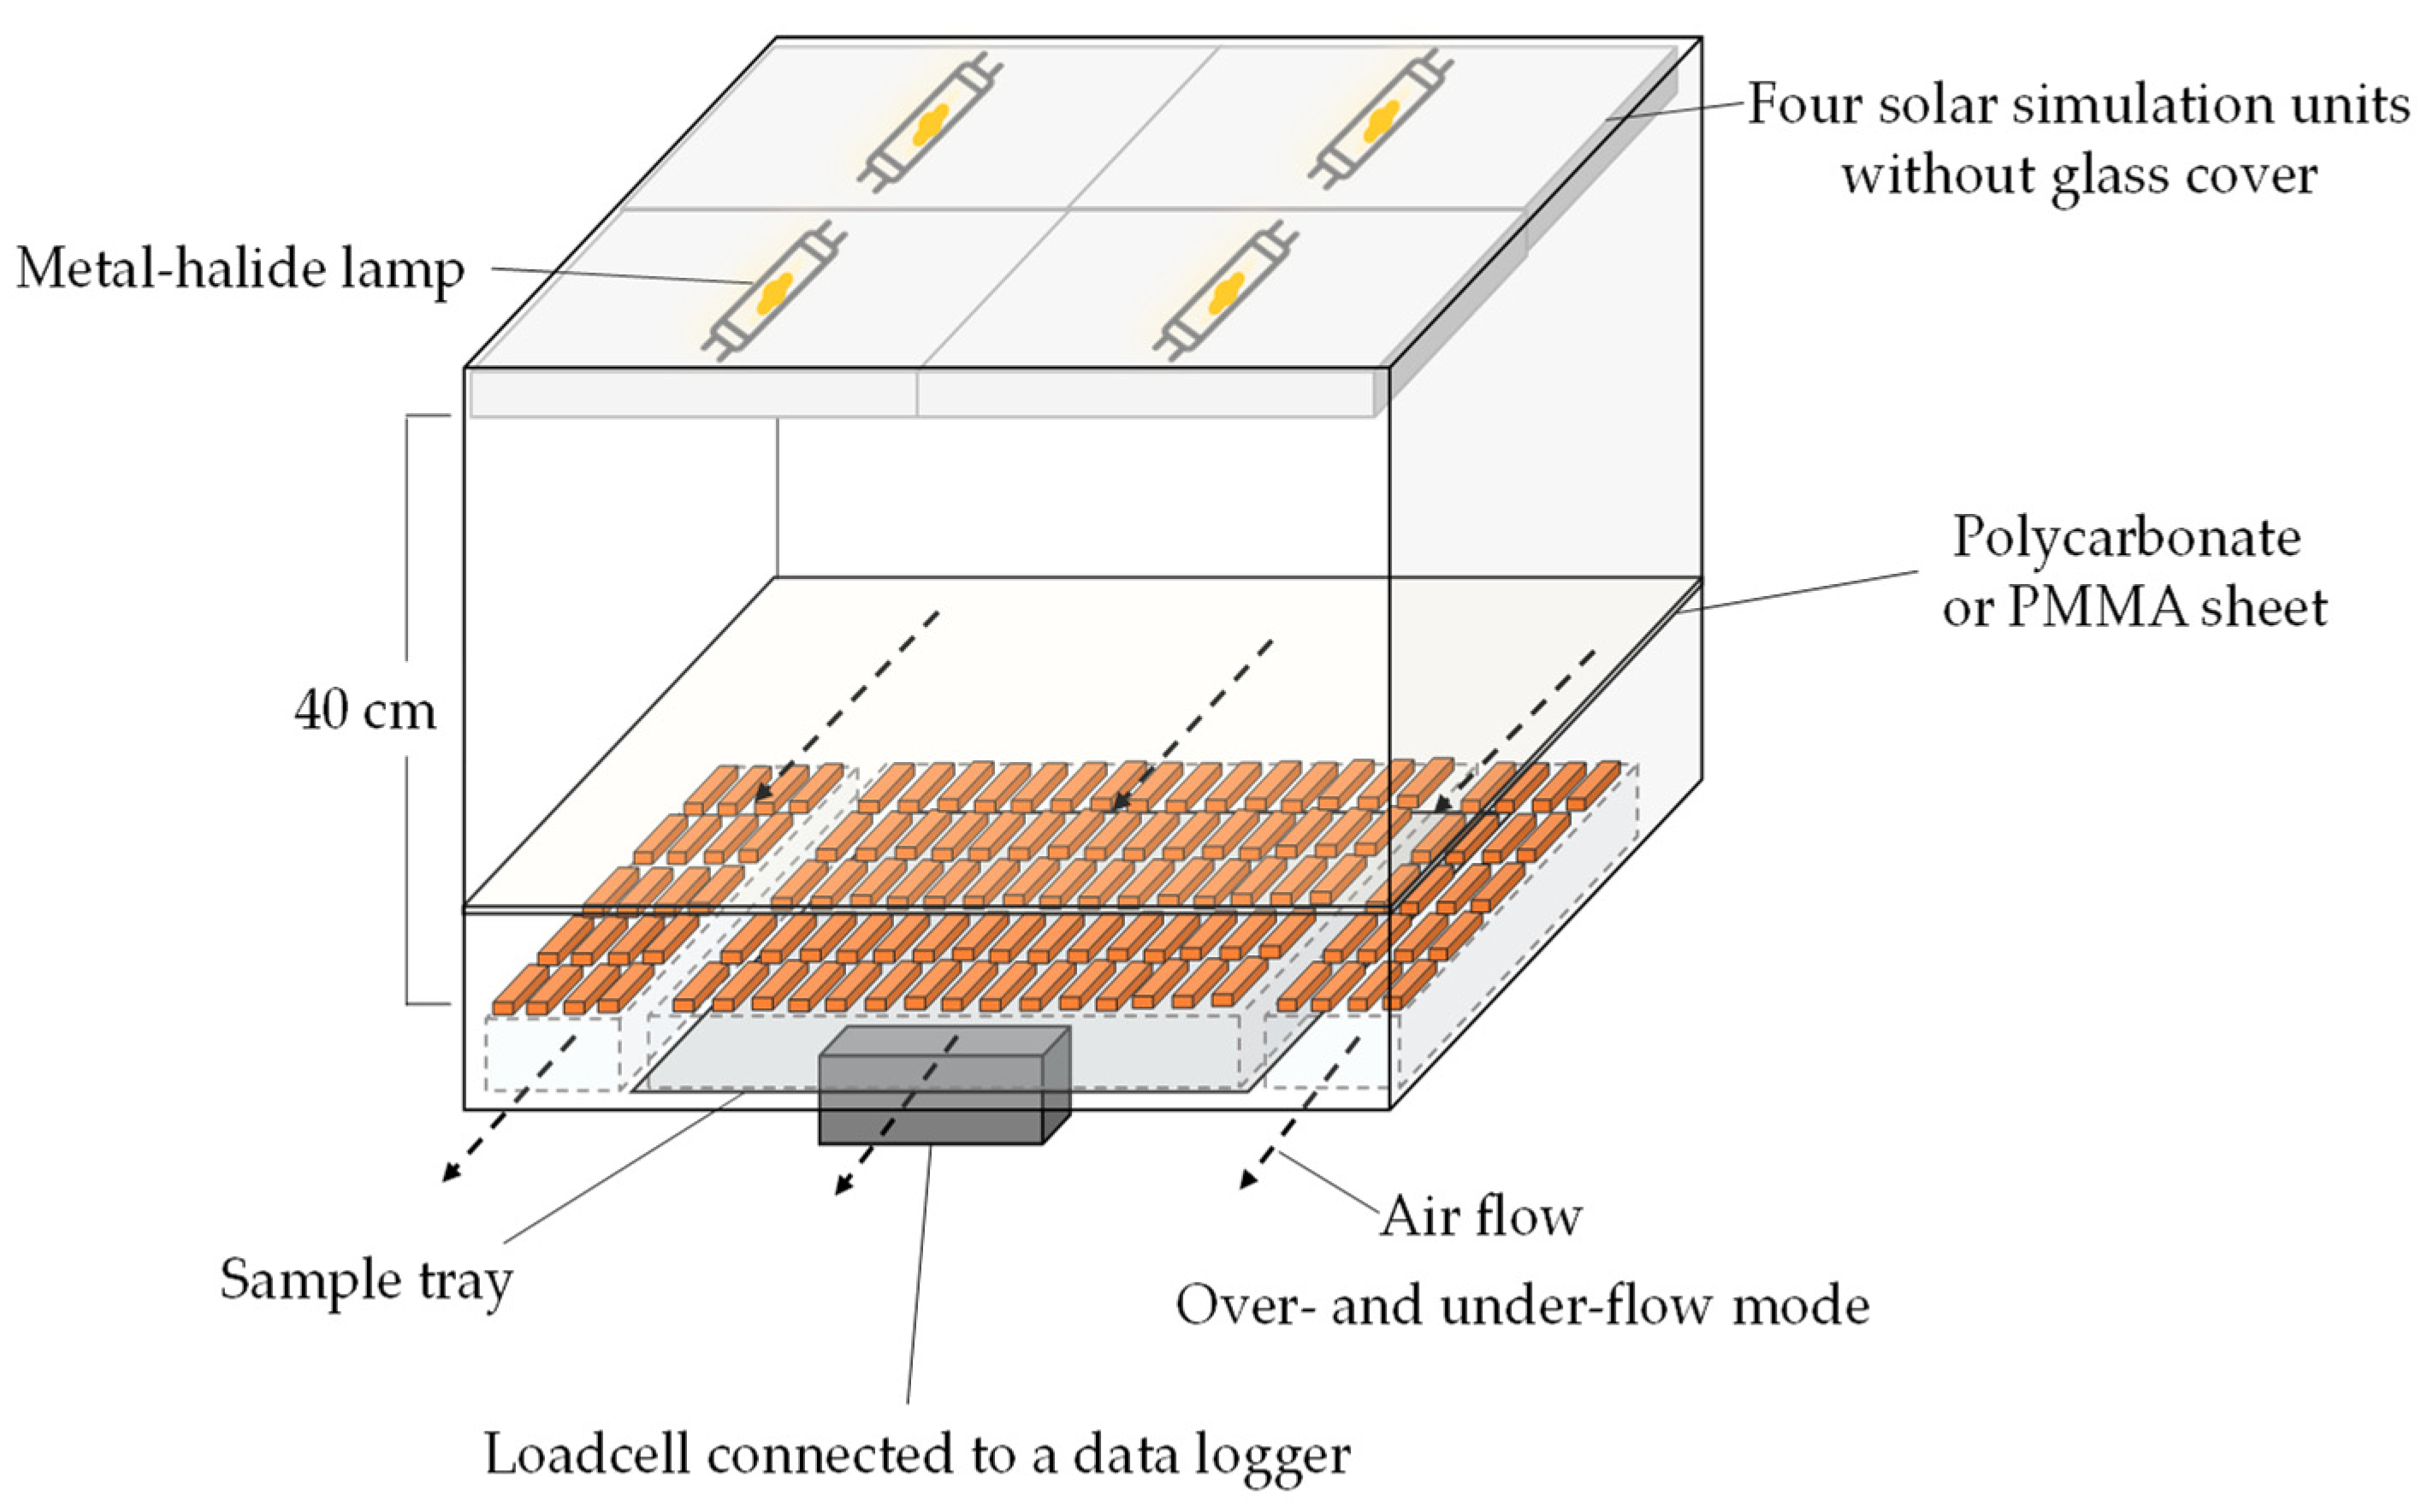
2.3.1. Experimental Set Up
2.3.2. Drying Experiment
2.4. Evaluation of Drying Characteristics
2.5. Thin Layer Drying Models
2.6. Color Measurement
2.7. Methanolic Extraction
2.8. Chromatographic Analysis of Curcuminoids
2.9. Statistical Analysis
3. Results and Discussion
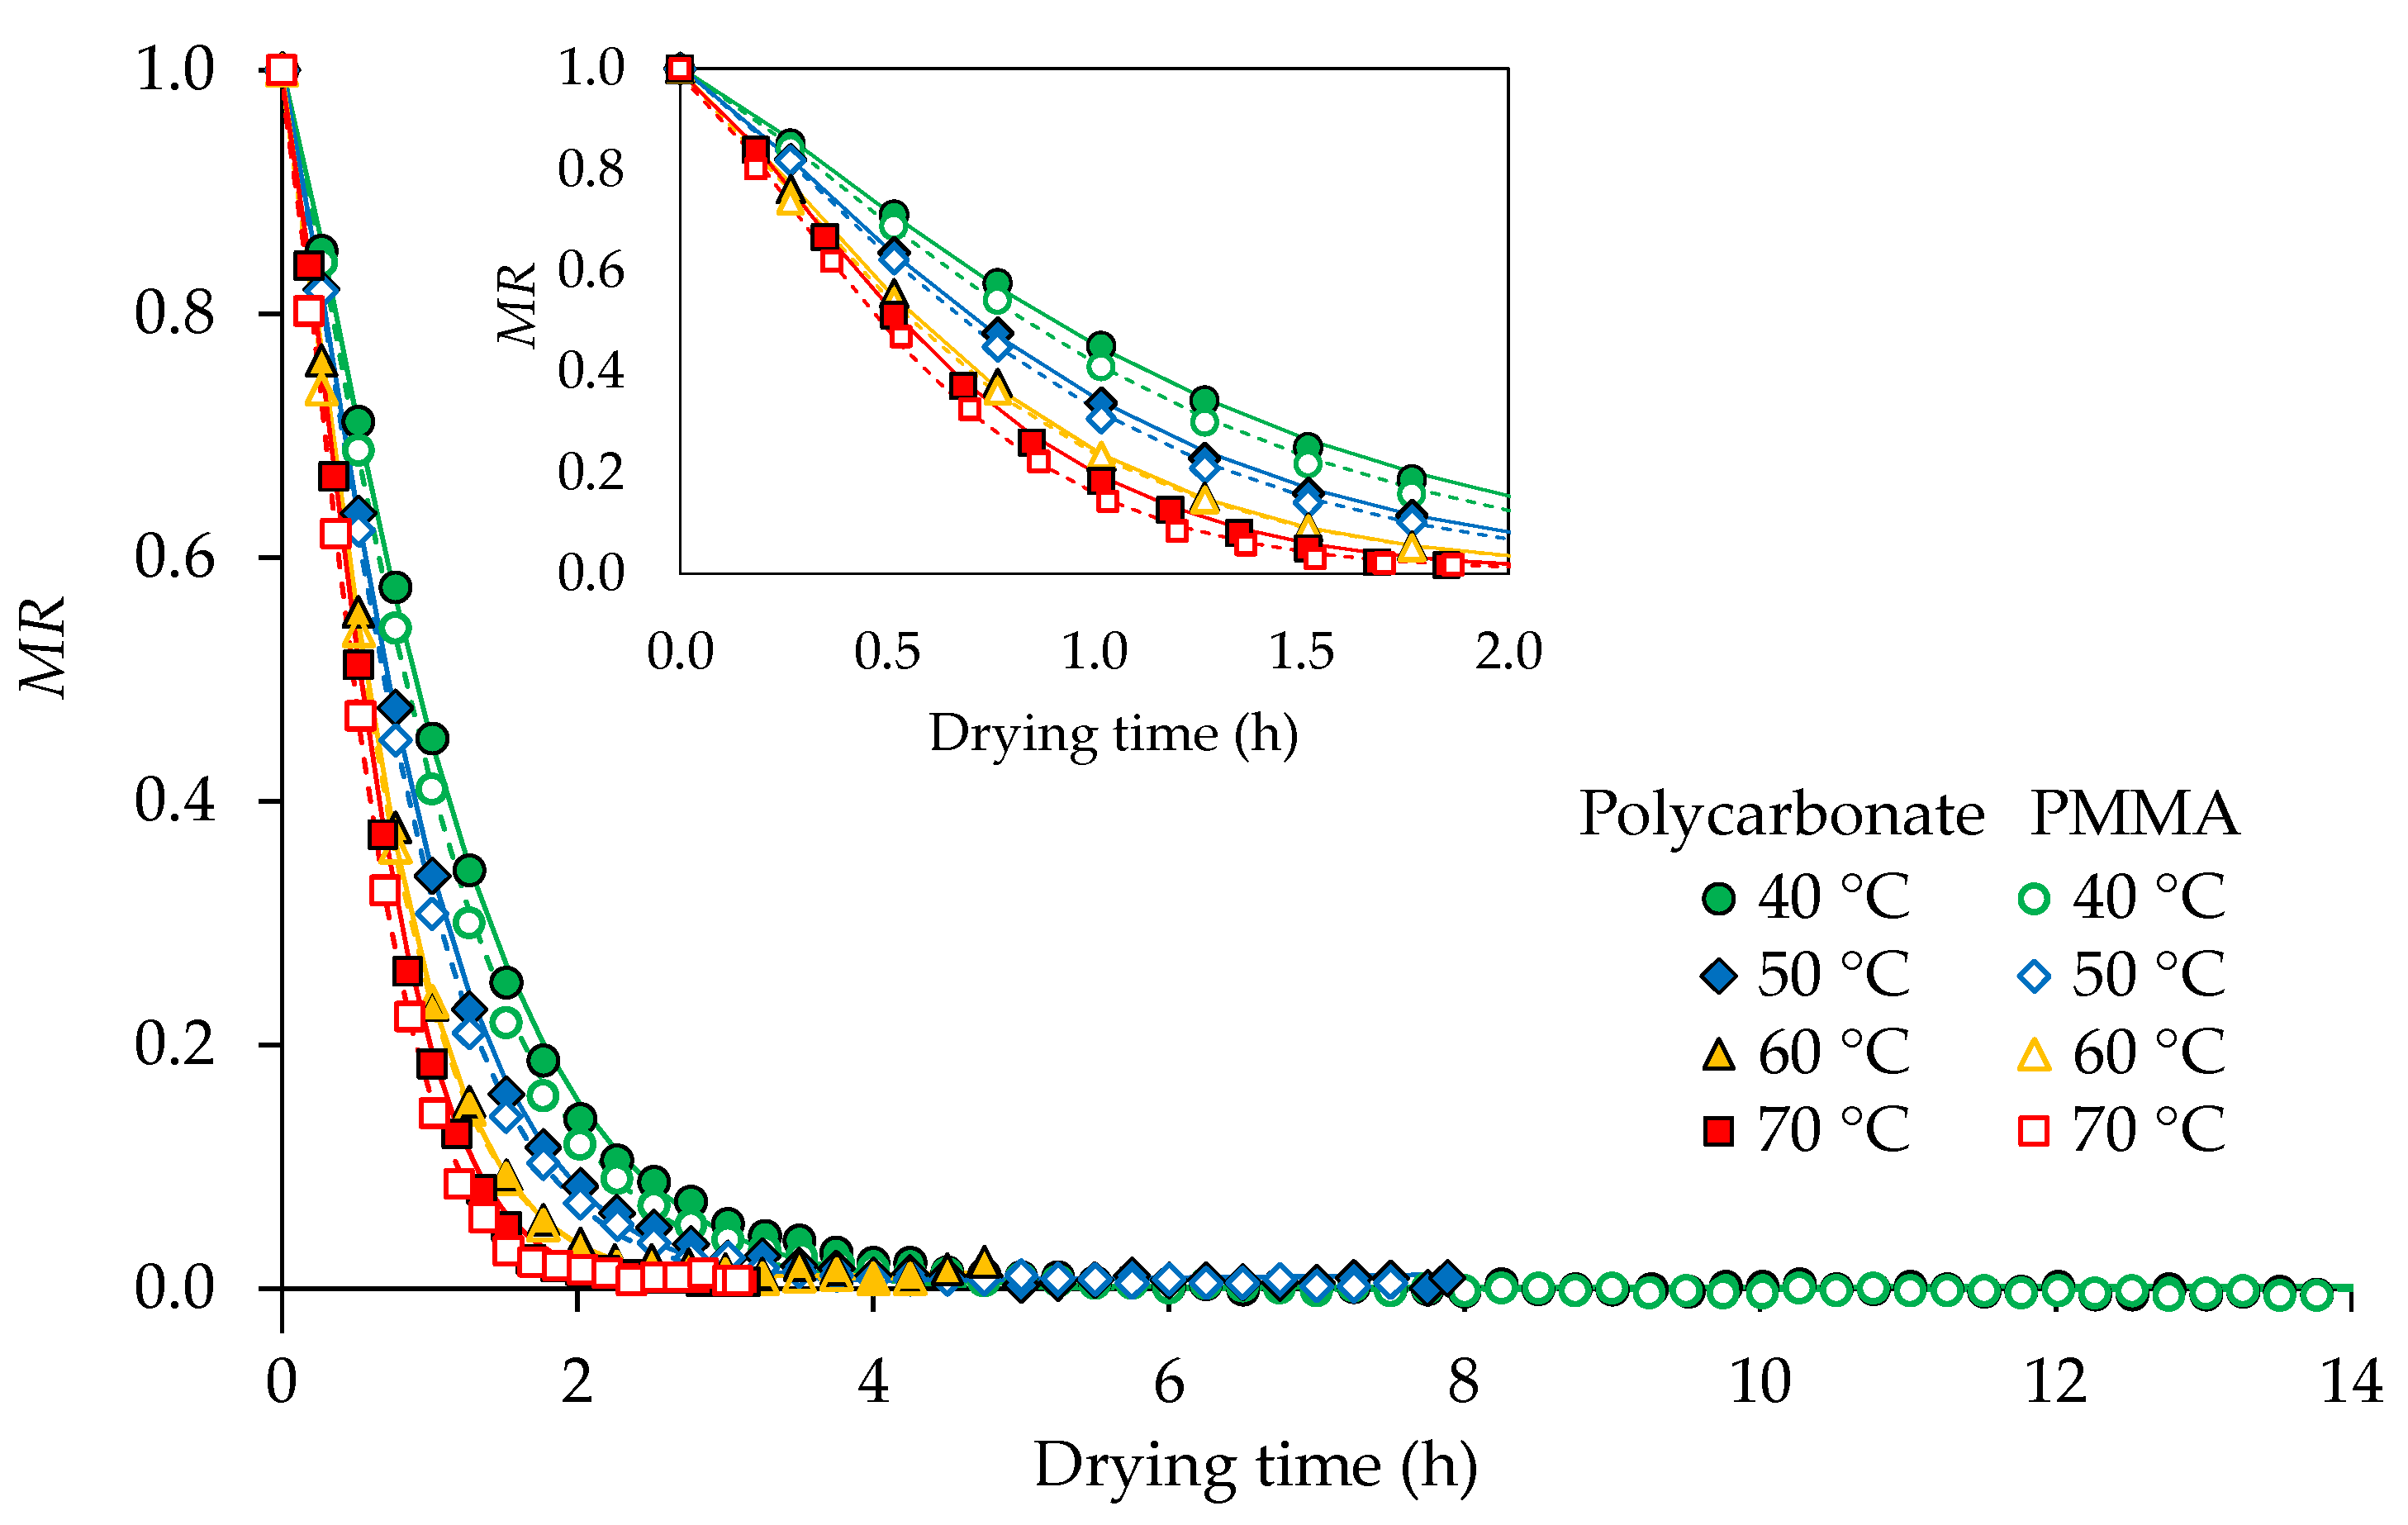
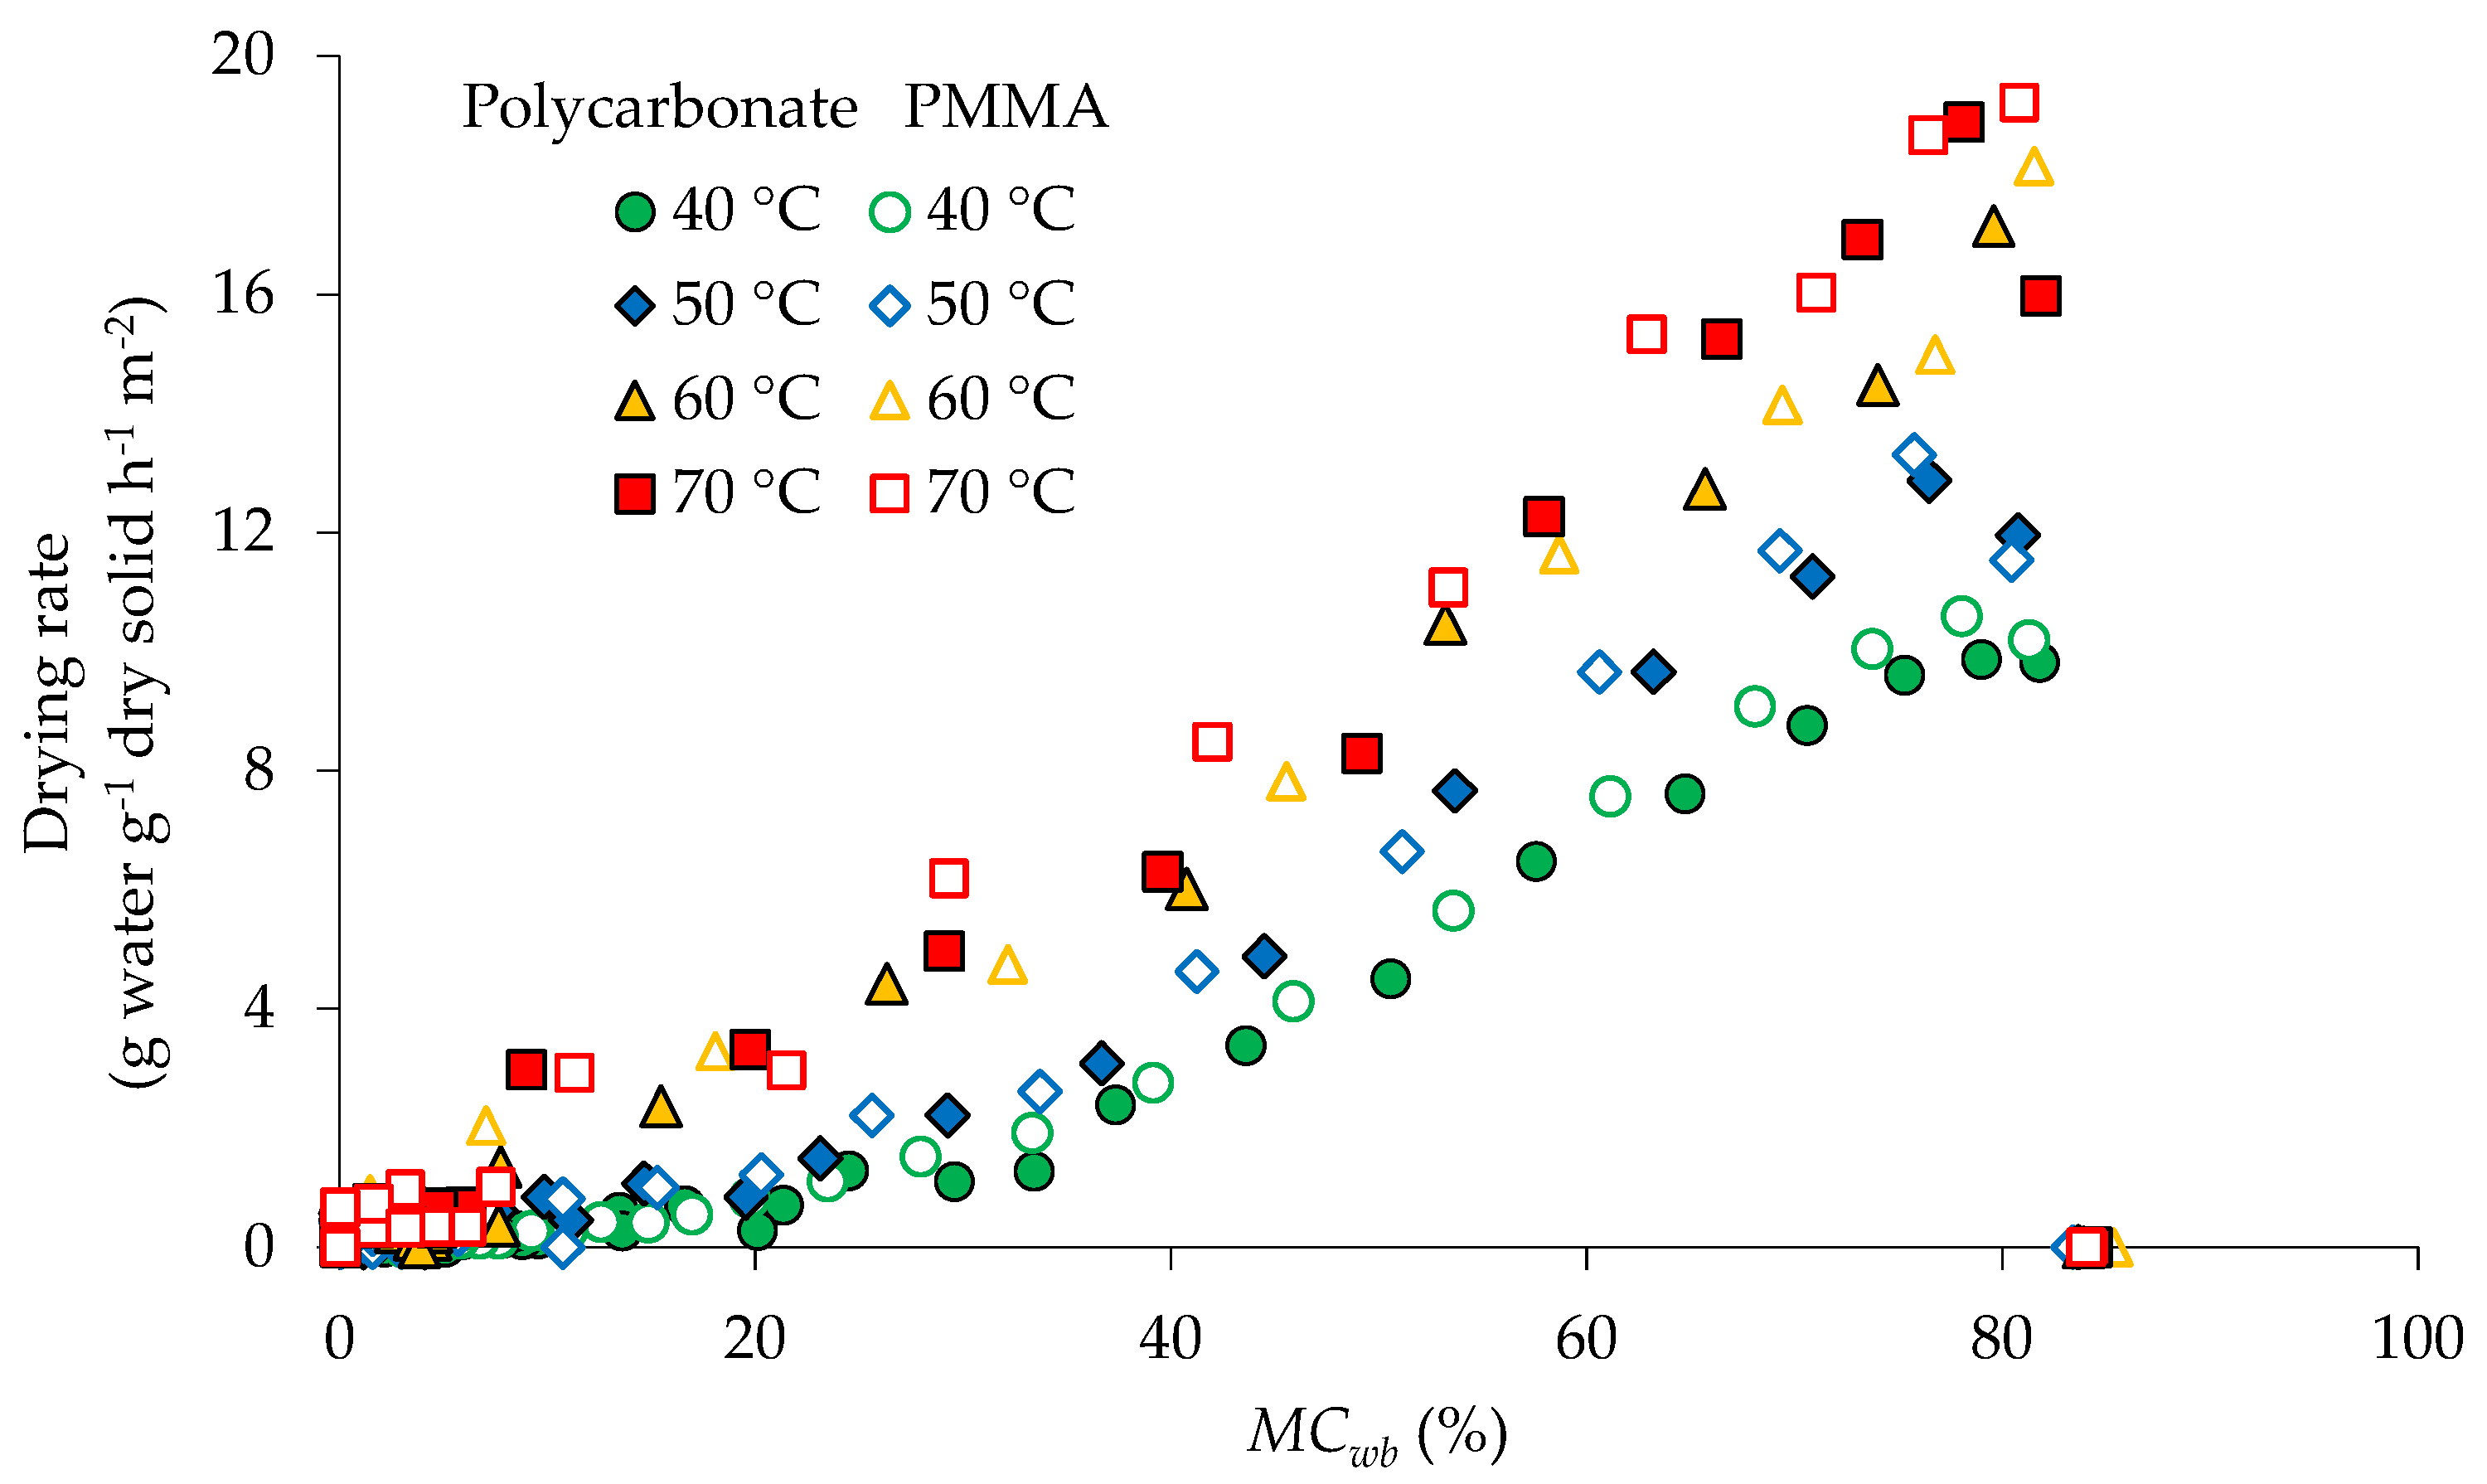
3.1. Drying Characteristics
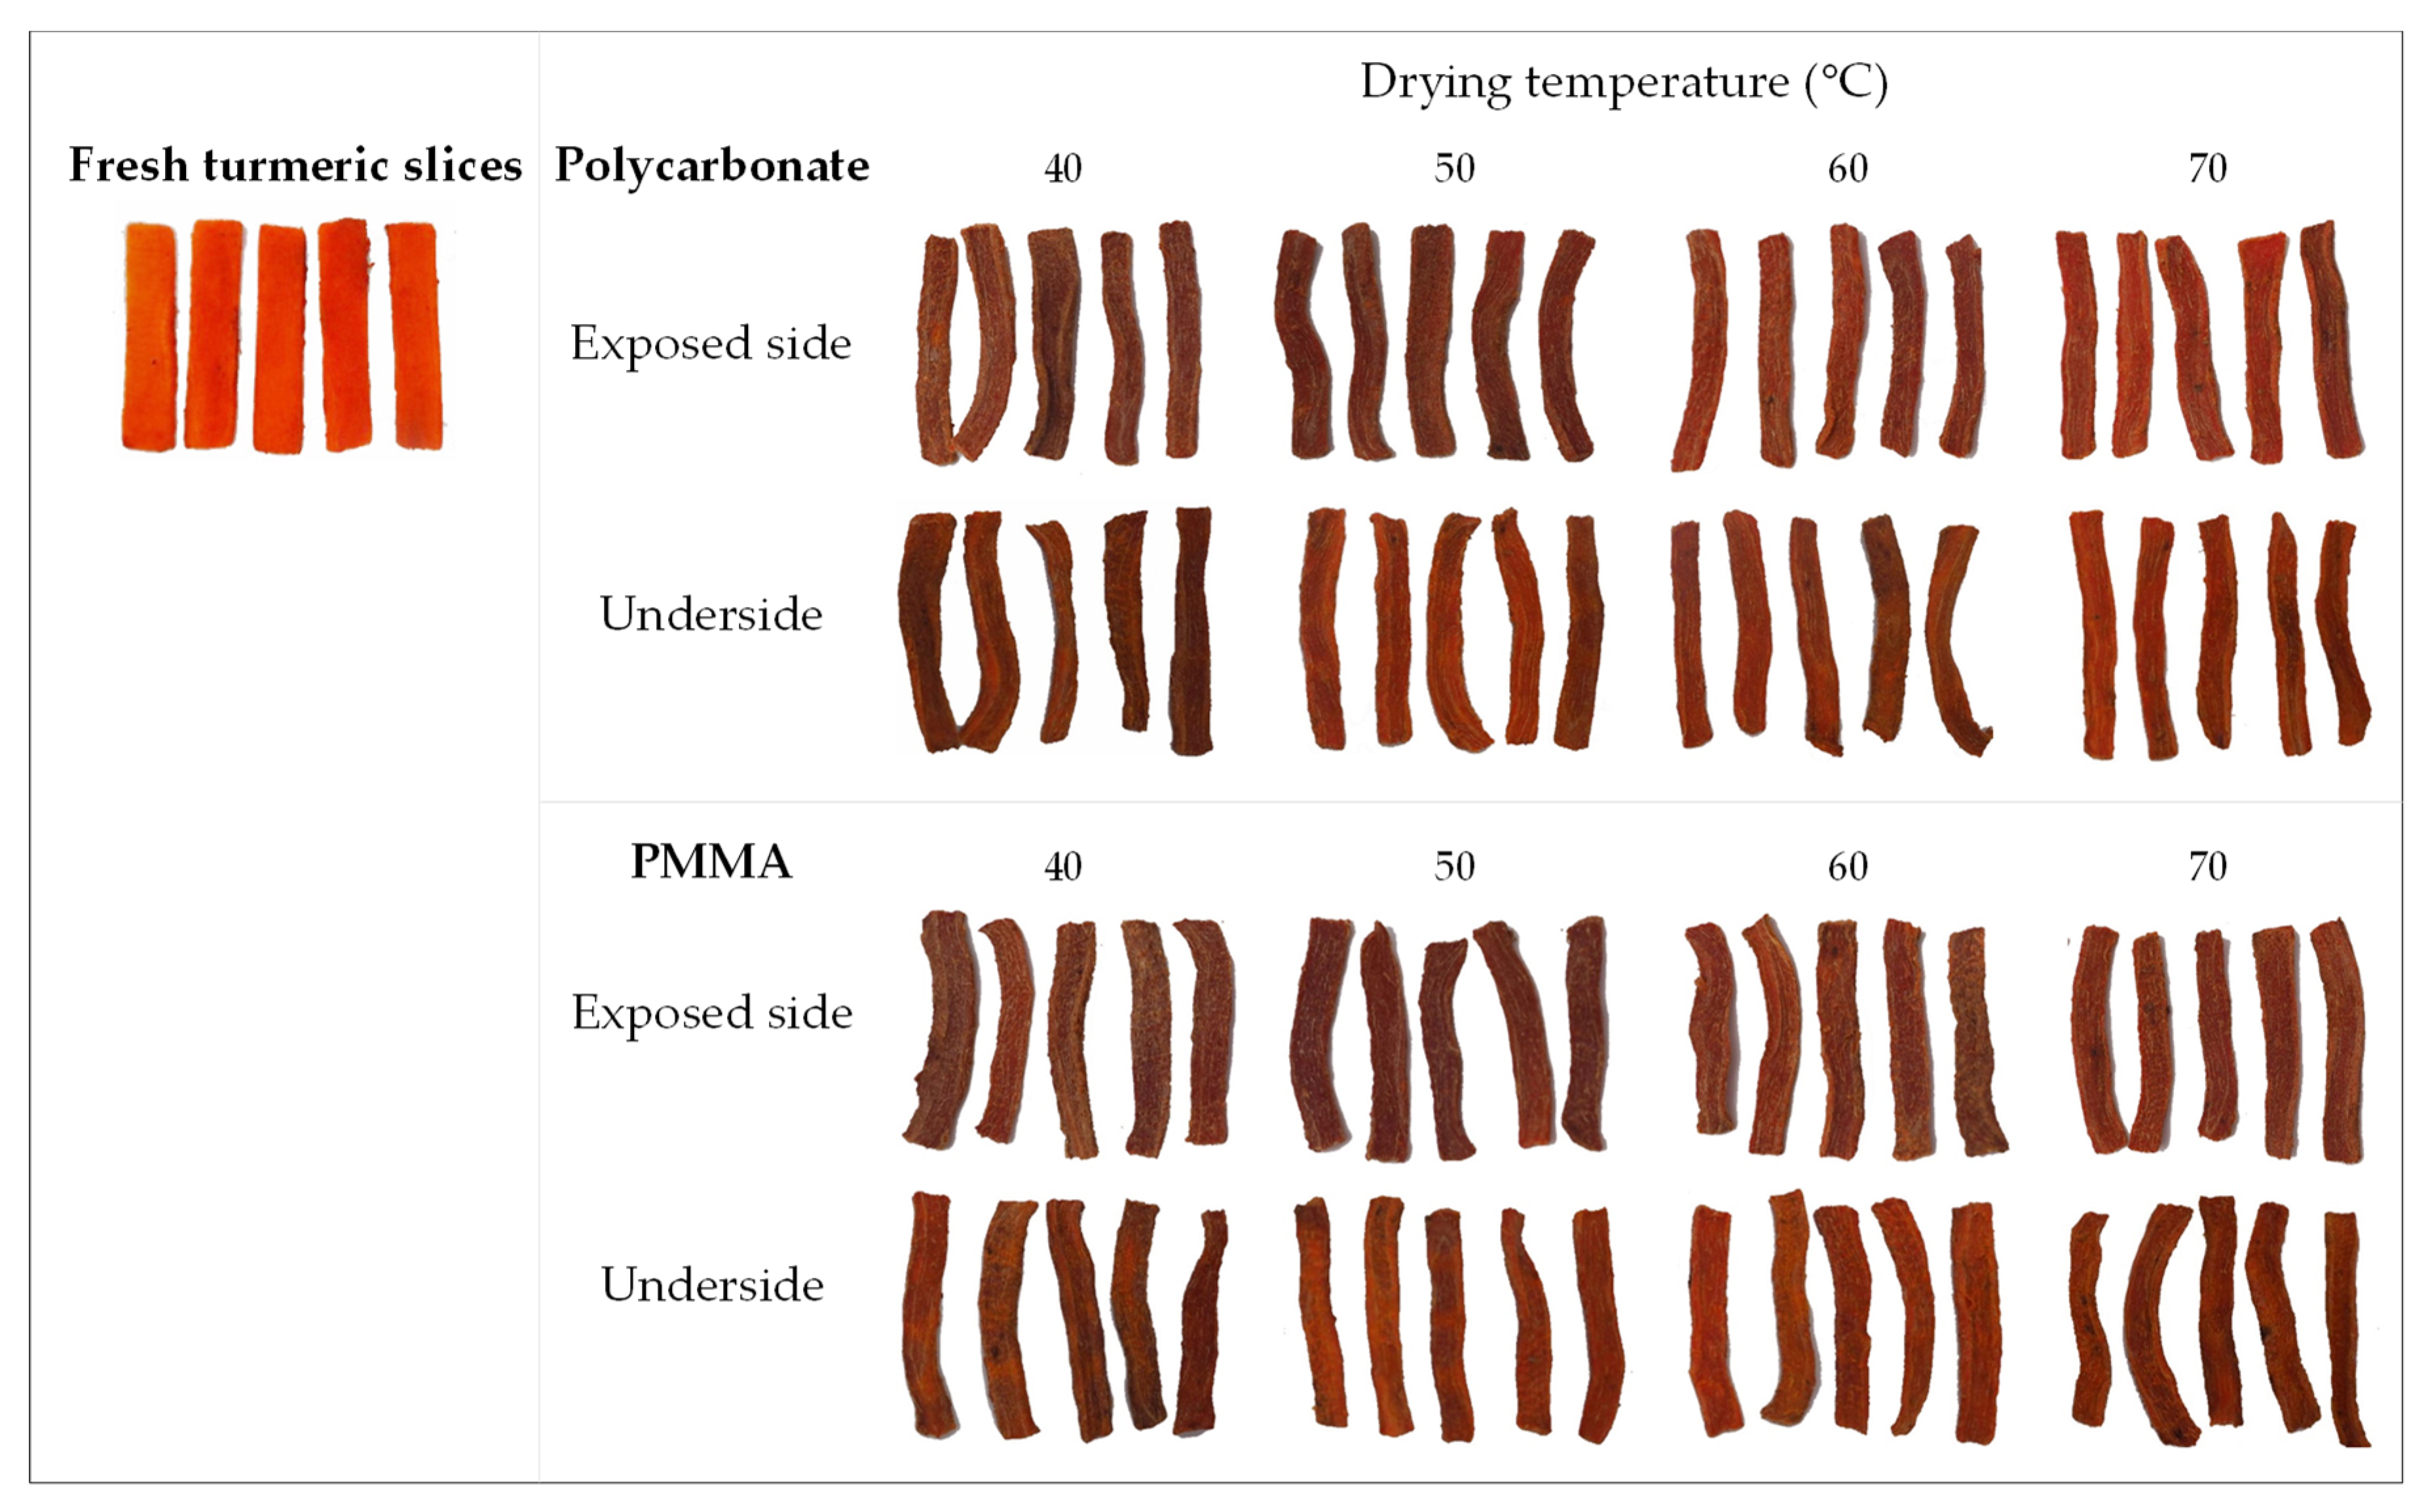
3.2. Appearance and Color Measurement
3.3. Degradation of Curcuminoids
4. Conclusions
Author Contributions
Funding
Institutional Review Board Statement
Informed Consent Statement
Data Availability Statement
Conflicts of Interest
Appendix A. Supplementary Data

| Temperature (°C) | Cover Materials | Newton | Page | Modified Page | Henderson and Pabis | Midilli and Kucuk | |||||||||||||||||||||
|---|---|---|---|---|---|---|---|---|---|---|---|---|---|---|---|---|---|---|---|---|---|---|---|---|---|---|---|
| k | R2 | RMSE | AIC | k | n | R2 | RMSE | AIC | k | n | R2 | RMSE | AIC | k | a | R2 | RMSE | AIC | a | k | n | b | R2 | RMSE | AIC | ||
| 40 | Polycarbonate | 0.8547 | 0.9899 | 0.0295 | −84.34 | 0.7930 | 1.2225 | 0.9986 | 0.0110 | −123.82 | 0.8272 | 1.2225 | 0.9986 | 0.0110 | −123.82 | 0.9002 | 1.0576 | 0.9931 | 0.0245 | −90.14 | 0.9992 | 0.8021 | 1.2700 | 0.0037 | 0.9994 | 0.0074 | −136.32 |
| PMMA | 0.9344 | 0.9888 | 0.0306 | −83.90 | 0.8778 | 1.2462 | 0.9987 | 0.0080 | −130.62 | 0.9007 | 1.2462 | 0.9987 | 0.0080 | −130.62 | 0.9842 | 1.0587 | 0.9921 | 0.0256 | −78.74 | 0.9994 | 0.8874 | 1.2803 | 0.0030 | 0.9995 | 0.0049 | −146.10 | |
| 50 | Polycarbonate | 1.0205 | 0.9888 | 0.0320 | −64.80 | 0.9823 | 1.2446 | 0.9987 | 0.0108 | −101.84 | 0.9858 | 1.2446 | 0.9987 | 0.0108 | −101.84 | 1.0731 | 1.0566 | 0.9920 | 0.0271 | −68.48 | 1.0012 | 1.0076 | 1.2946 | 0.0051 | 0.9996 | 0.0060 | −117.86 |
| PMMA | 1.1373 | 0.9882 | 0.0331 | −59.70 | 1.1218 | 1.2423 | 0.9992 | 0.0086 | −100.88 | 1.0948 | 1.2679 | 0.9992 | 0.0086 | −100.88 | 1.1946 | 1.0561 | 0.9914 | 0.0284 | −62.60 | 1.0018 | 1.1488 | 1.3039 | 0.0042 | 0.9998 | 0.0045 | −117.38 | |
| 60 | Polycarbonate | 1.3935 | 0.9884 | 0.0340 | −43.50 | 1.4431 | 1.2703 | 0.9996 | 0.0065 | −80.88 | 1.3473 | 1.2703 | 0.9996 | 0.0065 | −80.88 | 1.4463 | 1.0434 | 0.9905 | 0.0308 | −43.10 | 0.9965 | 1.4594 | 1.2940 | 0.0026 | 0.9997 | 0.0057 | −79.90 |
| PMMA | 1.4653 | 0.9885 | 0.0343 | −38.58 | 1.5248 | 1.2545 | 0.9990 | 0.0103 | −63.46 | 1.3998 | 1.2545 | 0.9990 | 0.0103 | −63.46 | 1.5122 | 1.0370 | 0.9901 | 0.0319 | −38.96 | 0.9956 | 1.4715 | 1.2233 | −0.0063 | 0.9994 | 0.0081 | −64.80 | |
| 70 | Polycarbonate | 1.5337 | 0.9788 | 0.0468 | −41.98 | 1.6728 | 1.3594 | 0.9997 | 0.0054 | −100.26 | 1.4601 | 1.3593 | 0.9997 | 0.0054 | −100.26 | 1.6294 | 1.0706 | 0.9841 | 0.0405 | −44.04 | 0.9968 | 1.6522 | 1.3542 | −0.0021 | 0.9998 | 0.0050 | −98.54 |
| PMMA | 1.6571 | 0.9828 | 0.0413 | −48.44 | 1.8220 | 1.3223 | 0.9988 | 0.0108 | −81.18 | 1.5741 | 1.3223 | 0.9988 | 0.0108 | −81.18 | 1.7370 | 1.0555 | 0.9861 | 0.0372 | −43.48 | 0.9885 | 1.8189 | 1.3479 | 0.0007 | 0.9989 | 0.0103 | −78.46 | |
References
- Esper, A.; Mühlbauer, W. Solar drying—An effective means of food preservation. Renew. Energy 1998, 15, 95–100. [Google Scholar] [CrossRef]
- Müller, J.; Mühlbauer, W. Solar Drying. In Modern Drying Technology; Tsotsas, E., Mujumdar, A.S., Eds.; Wiley-VCH Verlag & Co. KGaA: Weinheim, Germany, 2012; Volume 4, pp. 199–243. ISBN 9783527315598. [Google Scholar]
- Udomkun, P.; Romuli, S.; Schock, S.; Mahayothee, B.; Sartas, M.; Wossen, T.; Njukwe, E.; Vanlauwe, B.; Müller, J. Review of solar dryers for agricultural products in Asia and Africa: An innovation landscape approach. J. Environ. Manag. 2020, 268, 110730. [Google Scholar] [CrossRef] [PubMed]
- Prasad, J.; Vijay, V.K.; Tiwari, G.N.; Sorayan, V.P.S. Study on performance evaluation of hybrid drier for turmeric (Curcuma longa L.) drying at village scale. J. Food Eng. 2006, 75, 497–502. [Google Scholar] [CrossRef]
- Ssemwanga, M.; Makule, E.; Kayondo, S.I. Performance analysis of an improved solar dryer integrated with multiple metallic solar concentrators for drying fruits. Sol. Energy 2020, 204, 419–428. [Google Scholar] [CrossRef]
- Janjai, S.; Lamlert, N.; Intawee, P.; Mahayothee, B.; Boonrod, Y.; Haewsungcharern, M.; Bala, B.K.; Nagle, M.; Müller, J. Solar drying of peeled longan using a side loading type solar tunnel dryer: Experimental and simulated performance. Dry. Technol. 2009, 27, 595–605. [Google Scholar] [CrossRef]
- Kumar, A.; Singh, R.; Prakash, O.; Ashutosh. Review on global solar drying status. Agric. Eng. Int. CIGR J. 2014, 16, 161–177. [Google Scholar]
- Janjai, S.; Khamvongsa, V.; Bala, B.K. Development, design, and performance of a PV-ventilated greenhouse dryer. Int. Energy J. 2007, 8, 249–258. [Google Scholar]
- Nabnean, S.; Nimnuan, P. Case studies in thermal engineering experimental performance of direct forced convection household solar dryer for drying banana. Case Stud. Therm. Eng. 2020, 22, 100787. [Google Scholar] [CrossRef]
- Singh, S.; Kumar, S. Testing method for thermal performance based rating of various solar dryer designs. Sol. Energy 2012, 86, 87–98. [Google Scholar] [CrossRef]
- Condorí, M.; Echazú, R.; Saravia, L. Solar drying of sweet pepper and garlic using the tunnel greenhouse drier. Renew. Energy 2001, 22, 447–460. [Google Scholar] [CrossRef]
- Rodríguez-Ramírez, J.; Mendez-Lagunas, L.L.; Ĺopez-Ortiz, A.; Muñiz-Becerá, S. Nair, K. Solar drying of strawberry using polycarbonate with UV protection and polyethylene covers: Influence on anthocyanin and total phenolic content. Sol. Energy 2021, 221, 120–130. [Google Scholar] [CrossRef]
- Elkhadraoui, A.; Kooli, S.; Hamdi, I.; Farhat, A. Experimental investigation and economic evaluation of a new mixed-mode solar greenhouse dryer for drying of red pepper and grape. Renew. Energy 2015, 77, 1–8. [Google Scholar] [CrossRef]
- Janjai, S.; Intawee, P.; Kaewkiew, J.; Sritus, C.; Khamvongsa, V. A large-scale solar greenhouse dryer using polycarbonate cover: Modeling and testing in a tropical environment of Lao People’s Democratic Republic. Renew. Energy 2011, 36, 1053–1062. [Google Scholar] [CrossRef]
- Janjai, S.; Keawprasert, T. Design and performance of a solar tunnel dryer with a polycarbonate cover. Int. Energy J. 2006, 7, 187–194. [Google Scholar]
- Serrano, M.A.; Moreno, J.C. Spectral transmission of solar radiation by plastic and glass materials. J. Photochem. Photobiol. B Biol. 2020, 208, 111894. [Google Scholar] [CrossRef]
- Janjai, S. A greenhouse type solar dryer for small-scale dried food industries: Development and dissemination. Int. J. Energy Environ. 2012, 3, 383–398. [Google Scholar]
- Devan, P.K.; Bibin, C.; Asburris Shabrin, I.; Gokulnath, R.; Karthick, D. Solar drying of fruits—A comprehensive review. Mater. Today Proc. 2020, 33, 253–260. [Google Scholar] [CrossRef]
- Mohammed, S.; Edna, M.; Siraj, K. The effect of traditional and improved solar drying methods on the sensory quality and nutritional composition of fruits: A case of mangoes and pineapples. Heliyon 2020, 6, e04163. [Google Scholar] [CrossRef]
- Nelson, K.M.; Dahlin, J.L.; Bisson, J.; Graham, J.; Pauli, G.F.; Walters, M.A. The essential medicinal chemistry of curcumin. J. Med. Chem. 2017, 60, 1620–1637. [Google Scholar] [CrossRef]
- Sandur, S.K.; Pandey, M.K.; Sung, B.; Ahn, K.S.; Murakami, A.; Sethi, G.; Limtrakul, P.; Badmaev, V.; Aggarwal, B.B. Curcumin, demethoxycurcumin, bisdemethoxycurcumin, tetrahydrocurcumin and turmerones differentially regulate anti-inflammatory and anti-proliferative responses through a ROS-independent mechanism. J. Carcinog. 2007, 28, 1765–1773. [Google Scholar] [CrossRef]
- Suksamrarn, A.; Ponglikitmongkol, M.; Wongkrajang, K.; Chindaduang, A.; Kittidanairak, S.; Jankam, A.; Yingyongnarongkul, B.E.; Kittipanumat, N.; Chokchaisiri, R.; Khetkam, P.; et al. Diarylheptanoids, new phytoestrogens from the rhizomes of Curcuma comosa: Isolation, chemical modification and estrogenic activity evaluation. Bioorg. Med. Chem. 2008, 16, 6891–6902. [Google Scholar] [CrossRef] [PubMed]
- Mondal, S.; Ghosh, S.; Moulik, S.P. Biology stability of curcumin in different solvent and solution media: UV—visible and steady-state fluorescence spectral study. JPB 2016, 158, 212–218. [Google Scholar] [CrossRef]
- Tønnensen, H.H.; Karlsen, J.; van Henegouwen, G.B. Studies on curcumin and curcuminoids. Z. Lebensm. Unters. Forsch. 1986, 183, 116–122. [Google Scholar] [CrossRef] [PubMed]
- Lee, B.H.; Choi, H.A.; Kim, M.R.; Hong, J. Changes in chemical stability and bioactivities of curcumin by ultraviolet radiation. Food Sci. Biotechnol. 2013, 22, 279–282. [Google Scholar] [CrossRef]
- Heger, M.; Van Golen, R.F.; Broekgaarden, M.; Michel, M.C. The molecular basis for the pharmacokinetics and pharmacodynamics of curcumin and its metabolites in relation to cancers. Pharmacol. Rev. 2014, 66, 222–307. [Google Scholar] [CrossRef] [PubMed]
- Raza, A.; Ali, M.A.; Yusof, Y.A.; Nasir, A.; Muneer, S. Effect of different drying treatments on concentration of curcumin in raw Curcuma longa L. Food Res. 2018, 6, 500–504. [Google Scholar] [CrossRef]
- Mahayothee, B.; Thamsala, T.; Khuwijitjaru, P.; Janjai, S. Effect of drying temperature and drying method on drying rate and bioactive compounds in cassumunar ginger (Zingiber montanum). J. Appl. Res. Med. Aromat. Plants 2020, 18, 100262. [Google Scholar] [CrossRef]
- Argyropoulos, D.; Heindl, A.; Müller, J. Assessment of convection, hot-air combined with microwave-vacuum and freeze-drying methods for mushrooms with regard to product quality. Int. J. Food Sci. Technol. 2011, 46, 333–342. [Google Scholar] [CrossRef]
- FAO. Turmeric: Post-Harvest Operations; Food and Agricultural Organization of the United Nations: Rome, Italy, 2004. [Google Scholar]
- Crank, J. The Mathematics of Diffusion, 2nd ed.; Clarendon Press: Oxford, UK, 1975. [Google Scholar]
- Özdemir, M.; Onur Devres, Y. Thin layer drying characteristics of hazelnuts during roasting. J. Food Eng. 1999, 42, 225–233. [Google Scholar] [CrossRef]
- Lewis, W.K. The rate of drying of solid materials. J. Ind. Eng. Chem. 1921, 13, 427–432. [Google Scholar] [CrossRef]
- Page, G.E. Factors influencing the maximum rates of air drying shelled corn in thin layers. Master’s Thesis, Department of Mechanical Engineering, Purdue University, West Lafayette, IN, USA, 1949. [Google Scholar]
- Overhults, D.G.; White, G.M.; Hamilton, H.E.; Ross, I.J. Drying soybeans with heated air. Trans. ASAE 1973, 16, 112–113. [Google Scholar] [CrossRef]
- Midilli, A.; Kucuk, H. Mathematical modeling of thin layer drying of pistachio by using solar energy. Energy Convers. Manag. 2003, 44, 1111–1122. [Google Scholar] [CrossRef]
- Akaike, H. A new look at the statistical model identification. IEEE Trans. Automat. Contr. 1974, 19, 716–723. [Google Scholar] [CrossRef]
- R Development Core Team. R: A Language and Environment for Statistical Computing; R Function for Statistical Computing: Veinna, Austria, 2008; Volume 2, ISBN 3900051070. Available online: https://www.R-project.org (accessed on 26 November 2020).
- Jödicke, K.; Arendt, S.; Hofacker, W.; Speckle, W. The influence of process parameters on the quality of dried agricultural products determined using the cumulated thermal load. Dry. Technol. 2020, 38, 321–332. [Google Scholar] [CrossRef]
- Ibrahim, D.; Zamfirescu, C. Drying Phenomena: Theory and Applications, 1st ed.; John Wiley & Sons, Ltd.: Hoboken, NJ, USA, 2016. [Google Scholar]
- Jayas, D.S.; Cenkowski, S.; Pabis, S.; Muir, W.E. Review of thin-layer drying and wetting equations review of thin-layer. Dry. Technol. 1991, 9, 551–588. [Google Scholar] [CrossRef]
- Pal, K.; Chowdhury, S.; Dutta, S.K.; Chakraborty, S.; Chakraborty, M.; Pandit, G.K.; Dutta, S.; Paul, P.K.; Choudhury, A.; Majumder, B.; et al. Analysis of rhizome colour content, bioactive compound profiling and ex-situ conservation of turmeric genotypes (Curcuma longa L.) from sub-Himalayan terai region of India. Ind. Crops Prod. 2020, 150, 112401. [Google Scholar] [CrossRef]
- Wichitnithad, W.; Jongaroonngamsang, N.; Pummangura, S.; Rojsitthisak, P. A simple isocratic HPLC method for the simultaneous determination of curcuminoids in commercial turmeric extracts. Phytochem. Anal. 2009, 20, 314–319. [Google Scholar] [CrossRef]
- Komonsing, N.; Khuwijitjaru, P.; Nagle, M.; Müller, J.; Mahayothee, B. Effect of drying temperature together with light on drying characteristics and bioactive compounds in turmeric slice. J. Food Eng. 2022, 317, 110695. [Google Scholar] [CrossRef]
- Priyadarsini, K.I. Photophysics, photochemistry and photobiology of curcumin: Studies from organic solutions, bio-mimetics and living cells. J. Photochem. Photobiol. C Photochem. Rev. 2009, 10, 81–95. [Google Scholar] [CrossRef]
- Chumroenphat, T.; Somboonwatthanakul, I.; Saensouk, S.; Siriamornpun, S. Changes in curcuminoids and chemical components of turmeric (Curcuma longa L.) under freeze-drying and low-temperature drying methods. Food Chem. 2021, 339, 128121. [Google Scholar] [CrossRef]
- Souza, C.R.A.; Osme, S.F.; Glória, M.B.A. Stability of curcuminoid pigments in model systems. J. Food Process. Preserv. 1997, 21, 353–363. [Google Scholar] [CrossRef]
- Suyitno, S.; Maret, U.S.; Kristiawan, B.; Maret, U.S.; Wibowo, A.H.; Maret, U.S. Effect of light and temperature on the efficiency and stability of curcumin- dye-sensitized solar cells. Int. Energy J. 2018, 18, 53–60. [Google Scholar]
- Tønnesen, H.H.; Karlsen, J. Studies on curcumin and curcuminoids—V. Alkaline Degradation of Curcumin. Z. Lebensm. Unters. Forsch. 1985, 180, 132–134. [Google Scholar] [CrossRef]

 polycarbonate and
  PMMA. k: drying rate.
polycarbonate and PMMA. k: drying rate.
PMMA. k: drying rate.
polycarbonate and PMMA. k: drying rate.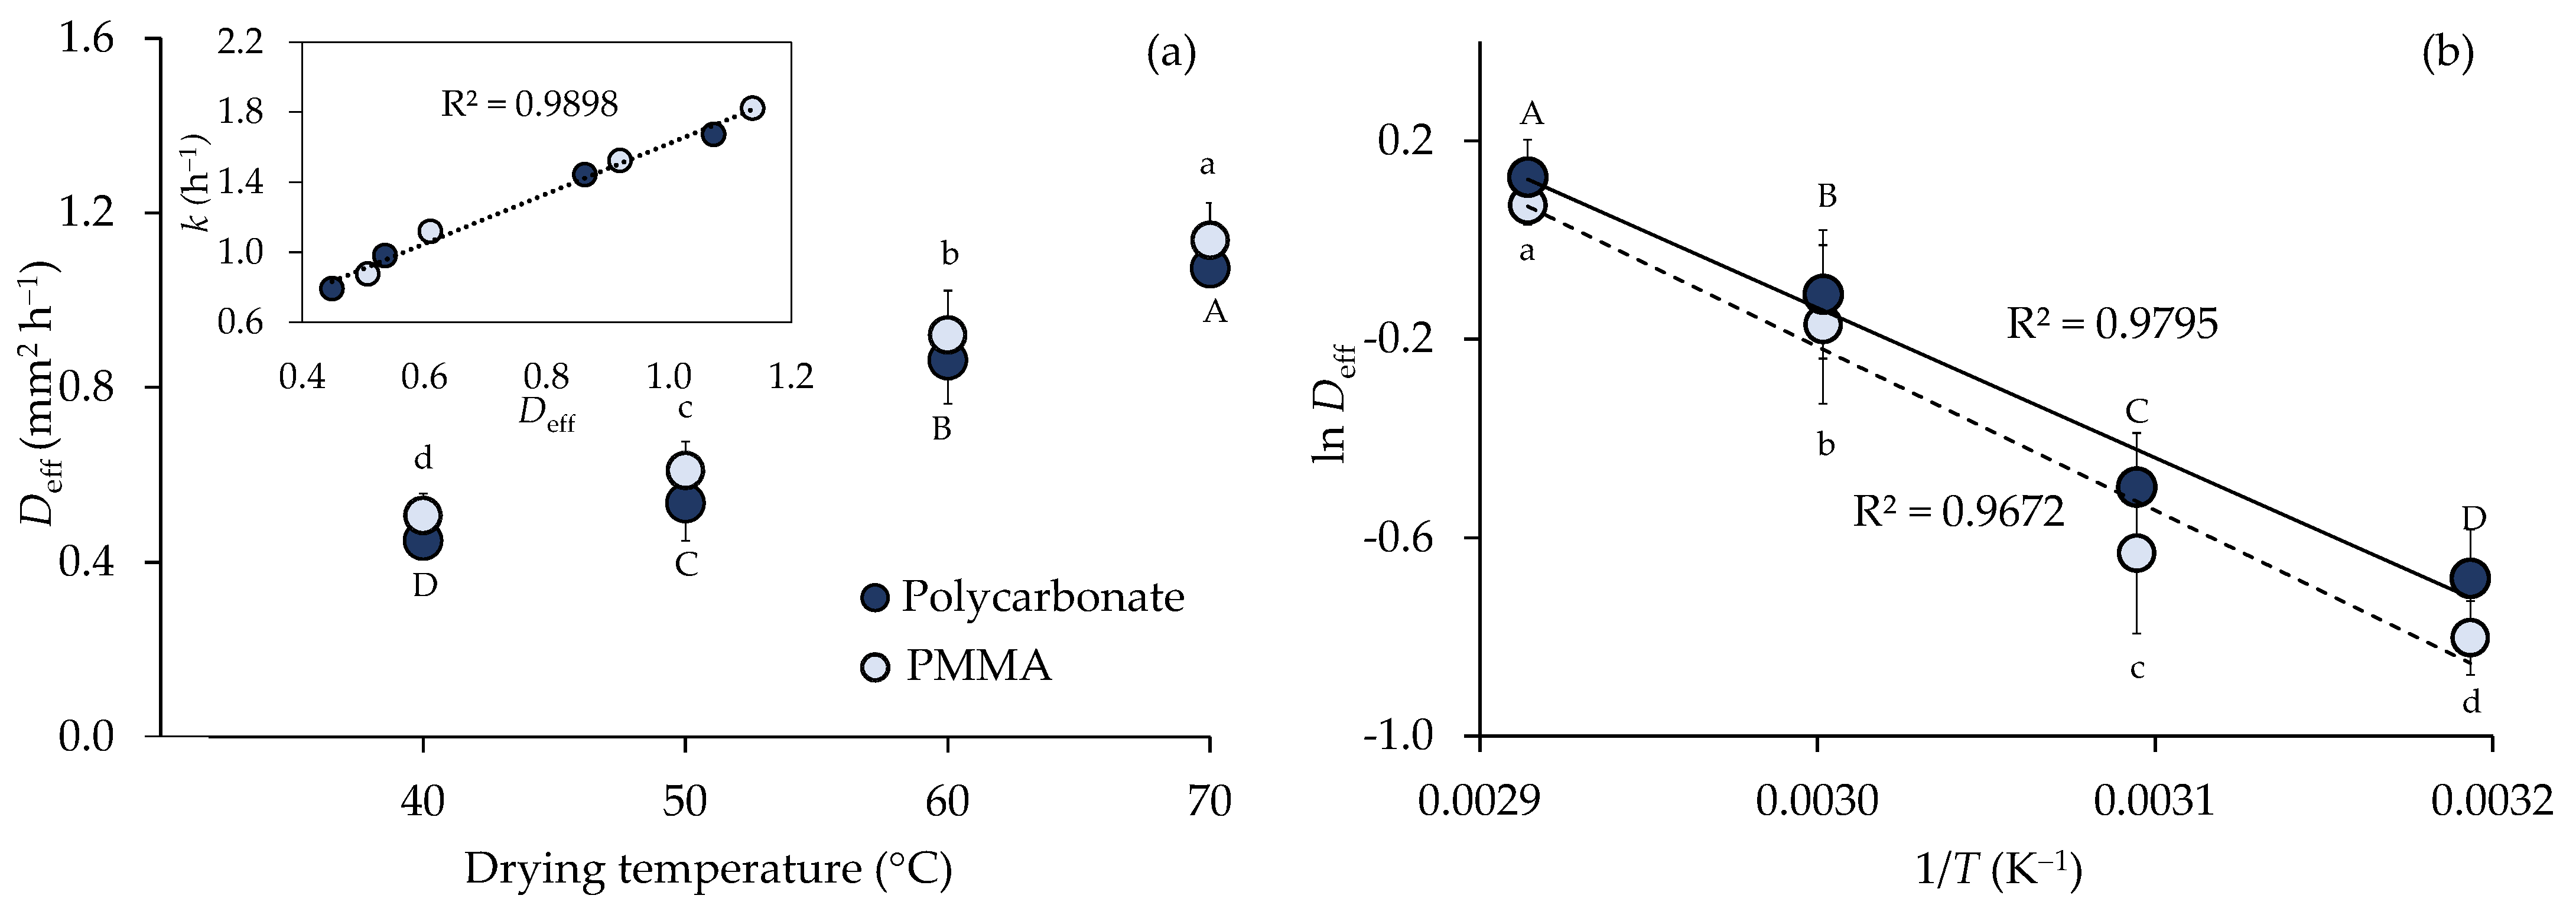

| Temperature (°C) | Drying Time (h) | Cover Materials | MC (% w.b.) ns | aw ns | CTL (K h) |
|---|---|---|---|---|---|
| 40 | 14.22 | Polycarbonate | 8.06 ± 1.84 | 0.331 ± 0.029 | 219.25 ± 5.21 b |
| PMMA | 8.54 ± 0.40 | 0.365 ± 0.013 | 233.89 ± 10.51 a | ||
| 50 | 7.50 | Polycarbonate | 7.30 ± 1.23 | 0.363 ± 0.016 | 158.13 ± 7.92 d |
| PMMA | 6.53 ± 1.24 | 0.350 ± 0.047 | 173.20 ± 4.00 c | ||
| 60 | 4.75 | Polycarbonate | 7.08 ± 0.81 | 0.331 ± 0.017 | 136.68 ± 1.65 e |
| PMMA | 7.13 ± 1.47 | 0.347 ± 0.019 | 140.33 ± 1.17 e | ||
| 70 | 3.17 | Polycarbonate | 6.23 ± 0.94 | 0.336 ± 0.004 | 107.71 ± 1.56 f |
| PMMA | 6.51 ± 0.18 | 0.334 ± 0.021 | 110.23 ± 1.21 f |
| Drying Temperature (°C) | |||||||||
|---|---|---|---|---|---|---|---|---|---|
| Color Values | Fresh Sample | 40 | 50 | 60 | 70 | ||||
| Polycarbonate | PMMA | Polycarbonate | PMMA | Polycarbonate | PMMA | Polycarbonate | PMMA | ||
 |  |  |  |  |  |  |  |  | |
| L* | 53.37 ± 0.46 | 54.59 ± 0.12 a | 51.36 ± 2.86 a | 54.09 ± 1.91 a | 53.10 ± 0.16 a | 54.24 ± 0.37 a | 52.02 ± 4.37 a | 49.67 ± 0.37 b | 47.80 ± 1.08 b |
| a* | 38.34 ± 1.00 | 26.32 ± 0.76 bcd | 25.85 ± 1.39 cd | 27.99 ± 0.08 abc | 27.37 ± 0.33 abc | 28.46 ± 1.07 ab | 26.46 ± 0.10 abc | 28.63 ± 0.44 a | 24.18 ± 1.55 d |
| b* | 47.47 ± 1.58 | 34.43 ± 0.04 a | 28.59 ± 4.68 ab | 34.41 ± 3.32 a | 32.27 ± 0.08 a | 34.29 ± 0.17 a | 30.60 ± 5.59 a | 26.99 ± 0.53 ab | 22.94 ± 2.04 b |
| C* | 61.09 ± 1.51 | 43.34 ± 0.42 a | 38.57 ± 4.40 ab | 44.39 ± 2.52 a | 42.32 ± 0.15 a | 44.58 ± 0.56 a | 40.54 ± 4.16 a | 39.35 ± 0.64 ab | 33.34 ± 2.48 b |
| h° | 50.02 ± 1.04 | 52.61 ± 0.84 a | 47.71 ± 3.15 ab | 50.80 ± 2.79 a | 49.70 ± 0.40 a | 50.31 ± 1.20 a | 48.87 ± 5.30 ab | 43.31 ± 0.36 b | 43.45 ± 1.07 b |
| ΔE | - | 16.46 ± 2.96 c | 22.86 ± 2.98 abc | 16.56 ± 1.92 c | 18.59 ± 2.09 bc | 18.08 ± 0.03 bc | 21.25 ± 4.47 bc | 23.68 ± 2.50 ab | 27.94 ± 1.01 a |
| Temperature (°C) | Cover Materials | Curcumin | Demethoxycurcumin | Bisdemethoxycurcumin | Total Curcuminoid Content | ||||
|---|---|---|---|---|---|---|---|---|---|
| (mg g−1 Dry Solid) | (mg g−1 Dry Solid) | (mg g−1 Dry Solid) | (mg g−1 Dry Solid) | ||||||
| Fresh | Dried | Fresh | Dried | Fresh | Dried | Fresh | Dried | ||
| 40 | Polycarbonate | 197.03 ± 3.09 a | 182.50 ± 3.67 b | 51.31 ± 1.08 a | 47.27 ± 0.48 b | 57.09 ± 0.39 a | 57.75 ± 0.03 a | 305.44 ± 4.56 a | 287.52 ± 4.12 b |
| PMMA | 211.97 ± 3.20 a | 184.99 ± 2.89 b | 54.67 ± 0.03 a | 49.06 ± 0.71 b | 62.56 ± 1.57 a | 60.37 ± 1.61 a | 329.03 ± 1.60 a | 294.42 ± 0.58 b | |
| 50 | Polycarbonate | 217.13 ± 4.00 a | 202.11 ± 3.92 a | 56.48 ± 0.19 a | 53.47 ± 1.16 a | 62.25 ± 1.64 a | 65.42 ± 2.34 a | 335.86 ± 2.16 a | 321.00 ± 7.42 a |
| PMMA | 206.10 ± 5.48 a | 195.62 ± 6.44 a | 53.13 ± 1.46 a | 51.77 ± 2.64 a | 59.41 ± 1.82 a | 63.76 ± 4.64 a | 318.64 ± 8.75 a | 311.16 ± 13.72 a | |
| 60 | Polycarbonate | 224.95 ± 3.78 a | 210.48 ± 0.66 b | 56.71 ± 1.93 a | 54.85 ± 0.25 a | 64.13 ± 3.02 a | 68.15 ± 1.51 a | 345.79 ± 8.72 a | 333.49 ± 2.24 a |
| PMMA | 202.76 ± 1.82 a | 200.17 ± 3.45 a | 52.98 ± 1.34 a | 52.86 ± 1.33 a | 57.76 ± 3.63 a | 63.87 ± 3.81 a | 313.50 ± 6.79 a | 316.90 ± 8.59 a | |
| 70 | Polycarbonate | 200.22 ± 14.42 a | 213.72 ± 2.84 a | 52.09 ± 3.56 a | 56.97 ± 1.00 a | 59.44 ± 5.81 a | 70.69 ± 2.17 a | 311.75 ± 23.78 a | 341.20 ± 0.33 a |
| PMMA | 216.86 ± 5.95 a | 202.62 ± 1.88 a | 55.83 ± 1.87 a | 53.55 ± 2.24 a | 63.28 ± 0.27 a | 65.56 ± 3.46 a | 335.96 ± 8.09 a | 321.71 ± 7.59 a | |
Publisher’s Note: MDPI stays neutral with regard to jurisdictional claims in published maps and institutional affiliations. |
© 2022 by the authors. Licensee MDPI, Basel, Switzerland. This article is an open access article distributed under the terms and conditions of the Creative Commons Attribution (CC BY) license (https://creativecommons.org/licenses/by/4.0/).
Share and Cite
Komonsing, N.; Reyer, S.; Khuwijitjaru, P.; Mahayothee, B.; Müller, J. Drying Behavior and Curcuminoids Changes in Turmeric Slices during Drying under Simulated Solar Radiation as Influenced by Different Transparent Cover Materials. Foods 2022, 11, 696. https://doi.org/10.3390/foods11050696
Komonsing N, Reyer S, Khuwijitjaru P, Mahayothee B, Müller J. Drying Behavior and Curcuminoids Changes in Turmeric Slices during Drying under Simulated Solar Radiation as Influenced by Different Transparent Cover Materials. Foods. 2022; 11(5):696. https://doi.org/10.3390/foods11050696
Chicago/Turabian StyleKomonsing, Nilobon, Sebastian Reyer, Pramote Khuwijitjaru, Busarakorn Mahayothee, and Joachim Müller. 2022. "Drying Behavior and Curcuminoids Changes in Turmeric Slices during Drying under Simulated Solar Radiation as Influenced by Different Transparent Cover Materials" Foods 11, no. 5: 696. https://doi.org/10.3390/foods11050696