
Assessment of Pumpkin Seed Oil Adulteration Supported by Multivariate Analysis: Comparison of GC-MS, Colourimetry and NIR Spectroscopy Data

 , , and
Abstract
:1. Introduction
2. Materials and Methods
2.1. Oil samples
2.2. Determination of Sterols
2.3. Colourimetric Determinations
2.4. NIR Measurement
2.5. Statistical Analysis
3. Results and Discussion
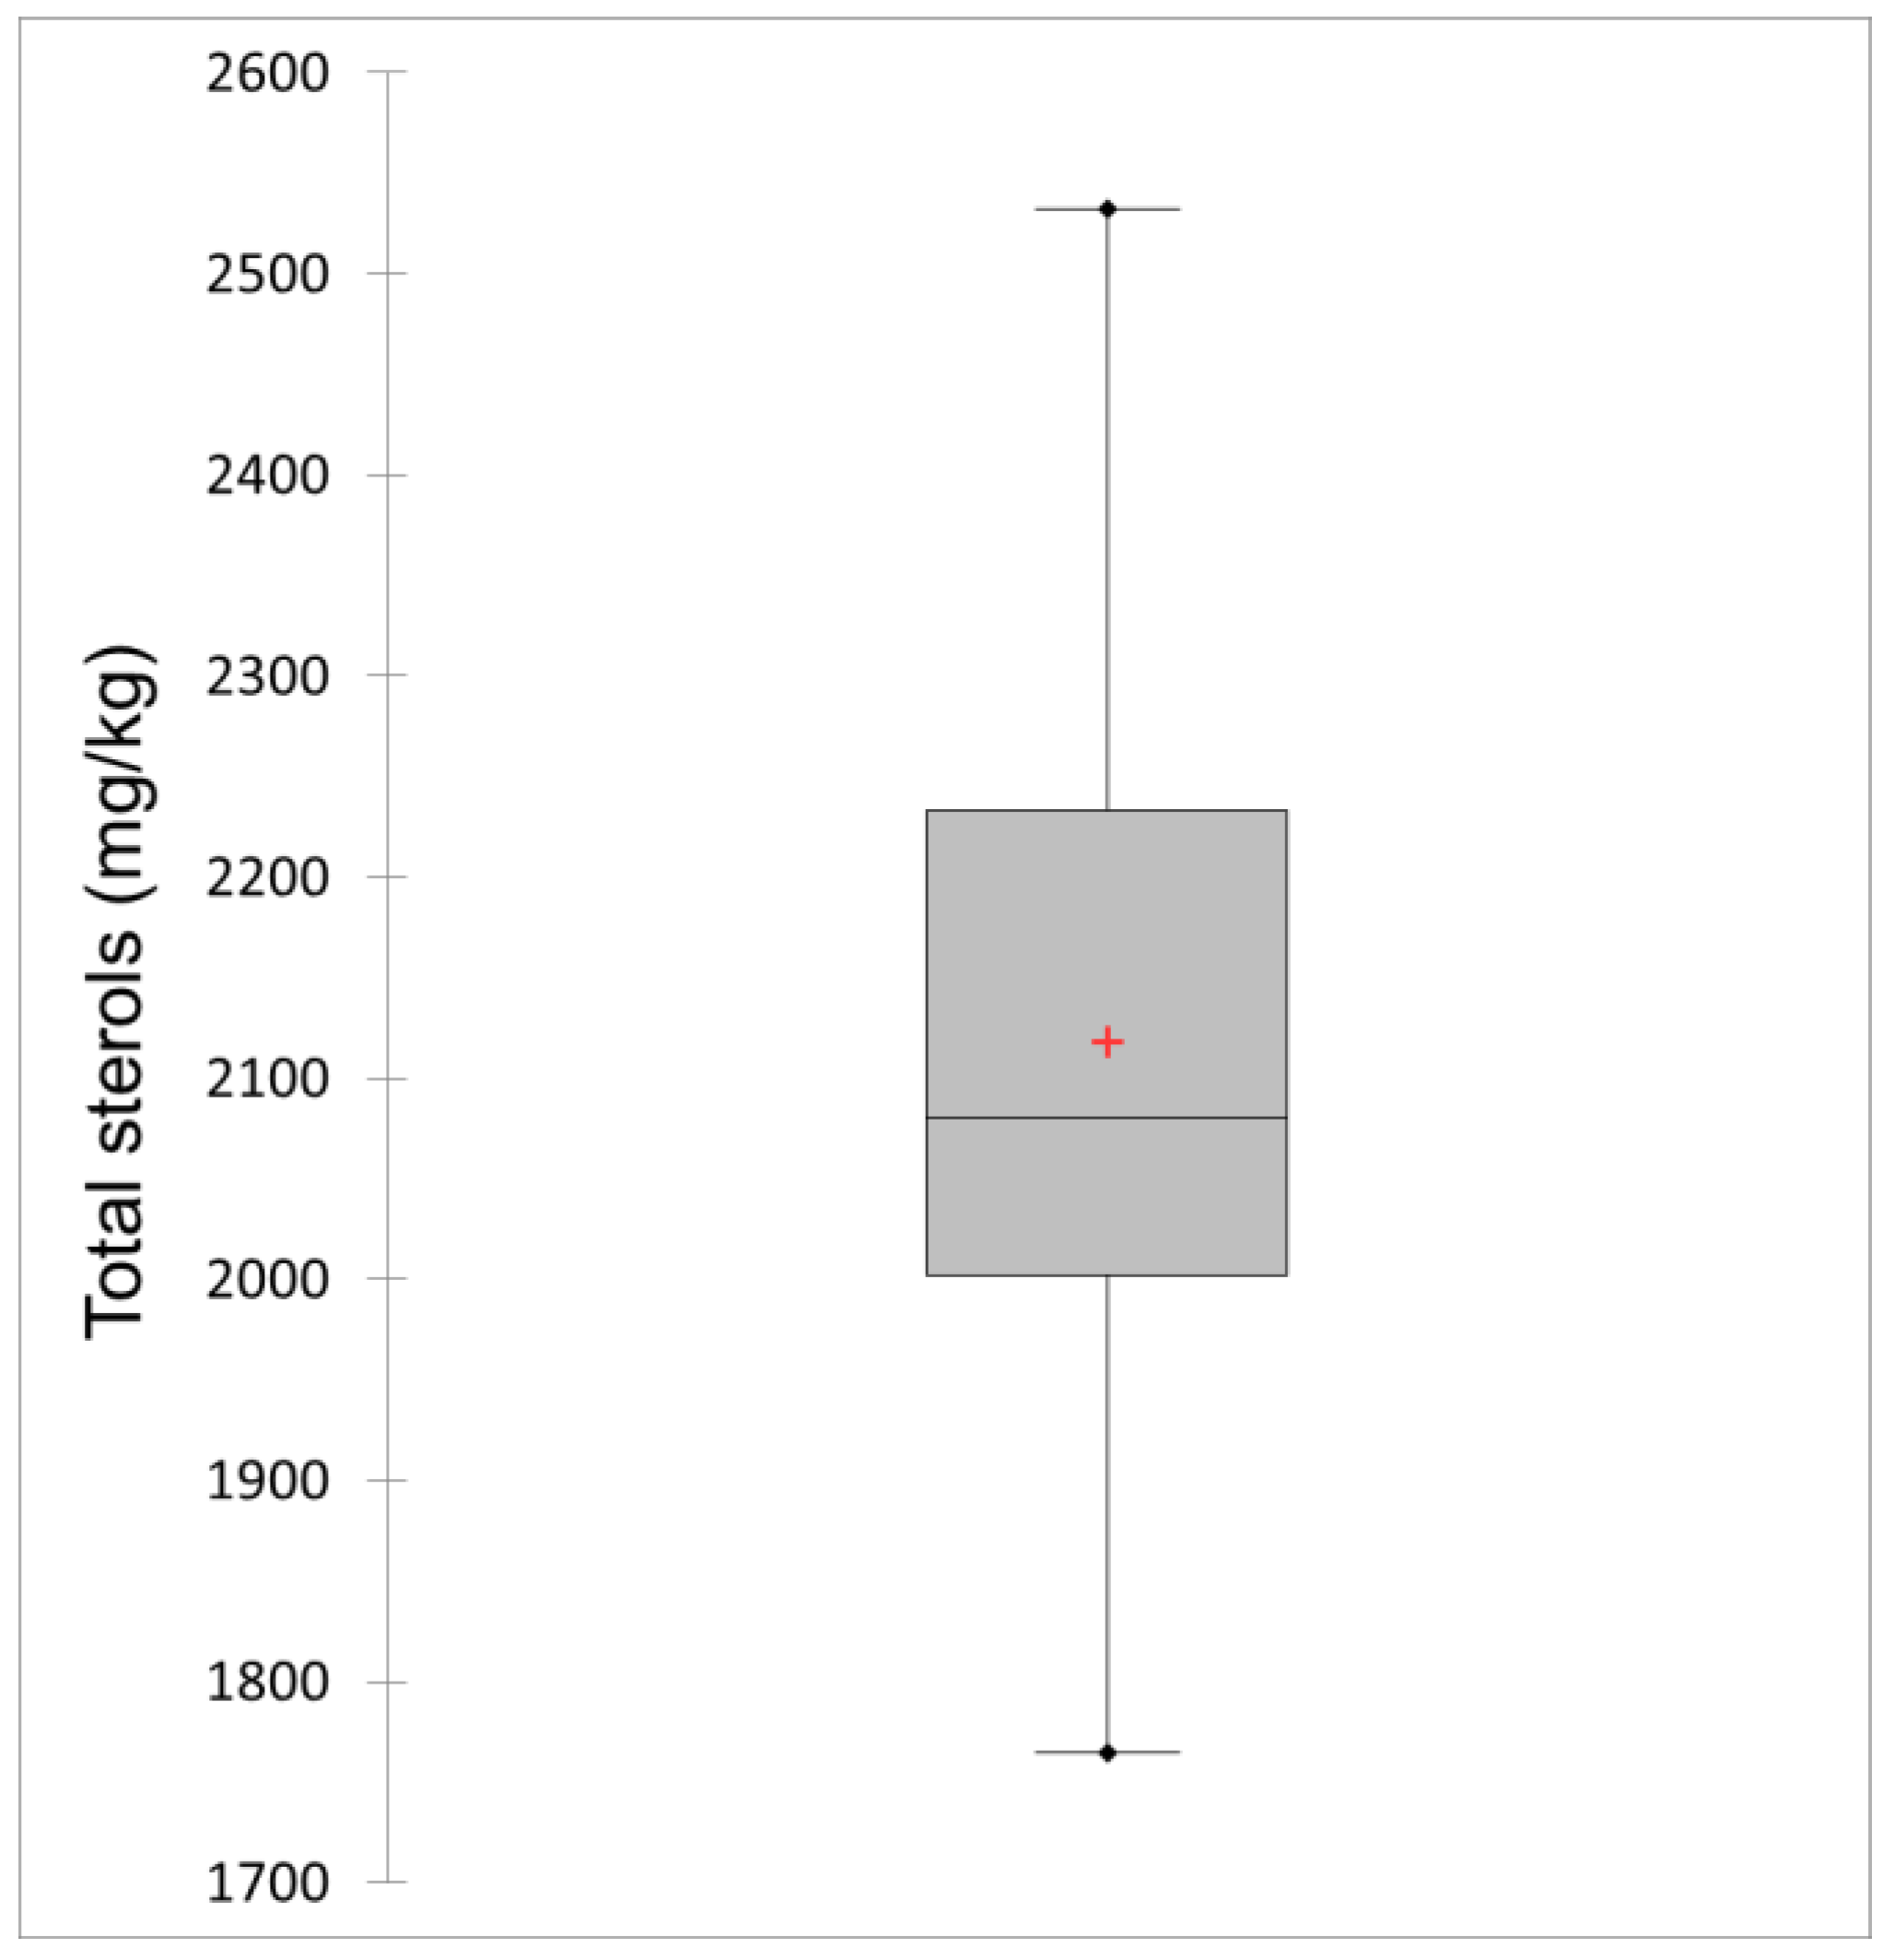
3.1. Total Sterols
3.2. Individual Sterols
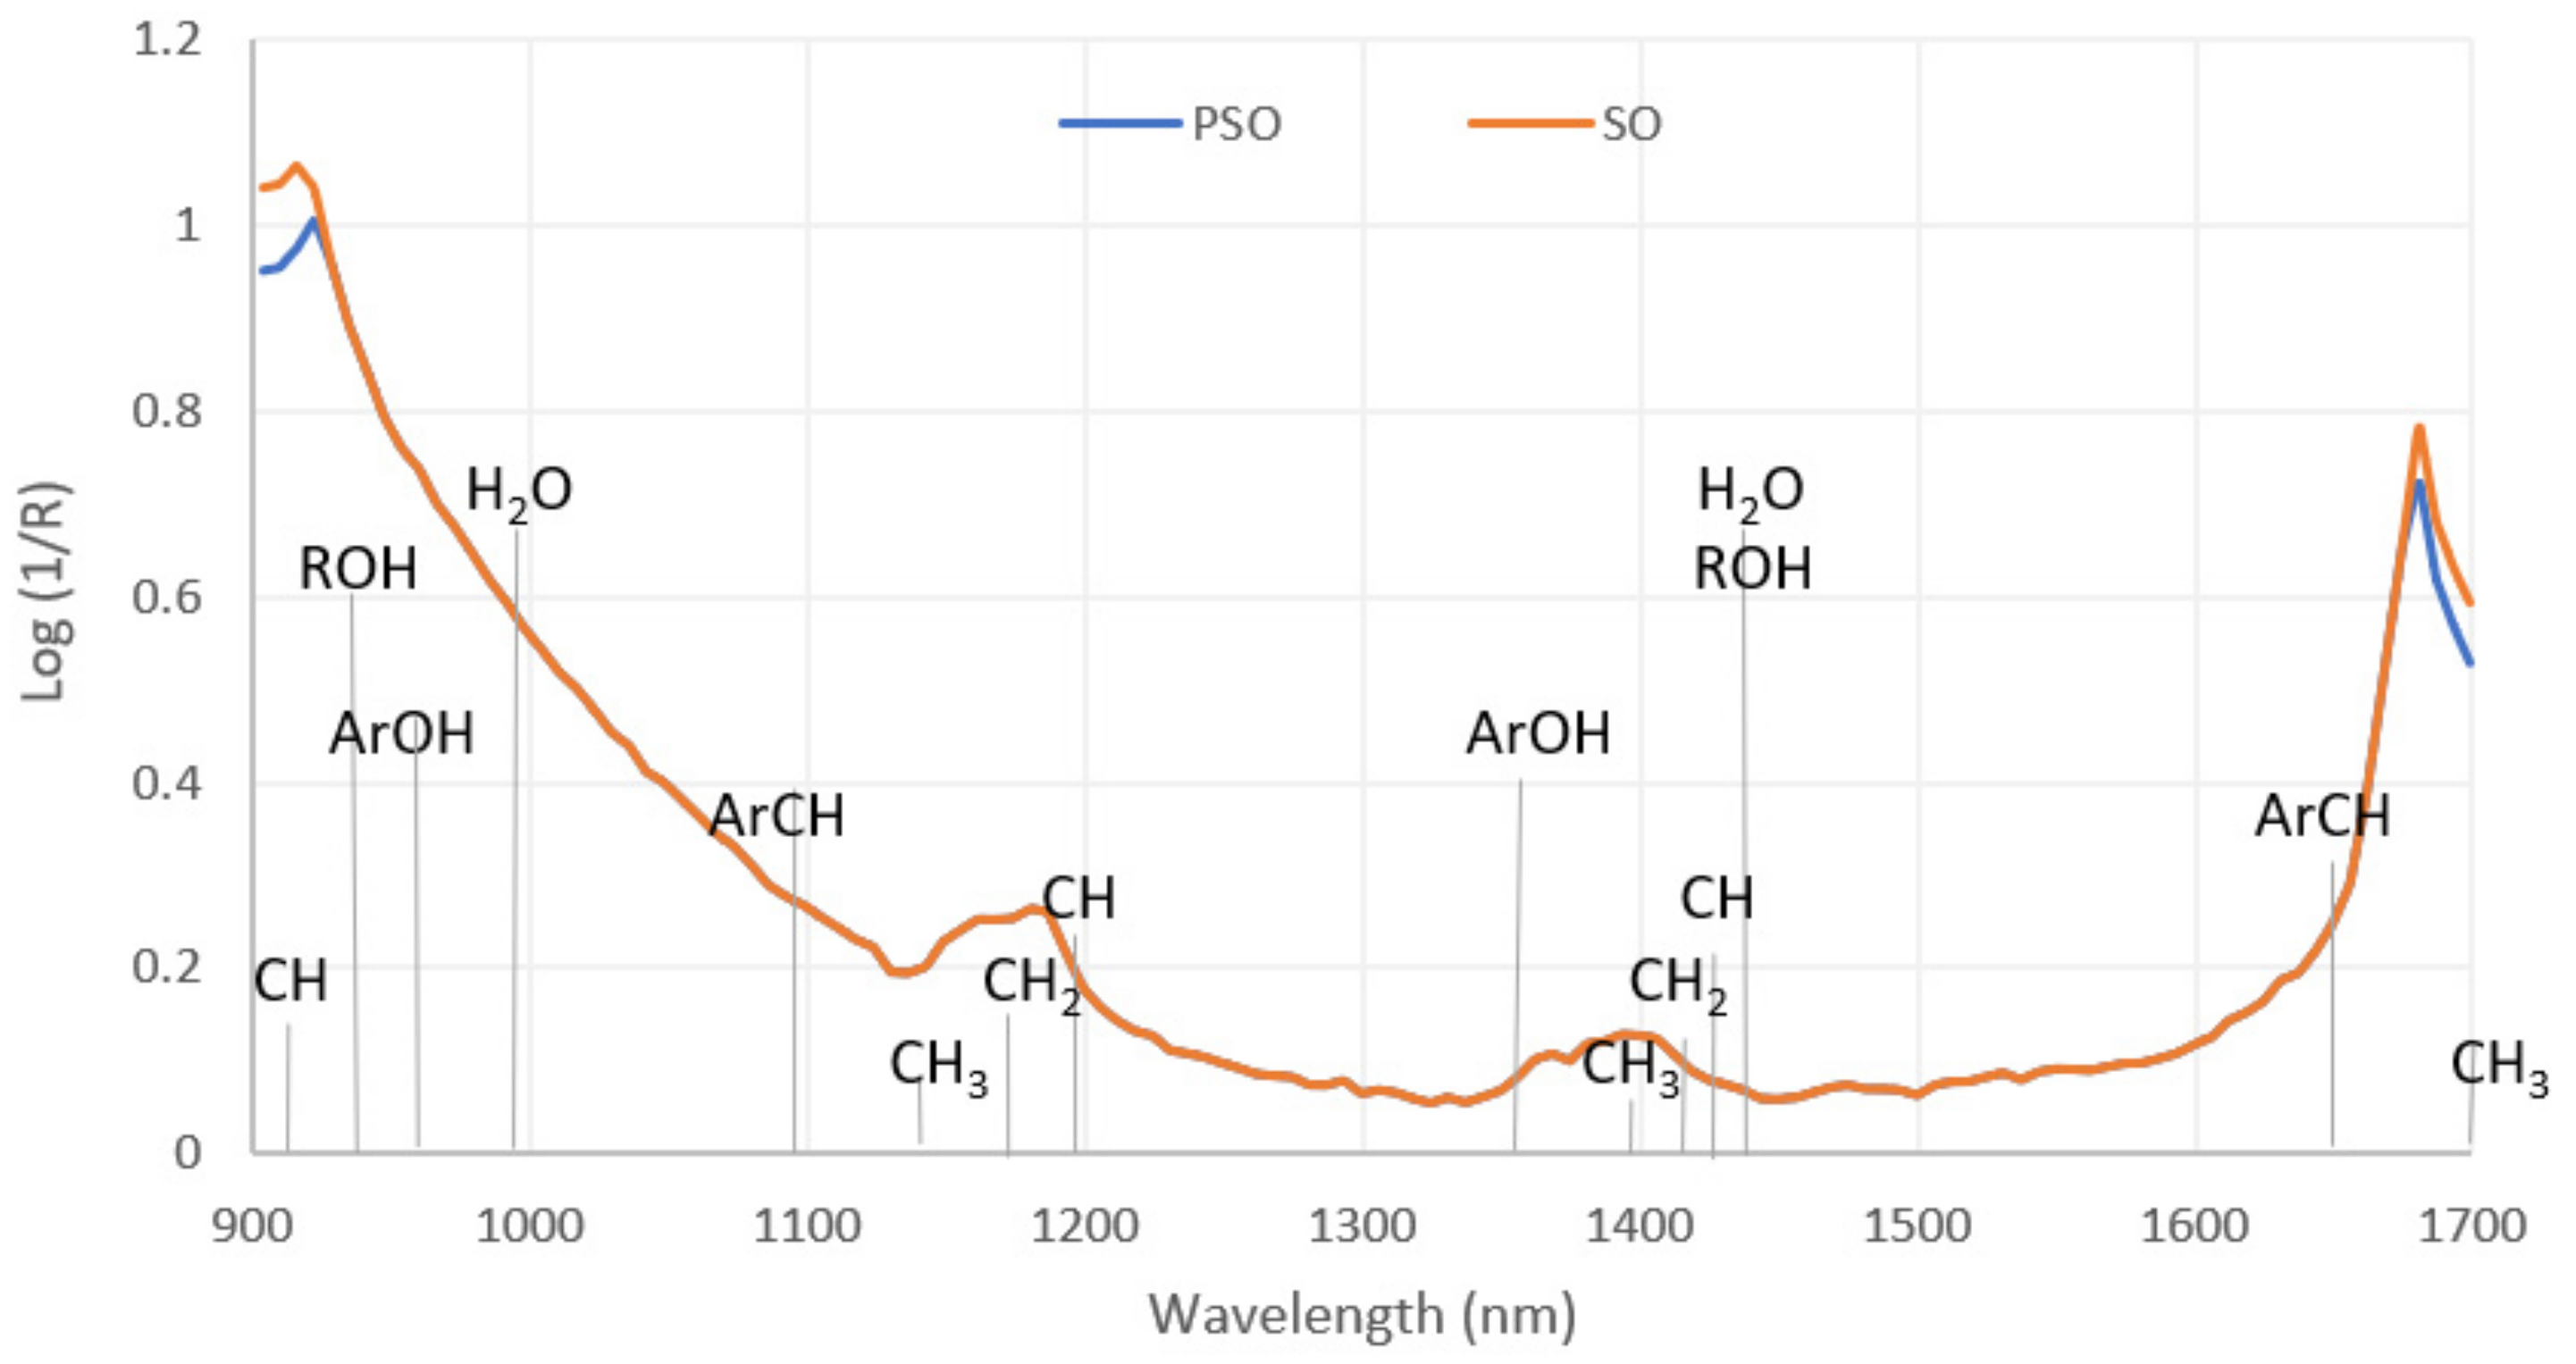
3.3. NIR Spectroscopic Analysis
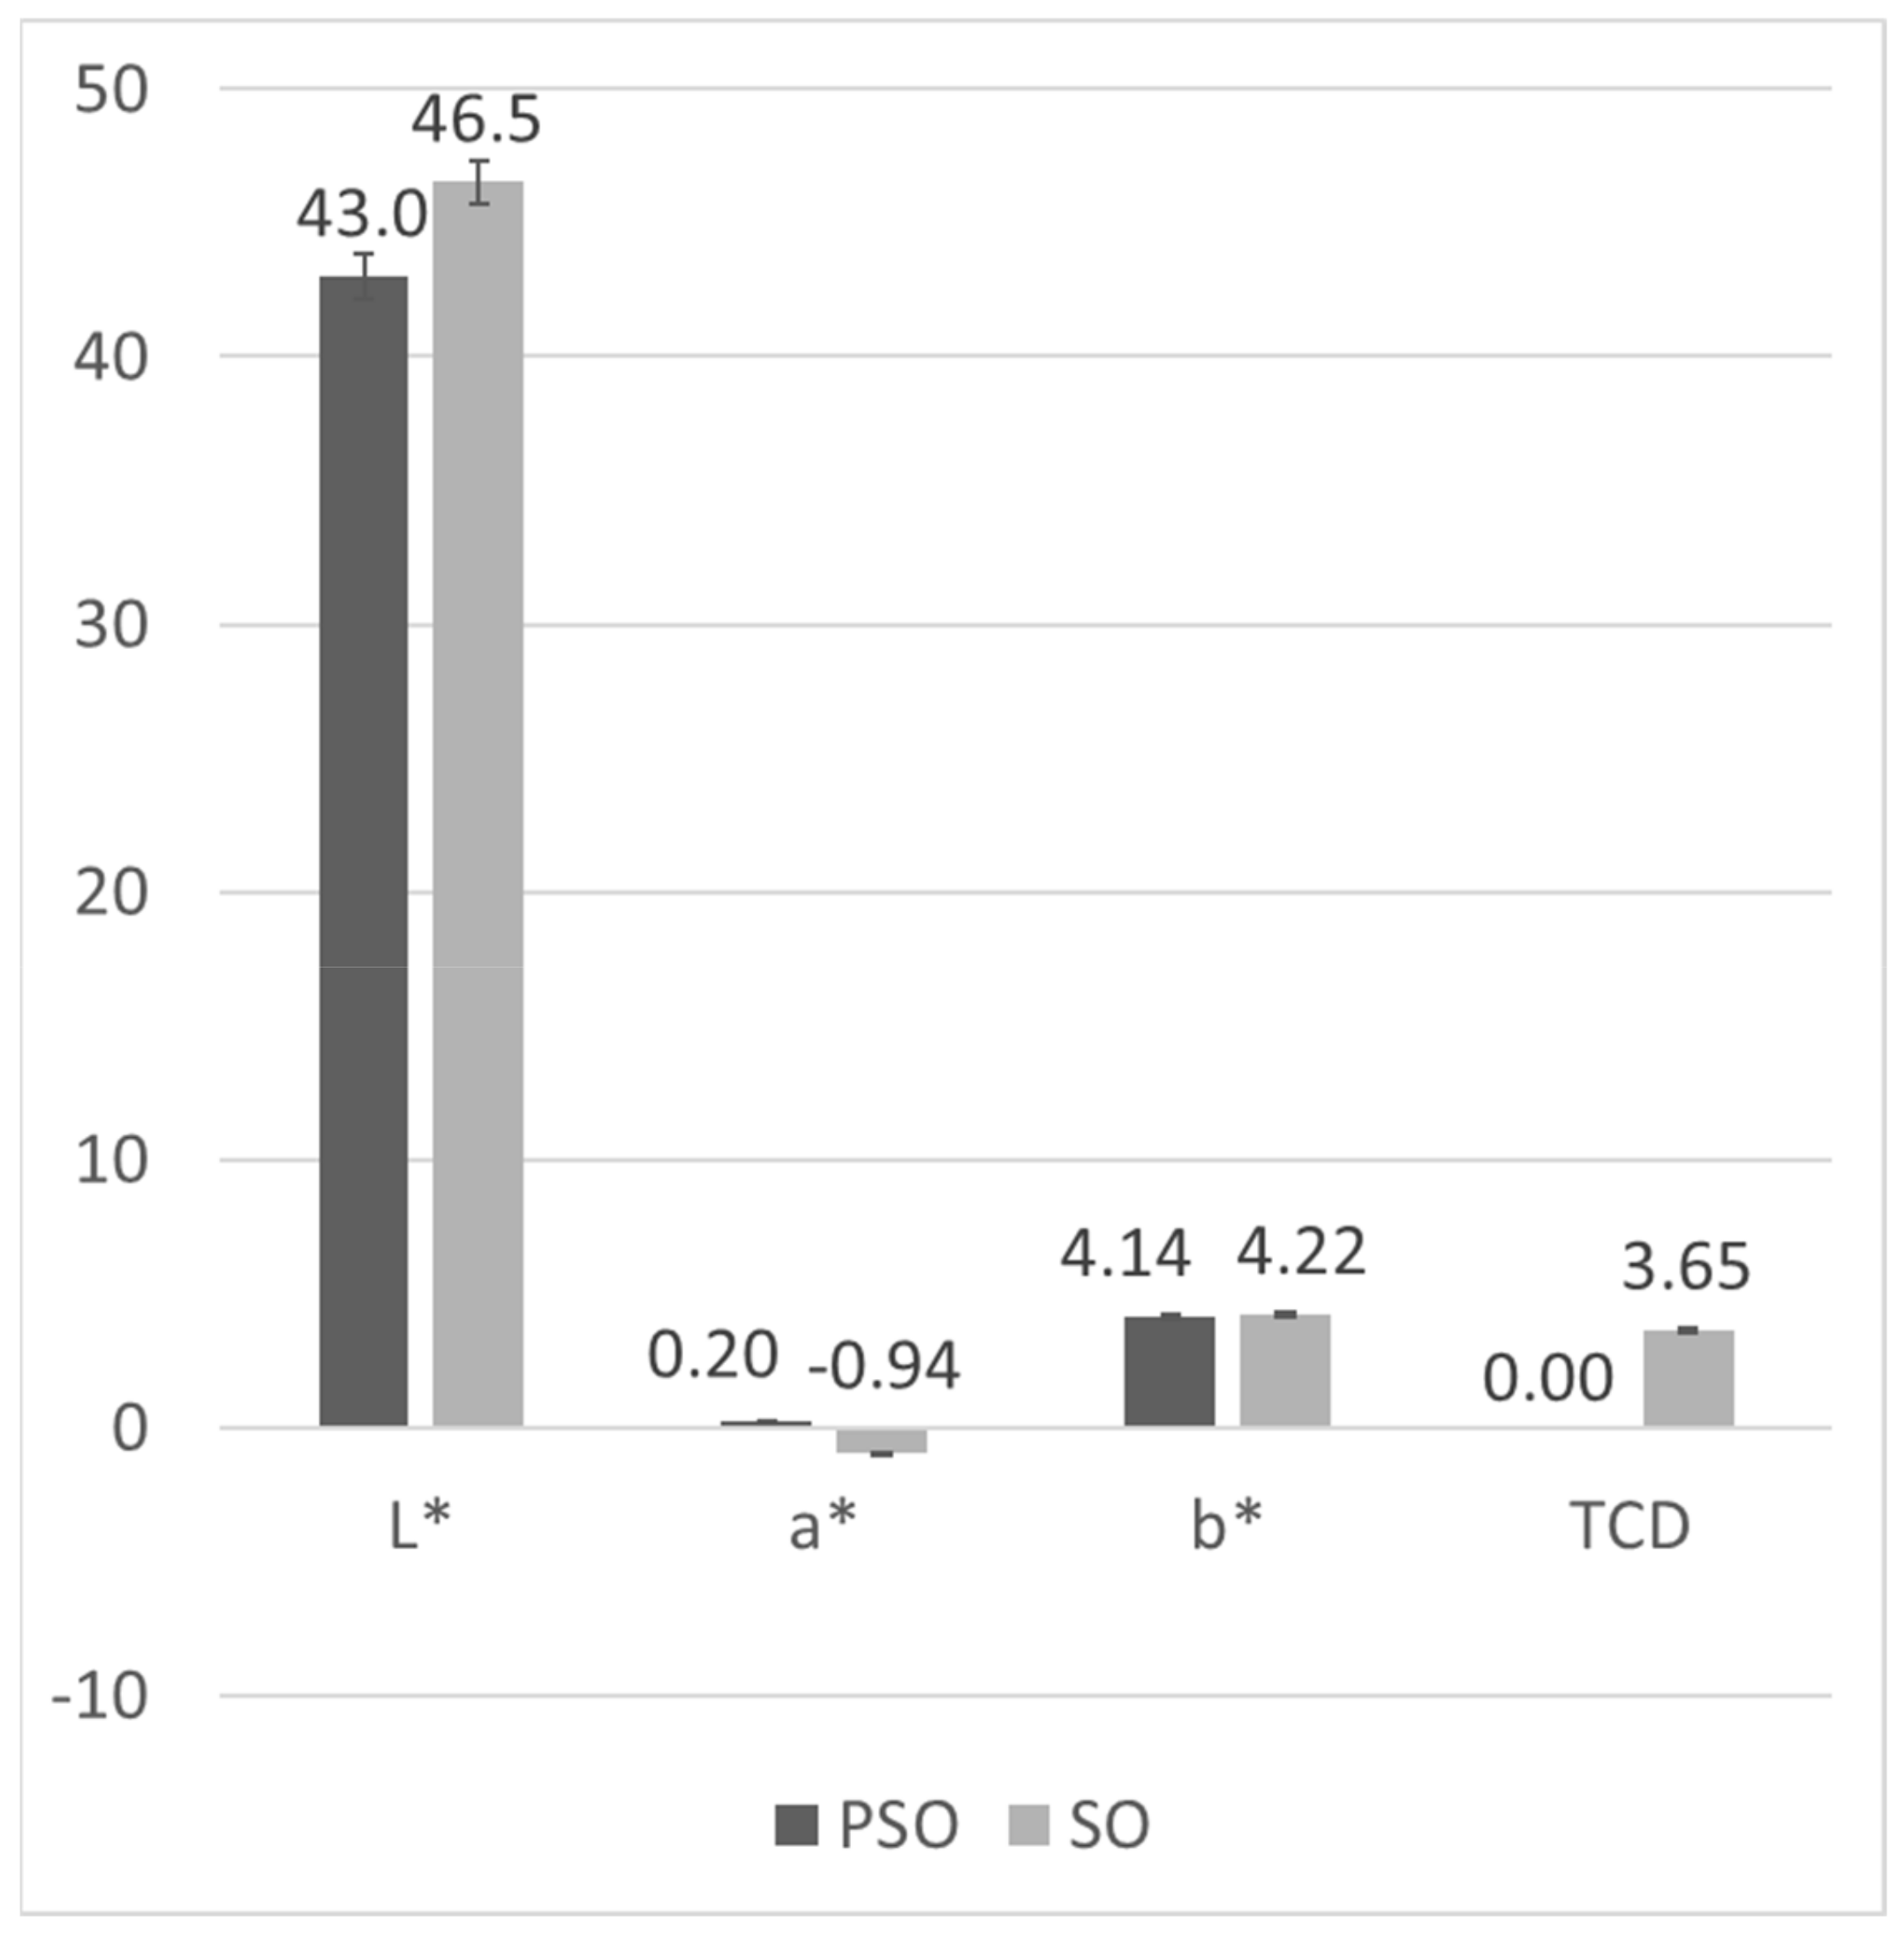
3.4. Colourimetric Analysis
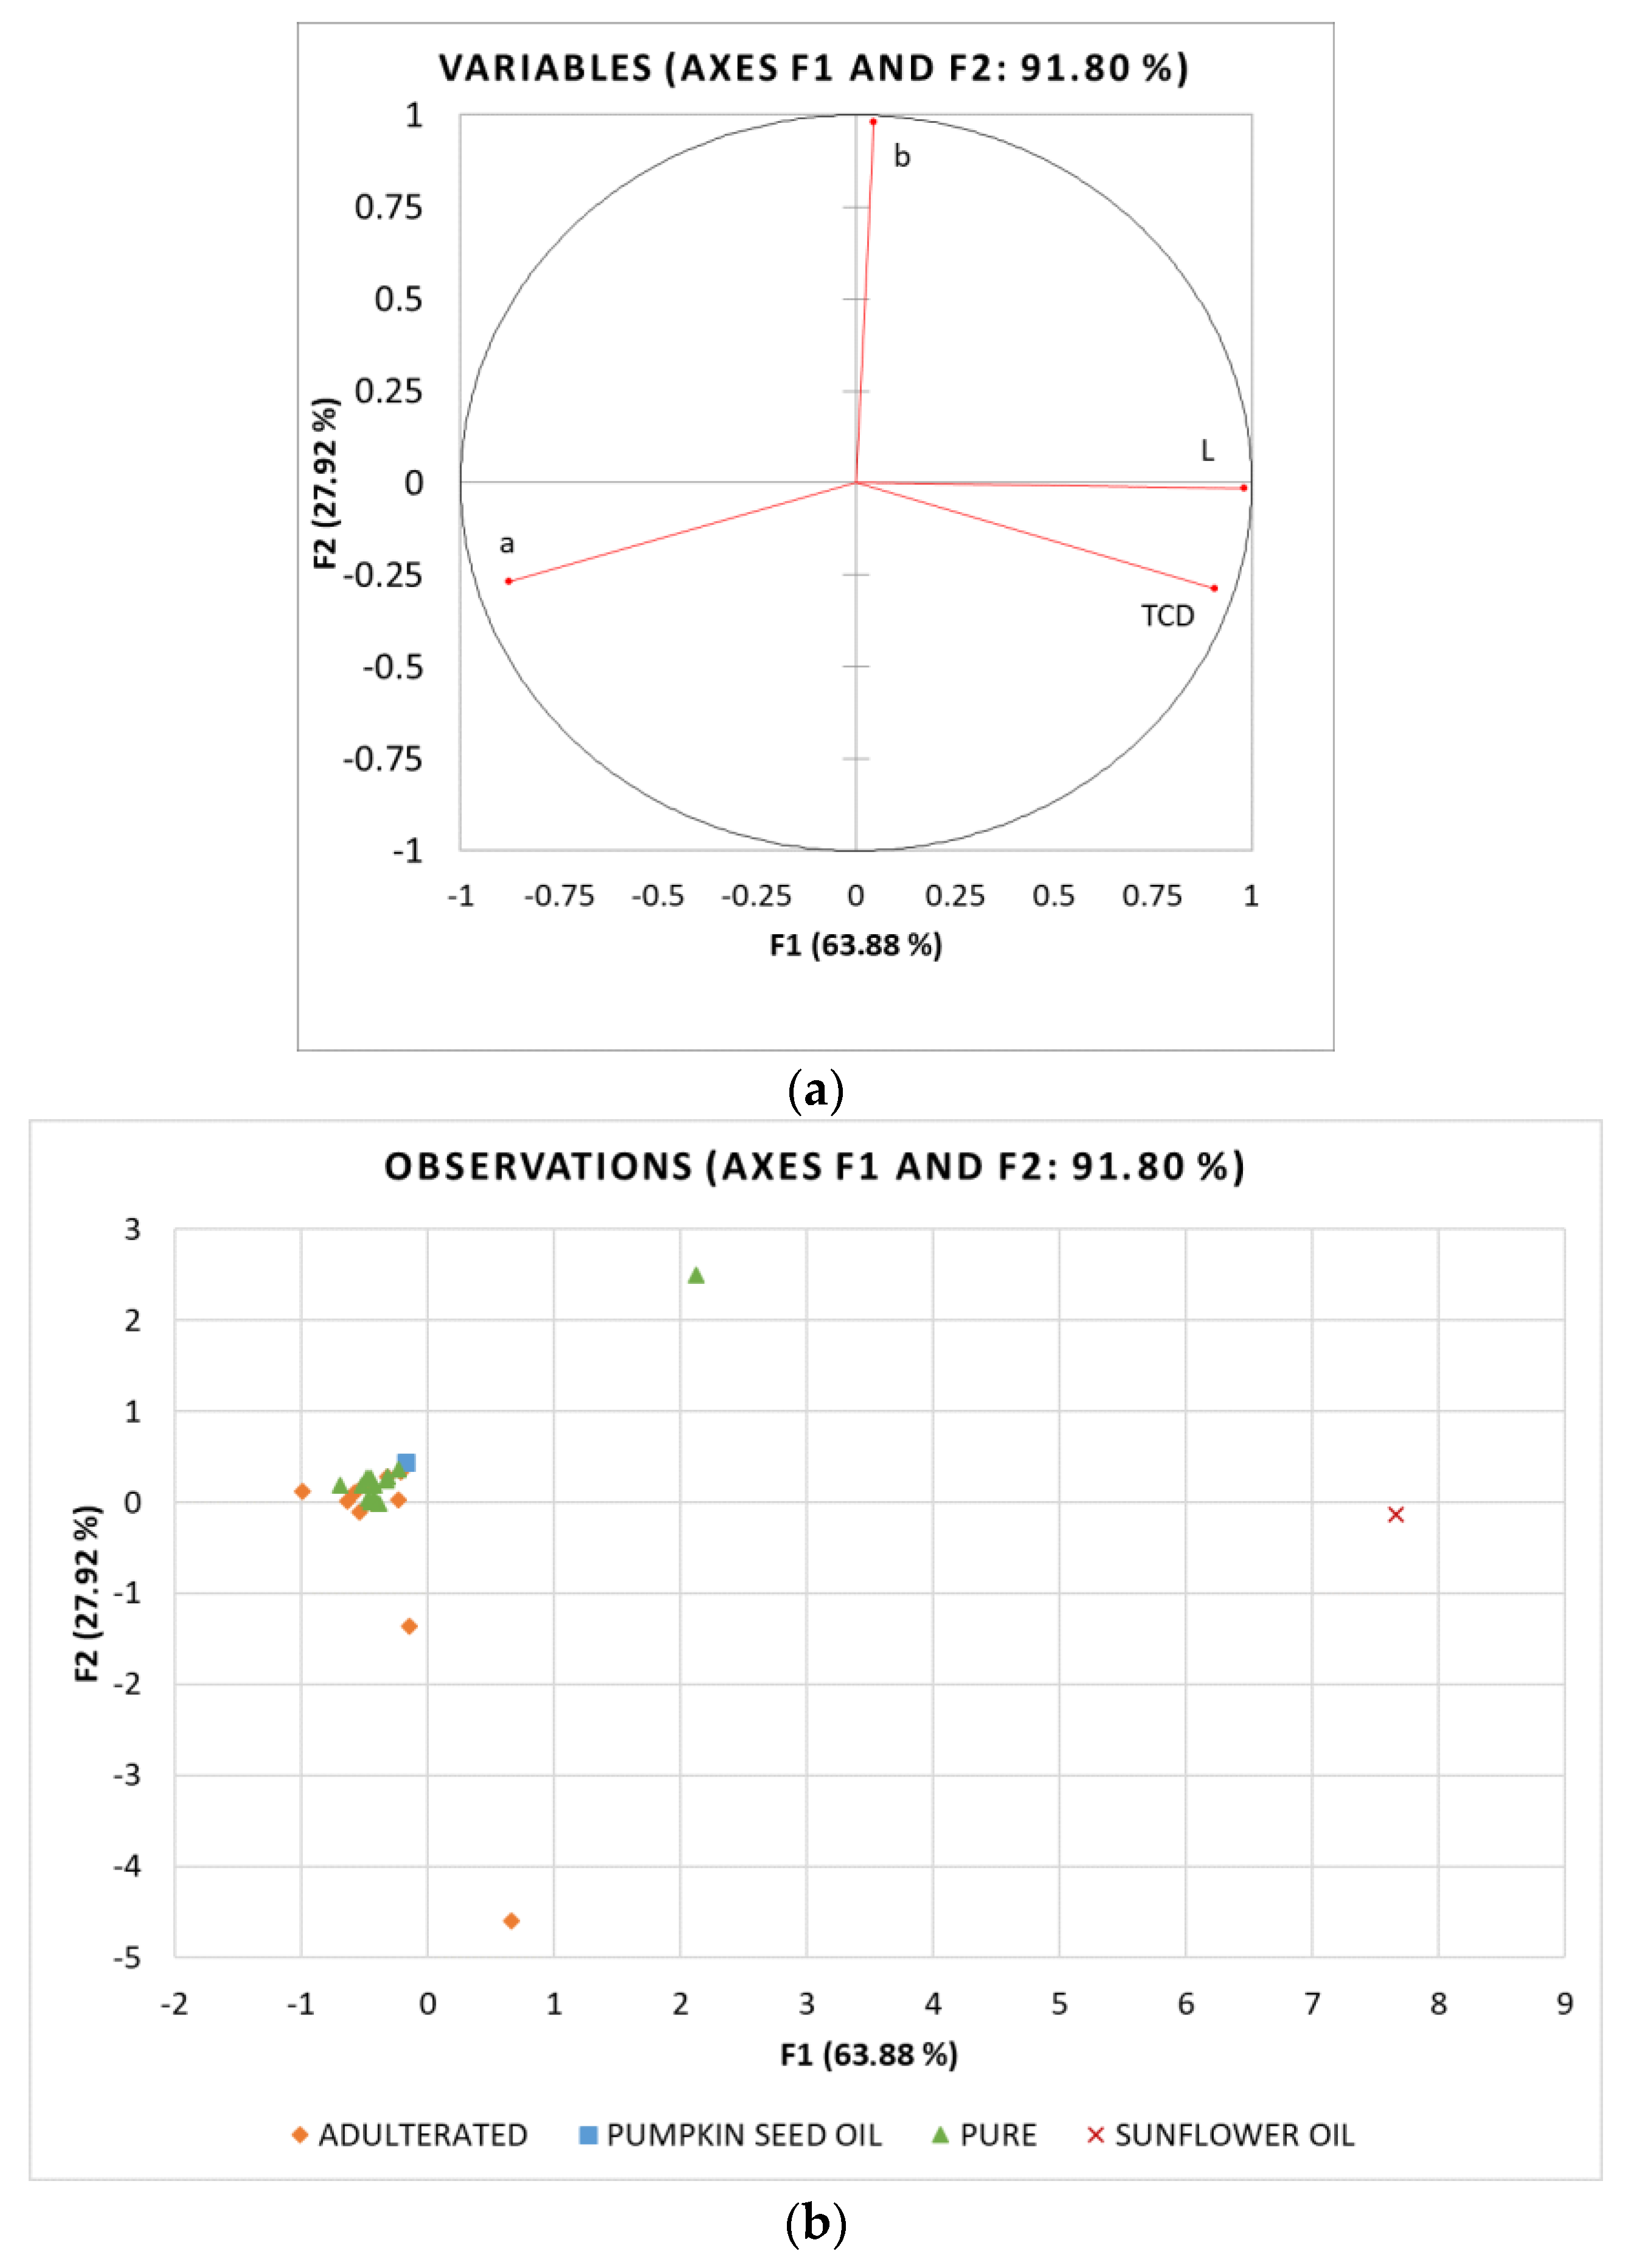
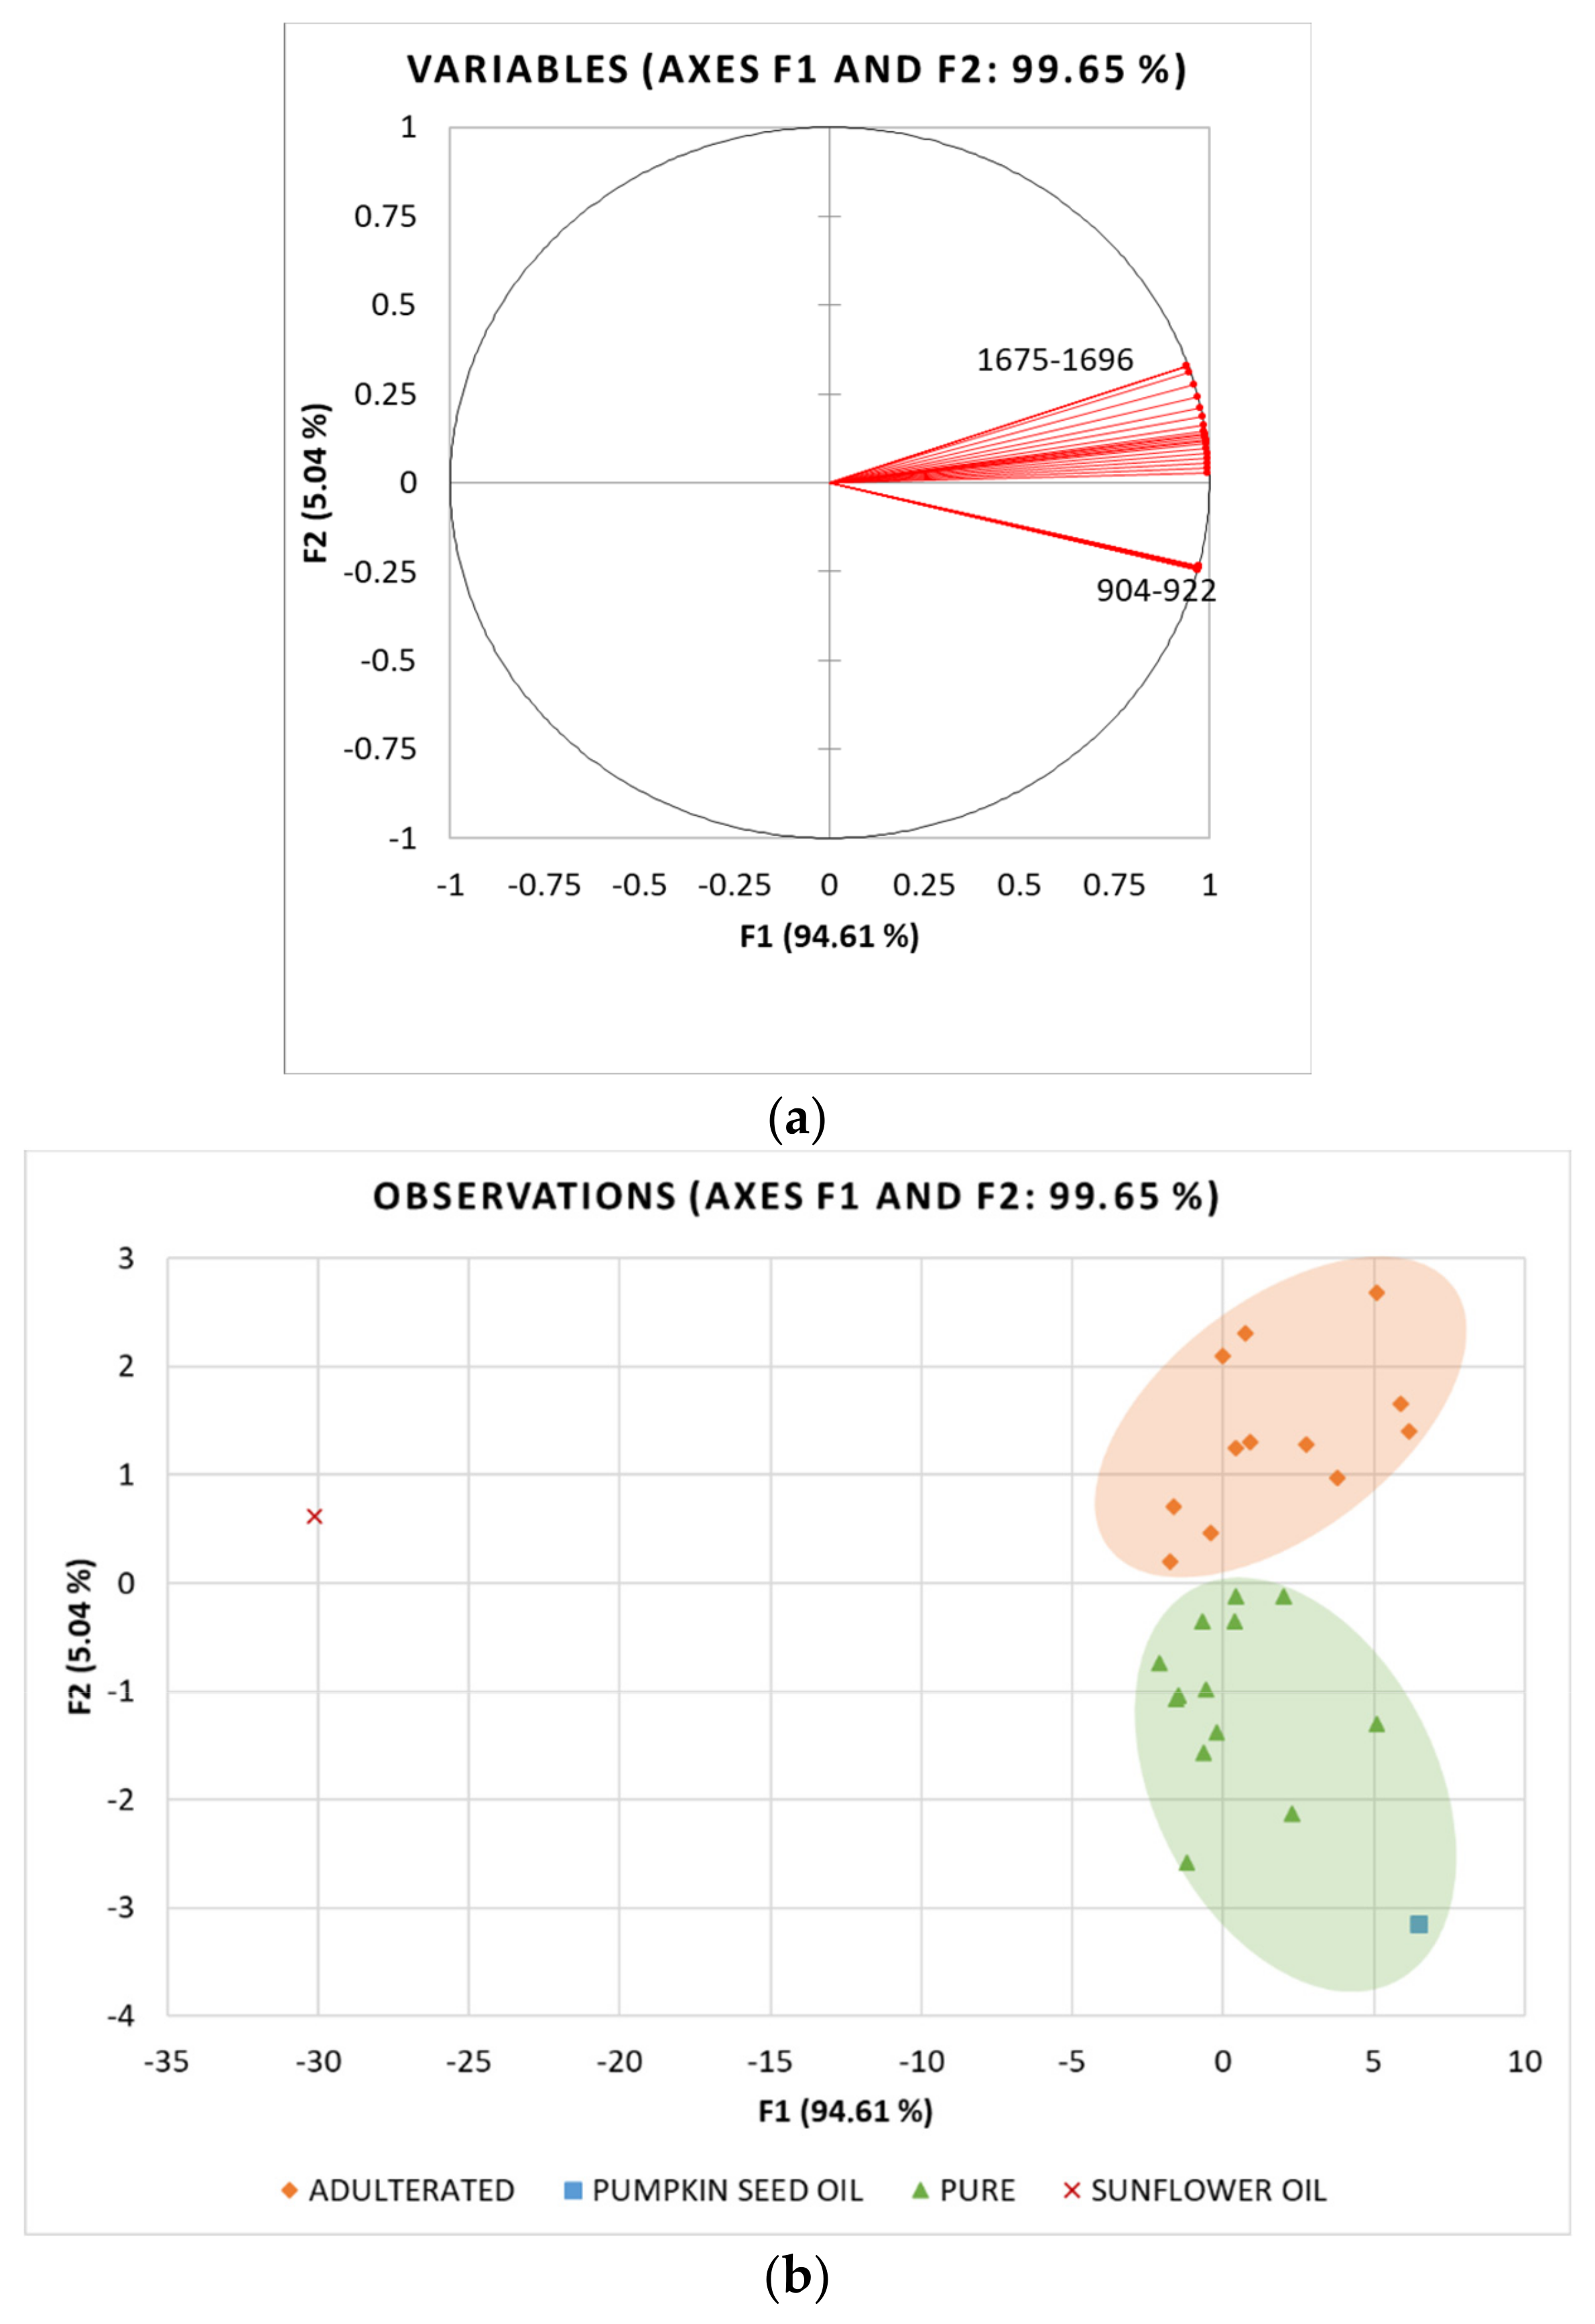
3.5. Principal Component Analysis
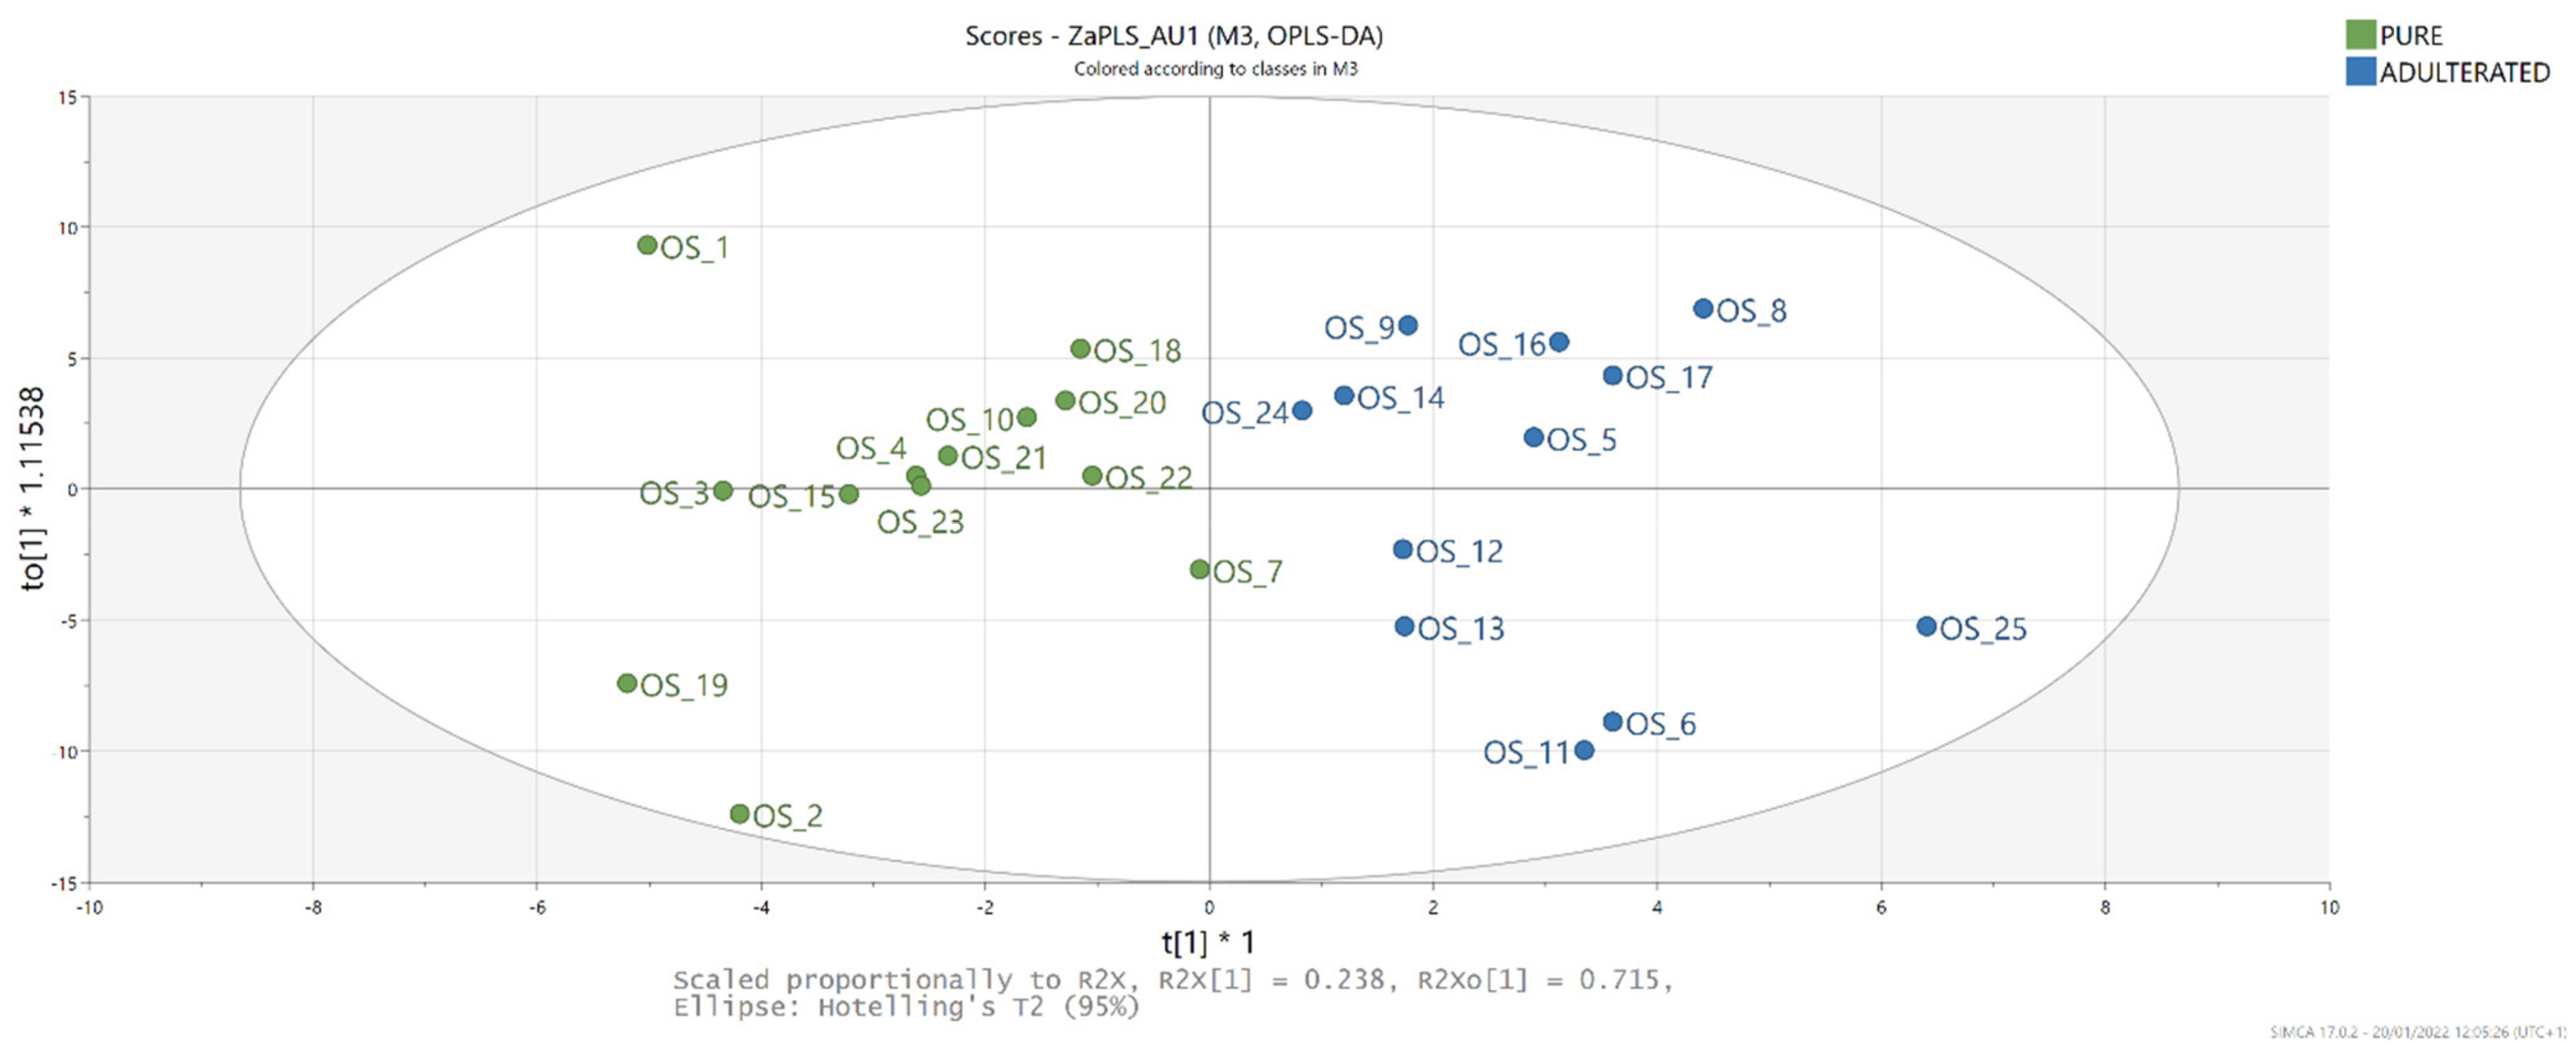
3.6. OPLS-DA
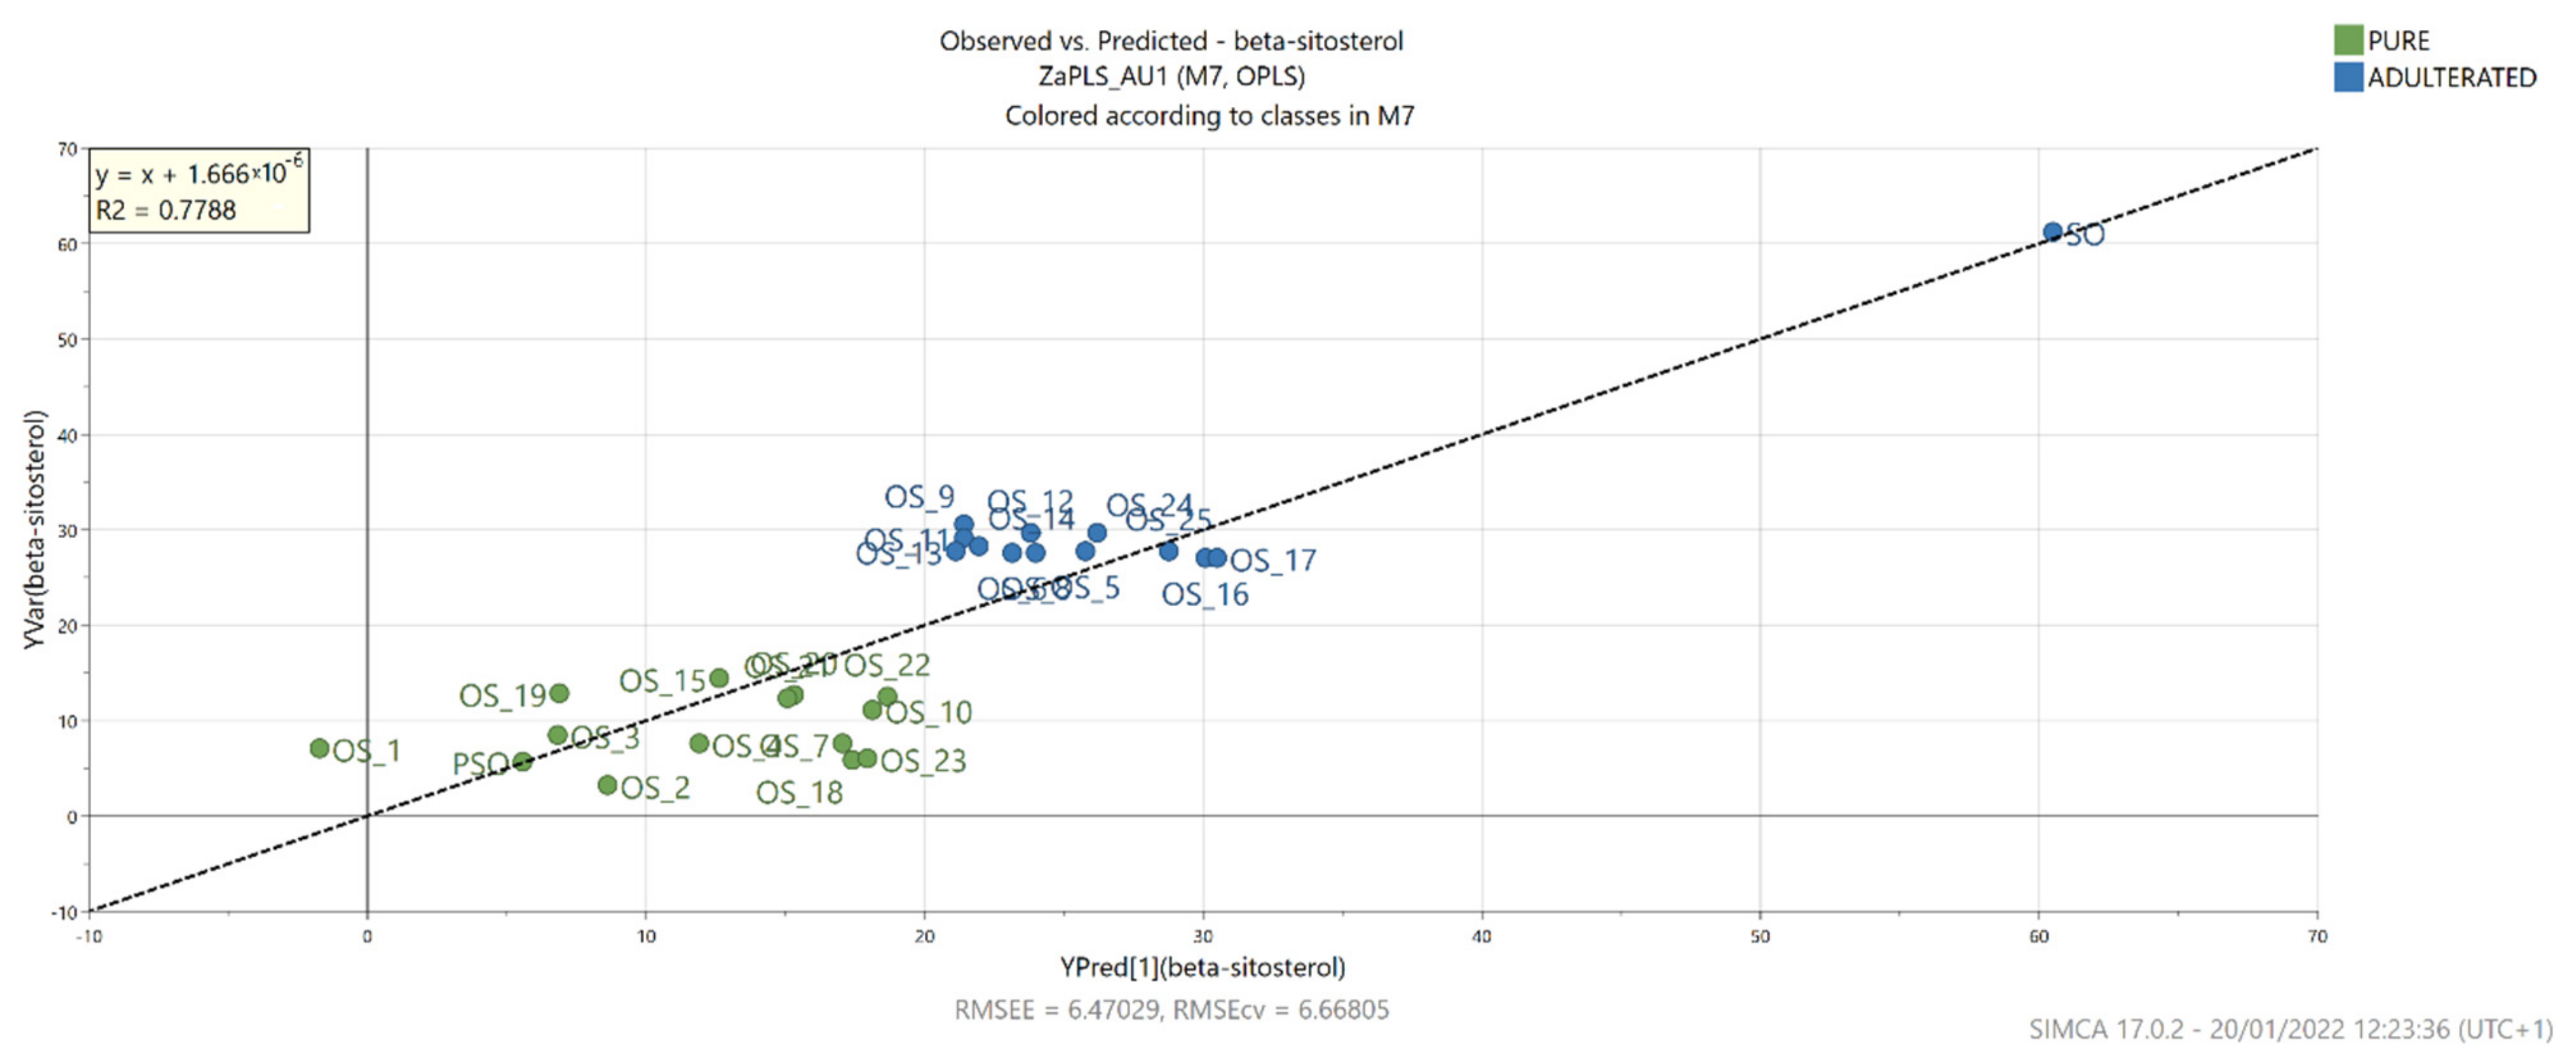
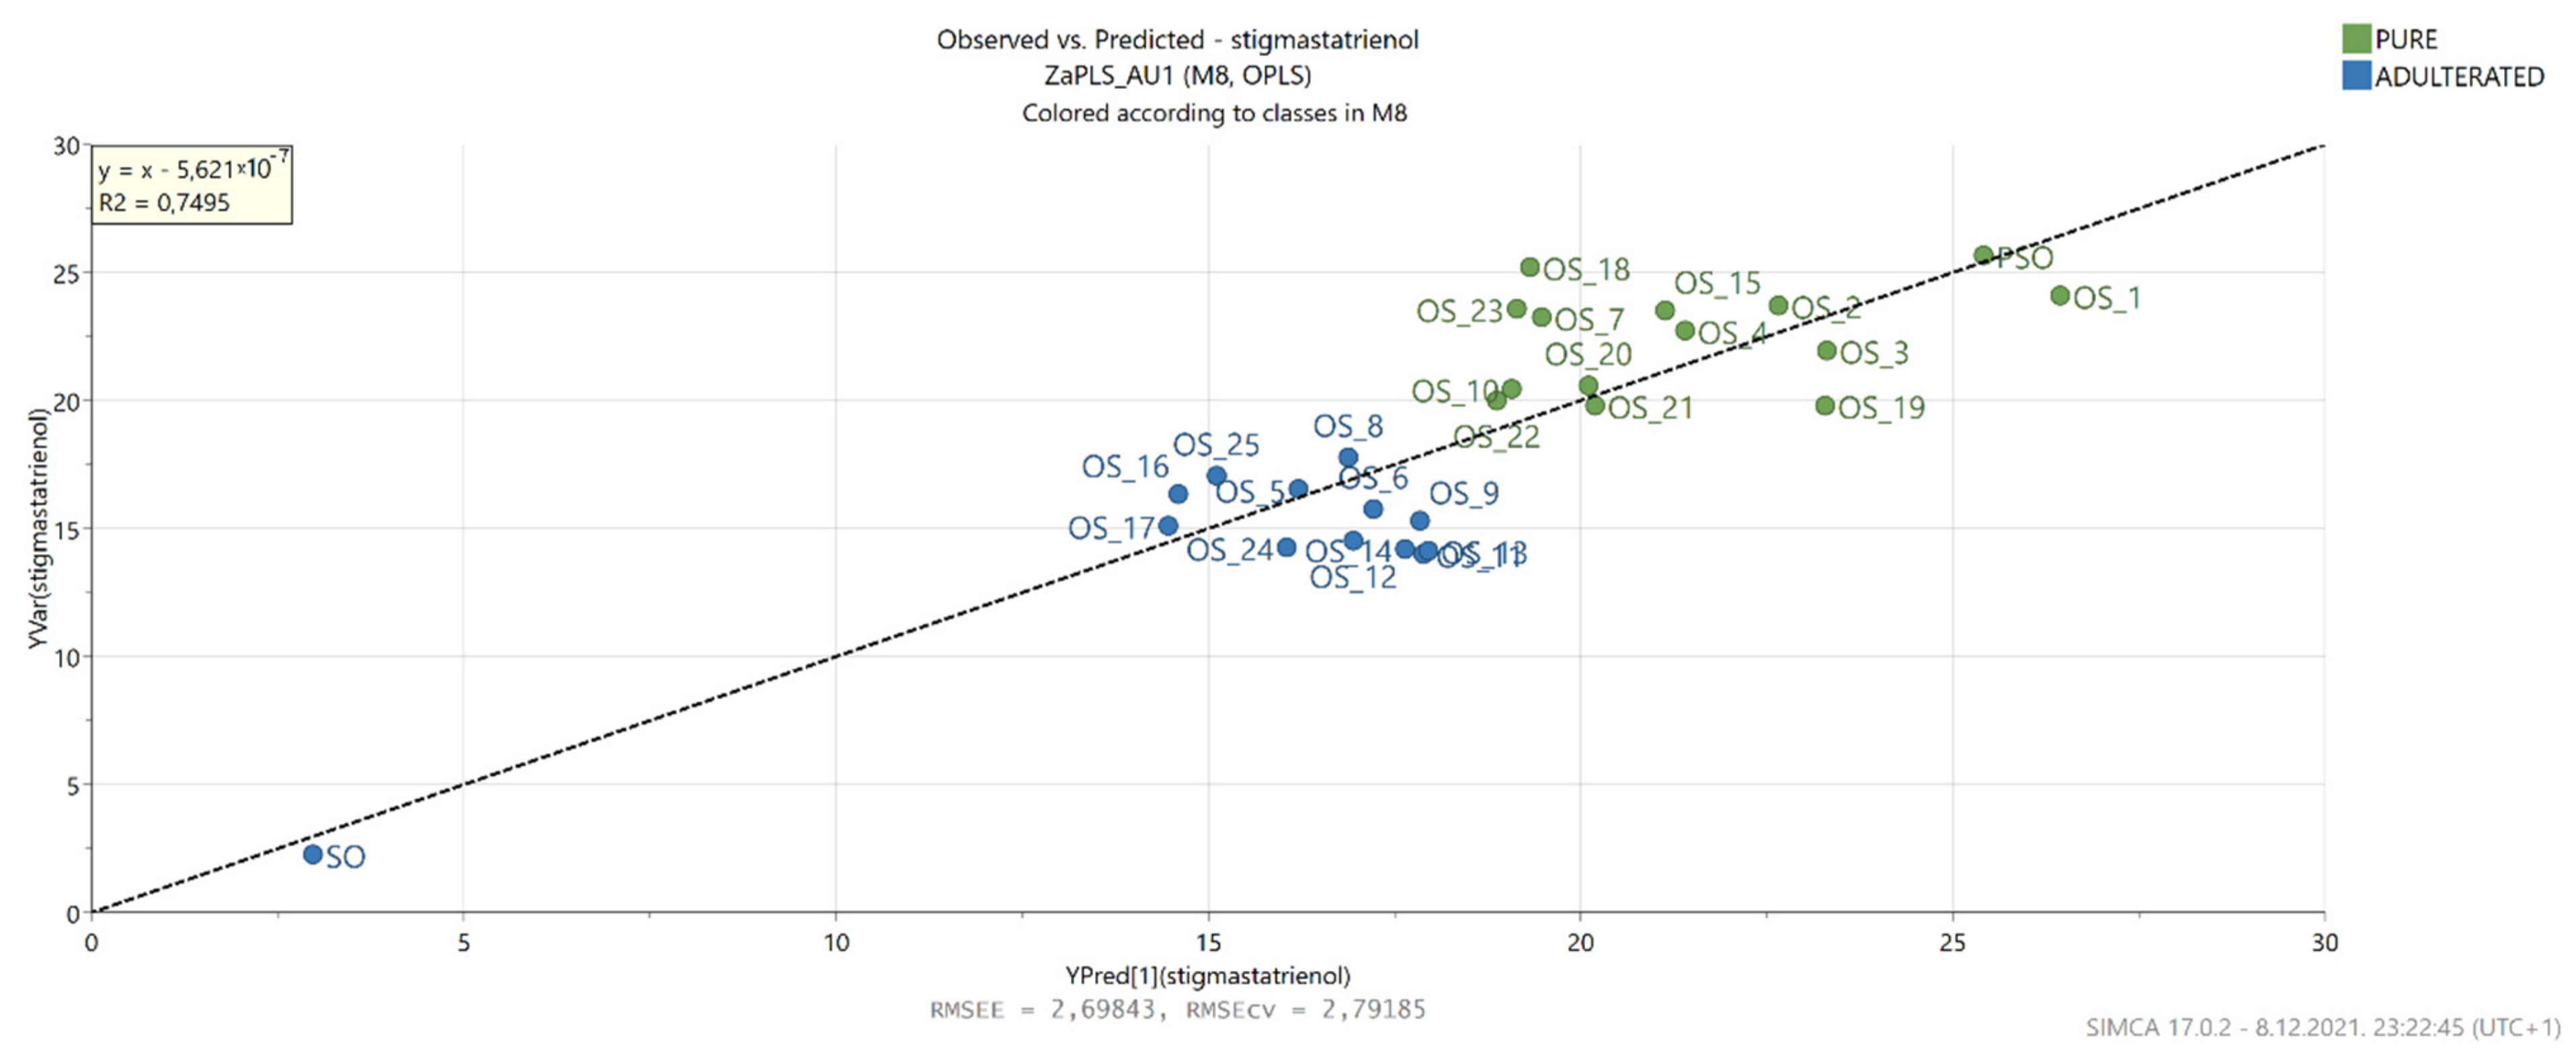
3.7. OPLS
4. Conclusions
Author Contributions
Funding
Data Availability Statement
Conflicts of Interest
References
- Fruhwirth, G.O.; Hermetter, A. Production technology and characteristics of Styrian pumpkin seed oil. Eur. J. Lipid Sci. Technol. 2008, 110, 637–644. [Google Scholar] [CrossRef]
- Bizwit Research & Consulting LLP. Global Pumpkin Seed Oil Market Size study, by Type (Food Grade, Pharmaceutical Grade), Application (Food, Medical, Industry) and Regional Forecasts 2019-2026; Bizwit Research & Consulting LLP: Kawasaki, Japan, 2019. [Google Scholar]
- Vorobyova, O.A.; Bolshakova, A.E.; Pegova, R.A.; Kol’chik, O.V.; Klabukova, I.N.; Krasilnikova, E.; Melnikova, N.B. Analysis of the components of pumpkin seed oil in suppositories and the possibility of its use in pharmaceuticals. J. Chem. Pharm. Res. 2014, 6, 1106–1116. [Google Scholar]
- Procida, G.; Stancher, B.; Cateni, F.; Zacchigna, M. Chemical composition and functional characterisation of commercial pumpkin seed oil. J. Sci. Food Agric. 2013, 93, 1035–1041. [Google Scholar] [CrossRef] [PubMed]
- Nábrádi, A.; Hajnalka, M.; Lapis, M. Economics of oil pumpkin seed production. Roczniki 2015, 2015. [Google Scholar] [CrossRef]
- Mandl, A.; Reich, G.; Lindner, W. Detection of adulteration of pumpkin seed oil by analysis of content and composition of specific Δ7-phytosterols. Eur. Food Res. Technol. 1999, 209, 400–406. [Google Scholar] [CrossRef]
- Marcotrigiano, V.; Lanzilotti, C.; Rondinone, D.; De Giglio, O.; Caggiano, G.; Diella, G.; Orsi, G.B.; Montagna, M.T.; Napoli, C. Food labelling: Regulations and public health implications. Ann. Ig 2018, 30, 220–228. [Google Scholar] [CrossRef]
- European Commission. Commission Regulation (EC) No 1263/96 of 1 July 1996 Supplementing the Annex to Regulation (EC) No 1107/96 on the Registration of Geographical Indications and Designations of Origin under the Procedure Laid Down in Article 17 of Regulation (EEC) No 2081/9; European Commission: Brusseles, Belgium, 1996. [Google Scholar]
- European Commission. Commission Implementing Regulation (EU) 2016/1921 of 20 October 2016 Approving Non-Minor Amendments to the Specification for a Name Entered in the Register of Protected Designations of Origin and Protected Geographical Indications [Štajersko Prekmursko Bučno Olje (PGI)]; European Commission: Brusseles, Belgium, 2016. [Google Scholar]
- Kamm, W.; Dionisi, F.; Hischenhuber, C.; Engel, K.-H. Authenticity assessment of fats and oils. Food Rev. Int. 2001, 17, 249–290. [Google Scholar] [CrossRef]
- CXS 210-1999; Standard for Named Vegetable Oils. Codex Alimentarius: Rome, Italy, 2019.
- Purcaro, G.; Barp, L.; Beccaria, M.; Conte, L.S. Fingerprinting of vegetable oil minor components by multidimensional comprehensive gas chromatography with dual detection. Anal. Bioanal. Chem. 2015, 407, 309–319. [Google Scholar] [CrossRef]
- Xu, B.; Zhang, L.; Wang, H.; Luo, D.; Li, P. Characterization and authentication of four important edible oils using free phytosterol profiles established by GC-GC-TOF/MS. Anal. Methods 2014, 6, 6860–6870. [Google Scholar] [CrossRef]
- Wenzl, T.; Prettner, E.; Schweiger, K.; Wagner, F.S. An improved method to discover adulteration of Styrian pumpkin seed oil. J. Biochem. Biophys. Methods 2002, 53, 193–202. [Google Scholar] [CrossRef]
- ISO 12228-1:2014; Determination of Individual and Total Sterols Contents—Gas Chromatographic Method—Part 1: Animal and Vegetable Fats and Oils. ISO: Geneva, Switzerland, 2014.
- Nunes, C.A. Vibrational spectroscopy and chemometrics to assess authenticity, adulteration and intrinsic quality parameters of edible oils and fats. Food Res. Int. 2014, 60, 255–261. [Google Scholar] [CrossRef]
- Grassi, S.; Alamprese, C. Advances in NIR spectroscopy applied to process analytical technology in food industries. Curr. Opin. Food Sci. 2018, 22, 17–21. [Google Scholar] [CrossRef]
- Qu, J.-H.; Liu, D.; Cheng, J.-H.; Sun, D.-W.; Ma, J.; Pu, H.; Zeng, X.-A. Applications of near-infrared spectroscopy in food safety evaluation and control: A review of recent research advances. Crit. Rev. Food Sci. Nutr. 2015, 55, 1939–1954. [Google Scholar] [CrossRef]
- Potočnik, T.; Ogrinc, N.; Potočnik, D.; Košir, I.J. Fatty acid composition and δ13C isotopic ratio characterisation of pumpkin seed oil. J. Food Compos. Anal. 2016, 53, 85–90. [Google Scholar] [CrossRef]
- Butinar, B.; Bučar-Miklavčič, M.; Valenčič, V.; Raspor, P. Stereospecific Analysis of Triacylglycerols as a Useful Means To Evaluate Genuineness of Pumpkin Seed Oils: Lesson from Virgin Olive Oil Analyses. J. Agric. Food Chem. 2010, 58, 5227–5234. [Google Scholar] [CrossRef]
- Ozen, B.F.; Weiss, I.; Mauer, L.J. Dietary supplement oil classification and detection of adulteration using Fourier transform infrared spectroscopy. J. Agric. Food Chem. 2003, 51, 5871–5876. [Google Scholar] [CrossRef]
- ISO 11664-4:2008; Colorimetry—Part 4: CIE 1976 L*a*b* Colour Space. ISO: Geneva, Switzerland, 2008.
- Regulation NN 11/19. Regulation on Edible Oils and Fats. Available online: https://leap.unep.org/countries/hr/national-legislation/regulation-edible-oils-and-fats-0 (accessed on 21 January 2022).
- Giuffrè, A.M.; LouAdj, L. Influence of crop season and cultivar on sterol composition of monovarietal olive oils in Reggio Calabria (Italy). Czech J. Food Sci. 2013, 31, 256–263. [Google Scholar] [CrossRef] [Green Version]
- Murkovic, M.; Piironen, V.; Lampi, A.M.; Kraushofer, T.; Sontag, G. Changes in chemical composition of pumpkin seeds during the roasting process for production of pumpkin seed oil (Part 1: Non-volatile compounds). Food Chem. 2004, 84, 359–365. [Google Scholar] [CrossRef]
- Breinhölder, P.; Mosca, L.; Lindner, W. Concept of sequential analysis of free and conjugated phytosterols in different plant matrices. J. Chromatogr. B 2002, 777, 67–82. [Google Scholar] [CrossRef]
- Dulf, F.V.; Bele, C.; Unguresan, M.; Parlog, R.; Socaciu, C. Phytosterols as Markers in Identi-fication of the Adulterated Pumpkin Seed Oil with Sunflower Oil. Bull. UASVM Agric. 2009, 66, 301–306. [Google Scholar] [CrossRef]
- Nakić, S.N.; Rade, D.; Škevin, D.; Štrucelj, D.; Mokrovčak, Ž.; Bartolić, M. Chemical characteristics of oils from naked and husk seeds of Cucurbita pepo L. Eur. J. Lipid Sci. Technol. 2006, 108, 936–943. [Google Scholar] [CrossRef]
- Hrabovski, N.; Sinadinovic-Fiser, S.; Nikolovski, B.; Sovilj, M.; Borota, O. Phytosterols in pumpkin seed oil extracted by organic solvents and supercritical CO2. Eur. J. Lipid Sci. Technol. 2012, 114, 1204–1211. [Google Scholar] [CrossRef]
- Vadivel, V.; Ravichandran, N.; Rajalakshmi, P.; Brindha, P.; Gopal, A.; Kumaravelu, C. Microscopic, phytochemical, HPTLC, GC–MS and NIRS methods to differentiate herbal adulterants: Pepper and papaya seeds. J. Herb. Med. 2018, 11, 36–45. [Google Scholar] [CrossRef]
- Yang, H.; Irudayaraj, J.; Paradkar, M.M. Discriminant analysis of edible oils and fats by FTIR, FT-NIR and FT-Raman spectroscopy. Food Chem. 2005, 93, 25–32. [Google Scholar] [CrossRef]
- Li, X.; Zhang, L.; Zhang, Y.; Wang, D.; Wang, X.; Yu, L.; Zhang, W.; Li, P. Review of NIR spectroscopy methods for nondestructive quality analysis of oilseeds and edible oils. Trends Food Sci. Technol. 2020, 101, 172–181. [Google Scholar] [CrossRef]
- Lankmayr, E.; Mocak, J.; Serdt, K.; Balla, B.; Wenzl, T.; Bandoniene, D.; Gfrerer, M.; Wagner, S. Chemometrical classification of pumpkin seed oils using UV–Vis, NIR and FTIR spectra. J. Biochem. Biophys. Methods 2004, 61, 95–106. [Google Scholar] [CrossRef]
- Inarejos-García, A.M.; Gómez-Alonso, S.; Fregapane, G.; Salvador, M.D. Evaluation of minor components, sensory characteristics and quality of virgin olive oil by near infrared (NIR) spectroscopy. Food Res. Int. 2013, 50, 250–258. [Google Scholar] [CrossRef]
- Armenta, S.; Garrigues, S.; De la Guardia, M. Determination of edible oil parameters by near infrared spectrometry. Anal. Chim. Acta 2007, 596, 330–337. [Google Scholar] [CrossRef]
- Ranjan, R.; Kumar, N.; Kiranmayee, A.H.; Panchariya, P.C. Characterization of Edible Oils Using NIR Spectroscopy and Chemometric Methods. In International Conference on Intelligent Systems Design and Applications; Springer: Berlin, Germany, 2018; pp. 292–300. [Google Scholar]
- Beć, K.B.; Grabska, J.; Huck, C.W. Principles and applications of miniaturized near-infrared (NIR) spectrometers. Chem. Eur. J. 2021, 27, 1514–1532. [Google Scholar] [CrossRef]
- Alcalà, M.; Blanco, M.; Moyano, D.; Broad, N.W.; O’Brien, N.; Friedrich, D.; Pfeifer, F.; Siesler, H.W. Qualitative and quantitative pharmaceutical analysis with a novel hand-held miniature near infrared spectrometer. J. Near Infrared Spectrosc. 2013, 21, 445–457. [Google Scholar] [CrossRef] [Green Version]
- Basri, K.N.; Khir, M.F.A.; Rani, R.A.; Sharif, Z.; Rusop, M.; Zoolfakar, A.S. Qualitative analysis of pure and adulterated canola oil via SIMCA. In AIP Conference Proceedings; AIP Publishing LLC: Melville, NY, USA, 2018; Volume 1963, p. 20025. [Google Scholar]
- Kreft, S.; Kreft, M. Physicochemical and physiological basis of dichromatic colour. Naturwissenschaften 2007, 94, 935–939. [Google Scholar] [CrossRef] [PubMed]
- Andjelkovic, M.; Van Camp, J.; Trawka, A.; Verhe, R. Phenolic compounds and some quality parameters of pumpkin seed oil. Eur. J. Lipid Sci. Technol. 2010, 112, 208–217. [Google Scholar] [CrossRef]
- Huang, L.; Wang, M.; Liu, H. Identification of Adulterated Extra Virgin Olive Oil by Colorimetric Sensor Array. Food Anal. Methods 2021, 15, 647–657. [Google Scholar] [CrossRef]
- Karthik, D.; Vijayarekha, K.; Manickkam, V. A simple method for detecting adulteration in sunflower oil using chemometry. Rasayan J. Chem. 2014, 7, 99–103. [Google Scholar]
- Hair, J.F., Jr.; Sarstedt, M.; Hopkins, L.; Kuppelwieser, V.G. Partial least squares structural equation modeling (PLS-SEM). Eur. Bus. Rev. 2014, 26, 106–121. [Google Scholar] [CrossRef]
- Dogruer, I.; Uyar, H.H.; Uncu, O.; Ozen, B. Prediction of chemical parameters and authentication of various cold pressed oils with fluorescence and mid-infrared spectroscopic methods. Food Chem. 2021, 345, 128815. [Google Scholar] [CrossRef]
- Irnawati, R.S.; Martono, S.; Rohman, A. The employment of FTIR spectroscopy and chemometrics for authentication of pumpkin seed oil from sesame oil. Food Res. 2019, 4, 42–48. [Google Scholar] [CrossRef]
- Mariani, N.C.T.; de Almeida Teixeira, G.H.; de Lima, K.M.G.; Morgenstern, T.B.; Nardini, V.; Júnior, L.C.C. NIRS and iSPA-PLS for predicting total anthocyanin content in jaboticaba fruit. Food Chem. 2015, 174, 643–648. [Google Scholar] [CrossRef]
- Irnawati, I.; Riyanto, S.; Martono, S.; Rohman, A. The employment of FTIR spectroscopy and chemometrics for the classification and prediction of antioxidant activities of pumpkin seed oils from different origins. J. Appl. Pharm. Sci. 2021, 11, 100–107. [Google Scholar] [CrossRef]


| Sample | Campesterol (%) | Campestanol (%) | Δ5-Stigmasterol (%) | β-Sitosterol (%) | Total Δ5-Sterols (%) |
|---|---|---|---|---|---|
| OS_1 | 2.23 ± 0.04 | 0.77 ± 0.08 | 2.02 ± 0.06 | 7.03 ± 0.12 | 12.05 ± 0.30 |
| OS_2 | 0.00 ± 0.00 | 0.00 ± 0.00 | 0.89 ± 0.04 | 3.31 ± 0.16 | 4.20 ± 0.71 |
| OS_3 | 2.78 ± 0.08 | 0.84 ± 0.02 | 1.30 ± 0.04 | 8.50 ± 0.11 | 13.42 ± 0.25 |
| OS_4 | 2.77 ± 0.13 | 0.52 ± 0.04 | 3.16 ± 0.15 | 7.61 ± 0.27 | 14.06 ± 0.59 |
| OS_5 | 4.75 ± 0.06 | 0.59 ± 0.05 | 5.25 ± 0.22 | 27.79 ± 0.24 | 38.37 ± 0.57 |
| OS_6 | 6.27 ± 0.10 | 0.00 ± 0.02 | 5.67 ± 0.17 | 27.65 ± 0.49 | 39.59 ± 0.78 |
| OS_7 | 2.05 ± 0.04 | 0.00 ± 0.04 | 0.94 ± 0.06 | 7.61 ± 0.09 | 10.61 ± 0.23 |
| OS_8 | 5.92 ± 0.09 | 0.38 ± 0.01 | 5.82 ± 0.09 | 27.54 ± 0.27 | 39.67 ± 0.46 |
| OS_9 | 5.70 ± 0.07 | 0.70 ± 0.06 | 5.47 ± 0.13 | 30.56 ± 0.33 | 42.43 ± 0.59 |
| OS_10 | 3.02 ± 0.13 | 0.74 ± 0.05 | 1.55 ± 0.05 | 11.11 ± 0.41 | 16.42 ± 0.63 |
| OS_11 | 5.17 ± 0.03 | 0.65 ± 0.04 | 5.41 ± 0.20 | 29.21 ± 2.56 | 40.44 ± 2.83 |
| OS_12 | 5.06 ± 0.13 | 0.61 ± 0.03 | 0.65 ± 0.12 | 29.71 ± 0.18 | 36.03 ± 0.75 |
| OS_13 | 4.30 ± 0.18 | 0.31 ± 0.02 | 5.83 ± 0.36 | 27.75 ± 0.30 | 38.20 ± 0.87 |
| OS_14 | 6.11 ± 0.25 | 0.82 ± 0.06 | 5.35 ± 0.29 | 28.34 ± 0.20 | 40.62 ± 0.81 |
| OS_15 | 1.18 ± 0.22 | 0.06 ± 0.06 | 2.28 ± 0.18 | 14.39 ± 0.68 | 17.92 ± 1.14 |
| OS_16 | 5.03 ± 0.21 | 0.63 ± 0.04 | 4.90 ± 0.06 | 27.02 ± 0.13 | 37.59 ± 0.44 |
| OS_17 | 5.03 ± 0.07 | 0.85 ± 0.09 | 5.13 ± 0.09 | 27.00 ± 0.74 | 38.02 ± 0.39 |
| OS_18 | 1.92 ± 0.27 | 0.65 ± 0.18 | 1.04 ± 0.20 | 5.91 ± 0.41 | 9.52 ± 1.06 |
| OS_19 | 3.20 ± 0.20 | 0.25 ± 0.05 | 2.28 ± 0.11 | 12.85 ± 0.41 | 18.58 ± 0.77 |
| OS_20 | 3.74 ± 0.23 | 0.80 ± 0.15 | 3.60 ± 0.45 | 12.69 ± 0.49 | 20.83 ± 1.31 |
| OS_21 | 3.15 ± 0.06 | 0.63 ± 0.06 | 2.02 ± 0.10 | 12.33 ± 0.44 | 18.13 ± 0.66 |
| OS_22 | 3.58 ± 0.16 | 0.34 ± 0.02 | 2.28 ± 0.15 | 12.55 ± 0.33 | 18.75 ± 0.66 |
| OS_23 | 1.83 ± 0.14 | 0.00 ± 0.01 | 0.84 ± 0.07 | 6.12 ± 0.27 | 8.79 ± 0.49 |
| OS_24 | 5.35 ± 0.15 | 0.55 ± 0.03 | 0.82 ± 0.16 | 29.62 ± 0.48 | 36.33 ± 0.81 |
| OS_25 | 5.18 ± 0.09 | 0.51 ± 0.05 | 4.68 ± 0.26 | 27.76 ± 0.33 | 38.14 ± 0.73 |
| Range | 0.00–6.27 | 0.00–0.85 | 0.65–5.83 | 3.31–30.56 | 4.20–42.43 |
| PSO | 1.61 ± 0.11 | 0.72 ± 0.08 | 0.72 ± 0.29 | 5.66 ± 0.12 | 8.71 ± 0.60 |
| SO | 8.54 ± 0.14 | 0.31 ± 0.07 | 10.13 ± 0.12 | 61.21 ± 0.02 | 80.19 ± 0.36 |
| Sample | Spinasterol (%) | Δ7,22,25-Stigma- statrienol (%) | Δ7,25-Stigma- stadienol (%) | Δ7-Stigma- sterol (%) | Δ7-Avena- sterol (%) | Total Δ7-Sterols (%) |
|---|---|---|---|---|---|---|
| OS_1 | 22.01 ± 0.29 | 24.11 ± 0.45 | 25.76 ± 0.68 | 1.59 ± 0.15 | 14.48 ± 0.27 | 87.95 ± 2.42 |
| OS_2 | 26.33 ± 0.76 | 23.72 ± 0.47 | 26.13 ± 0.57 | 0.97 ± 0.07 | 18.66 ± 0.36 | 95.80 ± 1.69 |
| OS_3 | 23.21 ± 0.26 | 21.97 ± 0.30 | 24.92 ± 0.75 | 1.17 ± 0.14 | 15.30 ± 0.16 | 86.58 ± 1.61 |
| OS_4 | 22.86 ± 0.28 | 22.76 ± 0.17 | 22.48 ± 0.62 | 1.58 ± 0.01 | 16.27 ± 0.31 | 85.94 ± 1.40 |
| OS_5 | 14.38 ± 0.31 | 16.53 ± 0.09 | 16.64 ± 0.18 | 0.54 ± 0.04 | 13.54 ± 0.31 | 61.63 ± 0.92 |
| OS_6 | 17.15 ± 0.40 | 15.77 ± 0.20 | 13.66 ± 0.33 | 0.00 ± 0.00 | 13.83 ± 0.18 | 60.41 ± 1.12 |
| OS_7 | 24.85 ± 0.21 | 23.27 ± 0.31 | 24.37 ± 0.37 | 1.20 ± 0.10 | 15.70 ± 0.14 | 89.39 ± 1.13 |
| OS_8 | 13.42 ± 0.40 | 17.76 ± 0.17 | 15.31 ± 0.92 | 1.01 ± 0.07 | 12.83 ± 0.29 | 60.33 ± 1.85 |
| OS_9 | 13.11 ± 0.22 | 15.29 ± 0.42 | 15.94 ± 0.42 | 0.54 ± 0.03 | 12.68 ± 0.50 | 57.57 ± 1.59 |
| OS_10 | 23.35 ± 0.09 | 20.45 ± 0.42 | 23.37 ± 0.37 | 0.98 ± 0.08 | 15.51 ± 0.10 | 83.65 ± 1.06 |
| OS_11 | 12.21 ± 0.87 | 14.03 ± 0.85 | 20.92 ± 0.43 | 1.23 ± 0.16 | 11.17 ± 0.78 | 59.56 ± 3.09 |
| OS_12 | 11.77 ± 0.61 | 14.51 ± 0.18 | 24.63 ± 0.71 | 0.48 ± 0.00 | 12.58 ± 0.20 | 63.97 ± 1.21 |
| OS_13 | 13.50 ± 0.33 | 14.16 ± 0.21 | 21.13 ± 0.81 | 0.31 ± 0.04 | 12.70 ± 0.01 | 61.80 ± 1.39 |
| OS_14 | 14.85 ± 0.14 | 14.17 ± 0.22 | 17.56 ± 0.58 | 0.19 ± 0.05 | 12.62 ± 0.36 | 59.39 ± 1.35 |
| OS_15 | 20.93 ± 0.77 | 23.53 ± 0.66 | 22.22 ± 0.22 | 0.11 ± 0.02 | 15.30 ± 0.52 | 82.08 ± 2.14 |
| OS_16 | 16.03 ± 0.22 | 16.33 ± 0.27 | 16.88 ± 0.48 | 0.31 ± 0.04 | 12.86 ± 0.24 | 62.41 ± 1.66 |
| OS_17 | 17.27 ± 0.41 | 15.09 ± 0.42 | 15.82 ± 0.23 | 1.15 ± 0.03 | 12.65 ± 0.14 | 61.98 ± 0.42 |
| OS_18 | 25.31 ± 0.12 | 25.19 ± 0.56 | 22.92 ± 0.42 | 1.10 ± 0.13 | 15.96 ± 0.23 | 90.48 ± 1.45 |
| OS_19 | 21.88 ± 1.01 | 19.83 ± 0.46 | 23.93 ± 1.09 | 0.85 ± 0.05 | 14.94 ± 0.25 | 81.42 ± 3.32 |
| OS_20 | 20.97 ± 0.44 | 20.60 ± 0.22 | 21.18 ± 0.58 | 1.38 ± 0.08 | 15.04 ± 0.22 | 79.17 ± 1.54 |
| OS_21 | 22.22 ± 0.62 | 19.82 ± 0.27 | 23.94 ± 0.33 | 0.97 ± 0.09 | 14.92 ± 0.25 | 81.87 ± 1.56 |
| OS_22 | 22.74 ± 0.33 | 19.97 ± 0.13 | 23.76 ± 0.14 | 0.76 ± 0.13 | 14.01 ± 0.58 | 81.25 ± 1.31 |
| OS_23 | 26.79 ± 0.29 | 23.53 ± 0.40 | 24.21 ± 0.63 | 0.85 ± 0.03 | 15.81 ± 1.08 | 91.21 ± 2.43 |
| OS_24 | 14.40 ± 0.50 | 14.23 ± 0.15 | 23.04 ± 0.11 | 0.58 ± 0.04 | 11.42 ± 0.09 | 63.67 ± 0.89 |
| OS_25 | 15.19 ± 0.13 | 17.06 ± 0.29 | 15.10 ± 0.48 | 1.03 ± 0.06 | 13.48 ± 0.12 | 61.86 ± 1.07 |
| Range | 11.77–26.79 | 14.03–25.19 | 13.66–26.13 | 0.00–1.59 | 11.17–18.66 | 57.57–95.80 |
| PSO | 28.61 ± 0.22 | 25.68 ± 0.24 | 22.19 ± 0.21 | 0.50 ± 0.09 | 14.32 ± 0.17 | 91.29 ±0.92 |
| SO | 0.00 ± 0.00 | 2.25 ± 0.00 | 0.00 ± 0.00 | 10.81 ± 0.01 | 6.75 ± 0.00 | 19.81 ± 0.21 |
Publisher’s Note: MDPI stays neutral with regard to jurisdictional claims in published maps and institutional affiliations. |
© 2022 by the authors. Licensee MDPI, Basel, Switzerland. This article is an open access article distributed under the terms and conditions of the Creative Commons Attribution (CC BY) license (https://creativecommons.org/licenses/by/4.0/).
Share and Cite
Balbino, S.; Vincek, D.; Trtanj, I.; Egređija, D.; Gajdoš-Kljusurić, J.; Kraljić, K.; Obranović, M.; Škevin, D. Assessment of Pumpkin Seed Oil Adulteration Supported by Multivariate Analysis: Comparison of GC-MS, Colourimetry and NIR Spectroscopy Data. Foods 2022, 11, 835. https://doi.org/10.3390/foods11060835
Balbino S, Vincek D, Trtanj I, Egređija D, Gajdoš-Kljusurić J, Kraljić K, Obranović M, Škevin D. Assessment of Pumpkin Seed Oil Adulteration Supported by Multivariate Analysis: Comparison of GC-MS, Colourimetry and NIR Spectroscopy Data. Foods. 2022; 11(6):835. https://doi.org/10.3390/foods11060835
Chicago/Turabian StyleBalbino, Sandra, Dragutin Vincek, Iva Trtanj, Dunja Egređija, Jasenka Gajdoš-Kljusurić, Klara Kraljić, Marko Obranović, and Dubravka Škevin. 2022. "Assessment of Pumpkin Seed Oil Adulteration Supported by Multivariate Analysis: Comparison of GC-MS, Colourimetry and NIR Spectroscopy Data" Foods 11, no. 6: 835. https://doi.org/10.3390/foods11060835