
Changes in the Physicochemical Properties, Antioxidant Activity and Metabolite Analysis of Black Elephant Garlic (Allium ampeloprasum L.) during Aging Period

Abstract
:1. Introduction
2. Material and Methods
2.1. Samples
2.2. Materials
2.3. Sample Preparation and Metabolite Analysis by GC/MS
2.4. Identification and Quantification of Metabolites
2.5. Determination of Proximate Composition
2.6. Determination of Mineral Contents
2.7. Color Analysis
2.8. pH, Reducing Sugars and Browning Intensity Analysis
2.9. Extraction of EG and BEG
2.10. Determination of Total Polyphenol Content (TPC)
2.11. Determination of Total Flavonoid Content (TFC)
2.12. DPPH Free Radical Scavenging Activity Assay
3. Statistical Analysis
3.1. Results and Discussion
3.1.1. Proximate Composition
3.1.2. Mineral Contents
3.1.3. Color Values and Browning Intensity
3.1.4. pH
3.1.5. Reducing Sugars
3.1.6. Profiling of Metabolites in EG according to the Aging Period
3.1.7. TPC, TFC and DPPH Free Radical Scavenging Activity
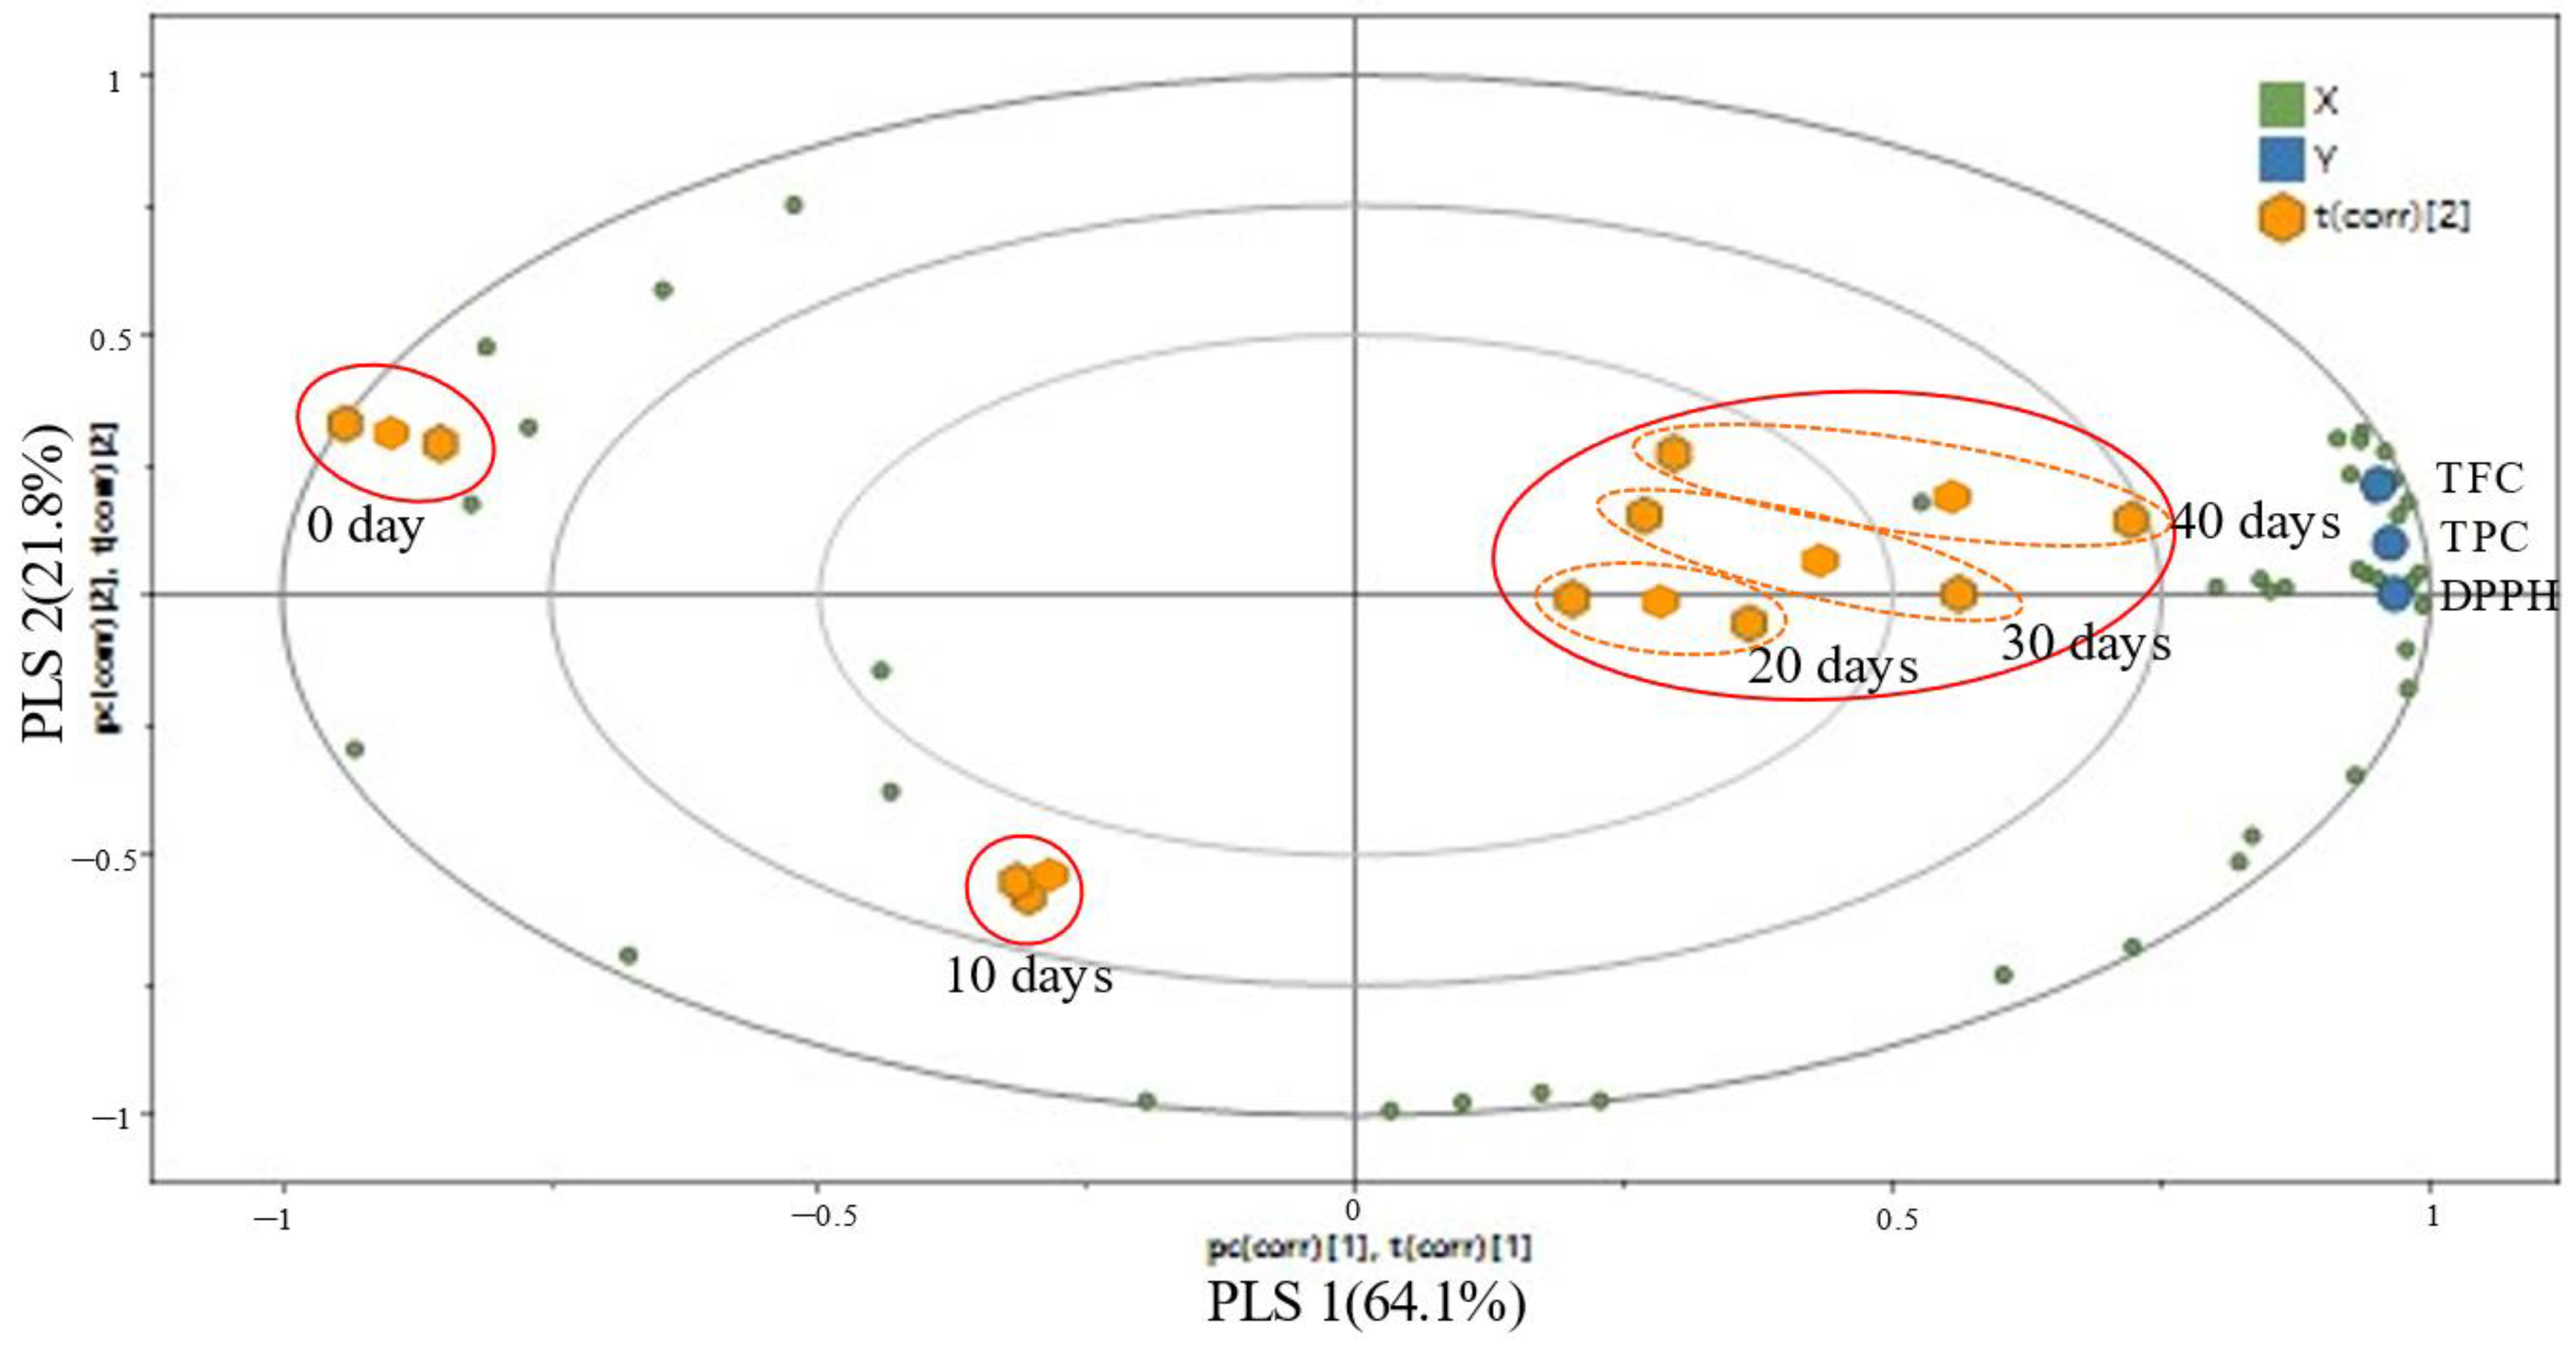
3.1.8. Correlation between Metabolite Variation and Antioxidant Activities of EG According to Aging Period
4. Conclusions
Author Contributions
Funding
Institutional Review Board Statement
Informed Consent Statement
Data Availability Statement
Conflicts of Interest
Abbreviations
| 5-HMF | 5-Hydroxymethylfurfural |
| 5-HMFA | 5-Hydroxymethyl-2-furoic acid |
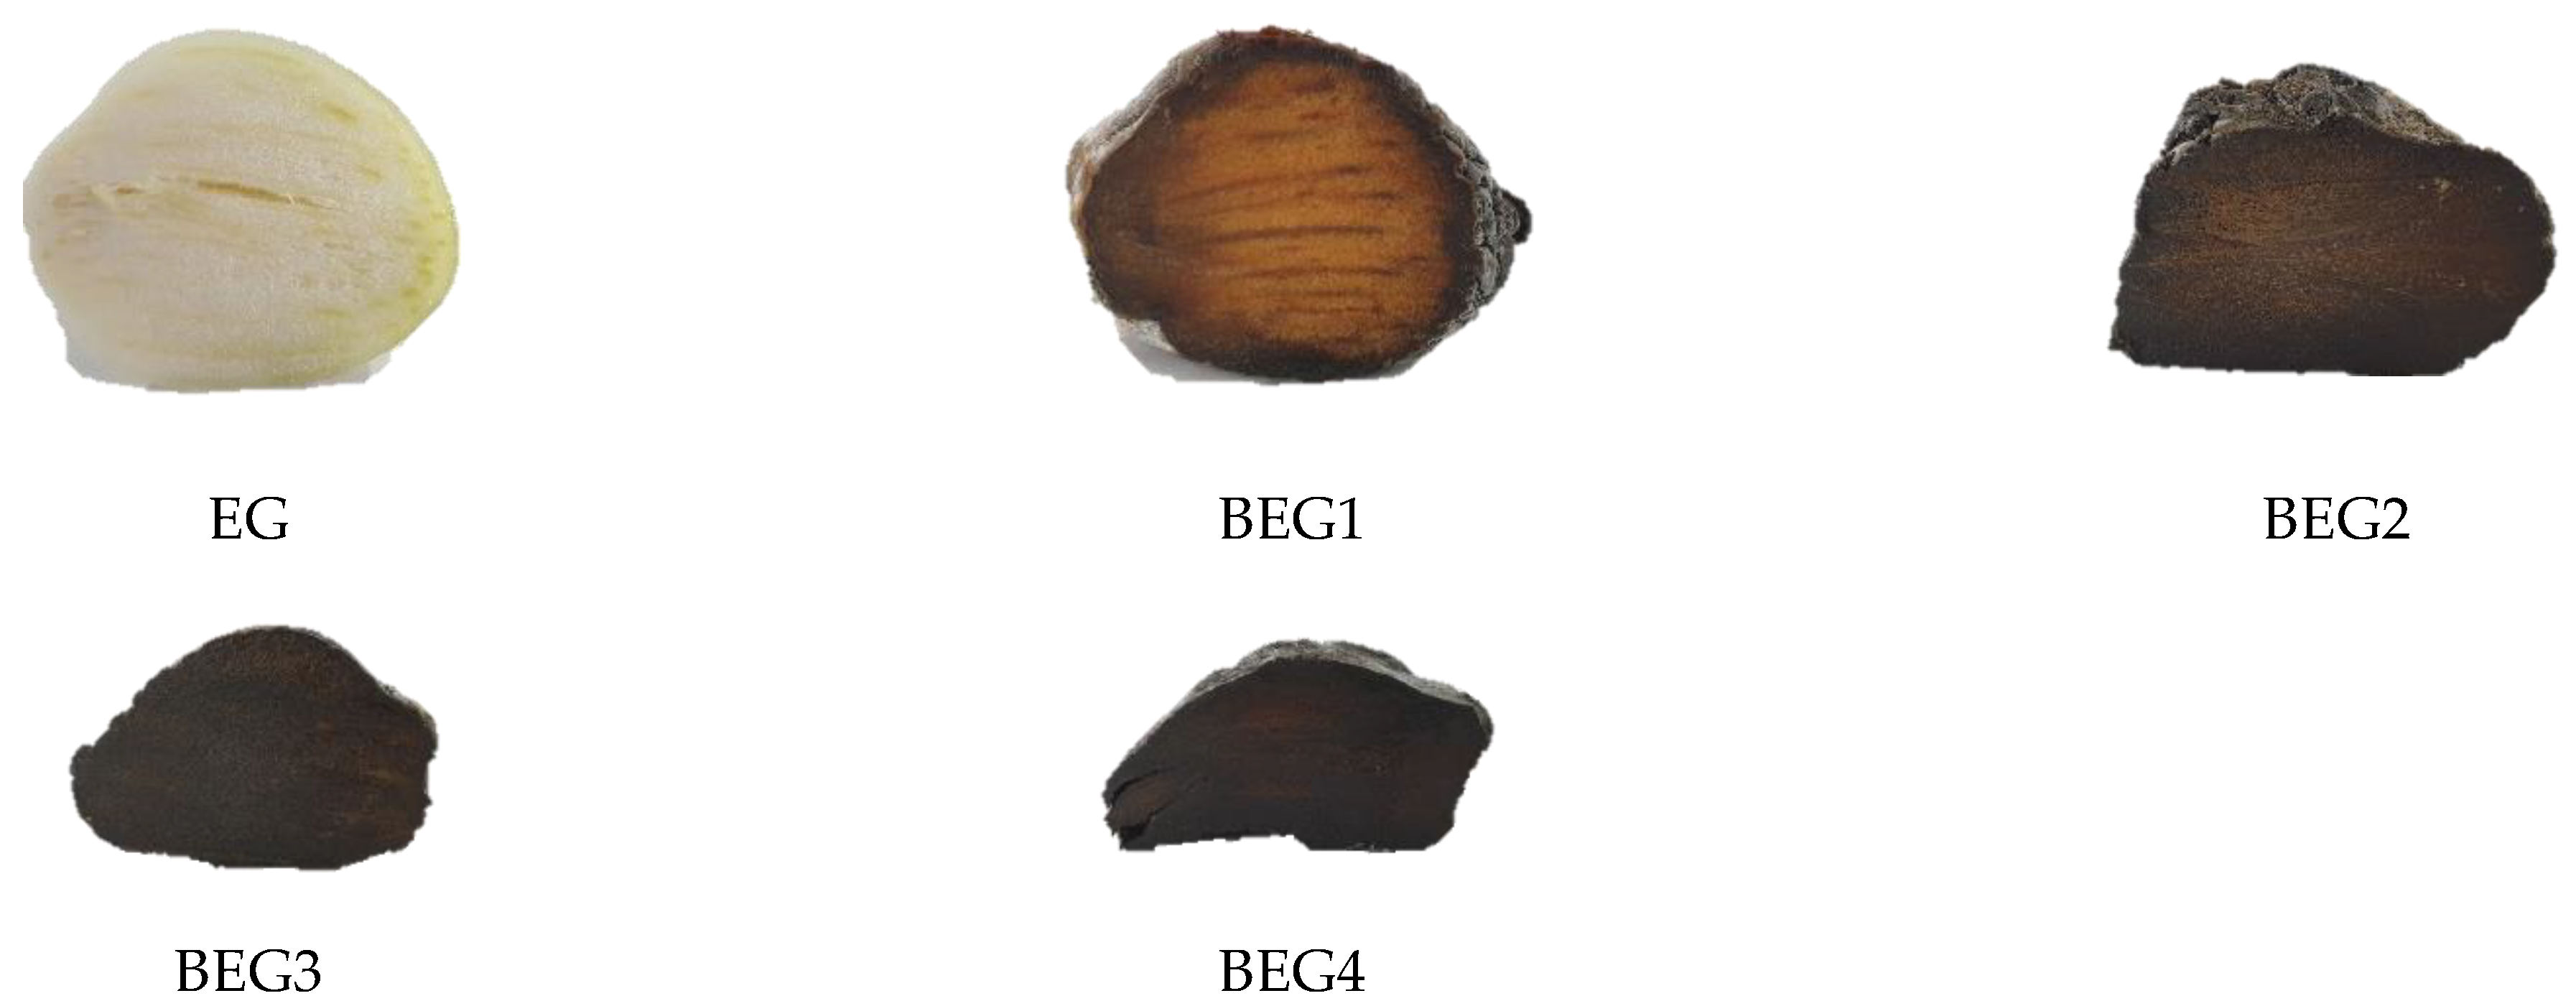
| BEG | Black elephant garlic |
| BEG1 | Elephant garlic aged for 10 days |
| BEG2 | Elephant garlic aged for 20 days |
| BEG3 | Elephant garlic aged for 30 days |
| BEG4 | Elephant garlic aged for 40 days |
| BSTFA | N, O-Bis trimethylsilyl trifluoroacetamide |
| DNS | 3,5-Dinitrosalicylic acid |
| DPPH | 2,2-Diphenyl-1-picrylhydrazyl |
| EG | Elephant garlic |
| GABA | γ-Aminobutyric acid |
| GAE | Gallic acid equivalents |
| GC/MS | Gas chromatography mass spectrometry |
| NIST | National Institute of Standards and Technology |
| PCA | Principal component analysis |
| PLS-DA | Partial least square discrimination analysis |
| RE | Rutin equivalents |
| TFC | Total flavonoid content |
| TPC | Total polyphenol content |
References
- Guenaoui, C.; Mang, S.; Figliuolo, G.; Neffati, M. Diversity in Allium ampeloprasum: From small and wild to large and cultivated. Genet. Resour. Crop Evol. 2013, 60, 97–114. [Google Scholar] [CrossRef]
- Corzo-Martínez, M.; Corzo, N.; Villamiel, M. Biological properties of onions and garlic. Trends Food Sci. Technol. 2007, 18, 609–625. [Google Scholar] [CrossRef]
- Shang, A.; Cao, S.; Xu, X.; Gan, R.; Tang, G.; Corke, H.; Mavumengwana, V.; Li, H. Bioactive compounds and biological functions of garlic (Allium sativum, L.). Foods 2019, 8, 246. [Google Scholar] [CrossRef] [PubMed] [Green Version]
- Kim, J.; Jeong, D.; Lee, Y.; Hahn, D.; Nam, J.; Lee, W.; Hong, D.; Kim, S.R.; Ha, Y.S. Development and metabolite profiling of elephant garlic vinegar. J. Microbiol. Biotechnol. 2018, 28, 50–58. [Google Scholar] [CrossRef] [PubMed] [Green Version]
- Seo, B.Y. Changes in Physicochemical Properties and by the Aging Conditions of Garlic. J. Korean Soc. Ind. Converg. 2022, 25, 21–26. [Google Scholar] [CrossRef]
- Kim, D.; Kim, K.H.; Yook, H.S. Analysis of active components of giant black garlic. J. Korean Soc. Food Sci. Nutr. 2015, 44, 1672–1681. [Google Scholar] [CrossRef]
- Choi, D.J.; Lee, S.J.; Kang, M.J.; Cho, H.S.; Sung, N.J. Physicochemical characteristics of black garlic (Allium sativum L.). J. Korean Soc. Food Sci. Nutr. 2008, 37, 465–471. [Google Scholar] [CrossRef]
- Davídek, T.; Devaud, S.; Robert, F.; Blank, I. Sugar fragmentation in the Maillard reaction cascade: Isotope labeling studies on the formation of acetic acid by a hydrolytic β-dicarbonyl cleavage mechanism. J. Agric. Food Chem. 2006, 54, 6667–6676. [Google Scholar] [CrossRef]
- Kang, O.J. Physicochemical characteristics of black garlic after different thermal processing steps. Prev. Nutr. Food Sci. 2016, 21, 348–354. [Google Scholar] [CrossRef] [Green Version]
- Toledano Medina, M.A.; Perez-Aparicio, J.; Moreno-Ortega, A.; Moreno-Rojas, R. Influence of variety and storage time of fresh garlic on the physicochemical and antioxidant properties of black garlic. Foods 2019, 8, 314. [Google Scholar] [CrossRef]
- Zhao, Y.; Jiang, Y.; Ding, Y.; Wang, D.; Deng, Y. High hydro-static pressure-assisted extraction of high-molecular-weight mela-noidins from black garlic: Composition, structure, and bioactive properties. J. Food Qual. 2019, 2019, 168274. [Google Scholar] [CrossRef]
- Javed, M.; Ahmed, W. Black garlic: A review of its biological significance. J. Food Biochem. 2022, 2022, e14394. [Google Scholar] [CrossRef] [PubMed]
- Turan, E.; Şimşek, A.J.J. Black garlic as a substitute for fresh garlic to reduce off-flavor and enhance consumer acceptance and bioactive properties in cemen paste. J. Food Proces. Preserv. 2022, 46, e16246. [Google Scholar] [CrossRef]
- Najman, K.; Sadowska, A.; Hallmann, E. Evaluation of bioactive and physicochemical properties of white and black garlic (Allium sativum L.) from conventional and organic cultivation. Appl. Sci. 2021, 11, 874. [Google Scholar] [CrossRef]
- Kim, D.; Kim, K.H.; Yook, H.S. Comparison of antioxidant activity between black elephant garlic (Allium ampeloprasum) and black normal garlic (Allium sativum L.). J. Korean Soc. Food Sci. Nutr. 2019, 43, 1352–1358. [Google Scholar] [CrossRef]
- Wu, J.; Liu, Y.; Dou, Z.; Wu, T.; Liu, R.; Sui, W.; Jin, Y.; Zhang, M. Black garlic melanoidins prevent obesity, reduce serum LPS levels and modulate the gut microbiota composition in high-fat diet- induced obese C57BL/6J mice. Food Funct. 2020, 11, 9585–9598. [Google Scholar] [CrossRef] [PubMed]
- Sato, E.; Kohno, M.; Hamano, H.; Niwano, Y. Increased anti-oxidative potency of garlic by spontaneous short-term fermentation. Plant Foods Hum. Nutr. 2006, 61, 157–160. [Google Scholar] [CrossRef]
- Shin, J.A.; Won, D.H.; Swarup, N.; Ahn, M.H.; Yang, S.O.; Chawla, K.; Kim, J.; Choi, S.J.; Ahn, C.H.; Oh, K.Y.; et al. Methanol extract of Sedum oryzifolium and its constituent, trehalose, impede the invasiveness of oral squamous cell carcinoma cell lines via downregulation of Slug. Phytomedicine 2021, 91, 153670. [Google Scholar] [CrossRef]
- AOAC. Official Methods of Analysis of the Association of Official Analytical Chemists; AOAC: Washington, DC, USA, 2010. [Google Scholar]
- Miller, G.L. Use of dinitrosalicylic acid reagent for determination of reducing sugar. Anal. Chem. 1959, 31, 426–428. [Google Scholar] [CrossRef]
- Hillis, W.E.; Swain, T. The phenolic constituents of prunus domestica. II.-The analysis of tissues of the victoria plum tree. J. Sci. Food Agric. 1959, 10, 135–144. [Google Scholar] [CrossRef]
- Davis, W.B. Determination of flavanones in citrus fruits. Anal. Chem. 1947, 19, 476–478. [Google Scholar] [CrossRef]
- Blois, M.S. Antioxidant determinations by the use of a stable free radical. Nature 1958, 181, 1199–1200. [Google Scholar] [CrossRef]
- Shin, G.H.; Choi, D.J.; Lee, S.J.; Cha, J.Y.; Kim, J.G.; Sung, N.J. Changes of physicochemical components and antioxidant activity of garlic during its processing. J. Life Sci. 2008, 18, 1123–1131. [Google Scholar] [CrossRef] [Green Version]
- Choi, I.S.; Cha, H.S.; Lee, Y.S. Physicochemical and antioxidant properties of black garlic. Molecules 2014, 19, 16811–16823. [Google Scholar] [CrossRef] [Green Version]
- Zhang, X.; Li, N.; Lu, X.; Liu, P.; Qiao, X. Effects of temperature on the quality of black garlic. J. Sci. Food Agric. 2015, 96, 2366–2372. [Google Scholar] [CrossRef]
- Najman, K.; Sadowska, A.; Hallmann, E. Influence of thermal processing on the bioactive, antioxidant, and physicochemical properties of conventional and organic agriculture black garlic (Allium sativum L.). Appl. Sci. 2020, 10, 8638. [Google Scholar] [CrossRef]
- Yuan, H.; Sun, L.; Chen, M.; Wang, J. An analysis of the changes on intermediate products during the thermal processing of black garlic. Food Chem. 2018, 239, 56–61. [Google Scholar] [CrossRef]
- Vhangani, L.N.; Van Wyk, J. Antioxidant activity of Maillard reaction products (MRPs) derived from fructose–lysine and ribose–lysine model systems. Food Chem. 2013, 137, 92–98. [Google Scholar] [CrossRef]
- Liu, C.; Lu, L.; Yang, C.; Niu, C.; Wang, J.; Zheng, F.; Li, Q. Effects of thermal treatment on alliin and its related sulfides during black garlic processing. LWT Food Sci. Technol. 2022, 159, 113158. [Google Scholar] [CrossRef]
- Jia, Z.; Wang, Z.; Xu, C.; Liang, J.; Wei, B.; Wu, D.; Zhu, S. Study on poly (methyl methacrylate)/carbon nanotube composites. Mater. Sci. Eng. A 1999, 271, 395–400. [Google Scholar] [CrossRef]
- Rahman, M.S. Allicin and other functional active components in garlic: Health benefits and bioavailability. Int. J. Food Prop. 2007, 10, 245–268. [Google Scholar] [CrossRef]
- Chua, L.S.; Abdullah, F.I.; Lim, S.H. Physiochemical changes and nutritional content of black garlic during fermentation. Appl. Food Res. 2022, 2, 100216. [Google Scholar] [CrossRef]
- Liang, T.; Wei, F.; Lu, Y.; Kodani, Y.; Nakada, M.; Miyakawa, T.; Tanokura, M. Comprehensive NMR analysis of compositional changes of black garlic during thermal processing. J. Agric. Food Chem. 2015, 63, 683–691. [Google Scholar] [CrossRef] [PubMed]
- Ryu, J.H.; Kang, D. Physicochemical properties, biological activity, health benefits, and general limitations of aged black garlic: A review. Molecules 2017, 22, 919. [Google Scholar] [CrossRef] [PubMed] [Green Version]
- Molina-Calle, M.; Priego-Capote, F.; de Castro, M.D.L. Headspace–GC–MS volatile profile of black garlic vs. fresh garlic: Evolution along fermentation and behavior under heating. LWT Food Sci. Technol. 2017, 80, 98–105. [Google Scholar] [CrossRef]
- Blecker, C.; Fougnies, C.; Van Herck, J.; Chevalier, J.; Paquot, M. Kinetic study of the acid hydrolysis of various oligofructose samples. J. Agric. Food Chem. 2002, 50, 1602–1607. [Google Scholar] [CrossRef]
- Limacher, A.; Kerler, J.; Davidek, T.; Schmalzried, F.; Blank, I. Formation of furan and methylfuran by Maillard-type reactions in model systems and food. J. Agric. Food Chem. 2008, 56, 3639–3647. [Google Scholar] [CrossRef]
- Huyghues-Despointes, A.; Yaylayan, V.A. Retro-aldol and redox reactions of Amadori compounds: Mechanistic studies with variously labeled D-[13C] glucose. J. Agric. Food Chem. 1996, 44, 672–681. [Google Scholar] [CrossRef]
- Ding, Y.; Jiang, Y.; Deng, Y.; Zhao, Y. Effect of packaging materials and storage temperature on water status, mechanical and thermal properties of black garlic. Food Packag. Shelf Life 2020, 24, 100507. [Google Scholar] [CrossRef]
- Ding, Y.; Zhou, X.; Zhong, Y.; Wang, D.; Dai, B.; Deng, Y. Metabolite, volatile and antioxidant profiles of black garlic stored in different packaging materials. Food Control 2021, 127, 108131. [Google Scholar] [CrossRef]
- Yu, X.; Zhao, M.; Hu, J.; Zeng, S.; Bai, X. Correspondence analysis of antioxidant activity and UV–Vis absorbance of Maillard reaction products as related to reactants. LWT Food Sci. Technol. 2012, 46, 1–9. [Google Scholar] [CrossRef]
- Xu, G.; Ye, X.; Chen, J.; Liu, D. Effect of heat treatment on the phenolic compounds and antioxidant capacity of citrus peel extract. J. Agric. Food Chem. 2007, 55, 330–335. [Google Scholar] [CrossRef] [PubMed]
- Dewanto, V.; Wu, X.; Adom, K.K.; Liu, R.H. Thermal processing enhances the nutritional value of tomatoes by increasing total antioxidant activity. J. Agric. Food Chem. 2002, 50, 3010–3014. [Google Scholar] [CrossRef] [PubMed]
- Kang, M.J.; Kang, J.R.; Woo, M.S.; Kang, D.; Shin, J.H. Alterations in the physicochemical properties and antioxidant activity during aging of stored raw garlic. Foods 2022, 11, 1390. [Google Scholar] [CrossRef]
- Liu, P.; Lu, X.; Li, N.; Zheng, Z.; Zhao, R.; Tang, X.; Qiao, X. Effects and mechanism of free amino acids on browning in the processing of black garlic. J. Sci. Food Agric. 2019, 99, 4670–4676. [Google Scholar] [CrossRef]
- Soobrattee, M.A.; Neergheen, V.S.; Luximon-Ramma, A.; Aruoma, O.I.; Bahorun, T. Phenolics as potential antioxidant therapeutic agents: Mechanism and actions. Food Chem. 2005, 571, 200–213. [Google Scholar] [CrossRef]
- Kwaw, E.; Ma, Y.; Tchabo, W.; Apaliya, M.T.; Wu, M.; Sackey, A.S.; Xiao, L.; Tahir, H.E. Effect of lactobacillus strains on phenolic profile, color attributes and antioxidant activities of lactic-acid-fermented mulberry juice. Food Chem. 2018, 250, 148–154. [Google Scholar] [CrossRef]
- Groussard, C.; Morel, I.; Chevanne, M.; Monnier, M.; Cillard, J.; Delamarche, A. Free radical scavenging and antioxidant effects of lactate ion: An in vitro study. J. Appl. Physiol. 2000, 89, 169–175. [Google Scholar] [CrossRef] [Green Version]
- Zhao, L.; Chen, J.; Su, J.; Li, L.; Hu, S.; Li, B.; Zhang, X.; Xu, Z.; Chen, T. In vitro antioxidant and antiproliferative activities of 5-hydroxymethylfurfural. J. Agric. Food Chem. 2013, 61, 10604–10611. [Google Scholar] [CrossRef]
- Severin, I.; Dumont, C.; Jondeau-Cabaton, A.; Graillot, V.; Chagnon, M. Genotoxic activities of the food contaminant 5-hydroxymethylfurfural using different in vitro bioassays. Toxicol. Lett. 2010, 192, 189–194. [Google Scholar] [CrossRef]
- Kim, H.K.; Choi, Y.; Lee, E.N.; Park, J.K.; Kim, S.; Park, D.; Kim, B.; Lim, Y.; Yoon, S. 5-Hydroxymethylfurfural from black garlic extract prevents TNFα-induced monocytic cell adhesion to HUVECs by suppression of vascular cell adhesion molecule-1 expression, reactive oxygen species generation and NF-κB activation. Phytother. Res. 2011, 25, 965–974. [Google Scholar] [CrossRef] [PubMed]
- Capuano, E.; Fogliano, V. Acrylamide and 5-hydroxymethylfurfural (HMF): A review on metabolism, toxicity, occurrence in food and mitigation strategies. LWT Food Sci. Technol. 2011, 44, 793–810. [Google Scholar] [CrossRef]
- Pastoriza de la Cueva, S.; Álvarez, J.; Végvári, Á.; Montilla-Gómez, J.; Cruz-López, O.; Delgado-Andrade, C.; Rufián-Henares, J.A. Relationship between HMF intake and SMF formation in vivo: An animal and human study. Mol. Nutr. Food Res. 2017, 61, 1600773. [Google Scholar] [CrossRef] [PubMed]
- Abraham, K.; Gürtler, R.; Berg, K.; Heinemeyer, G.; Lampen, A.; Appel, K.E. Toxicology and risk assessment of 5-Hydroxymethylfurfural in food. Mol. Nutr. Food Res. 2011, 55, 667–678. [Google Scholar] [CrossRef]
- Lansalot-Matras, C.; Moreau, C. Dehydration of fructose into 5-hydroxymethylfurfural in the presence of ionic liquids. Catal. Commun. 2003, 4, 517–520. [Google Scholar] [CrossRef]

| Treatments (1) | Proximate Composition (g/100 g, DW) | ||||
|---|---|---|---|---|---|
| Moisture | Crude Protein | Crude Fat | Crude Ash | Carbohydrate | |
| EG | 6.28 ± 0.01 e | 13.24 ± 0.04 a | 0.24 ± 0.02 c | 2.59 ± 0.03 d | 77.90 ± 0.02 a |
| BEG1 | 15.84 ± 0.01 b | 10.96 ± 0.02 c | 0.04 ± 0.01 e | 2.85 ± 0.01 c | 70.36 ± 0.00 d |
| BEG2 | 16.95 ± 0.03 a | 10.61 ± 0.08 e | 0.10 ± 0.00 d | 2.87 ± 0.01 c | 69.58 ± 0.06 e |
| BEG3 | 12.23 ± 0.03 d | 11.29 ± 0.04 b | 0.30 ± 0.03 b | 3.14 ± 0.02 a | 73.35 ± 0.04 b |
| BEG4 | 13.14 ± 0.06 c | 10.81 ± 0.05 d | 0.64 ± 0.04 a | 3.04 ± 0.01 b | 73.02 ± 0.00 c |
| Treatments (1) | Mineral Contents (mg/100 g DW) | |||||||
|---|---|---|---|---|---|---|---|---|
| Sodium | Potassium | Magnesium | Calcium | Chlorine | Sulfate | Ammonium | Phosphate | |
| EG | 1.93 ± 0.09 c | 981.59 ± 0.37 e | 31.74 ± 1.55 e | 0.90 ± 0.20 e | 78.49 ± 0.38 b | 11.88 ± 0.33 d | 149.01 ± 0.02 b | 133.81 ± 1.39 e |
| BEG1 | 1.78 ± 0.06 c | 1184.41 ± 22.30 d | 82.51 ± 0.77 a | 8.12 ± 0.44 d | 58.54 ± 1.65 d | 30.84 ± 0.16 c | 161.81 ± 1.23 a | 672.73 ± 4.35 d |
| BEG2 | 1.71 ± 0.05 c | 1238.25 ± 1.96 c | 65.61 ± 2.23 d | 10.58 ± 0.09 c | 62.95 ± 2.65 c | 31.07 ± 1.06 c | 118.66 ± 1.37 c | 807.35 ± 3.28 c |
| BEG3 | 9.82 ± 0.18 a | 1290.54 ± 14.61 b | 76.19 ± 1.14 c | 21.17 ± 0.42 a | 79.54 ± 1.43 b | 44.15 ± 1.29 b | 96.67 ± 1.62 d | 934.04 ± 2.16 b |
| BEG4 | 2.29 ± 0.23 b | 1334.28 ± 8.16 a | 80.84 ± 6.09 ab | 17.80 ± 0.33 b | 84.45 ± 1.47 a | 57.73 ± 0.31 a | 70.04 ± 0.56 e | 1034.63 ± 2.76 a |
| Treatments (1) | L Value | a Value | b Value | Browning Intensity (420 nm OD) | pH | Reducing Sugar Content (%) |
|---|---|---|---|---|---|---|
| EG | 95.33 ± 0.19 a | −2.07 ± 0.06 e | 17.16 ± 0.11 a | 0.40 ± 0.01 d | 6.47 ± 0.03 a | 0.37 ± 0.01 d |
| BEG1 | 33.25 ± 0.81 b | 7.37 ± 0.08 a | 11.22 ± 0.52 b | 1.19 ± 0.01 c | 4.57 ± 0.01 b | 7.16 ± 0.13 c |
| BEG2 | 33.36 ± 0.64 b | 6.10 ± 0.17 b | 4.28 ± 0.74 c | 2.83 ± 0.01 b | 4.04 ± 0.02 c | 9.67 ± 0.30 a |
| BEG3 | 33.41 ± 0.45 b | 3.66 ± 0.06 c | 2.86 ± 0.41 d | 3.00 ± 0.00 a | 3.81 ± 0.01 d | 9.23 ± 0.18 b |
| BEG4 | 33.61 ± 0.50 b | 2.35 ± 0.17 d | 2.03 ± 0.31 d | 3.00 ± 0.00 a | 3.68 ± 0.01 e | 9.11 ± 0.07 b |
| Compounds | RT (1) (min) | Treatment (2) | TMS (3) | Quantitative Ion | ||||
|---|---|---|---|---|---|---|---|---|
| EG | BEG1 | BEG2 | BEG3 | BEG4 | ||||
| Amino acids | ||||||||
| Alanine | 17.79 | 521.19 | 70.45 | 322.18 | 199.19 | 227.72 | 2 | 116 |
| Leucine | 19.53 | 24.50 | 601.78 | 316.90 | 185.07 | 91.65 | 1 | 86 |
| Isoleucine | 20.18 | ND (4) | 316.97 | 180.58 | 141.06 | 84.94 | 1 | 86 |
| Valine | 21.17 | 547.26 | 132.37 | 352.08 | 194.34 | 179.96 | 2 | 144 |
| Threonine | 23.44 | 20.88 | 134.10 | 62.73 | 27.29 | 10.51 | 2 | 117 |
| Glycine | 23.78 | 247.32 | 209.74 | 392.89 | 327.31 | 258.53 | 3 | 174 |
| Serine | 25.17 | 99.29 | 28.99 | 57.87 | 16.66 | 9.79 | 3 | 204 |
| Aspartic acid | 26.97 | 27.51 | 213.12 | 194.96 | 199.18 | 120.05 | 2 | 160 |
| Pyroglutamic acid | 29.55 | 2670.61 | 25,623.1 | 34,005.24 | 28,167.81 | 24,740.50 | 2 | 156 |
| γ-Aminobutyric acid | 29.74 | 411.97 | 317.87 | 511.51 | 205.84 | 103.26 | 3 | 174 |
| Asparagine | 31.84 | 811.77 | 713.83 | 209.12 | 82.64 | ND | 2 | 75 |
| Glutamic acid | 32.74 | 153.38 | 78.52 | 78.83 | 42.56 | 37.46 | 3 | 246 |
| Organic acids | ||||||||
| Propanoic acid | 16.15 | 49.65 | 532.77 | 328.54 | 187.20 | 143.59 | 2 | 147 |
| Lactic acid | 16.45 | 34.34 | 268.72 | 919.14 | 1236.65 | 1380.65 | 2 | 147 |
| Glycolic acid | 16.97 | 21.55 | 2020.76 | 3768.23 | 4811.96 | 5397.26 | 2 | 147 |
| Oxalic acid | 18.96 | 930.82 | 14.74 | ND | ND | ND | 2 | 147 |
| β-Lactic acid | 19.07 | ND | 315.19 | 1537.15 | 2640.01 | 3418.81 | 2 | 147 |
| Succinic acid | 24.00 | 34.68 | 230.71 | 307.44 | 438.10 | 547.67 | 2 | 147 |
| Glyceric acid | 24.35 | 12.87 | 624.24 | 1476.12 | 2246.77 | 2836.04 | 3 | 147 |
| 2-Deoxytetronic acid | 27.05 | ND | 21.36 | 51.36 | 69.65 | 84.17 | 3 | 233 |
| Malic acid | 28.49 | 1928.60 | 5669.57 | 4980.11 | 5093.08 | 4800.89 | 3 | 147 |
| L-Threonic acid | 29.91 | 21.50 | 1144.63 | 1250.34 | 1419.17 | 1454.97 | 4 | 147 |
| Sugars and sugar derivatives | ||||||||
| D-Erythro-pentofuranose | 33.95 | 35.35 | 36.28 | 39.95 | 27.34 | 17.79 | 3 | 245 |
| Ribitol | 35.82 | 19.92 | 197.26 | 135.73 | 83.81 | 59.37 | 5 | 103 |
| 2-Deoxy-D-erythro-pentofuranose | 39.02 | 23.35 | 43.66 | 181.76 | 237.03 | 300.97 | 3 | 129 |
| Fructopyranose | 40.93 | ND | 12,546.04 | 79,821.30 | 46,575.95 | 40,806.23 | 5 | 204 |
| Fructose | 43.50 | 1141.52 | 781,178.8 | 824,092.8 | 713,242.3 | 741,031.80 | 5 | 103 |
| Sorbose | 44.27 | ND | 1522.51 | 6331.34 | 5254.07 | 5251.97 | 5 | 103 |
| Glucose | 44.47 | 132.31 | 16,917.33 | 80,072.42 | 52,372.73 | 48,026.24 | 5 | 204 |
| β-D-Glucopyranose | 48.28 | 122.19 | 23,690.27 | 109,373.60 | 72,818.34 | 68,102.54 | 5 | 204 |
| Sucrose | 63.98 | 65,372.61 | 138,504.1 | 4686.93 | 113.43 | ND | 8 | 361 |
| Xylose | 64.31 | ND | 66.38 | 575.00 | 718.03 | 742.80 | 5 | 103 |
| Ribofuranose | 64.40 | 1109.61 | 28,238.09 | 55,670.27 | 49,486.07 | 53,381.66 | 4 | 217 |
| Fructofuranose | 64.72 | 79.16 | 45,745.33 | 277,550 | 187,077.3 | 157,197.2 | 5 | 217 |
| 3-α-Mannobiose | 65.69 | 27.64 | 233.66 | 729.25 | 585.78 | 597.90 | 8 | 103 |
| Others | ||||||||
| Phosphoric acid | 22.76 | 396.49 | 19,709.66 | 33,735.43 | 39,475.58 | 45,228.11 | 3 | 299 |
| 2-Deoxypentonic acid | 26.40 | ND | 37.91 | 103.05 | 96.86 | 99.32 | 2 | 103 |
| D-Erythronic acid | 27.09 | ND | 41.86 | 104.95 | 177.45 | 229.67 | 2 | 103 |
| 5-Hydroxymethyl-2-furoic acid | 30.33 | ND | 10 | 114.01 | 186.82 | 211.84 | 2 | 271 |
| 2-Desoxy-pentos-3-ulose | 37.99 | ND | 160.35 | 508.06 | 576.26 | 695.77 | 2 | 231 |
| Ribonic acid | 39.16 | ND | 170.71 | 253.27 | 265.49 | 281.77 | 5 | 292 |
| Treatments (1) | TPC (mg GAE (2)/g) | TFC (mg RE/g) | DPPH Free Radical Scavenging Activity (%) |
|---|---|---|---|
| EG | 4.62 ± 0.48 b | 0.86 ± 0.03 e | 20.27 ± 0.13 e |
| BEG1 | 11.84 ± 0.14 b | 2.48 ± 0.05 d | 50.49 ± 0.47 d |
| BEG2 | 23.43 ± 0.41 a | 7.27 ± 0.10 c | 82.49 ± 0.26 c |
| BEG3 | 27.08 ± 0.14 a | 8.75 ± 0.21 a | 90.98 ± 0.23 a |
| BEG4 | 25.10 ± 0.71 a | 8.39 ± 0.25 b | 85.63 ± 0.24 b |
| Treatments (1) | DPPH Free Radical Scavenging Activity IC50 (2) |
|---|---|
| (μg/mL) | |
| EG | 5927.86 ± 113.72 a |
| BEG1 | 992.13 ± 7.29 b |
| BEG2 | 591.36 ± 7.71 c |
| BEG3 | 465.46 ± 5.27 d |
| BEG4 | 524.01 ± 8.10 cd |
| Trolox | 3.03 ± 0.10 e |
| Ascorbic acid | 2.57 ± 0.03 e |
Disclaimer/Publisher’s Note: The statements, opinions and data contained in all publications are solely those of the individual author(s) and contributor(s) and not of MDPI and/or the editor(s). MDPI and/or the editor(s) disclaim responsibility for any injury to people or property resulting from any ideas, methods, instructions or products referred to in the content. |
© 2022 by the authors. Licensee MDPI, Basel, Switzerland. This article is an open access article distributed under the terms and conditions of the Creative Commons Attribution (CC BY) license (https://creativecommons.org/licenses/by/4.0/).
Share and Cite
Nam, S.-H.; Han, Y.-S.; Sim, K.-H.; Yang, S.-O.; Kim, M.-H. Changes in the Physicochemical Properties, Antioxidant Activity and Metabolite Analysis of Black Elephant Garlic (Allium ampeloprasum L.) during Aging Period. Foods 2023, 12, 43. https://doi.org/10.3390/foods12010043
Nam S-H, Han Y-S, Sim K-H, Yang S-O, Kim M-H. Changes in the Physicochemical Properties, Antioxidant Activity and Metabolite Analysis of Black Elephant Garlic (Allium ampeloprasum L.) during Aging Period. Foods. 2023; 12(1):43. https://doi.org/10.3390/foods12010043
Chicago/Turabian StyleNam, Se-Hyun, Young-Sil Han, Ki-Hyeon Sim, Seung-Ok Yang, and Myung-Hyun Kim. 2023. "Changes in the Physicochemical Properties, Antioxidant Activity and Metabolite Analysis of Black Elephant Garlic (Allium ampeloprasum L.) during Aging Period" Foods 12, no. 1: 43. https://doi.org/10.3390/foods12010043