Article

A Novel Strategy for Accelerating Pumpable Ice Slurry Production with Ozone Micro–Nano Bubbles and Extending the Shelf Life of Larimichthys polyactis

1
Instrumental Analysis Center, Jiangsu University, Zhenjiang 212013, China
2
National Research Center of Pumps and Pumping System Engineering and Technology, Jiangsu University, Zhenjiang 212013, China
3
Agricultural Product Processing and Storage Lab, School of Food and Biological Engineering, Jiangsu University, Zhenjiang 212013, China
4
School of Energy and Power Engineering, Jiangsu University, Zhenjiang 212013, China
*
Authors to whom correspondence should be addressed.
These authors contributed equally to this work.
Foods 2023, 12(11), 2206; https://doi.org/10.3390/foods12112206
Submission received: 25 April 2023 / Revised: 27 May 2023 / Accepted: 28 May 2023 / Published: 31 May 2023
(This article belongs to the Special Issue New Technology for Food Quality and Safety Analysis)

Abstract

:
In this study, a novel strategy for accelerating the production of pumpable ice slurry (PIS) by using ozone micro–nano bubbles (O3-MNBs) was proposed. The effect of PIS containing sodium alginate (SA) and O3-MNBs on the preservation of small yellow croaker (Larimichthys polyactis) was investigated. The results indicate that using SA solution containing O3-MNBs instead of only SA solution resulted in quicker production of PIS by promoting ice nucleation and eliminating supercooling. The distribution and positive effect of O3-MNBs as a nucleation agent on freezing characteristics were discussed. Microbial concentrations, pH, total volatile basic nitrogen, and thiobarbituric acid reactive substance content were also examined. Storage in novel PIS (containing O3-MNBs) had higher performance than storage in flake ice or conventional PIS due to the strong bacteriostatic ability of O3. Therefore, O3-MNBs injection can be used as a novel method for PIS production and the preservation of fresh marine products.

1. Introduction

Regarded as one of the most popular marine products in China, the small yellow croaker (Larimichthys polyactis) is a valuable marine resource because of its high protein and polyunsaturated fatty acid content [1,2]. After being caught, the fresh small yellow croakers, which have high water content, must be chilled with flake ice (FI). Currently, as an alternative to FI, pumpable ice slurry (PIS) is being used as the optimal cooling medium for marine products.
PIS is a novel technique for chilling and preserving the freshness of marine products in ice–water suspensions at subzero temperatures [3]. The main advantages of PIS are its (i) rapid chilling capacity, which is due to its large heat transfer surface area created by its numerous microscopic ice particles; (ii) its fluidity, which enables full coverage of the surface of the fish and mitigates dehydration and oxidation; and (iii) minor physical damage to fish, which is due to its spherical microscopic particles. By contrast, damage to fish can be caused by the sharp edges of FI [4,5].
In 2020, the aquaculture production of small yellow croakers reached 292,290 tons in China, with the scale of fishery production exhibiting an upward trend [6]. Consequently, the consumption of ice on commercial fishing vessels has considerably increased. This increased demand for cooling necessitates refrigeration systems, which consume considerable energy. Supercooling is one of the most critical problems in ice production [7]. This is because it decreases the evaporation temperature of refrigeration systems and prolongs the freezing process. The energy supply on fishing vessels is limited; thus, supercooling during the production of PIS must be controlled.
According to certain studies, micro–nano bubbles (MNBs) can be used to manipulate ice nucleation and thereby enhance the freezing process. Because of its cavitation effect, ultrasound can also be used to accelerate the freezing rate [8,9,10]. Although ice nucleation occurs spontaneously and randomly, the cavitation bubbles produced through ultrasound can promote primary heterogeneous nucleation by acting as ice nuclei [11]. In addition, pre-existing and infused MNBs can accelerate the freezing of liquid systems, such as sucrose and maltodextrin solutions [12], soft serve, milk and apple juice [13], and hydrolyzed gelatin solution [14]. Our previous research on the production of chitosan-based slurry ice demonstrated that the MNBs generated though agitation can accelerate ice nucleation and prevent supercooling [15].
PIS combined with O3 has been used as an effective technique for preserving marine products. Ozone is a bactericidal agent that prolongs the shelf life of fish though its oxidizing capacity and ability to reduce bacterial count [16,17]. Various marine products—such as farmed turbot [18], bighead croaker [19], tiger grouper [3], European anchovy and sardine [20], and large yellow croaker [21]—have been subjected to PIS treatment with O3. However, the majority of studies have focused on evaluating changes in quality during preservation; research on nucleation during the production of PIS has been insufficient.
Therefore, in the current study, a novel strategy for accelerating PIS production with O3-MNBs was developed, and the effect of O3-MNBs on the preservation of fresh small yellow croakers was also investigated. The main objectives were to (i) examine the positive effect of O3-MNBs on PIS production, including the O3-MNBs distribution and freezing characteristics, and (ii) determine the feasibility of using PIS containing O3-MNBs in the preservation of small yellow croakers, including calculating the preservation rate of O3 in PIS and freshness indicators.

2. Materials and Methods

2.1. Materials and Chemical Reagents

Sodium alginate (SA) is a hydrocolloid widely used in the food industry. SA solutions are highly viscous. In such solutions, trapped O3-MNBs serve as nuclei during the initiation of crystallization. Therefore, an SA solution was selected as the substrate for the preparation of PIS. In this study, 0.5 g, 1.0 g or 1.5 g SA (purchased from Sinopharm Chemical Reagent, Shanghai, China) was mixed and filled up with pure water to reach a 100 g solution. All other chemicals used were of analytical grade.
The small yellow croakers (3~4 years old, each weighing about 75 g with an average length 20~24 cm) were selected according to the sampling method [22,23]. All fish samples used in the study were from deceased fish that were purchased from local fish markets (Shenjiamen, Zhoushan, China) and then transferred to the laboratory in a portable refrigerator (0 °C). Upon arrival, the fish samples were washed with cold running distilled water.

2.2. Preparation of Novel PIS

A PIS system was assembled in the laboratory (Figure 1). To improve the dissolving capacity of the hydrocolloids, the SA solution was continuously stirred in a water bath at 50 °C for 20 min and then cooled to room temperature (20 °C). An O3 generator (JZCF-G-3, Jiuzhoulong Company, Xuzhou, China) was subsequently employed to generate O3-MNBs at a concentration of 1.5 mg/L. These O3-MNBs were then injected into the SA solution for 15 min, and the SA solution containing O3-MNBs was pumped into a PIS machine (RF-1000-SP, Ruiyou Company, Nantong, China). The prepared solution was allowed to circulate though the evaporator of the PIS machine, and SA-based PIS containing O3-MNBs (SA-PIS-O3) was finally obtained after full heat exchange with the refrigerant. The temperature of the SA-PIS-O3 was −2 °C, and the mass ratio of the microscopic ice particles to liquid was 6:4.

2.3. Characterization of PIS Production

The effects of the distribution of O3-MNBs and the freezing behavior of SA containing O3-MNBs on the production of PIS were investigated. SA solutions containing 0.5, 1, and 1.5 wt% of SA power were named SA Ⅰ, SA Ⅱ, and SA Ⅲ, respectively. Consequently, the solutions containing O3-MNBs were named SA-O3 Ⅰ, SA-O3 Ⅱ, and SA-O3 Ⅲ, respectively.

2.3.1. Microscopic Analysis

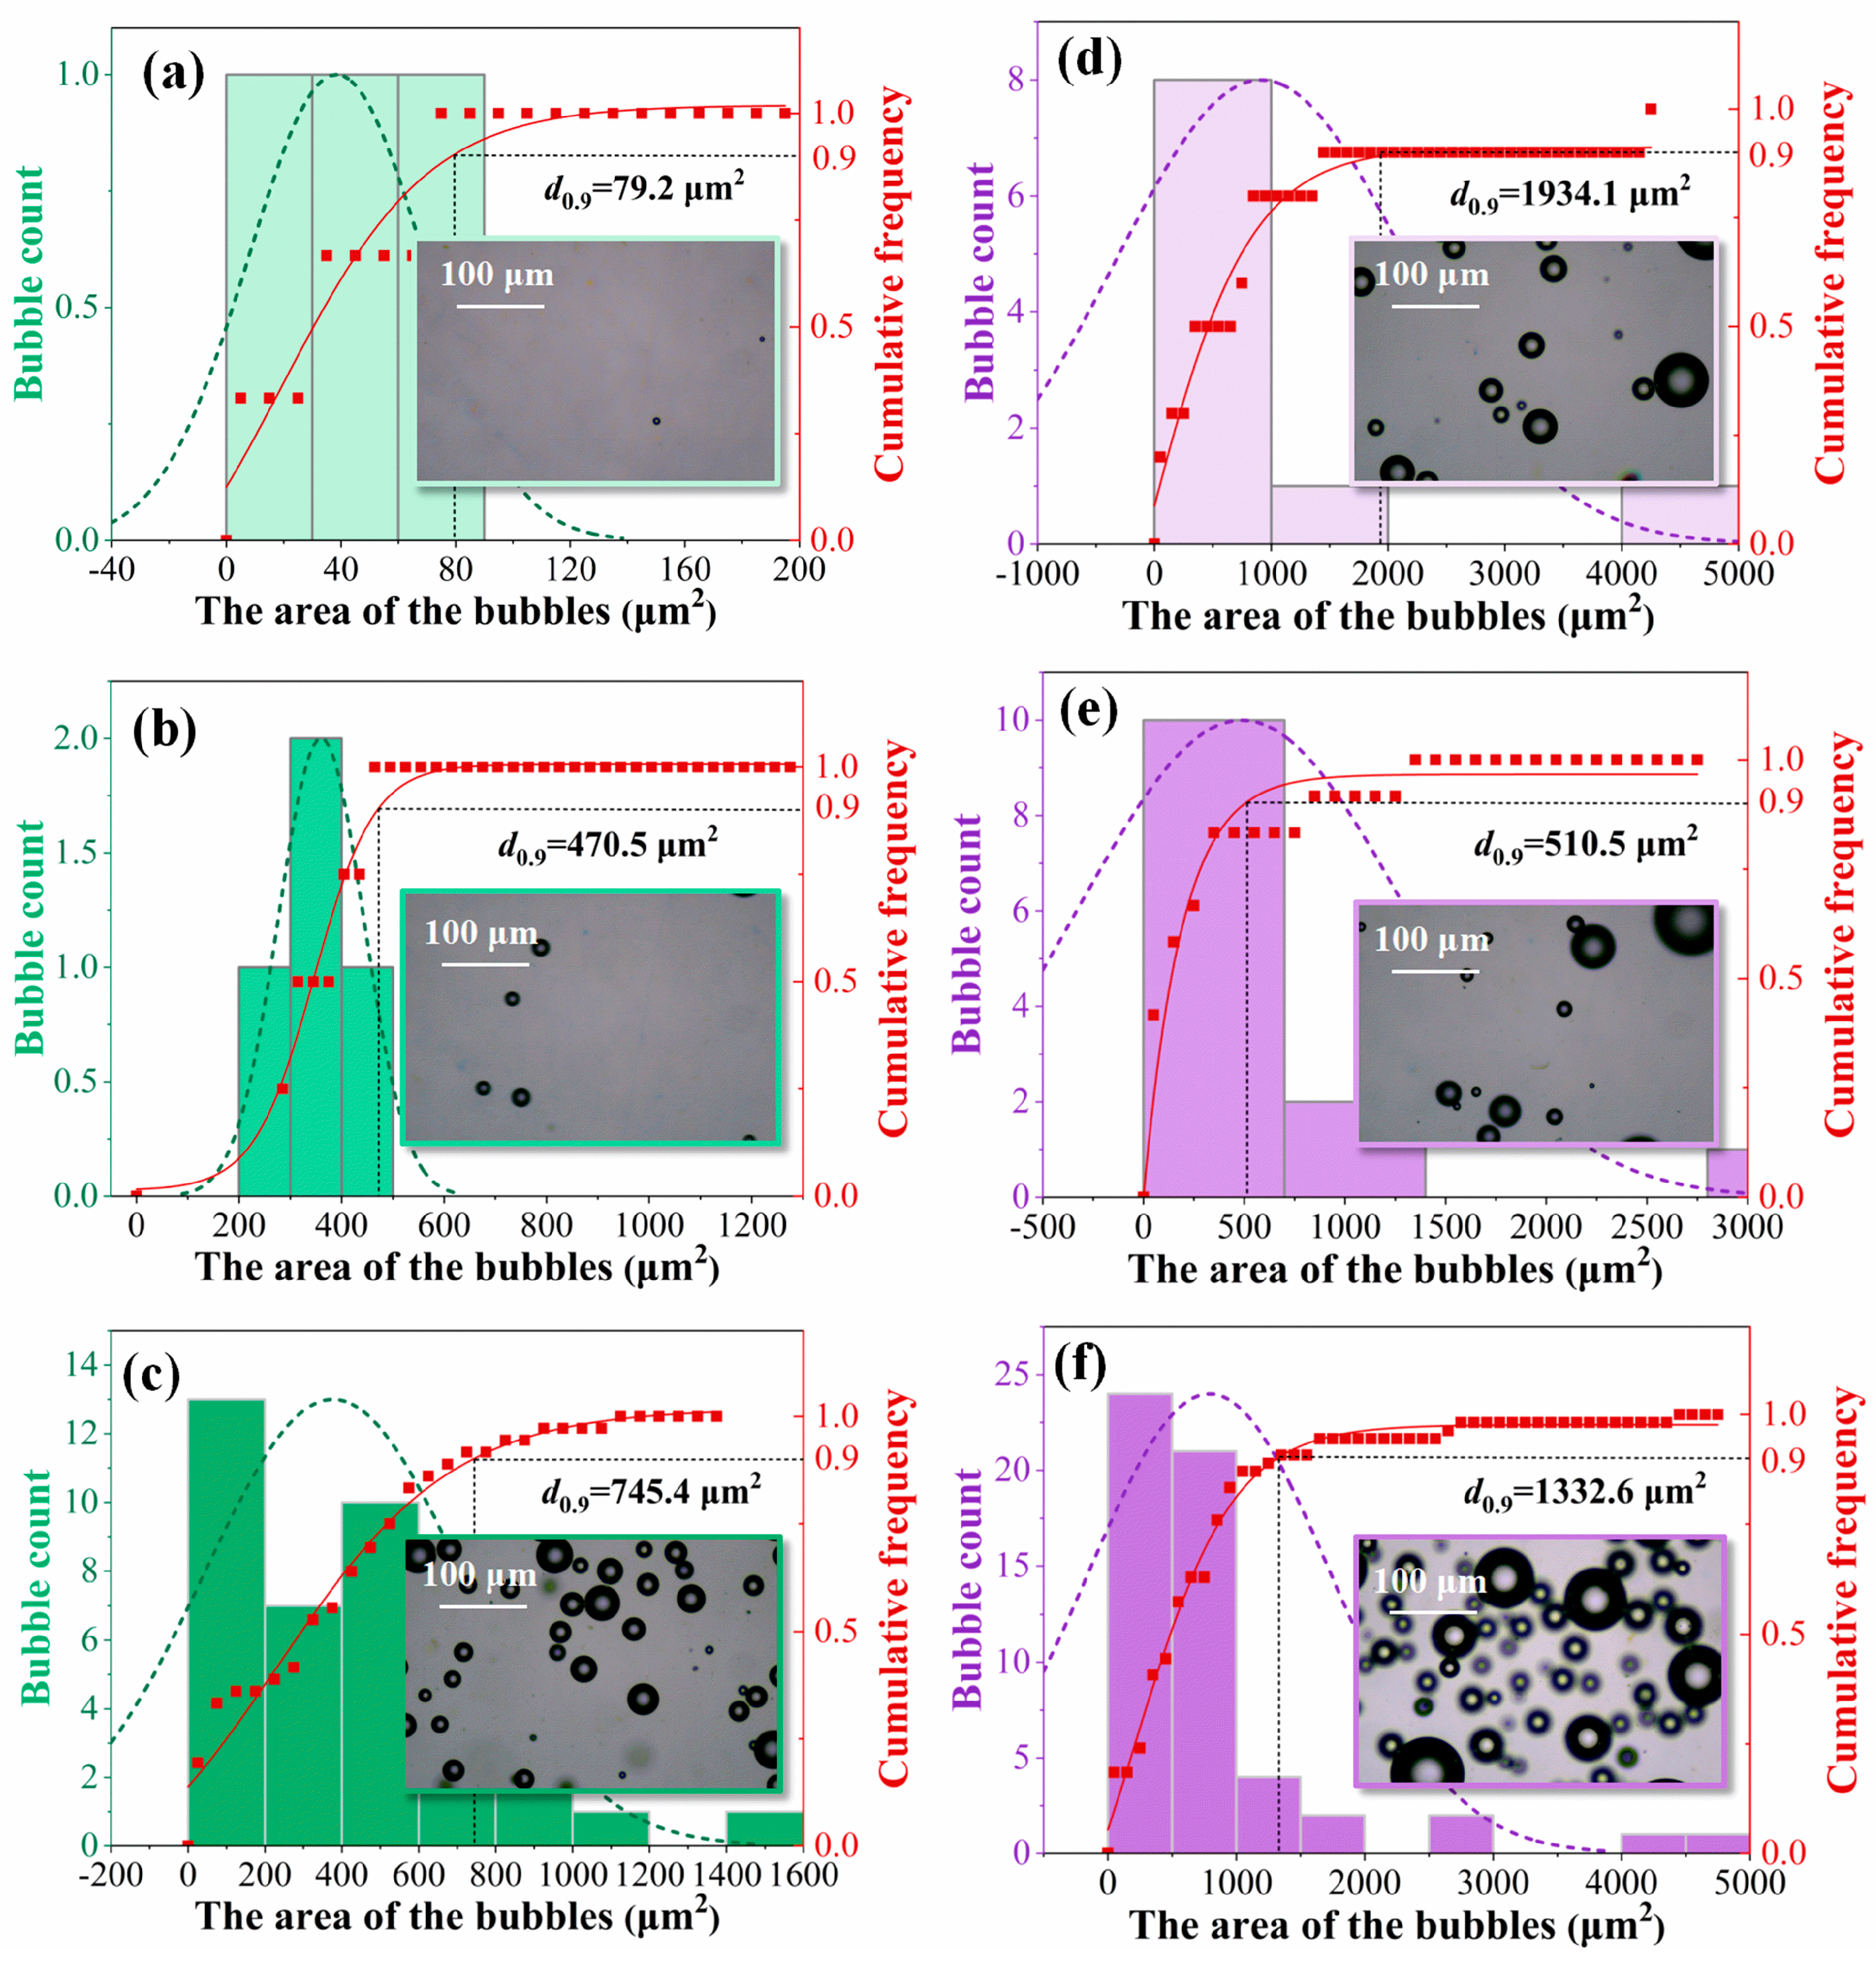
Before the O3-MNBs were pumped into the PIS machine, a light microscope (Nikon ECLIPSE Ci-L, Nikon Vision, Tokyo, Japan) was used to capture images of the O3-MNBs in all solution sample. The images were then analyzed using the ImageJ software (National Institutes of Health, Bethesda, MD, USA). Subsequently, the images were converted into 8-bit images, and their thresholds were adjusted. The dark areas represented the locations of the O3-MNBs. The light areas located at the center of the dark regions were the interiors of the bubbles, and on the images, these interiors were manually filled with dark color. The software was then used to automatically calculate the bubble count and the area of each bubble, and the bubble size distribution of each solution samples was represented as a cumulative frequency curves. For a cumulative frequency curve, steeper slop represented that the bubble size distribution was more concentrated, while long tails at the left or right side of the cumulative frequency curve indicated that the bubble size distribution was nonuniform.

2.3.2. Freezing Characteristics

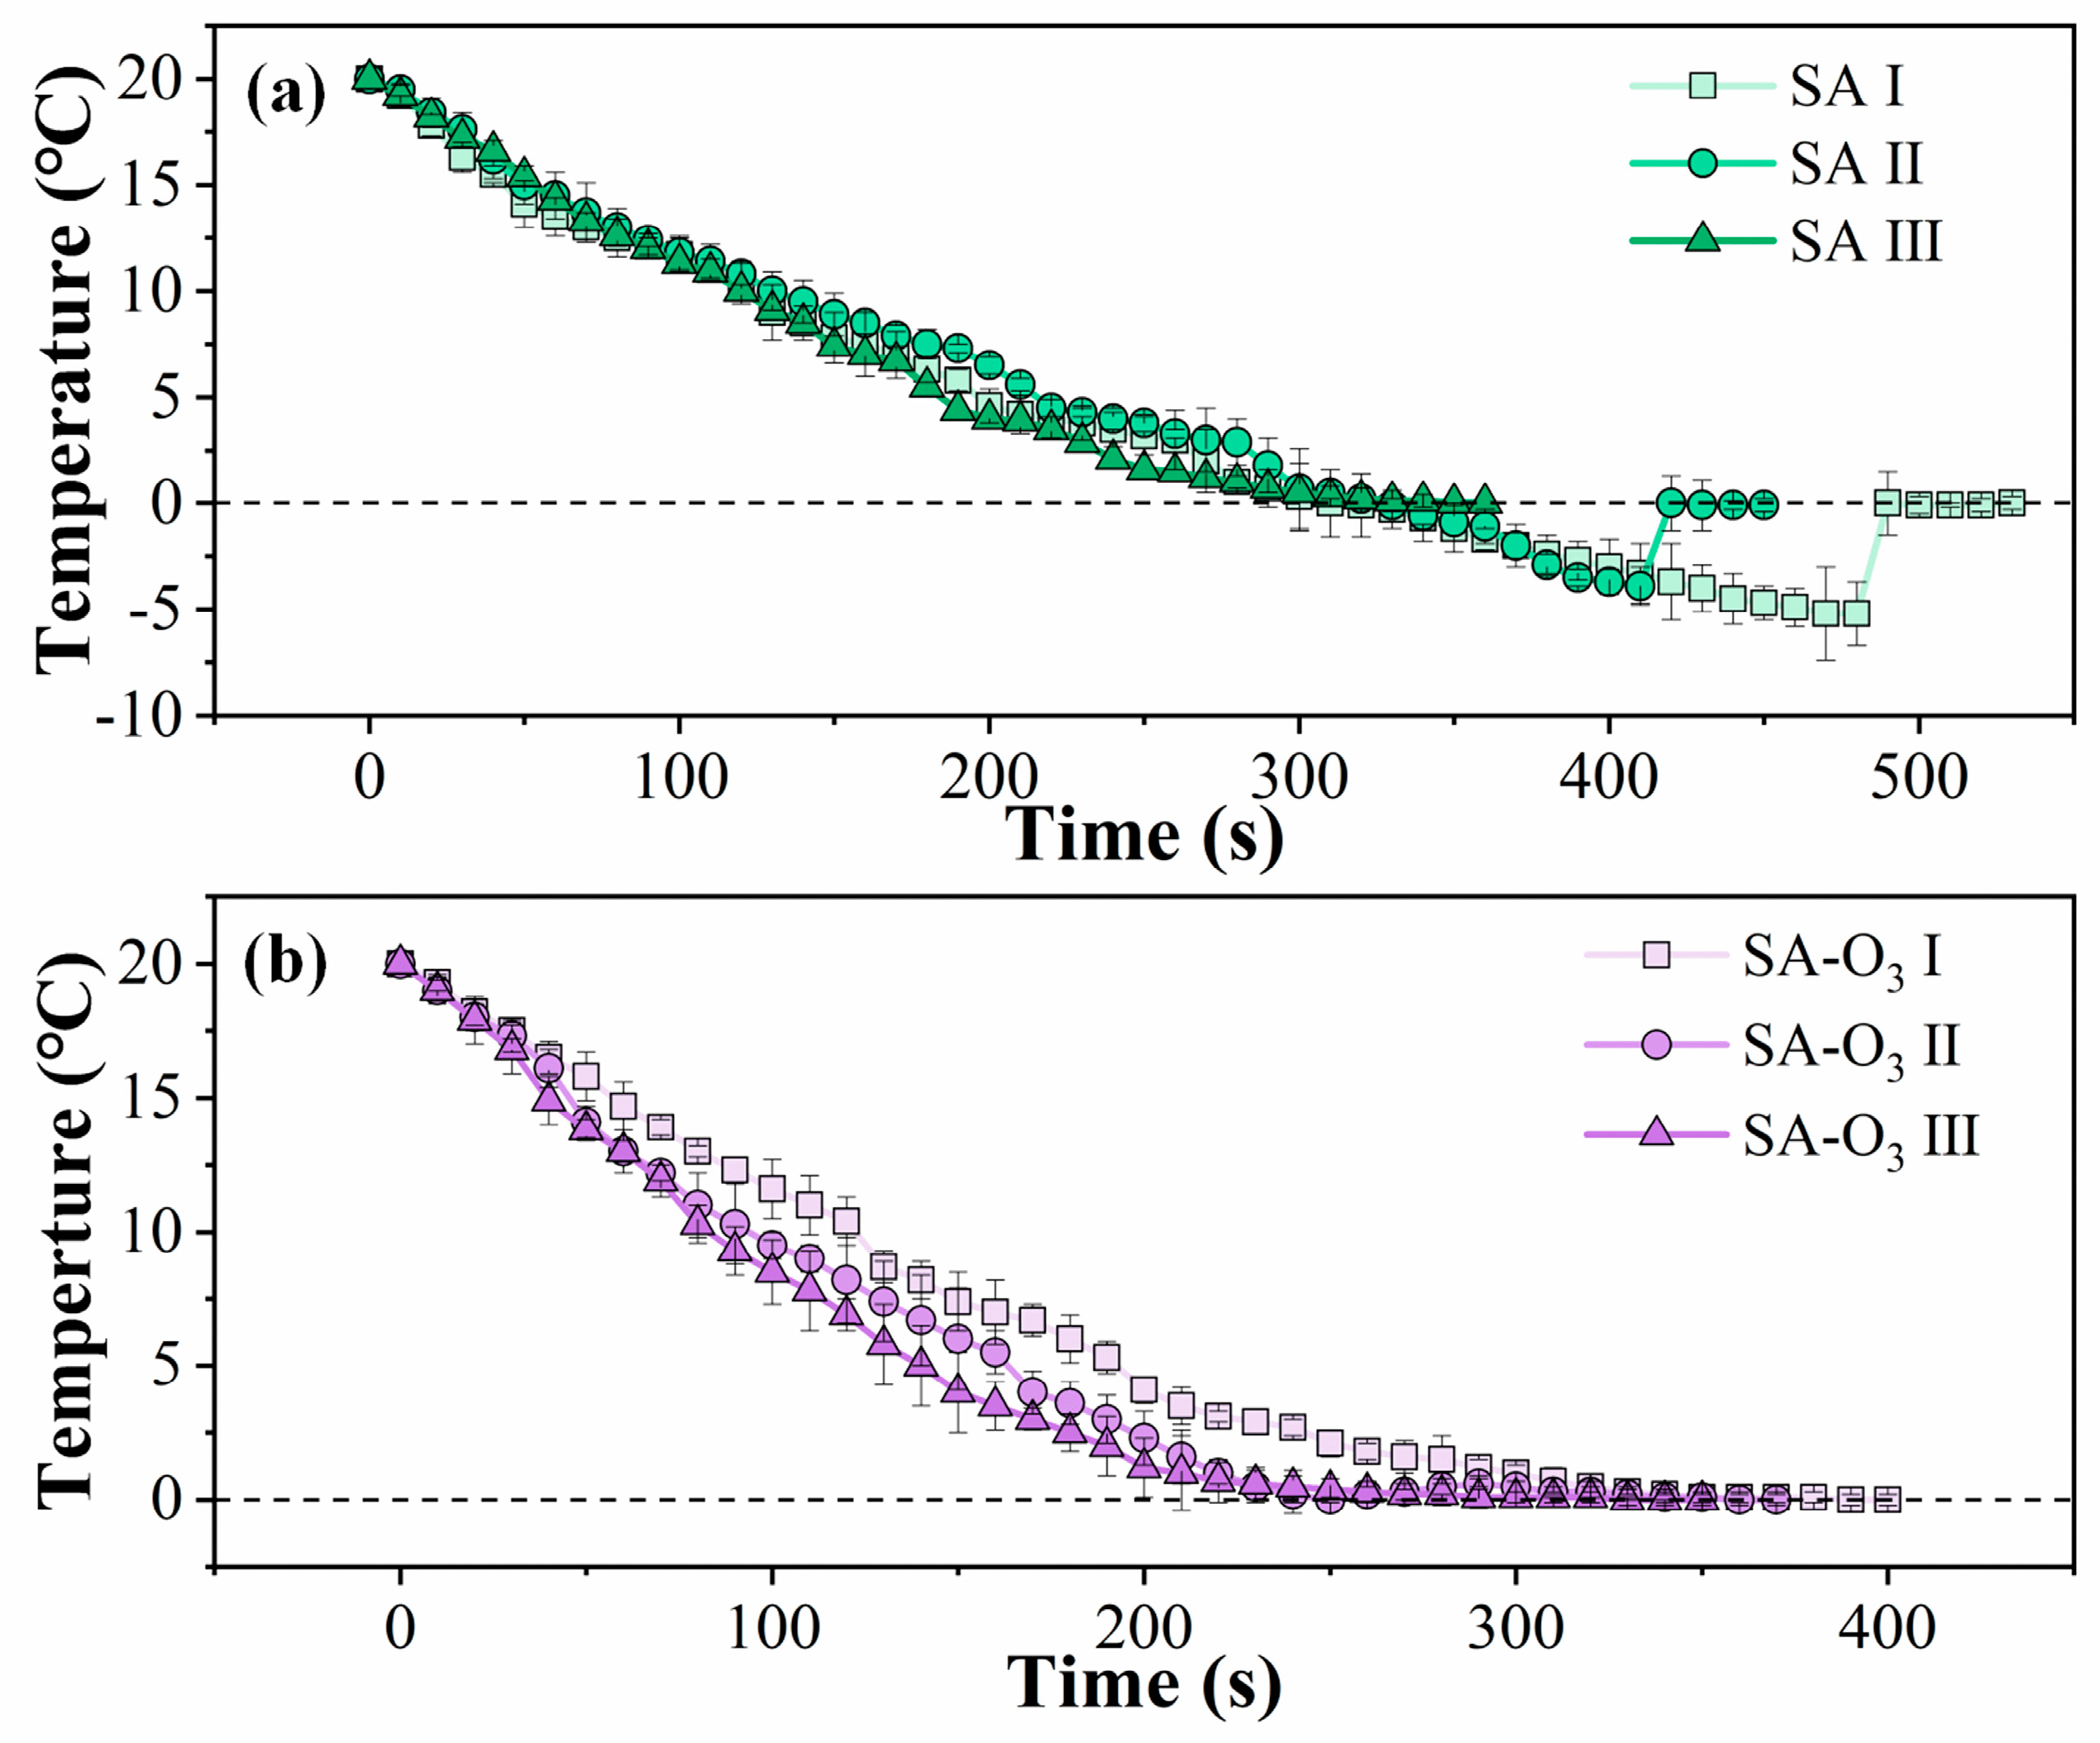
To determine the effects of O3-MNBs on the freezing behavior of SA solution during the production of PIS, the temperature of the prepared solution sample was recorded, and a freezing curve was drawn. A temperature-measuring system (Agilent 34970A, Agilent Technologies, Santa Clara, CA, USA) with a T-type thermocouple installed in the evaporator of the PIS machine was then used to measure and record the temperature of each sample every 10 s. Subsequently, time–temperature profiles were used to determine the nucleation temperature, freezing temperature, and total freezing time. The results indicate that the nucleation temperature occurred below the freezing point. Therefore, the difference between the nucleation temperature and freezing temperature was defined as the supercooling degree. In addition, the time taken for the sample to reach the freezing point from its initial temperature was defined as the total freezing time.

2.4. Preservation of Small Yellow Croaker

To determine whether PIS containing O3-MNBs can be used in the preservation of small yellow croaker, the preservation rate of O3 in the PIS and the freshness indicators of the fish samples were determined.

2.4.1. Preservation Rate of O3 in PIS

The O3 concentrations in the solution samples (SA-O3 Ⅰ, SA-O3 Ⅱ, and SA-O3 Ⅲ) and PIS samples (SA-PIS-O3 Ⅰ, SA-PIS-O3 Ⅱ, and SA-PIS-O3 Ⅲ) were calculated as described in Yates and Stenstrom [24] using the following equation:
O 3 mg / L = A 600 × V T B l a n k A 600 × V T s a m p l e 0.42 × V S × b
where A600 is the sample absorbance at 600 nm, VT is the total volume (mL), VS is the sample volume (mL), and b is the optical path length (cm).
The preservation rate of O3 was calculated as follows:
R = O 3 P O 3 S × 100 %
where R (%) is the preservation rate of O3, (O3)P is the O3 concentration in the PIS sample, and (O3)S is the O3 concentration in the solution sample.

2.4.2. Freshness Indicators of Fish Samples

To determine the efficacy of the novel PIS in the preservation of small yellow croaker, fish samples were stored in various types of ice: (1) FI, (2) PIS, (3) SA-PIS, and (4) SA-PIS-O3. For Group 1, FI was prepared from distilled water with an FI machine (SM-F140AY65, Hitachi, Tokyo, Japan). For Groups 2, 3, and 4, PIS was prepared from distilled water, SA Ⅲ, and SA-O3 Ⅲ, respectively, by using a PIS machine. All fish samples were immersed in ice at a fish-to-ice ratio of 1:1 and then stored for up to 20 days in a refrigerated room at 0 ± 2 °C. Sampling was then performed on days 0, 4, 8, 12, 16, and 20. All experiments were conducted in triplicate.

Measurement of Total Plate Counts

The total viable count (TVC) of the small yellow croaker samples was determined in accordance with Chinese National Standard (GB4789.2-2016) [25]. Briefly, 5 g of treated samples was homogenized with 45 mL of 0.85% sterile NaCl solution, and a series of homogenate dilutions were then performed. After incubation at 30 °C for 72 h, the plate counting method was used to obtain the final TVC, which was expressed in log10 CFU/g.

Measurement of pH

The pH values of the fish samples were identified following the method reported by Wen et al. [26] with modification. A 5 g sample excised from the middle of the dorsal of the fish was thoroughly homogenized with 45 mL of distilled water. The pH of the solution was then analyzed using a pH meter (PHS-3E; INESA Scientific Instrument, Shanghai, China).

Measurement of Total Volatile Basic Nitrogen Content

An automatic Kjeldahl nitrogen analyzer (8400, FOSS, Denmark) was used to determine the total volatile basic nitrogen (TVB-N) content of the small yellow croaker. Briefly, a tissue sample (10 g) was mixed with 0.6 M perchloric acid solution (90 mL) and homogenized for 1 min. The mixture was then centrifuged at 10,000 rpm for 10 min (4 °C) and passed through Whatman No. 1 filter paper [27].

Measurement of Thiobarbituric Acid Content

The thiobarbituric acid content (TBA) of the fish samples was analyzed as described by Bensid et al. [28]. Briefly, a sample weighing 5 g was homogenized with 50 mL of 7.5% trichloroacetic acid. The homogenate was then filtered twice, and 5 mL of the supernatant was collected and mixed with TBA solution (5 mL). The solution was then heated in a water bath at 90 °C for 30 min and cooled under running tap water. Finally, a spectrophotometer (UV-1800, Shimadzu Scientific Instruments, Kyoto, Japan) was used to measure the absorbance of the cooled supernatant at 532 nm.

2.5. Data Analysis

All statistical analyses were performed using one-way analysis of variance in IBM SPSS Statistics version 22.0 (IBM, Armonk, NY, USA). Each experiment was conducted in triplicate. Data are expressed as the mean ± standard deviation. Statistical significance between groups was set at p < 0.05.

3. Results and Discussion

3.1. Bubble Distribution

To determine the effect of solution concentration on the distribution of bubbles, a light microscope was used to investigate each solution sample. Figure 2a–c presents light microscope images of solutions SA Ⅰ, SA Ⅱ, and SA Ⅲ, respectively, whereas Figure 2d–f displays light microscope images of solutions SA-O3 Ⅰ, SA-O3 Ⅱ, and SA-O3 Ⅲ, respectively. When the solution concentration was increased, the bubble count also increased. During solution preparation, constant stirring generated bubbles in the SA samples. However, because the low-concentration SA Ⅰ sample had the weakest mutual entanglement of macromolecular chains of all the samples, it had the fewest bubbles. By contrast, compared with the other SA samples, the high-viscosity SA Ⅲ sample had the most air bubbles. In this study, the bubble count in the SA-O3 samples was 3.3, 3.25, and 1.48 times higher, respectively, than those in the corresponding SA samples. In addition, same as for the SA samples, the SA-O3 samples had higher bubble density when the solution concentration was higher, with the bubble count increasing from 10 to 13 and 55. This bubble count result is consistent with our previous work [15] showing that solutions with higher viscosity could incorporate more air microbubbles, which are generated though agitation. Because the mutual entanglement of the macromolecular chains was strong, the SA samples with higher concentrations had higher viscosity, leading to more bubbles becoming trapped [29].
Representing the distribution of bubble size as a cumulative frequency curve is an intuitive method for visualizing the results. As shown in Figure 2, the size of 90% of the bubbles ranged from 79.2 to 745.4 μm2 in the SA samples and from 510.5 to 1934.1 μm2 in the SA-O3 samples. Comparable observations were also made in our previous work [15] that a number of approximately micron-sized air bubbles existed and were effective in accelerating slurry ice production. However, the size of the infused bubbles varies considerably from document to document. Adhikari et al. [13] reported that the CO2 nanobubbles of around 100 nm diameter in range were effective in promoting the freezing properties of soft serve, milk, and apple juice. Additionally, Xu et al. [30] reported that a great many micron-sized bubbles can be obviously observed in gelatin gel samples, which can shorten the nucleation delay, but some bubbles were above centimeter level. In this study, although the bubbles in the SA samples were larger when the solution concentration was larger, this trend was not observed in the SA-O3 samples. As illustrated in Figure 2d,f, the SA-O3 Ⅰ sample had larger bubbles than those in the SA-O3 Ⅲ sample. In the SA samples, the air bubbles were generated though agitation and trapped in the solutions. For the SA-O3 samples, O3 was injected into the SA solutions; with this injection, the pre-existing air bubbles and the O3-MNBs would coalescence or breakup during the bubble rising period and result in changes in bubble size distribution [31]. This outcome is consistent with the finding of Tian et al. [14], who reported that severe coalescence of nanobubbles might occur in lower-concentration hydrolyzed gelatin due to low viscosity. However, the number of bubbles in the SA-O3 Ⅲ sample was considerably higher than that in the SA-O3 Ⅰ sample. In this study, O3 is infusible and is highly likely to be present in the form of O3-MNBs in SA samples. These O3-MNBs can serve as ice nuclei in the subsequent production of PIS. Additionally, the effect of O3-MNBs on SA solution during PIS production is discussed in the following sections.

3.2. Freezing Characteristics of SA and SA-O3 Solutions

Figure 3 depicts the freezing curves obtained when the SA and SA-O3 samples were used to produce PIS. Supercooling behavior was clearly observed for the SA Ⅰ and SA Ⅱ samples. The temperature fell below the freezing point without nucleation, and the freezing curves then sharply rose after the initiation of nucleation. After the latent heat in the samples had been released, ice crystals gradually grew in the solutions. Subsequently, PIS containing multitudes of ice crystals was continually generated along with liquid solution in the PIS machine. The SA Ⅰ sample resulted in the longest freezing process, along with a high supercooling degree. In addition, the nucleation temperature for the SA Ⅱ sample was higher than that for the SA Ⅰ sample. Of the SA samples, the SA Ⅲ sample nucleated at the highest temperature (at approximately 0 °C), which was due to the presence of numerous air bubbles. As shown in Figure 3b, a similar freezing trend to that for SA Ⅲ was discovered for all SA-O3 samples. However, no supercooling behavior was observed, and the freezing period gradually decreased as the solution concentration was increased. These results are expected because the O3-MNBs that formed as a result of O3 infusion served as ice nuclei, thereby overcoming the nucleation barrier. Generally, in a liquid system, each bubble is regarded as a potential ice nucleation site and leads to the formation of additional smaller crystals [31]. In this study, the SA-O3 Ⅲ sample had a sufficient number of ice nucleation sites, enabling the rapid formation of PIS.
Table 1 lists the nucleation temperature, supercooling degree, and total freezing time of the PIS produced using the SA samples with and without O3-MNBs. The nucleation temperature of the SA Ⅰ sample was −5.2 ± 1.4 °C; the nucleation temperatures of the SA Ⅱ sample, SA Ⅲ sample, and all SA-O3 samples were significantly higher than this value (p < 0.05). Considerable deviation was discovered in the nucleation that occurred, indicating the spontaneous and random nature of the nucleation. The supercooling degrees of the SA Ⅱ sample was 25% lower than those of the SA Ⅰ sample. Additionally, for the SA Ⅲ samples and all the SA-O3 solutions, supercooling was eliminated. In addition, the total freezing time was considerably shorter for the SA-O3 samples than for the SA samples with corresponding concentrations. The freezing rate increased with the solution concentration of the SA and SA-O3 samples, which is in accordance with the bubble size distribution results. Specifically, the total freezing times of the SA Ⅱ and SA Ⅲ were 14.07% and 27.47%, respectively, shorter than that of the SA Ⅰ sample, and the total freezing times of the SA-O3 Ⅱ and SA-O3 Ⅲ were 8.42% and 20.17%, respectively, shorter than that of the SA-O3 Ⅰ sample. Because the SA-O3 samples contained more bubbles than the SA samples, these samples nucleated at 0 °C, with a shorter freezing period. These results confirm that supercooling occurred during the freezing of the SA solutions in the PIS machine. They also indicate that the introduction of O3-MNBs considerably increased the freezing rate. Thus, the introduction of nucleation seeds reduced the nucleation barrier of the solution system, and any small reduction in the nucleation barrier can result in considerable differences in the nucleation rate and the total freezing time [32]. Although the SA-O3 Ⅰ and SA-O3 Ⅱ samples had similar bubble count, the freezing time of SA-O3 Ⅱ was shorter than that of SA-O3 Ⅰ. This conflict might be due to the fact that the O3-MNBs in SA-O3 Ⅰ were larger than those in SA-O3 Ⅱ, which suggested that the contact angle of the nucleus in the SA-O3 Ⅰ sample was closer to 180°, which resulted in a higher activation barrier [33]. The results are similar to those obtained for air bubbles in liquid samples [15,34], bubbles infused in gel food systems [30], and cavitation bubbles generated during ultrasound-assisted freezing processes [14,35].
Overall, the high degree of supercooling can serve as a driving force for nucleation, and the region around the bubbles is where crystallization occurs first [36,37]. This means that O3-MNBs can be added to liquids to accelerate the production of PIS and trigger nucleation. In the following sections, the effect of O3-MNBs on the preservation of fish is discussed.

3.3. Preservation of Small Yellow Croaker

3.3.1. Rate of O3 Preservation

Figure 4 depicts the results for the O3 preservation rate in the PIS samples. When the SA concentration was increased, the O3 concentration in the solution samples (SA-O3 Ⅰ, SA-O3 Ⅱ, and SA-O3 Ⅲ) and SA-PIS-O3 samples (SA-PIS-O3 Ⅰ, SA-PIS-O3 Ⅱ, and SA-PIS-O3 Ⅲ) gradually increased, consistent with the bubble distribution results. Specifically, the concentration of O3 in the SA-O3 Ⅰ, SA-O3 Ⅱ, and SA-O3 Ⅲ were determined to be 3.98 ± 0.12 mg/L, 4.58 ± 0.46 mg/L, and 6.41 ± 0.97 mg/L, respectively, whereas in the SA-PIS-O3 samples, lower values of 0.99 ± 0.19 mg/L, 1.26 ± 0.27 mg/L, and 2.63 ± 0.13 mg/L, respectively, were obtained. This result was observed because the specific surface area of the PIS was large; the O3-MNBs trapped in SA-O3 samples were released easily during the production of PIS. This phenomenon has also been clarified by Matsumoto et al. [38], where the concentrations of ozone microbubbles in the ice with larger dimensions were kept higher. Compared with whole ice (80 × 80 mm2) and cut ice (20 × 20 mm2), ozone microbubble concentration for the crushed ice (4 × 4 mm2) was minimal. In this study, when the SA solution concentration was increased, the O3 preservation rate also increased. This is because trapping O3-MNBs in PIS was much easier when the substrate solution was more viscous due to more entanglements between the polymer chains [29].
Although all batches had a low O3 preservation rate (ranging from 24.9% to 41.9%) in this study, the results obtained in this study are sufficient within the context of pasteurization [39]. Matsumoto et al. [38] confirmed that a pseudoice slurry (formed by mixing crushed ice containing microbubbles with pure water) was effective for the cold storage, sterilization, and deodorization of food. PIS can be used to effectively and rapidly chill fish products thanks to its high fluidity and large specific surface area. In the following sections, specific freshness indicators are discussed for small yellow croakers stored in the novel PIS which contained O3-MNBs.

3.3.2. Freshness Indicators

Microbiological Analysis

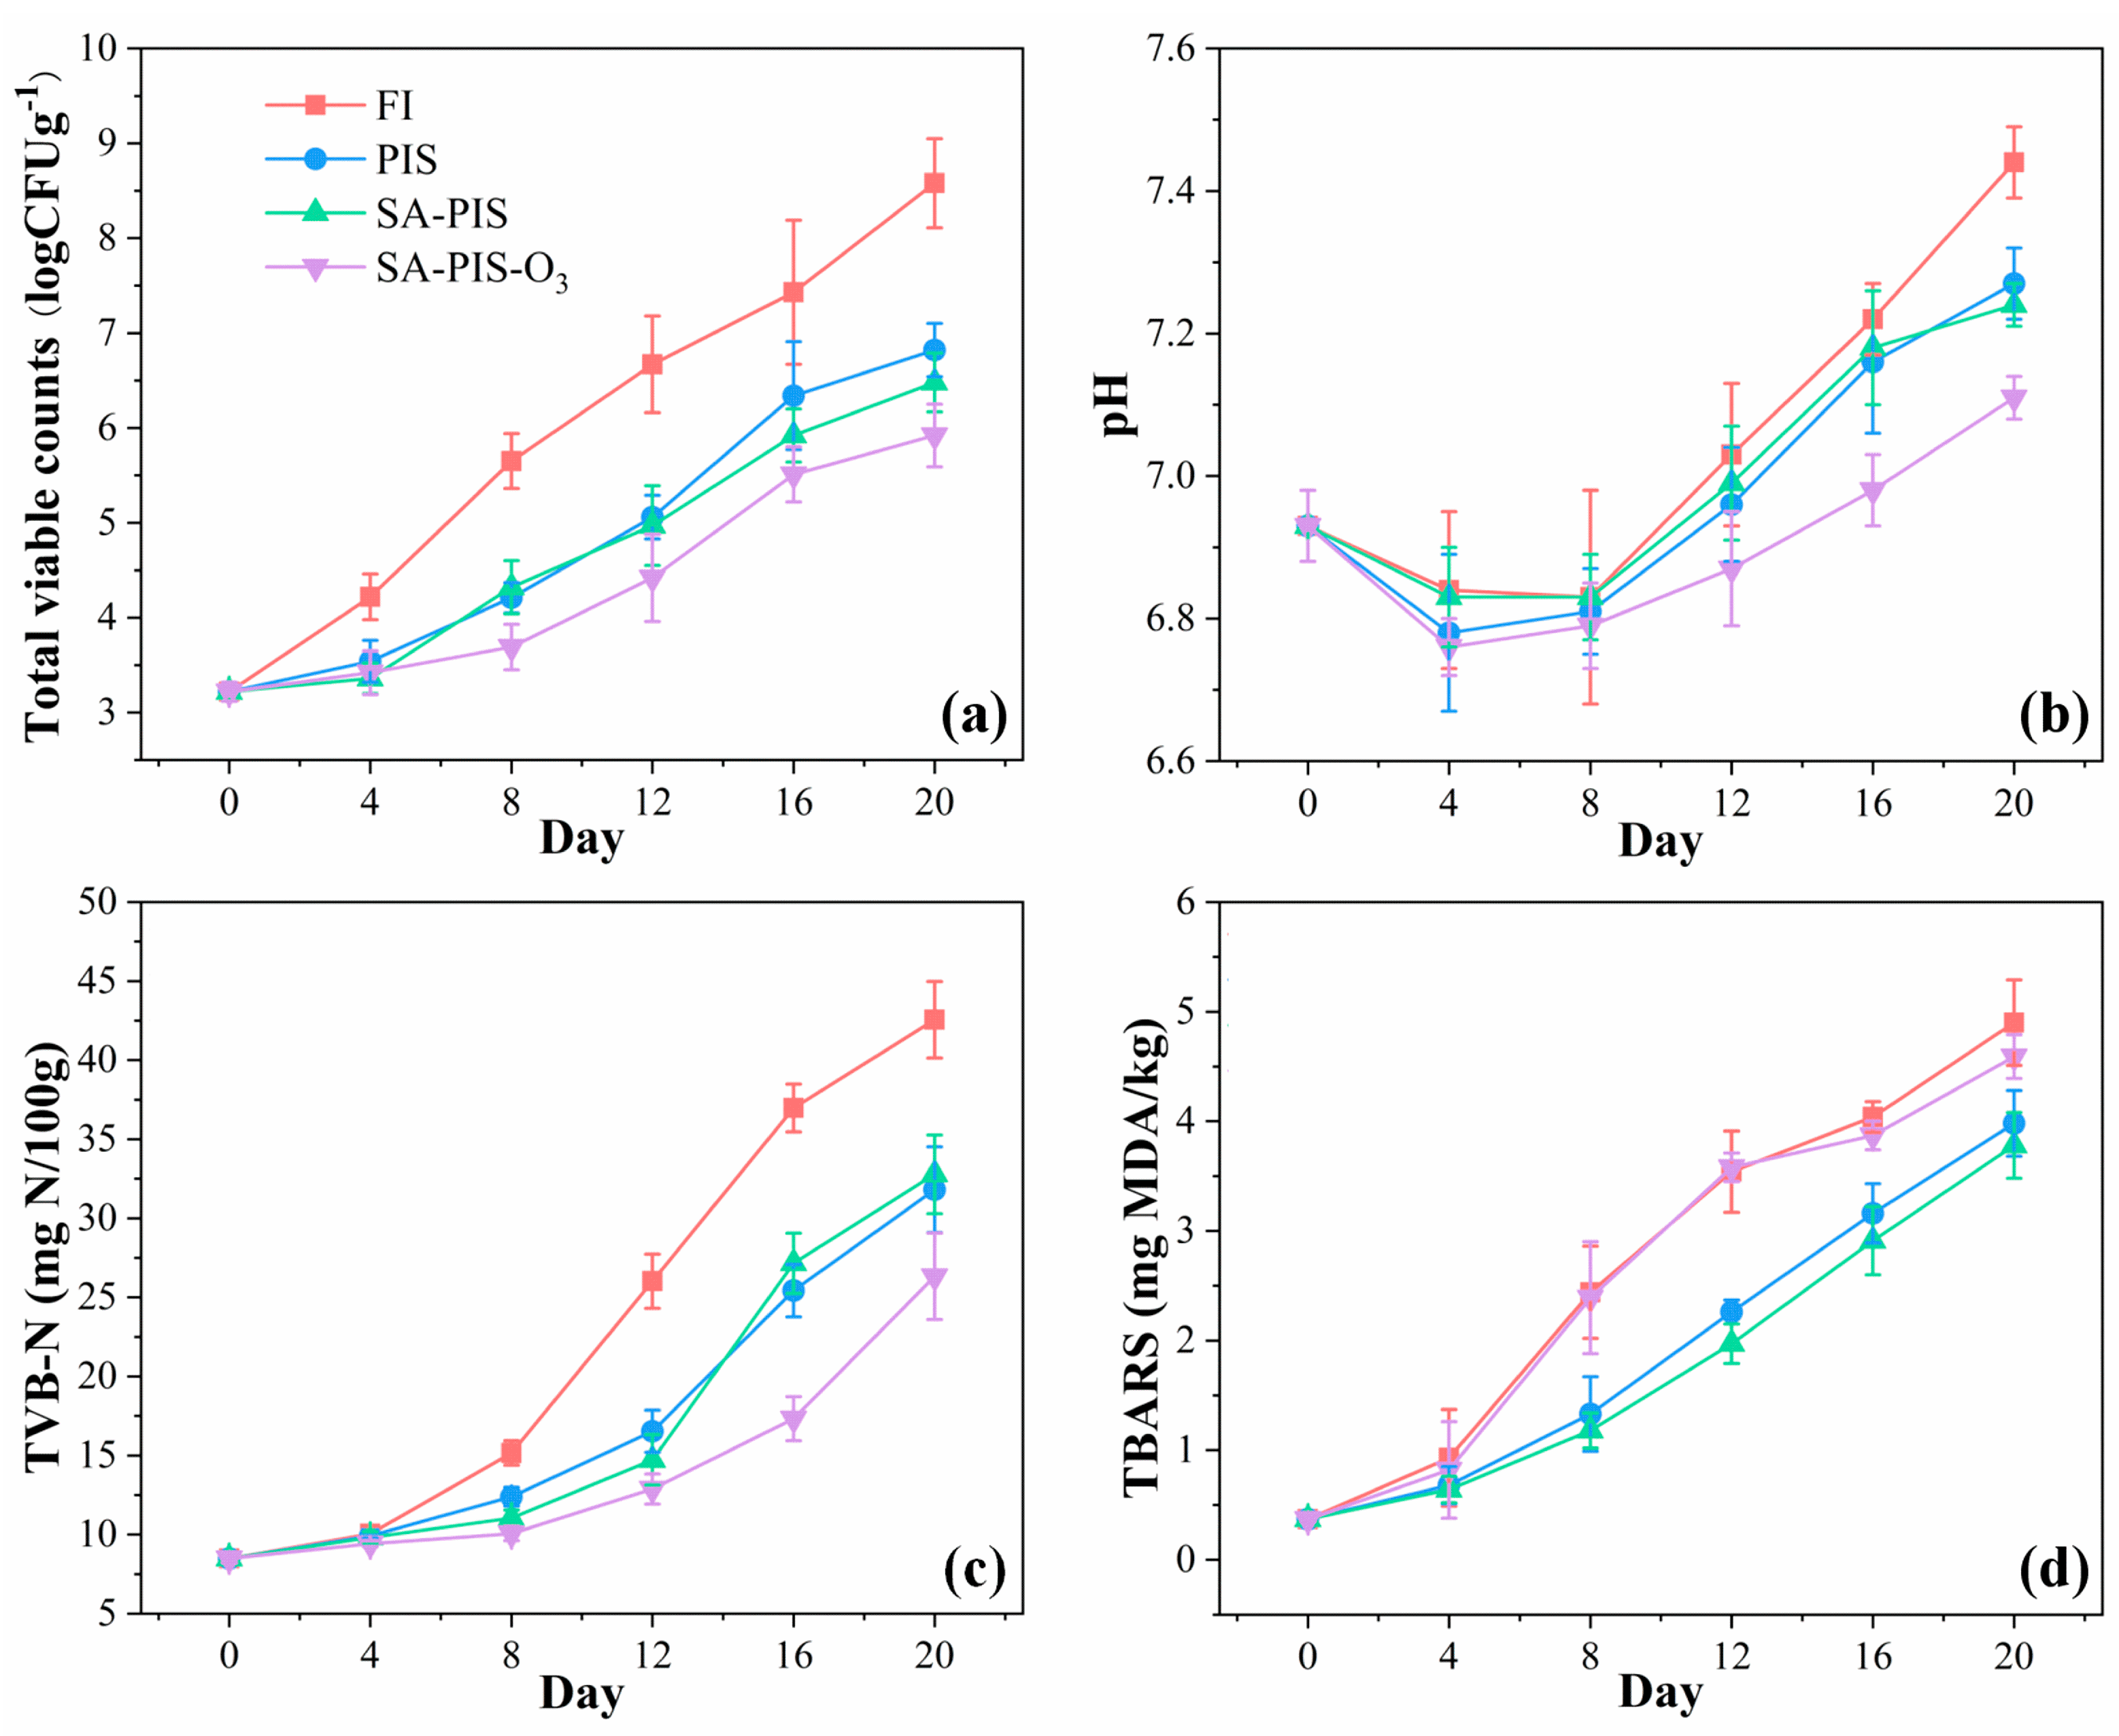
Approximately 30% of fish caught lose their value as an edible product as a result of microorganism activity [40]. In this study, changes in the TVC of small yellow croaker were monitored during its storage in FI, PIS, SA-PIS, and SA-PIS-O3, as shown in Figure 5a. The initial TVC of the fresh small yellow croaker was 3.22 ± 0.13 log CFU/g. Preservation in FI resulted in substantially larger microbial populations and a higher TVC (6.67 ± 0.51 log CFU/g) after 12 days of storage than did storage in the other types of ice. For these other three batches, microbial growth was considerably lower, with the TVC reaching only up to 5.06 ± 0.23 log CFU/g, 4.97 ± 0.42 log CFU/g, and 4.42 ± 0.46 log CFU/g, respectively, after 12 days. According to the International Commission on Microbiological Specifications for Foods (ICMSF) [41], the maximum TVC permitted for freshwater and marine products is 7.0 log CFU/g, which indicates that the products are suitable for consumption. However, in this study, the FI batch had a TVC larger than this threshold; it reached 8.58 ± 0.47 log CFU/g at the end of the storage period. Compared with FI, which could only cool the aquatic products to around 0 °C, PIS is a ideal cooling medium which could cool the aquatic products at −0.5 to −1.5 °C [19]. Moreover, PIS can cover the surface of the fish samples fully due to its good fluidity. Thus, PIS has been verified to be effective in suppressing bacterial growth and other chemical reactions. Similarly, in this study, after 20 days of storage, the TVC values obtained for the PIS, SA-PIS, and SA-PIS-O3 batches were below the suggested threshold. However, the TVCs of the samples placed in PIS did not significantly differ (p > 0.05) from those of the samples that were placed in SA-PIS, while for the SA-PIS-O3 batch, the TVC of small yellow croaker only underwent a slight increase; the TVC at the end of storage was 5.92 ± 0.33 log CFU/g. Similar results were reported by Zhao et al. [21], who placed large yellow croaker (Pseudosciaena crocea) in ozonated ice slurry (which comprised a mixture of O3 water and NaCl). Compared with the FI and slurry ice batches, the large yellow croakers placed in the ozonated ice slurry had a clearly lower TVC. This was because O3 is a powerful sanitizer with a strong oxidation effect [42]. In this study, the SA-PIS-O3 used was a triphase mixture of ice microcrystals, SA solution, and O3, and the O3-MNBs effectively remained or dissolved in the high-viscosity SA solution. This means that the novel PIS considerably inhibited the growth of microorganisms.

pH

Figure 5b depicts the changes in the pH values of the four batches placed in FI, PIS, SA-PIS, and SA-PIS-O3. When the fish samples arrived at our laboratory (day 0), no considerable pH differences were discovered between the four batches, and the initial pH was 6.93 ± 0.05. However, after 4 days of storage, the pH had decreased to 6.84 ± 0.11, 6.78 ± 0.11, 6.83 ± 0.07, and 6.76 ± 0.04. The pH then slightly increased, but no considerable differences were found between the four batches until day 12. In all cases, the pH of the fish samples remained below 7. The initial decrease is due to the production of lactic acid from the hydrolysis of the glycogen after death [39]. Thereafter, the pH gradually increased to 7 and above, and the FI batches had considerably higher pH values than did the other batches. At the end of the storage period for the fish samples stored in FI, the pH reached 7.44 ± 0.05, whereas it ranged from 7.11 to 7.27 in the other batches. This was most likely due to the undesirable nitrogen-containing compounds produced by the bacterial action [43]. Of all the batches, the SA-PIS-O3 batches had the lowest pH, indicating that this novel strategy effectively slowed the protein degradation process and delayed the deterioration of fish samples’ quality. Similar results were obtained in Campos et al. [44], which reported that the pH values of the sardine (Sardina pilchardus) stored in ozonated slurry ice was significantly lower than that of sardine stored in FI or slurry ice. Therefore, according to the present results, the introduction in O3-MNBs may inhibit the alkalization of microflora during the preservation of fish.

TVB-N

TVB-N content is regarded as a useful indicator of the quality of marine fish products during their storage [45]. Figure 5c depicts the changes in the TVB-N content. In the FI batch, the TVB-N content rapidly increased from an initial value of 8.48 ± 0.29 mg/100 g and exceeded the upper limit (30 mg/100 g, concentrations above which are considered unsuitable for consumption) after 12 days of storage. However, the rate of increase in TVB-N content in the PIS, SA-PIS, and SA-PIS-O3 batches was slower than that of FI batch. These results are in line with the results reported by Yuan et al. [27], indicating that a large number of amino acids (e.g., methionine and tyrosine) were destroyed when the fish samples were stored in FI compared with when they were stored in slurry ice. According to the SC/T 3101-2010 standard, fresh small yellow croaker with a TVB-N content of less than 13 mg/100 g is considered to be of superior grade, whereas 13~30 mg/100 g is regarded as edible but slightly decomposed. In this study, only the SA-PIS-O3 batch remained at a fresh level after being stored for 12 days. At the end of the storage period, the TVB-N content of the FI batch was 42.55 ± 2.42 mg/100 g, whereas the PIS, SA-PIS, and SA-PIS-O3 batches exhibited considerably lower TVB-N contents of 31.8 ± 2.71 mg/100 g, 32.78 ± 2.49 mg/100 g, and 26.32 ± 2.73 mg/100 g, respectively. However, no significant differences in TVB-N content were discovered between the PIS and SA-PIS batches. Notably, although the TVB-N content of the PIS and SA-PIS batches slightly exceeded 30 mg/100 g; the TVB-N content of the SA-PIS-O3 batches remained below the threshold. These results indicate that the injection of O3-MNBs may effectively impede the formation of TVB-N. Overall, these results agree with those obtained for bighead croaker [19] and sardine [44]. In these cases, the TVB-N content in the FI group rapidly increased during the storage period, and the fish samples stored in ozonated slurry ice had the lowest lipid hydrolysis rate.

TBA Reactive Substances

Figure 5d depicts the changes in the TBA reactive substances (TBARS) content of the small yellow croaker during its storage. The initial TBARS content of the fresh fish samples was 0.37 ± 0.02 mg MDA/kg, and this content increased during the storage period for all batches. Compared with the PIS and SA-PIS batches, the FI batch had significantly higher TBARS content from day 4, which was in line with the trends in the other freshness indicators investigated in this study (TVC, pH, and TVB-N). Specifically, in the FI batch, the TBARS content had considerably increased to 4.9 ± 0.39 mg MDA/kg by the end of the storage period, whereas in the PIS and SA-PIS batches, the TBARS content was 3.98 ± 0.3, and 3.78 ± 0.3 mg MDA/kg, respectively. According to Binsi et al. [46], a concentration of 2 mg/100 g is typically regarded as the upper permissible limit of TBARS content in fresh fish muscle. In this study, the TBARS content in the FI batch exceeded the limit on day 8, whereas the PIS and SA-PIS batches remained fresh states with TBARS content of 1.33 ± 0.34 and 1.18 ± 0.16 mg MDA/kg, respectively. These results indicate that PIS can slow the secondary oxidation process. However, the trend observed in the SA-PIS-O3 batch was similar to that in the FI batch, which exhibited higher TBARS content than did the PIS and SA-PIS batches from day 4. Similar trends were also observed by Zhao et al. [21], who reported that the TBARS content of fish samples stored in ozone slurry ice was relatively high. The lipid oxidation in the SA-PIS-O3 batch might be accelerated by the oxidizing action of ozone. The injection of O3-MNBs was effective in terms of pasteurization but would also oxidize and destroy the fat of the fish samples.
Table 2 lists a comparison between previously reported works and this work. Storage of the aquatic products in PIS combined with O3 improves microbiological and biochemical quality as compared with storage in FI. However, the TVB-N trends in our work are not consistent with the results of Zhao et al. [21] and Liu et al. [47], who reported that the TVB-N content had a downward trend during the storage period. The decrease in TVB-N in these results may be due to the volatilization of TVB-N in fish into the melting ice water. In addition, the combination of O3 led to a negative effect that accelerated fat oxidation in the fish samples. However, it was found that the TBARS values of all batches in our work were less than 8.0 mg MDA/kg at the end of the storage, which was considered the acceptable limit for aquatic products [21].

4. Conclusions

In this study, the effect of O3-MNBs on the production of PIS was investigated. Additionally, a series of microbial and biochemical parameters were also employed to determine whether O3-MNBs combined with PIS are effective for the preservation of small yellow croaker. The results indicate that the injection of O3-MNBs eliminated the supercooling effect observed during the production of PIS and shortened its total freezing time over 7.7%. Because each bubble is generally regarded as a potential nucleation site during the production of PIS, the SA solutions with more O3-MNBs had a higher nucleation rate, thereby resulting in a shorter freezing time. The relationship between bubble distribution and freezing characteristics was also discussed. In addition, our results indicate that the injection of O3-MNBs has positive effects on fish preservation, such as maintaining bacterial count and pH and TVB-N. However, it is worth noting that the injection of O3-MNBs would increase the fat oxidation of the fish samples (TBARS content up to 4.59 mg MDA/kg at the end of storage). Therefore, more types of PIS combined with antimicrobial compounds should be developed in the future.

Author Contributions

R.Z.: methodology, validation, investigation, and data curation. Z.C.: methodology, validation, and data curation. Y.L. (Yuting Liang): methodology and investigation. X.H.: methodology and investigation. T.S.: methodology and investigation. Y.L. (Yanxiao Li): methodology and investigation. Z.H.: methodology, supervision, and funding acquisition. X.Z. (Xinai Zhang): supervision. X.Z. (Xiaobo Zou): supervision, project administration, and funding acquisition. All authors have read and agreed to the published version of the manuscript.

Funding

This study was supported by the Priority Academic Program Development of Jiangsu Higher Education Institutions [grant numbers PAPD]; the Foundation of Jiangsu University [grant numbers 21JDG048]; the National Administrative Committee Program on Teaching Research and Practice of Power and Energy Engineering Majors in Higher Education [grant numbers NDJZW2021Z-45]; the Research Project of Jiangsu University on Teaching Reform of Higher Education [grant numbers 2021JGZZ011].

Data Availability Statement

Data is contained within the article.

Conflicts of Interest

The authors declare no conflict of interest.

References

  1. Esua, O.J.; Sun, D.-W.; Cheng, J.-H.; Wang, H.; Chen, C. Hybridising plasma functionalized water and ultrasound pretreatment for enzymatic protein hydrolysis of Larimichthys polyactis: Parametric screening and optimization. Food Chem. 2022, 385, 132677. [Google Scholar]
  2. Choi, M.-J.; Kim, D.-H. Assessment and management of small yellow croaker (Larimichthys polyactis) stocks in South Korea. Sustainability 2020, 12, 8257. [Google Scholar] [CrossRef]
  3. Karim, N.U.; Nasir, N.; Arifin, B.; Ismail, M. Effect of salt and ozonized-slurry ice on the quality indices of tiger grouper (Epinephelus fuscoguttatus). J. Sustain. Sci. Manag. 2015, 10, 97–102. [Google Scholar]
  4. Aubourg, S.P.; Losada, V.; Gallardo, J.M.; José, M.; Miranda, J.M.; Velázquez, J.B. On-board quality preservation of megrim (Lepidorhombus whiffiagonis) by a novel ozonised-slurry ice system. Eur. Food Res. Technol. 2006, 223, 232–237. [Google Scholar] [CrossRef]
  5. Lin, H.M.; Deng, S.G.; Huang, S.B.; Guo, H. Effects of precooling with slurry ice on the quality and microstructure of anglerfish (Lophius americanus) liver. J. Food Process Eng. 2016, 39, 3–10. [Google Scholar] [CrossRef]
  6. FAO. Fisheries and Aquaculture. In Global Production by Production Source Quantity (1950–2020); FAO, Food and Agriculture Organization, Fisheries and Aquaculture Department: Roma, Italy, 2022. [Google Scholar]
  7. Hozumi, T.; Saito, A.; Okawa, S.; Matsumura, T. Effect of bubble nuclei on freezing of supercooled water. Int. J. Refrig. 2002, 25, 243–249. [Google Scholar] [CrossRef]
  8. Zhang, X.; Inada, T.; Tezuka, A. Ultrasonic-induced nucleation of ice in water containing air bubbles. Ultrason. Sonochem. 2003, 10, 71–76. [Google Scholar] [CrossRef]
  9. Kiani, H.; Zhang, Z.; Delgado, A.; Sun, D.-W. Ultrasound assisted nucleation of some liquid and solid model foods during freezing. Food Res. Int. 2011, 44, 2915–2921. [Google Scholar] [CrossRef]
  10. Fu, X.; Belwal, T.; Cravotto, G.; Luo, Z. Sono-physical and sono-chemical effects of ultrasound: Primary applications in extraction and freezing operations and influence on food components. Ultrason. Sonochem. 2020, 60, 104726. [Google Scholar] [CrossRef]
  11. Cheng, L.; Sun, D.-W.; Zhu, Z.; Zhang, Z. Emerging techniques for assisting and accelerating food freezing processes: A review of recent research progresses. Crit. Rev. Food Sci. Nutr. 2017, 57, 769–781. [Google Scholar]
  12. Zhu, Z.; Sun, D.-W.; Zhang, Z.; Li, Y.; Cheng, L. Effects of micro-nano bubbles on the nucleation and crystal growth of sucrose and maltodextrin solutions during ultrasound-assisted freezing process. LWT-Food Sci. Technol. 2018, 92, 404–411. [Google Scholar] [CrossRef]
  13. Adhikari, B.M.; Tung, V.P.; Truong, T.; Bansal, N.; Bhandari, B. Impact of in-situ CO2 nano-bubbles generation on freezing parameters of selected liquid foods. Food Biophys. 2020, 15, 97–112. [Google Scholar] [CrossRef]
  14. Tian, Y.; Zhang, Z.; Zhu, Z.; Sun, D.-W. Effects of nano-bubbles and constant/variable-frequency ultrasound-assisted freezing on freezing behaviour of viscous food model systems. J. Food Eng. 2021, 292, 110284. [Google Scholar] [CrossRef]
  15. Zhang, R.; Cheng, Z.; Ding, F.; Hua, L.; Fang, Y.; Han, Z.; Shi, J.; Zou, X.; Xiao, J. Improvements in chitosan-based slurry ice production and its application in precooling and storage of Pampus argenteus. Food Chem. 2022, 393, 133266. [Google Scholar] [CrossRef] [PubMed]
  16. Okpala, C.O.R. Investigation of quality attributes of ice-stored Pacific white shrimp (Litopenaeus vannamei) as affected by sequential minimal ozone treatment. LWT-Food Sci. Technol. 2014, 57, 538–547. [Google Scholar] [CrossRef]
  17. Pandiselvam, R.; Sunoj, S.; Manikantan, M.R.; Kothakota, A.; Hebbar, K.B. Application and kinetics of ozone in food preservation. Ozone-Sci. Eng. 2017, 39, 115–126. [Google Scholar] [CrossRef]
  18. Campos, C.A.; Rodríguez, Ó.; Losada, V.; Aubourg, S.P.; Barros-Velásquez, J. Evaluation of an ozone-slurry ice combined refrigeration system for the storage of farmed turbot (Psetta maxima). Food Chem. 2006, 97, 223–230. [Google Scholar] [CrossRef]
  19. Chen, J.; Huang, J.; Deng, S.; Huang, Y. Combining ozone and slurry ice to maximize shelf-life and quality of bighead croaker (Collichthys niveatus). J. Food Sci. Technol. 2016, 53, 3651–3660. [Google Scholar] [CrossRef]
  20. Bono, G.; Vitale, S.; Okpala, C.O.; Ferrantelli, V.; Noto, A.D.; Costa, A.; Di, B.C.; Monaco, D.L. Effects of different ozonized slurry-ice treatments and superchilling storage (−1 °C) on microbial spoilage of two important pelagic fish species. Food Sci. Nutr. 2017, 5, 1049–1056. [Google Scholar] [CrossRef] [PubMed]
  21. Zhao, Y.; Lan, W.; Shen, J.; Xu, Z.; Xie, J. Combining ozone and slurry ice treatment to prolong the shelf-life and quality of large yellow croaker (Pseudosciaena crocea). LWT-Food Sci. Technol. 2022, 154, 112615. [Google Scholar] [CrossRef]
  22. Pati1, S.; Sarkar, T.; Sheikh, H.I.; Bharadwaj, K.K.; Mohapatra, P.K.; Chatterji, A.; Dash, B.P.; Edinur, H.A.; Nelson, B.R. γ-irradiated chitosan from carcinoscorpius rotundicauda (latreille, 1802) improves the shelf life of refrigerated aquatic products. Front. Mar. Sci. 2021, 8, 664961. [Google Scholar] [CrossRef]
  23. Watson, R.A.; Nowara, G.B.; Hartmann, K.; Green, B.S.; Tracey, S.R.; Carter, C.G. Marine foods sourced from farther as their use of global ocean primary production increases. Nat. Commun. 2015, 6, 7365. [Google Scholar] [CrossRef] [PubMed]
  24. Yates, R.S.; Stenstrom, M.K. Gravimetric sampling procedure for aqueous ozone concentrations. Water Res. 2000, 34, 1413–1416. [Google Scholar] [CrossRef]
  25. Quan, T.H.; Benjakul, S.; Hozzein, W.N. Quality and storage stability of fish tofu as affected by duck albumen hydrolysate-epigalocatechin gallate conjugate. LWT-Food Sci. Technol. 2020, 120, 108927. [Google Scholar] [CrossRef]
  26. Wen, H.; Ou, C.; Tang, H.; Sang, S.; Du, Y.; Chen, J. Development, Characterization and Application of a three-layer intelligent ph-sensing indicator based on Bromocresol Green (BCG) for monitoring fish freshness. J. Ocean. Univ. China 2023, 22, 565–575. [Google Scholar] [CrossRef]
  27. Yuan, P.; Deng, S.; Hatab, S.; Ning, Y.; Huo, J. Comparative evaluation of the quality changes in squid (Ommastrephes bartrami) during flake and slurry ice storage. Emir. J. Food Agric. 2017, 29, 339–345. [Google Scholar] [CrossRef]
  28. Bensid, A.; Ucar, Y.; Bendeddouche, B.; Oezogul, F. Effect of the icing with thyme, oregano and clove extracts on quality parameters of gutted and beheaded anchovy (Engraulis encrasicholus) during chilled storage. Food Chem. 2014, 145, 681–686. [Google Scholar] [CrossRef] [PubMed]
  29. Tavares, L.; Flores, E.E.; Rodrigues, R.C.; Hertz, P.F.; Norea, C. Effect of deacetylation degree of chitosan on rheological properties and physical chemical characteristics of genipin-crosslinked chitosan beads. Food Hydrocoll. 2020, 106, 105876. [Google Scholar] [CrossRef]
  30. Xu, B.; Azam, R.; Wang, B.; Zhang, M.; Bhandari, B. Effect of infused CO2 in a model solid food on the ice nucleation during ultrasound-assisted immersion freezing. Int. J. Refrig. 2019, 108, 53–59. [Google Scholar] [CrossRef]
  31. Sakr, M.; Mohamed, M.; Maraqa, M.A.; Hamouda, M.A.; Hassan, A.A.; Ali, J.; Jung, J. A critical review of the recent developments in micro-nano bubbles applications for domestic and industrial wastewater treatment. Alex Eng. J. 2022, 61, 6591–6612. [Google Scholar] [CrossRef]
  32. Gezgin, Z.; Lee, T.-C.; Huang, Q. AFM imaging of extracellular ice nucleators. J. Food Sci. 2021, 85, 3355–3362. [Google Scholar] [CrossRef]
  33. Wei, P.; Huang, C.; Lee, K.W. Nucleation of bubbles on a solidification front—Experiment and analysis. Metall. Mater. Trans. B 2003, 34, 321–332. [Google Scholar] [CrossRef]
  34. Hu, F.; Sun, D.W.; Gao, W.; Zhang, Z.; Zeng, X.; Han, Z. Effects of pre-existing bubbles on ice nucleation and crystallization during ultrasound-assisted freezing of water and sucrose solution. Innov. Food Sci. Emerg. 2013, 20, 161–166. [Google Scholar] [CrossRef]
  35. Daghooghi-Mobarakeh, H.; Subramanian, V.; Phelan, P.E. Experimental study of water freezing process improvement using ultrasound. Appl. Therm. Eng. 2022, 202, 1359–4311. [Google Scholar] [CrossRef]
  36. Chow, R.; Blindt, R.; Chivers, R.; Povey, M. The sonocrystallisation of ice in sucrose solutions: Primary and secondary nucleation. Ultrasonics 2003, 41, 595–604. [Google Scholar] [CrossRef]
  37. Wang, C.; Wu, J.; Wang, H.; Zhang, Z. Classical nucleation theory of ice nucleation: Second-order corrections to thermodynamic parameters. J. Chem. Phys. 2021, 154, 234503. [Google Scholar] [CrossRef]
  38. Matsumoto, K.; Zhang, S.; Sekine, K.; Kubota, H. Investigation on influence of dimensions of ice containing ozone micro-bubbles on characteristics of ozone concentration. Int. J. Refrig. 2016, 66, 41–49. [Google Scholar] [CrossRef]
  39. Pastoriza, L.; Bernardez, M.; Sampedro, G.; Cabo, M.L.; Herrera, J. The use of water and ice with bactericide to prevent onboard and onshore spoilage of refrigerated megrim (Lepidorhombus whiffiagonis). Food Chem. 2008, 110, 31–38. [Google Scholar] [CrossRef] [PubMed]
  40. Ghaly, A.E.; Brooks, M.S.; Dave, D.; Budge, S. Fish spoilage mechanisms and preservation techniques: Review. Am. J. Appl. Sci. 2010, 7, 859–877. [Google Scholar] [CrossRef]
  41. International Commission on Microbiological Specifications for Foods (ICMSF). Microorganisms in Foods 6: Microbial Ecology of Food Commodities, Blackie Academic & Professional; International Commission on Microbiological Specifications for Foods (ICMSF): Baltimore, MD, USA, 1998. [Google Scholar]
  42. Pandiselvam, R.; Subhashinib, S.; Banuu Priyac, E.P.; Kothakotad, A.; Ramesha, S.V.; Shahi, S. Ozone based food preservation: A promising green technology for enhanced food safety. Ozone-Sci. Eng. 2019, 41, 17–34. [Google Scholar] [CrossRef]
  43. Huang, H.; Sun, W.; Xiong, G.; Shi, L.; Jiao, C.; Wu, W.; Li, X.; Qiao, Y.; Liao, L.; Ding, A.; et al. Effects of HVEF treatment on microbial communities and physicochemical properties of catfish fillets during chilled storage. LWT-Food Sci. Technol. 2020, 131, 109667. [Google Scholar] [CrossRef]
  44. Campos, C.A.; Rodríguez, Ó.; Losada, V.; Aubourg, S.P.; Barros-Velázquez, J. Effects of storage in ozonised slurry ice on the sensory and microbial quality of sardine (Sardina pilchardus). Int. J. Food Microbiol. 2005, 103, 121–130. [Google Scholar] [CrossRef]
  45. Okpala, C.; Choo, W.S.; Dykes, G.A. Quality and shelf life assessment of pacific white shrimp (Llitopenaeus vannamei) freshly harvested and stored on ice. LWT-Food Sci Technol. 2014, 55, 110–116. [Google Scholar] [CrossRef]
  46. Binsi, P.K.; Nayak, N.; Sarkar, P.C.; Sahu, U.; Ninan, G.; Ravishankar, C.N. Comparative evaluation of gumarabic coating and vacuum packaging on chilled storage characteristics of indian mackerel (Rastrelliger kanagurta). J. Food Sci. Technol. 2016, 53, 1889–1898. [Google Scholar] [CrossRef] [PubMed]
  47. Liu, L.; Lan, W.; Pu, T.; Zhou, Y.; Xie, J. Combining slightly acidic electrolyzed water and slurry ice to prolong the shelf-life of mackerel (Pneumatophorus japonicus). J. Food Process. Preserv. 2021, 45, 100706. [Google Scholar] [CrossRef]
  48. Lan, W.; Zhang, W.; Liu, J.; Xie, J. Effects of precooling with slurry ice on the freshness of farmed perch (Lateolabrax japonicus) during logistics process. J. Aquat. Food Prod. Technol. 2021, 30, 162–175. [Google Scholar] [CrossRef]
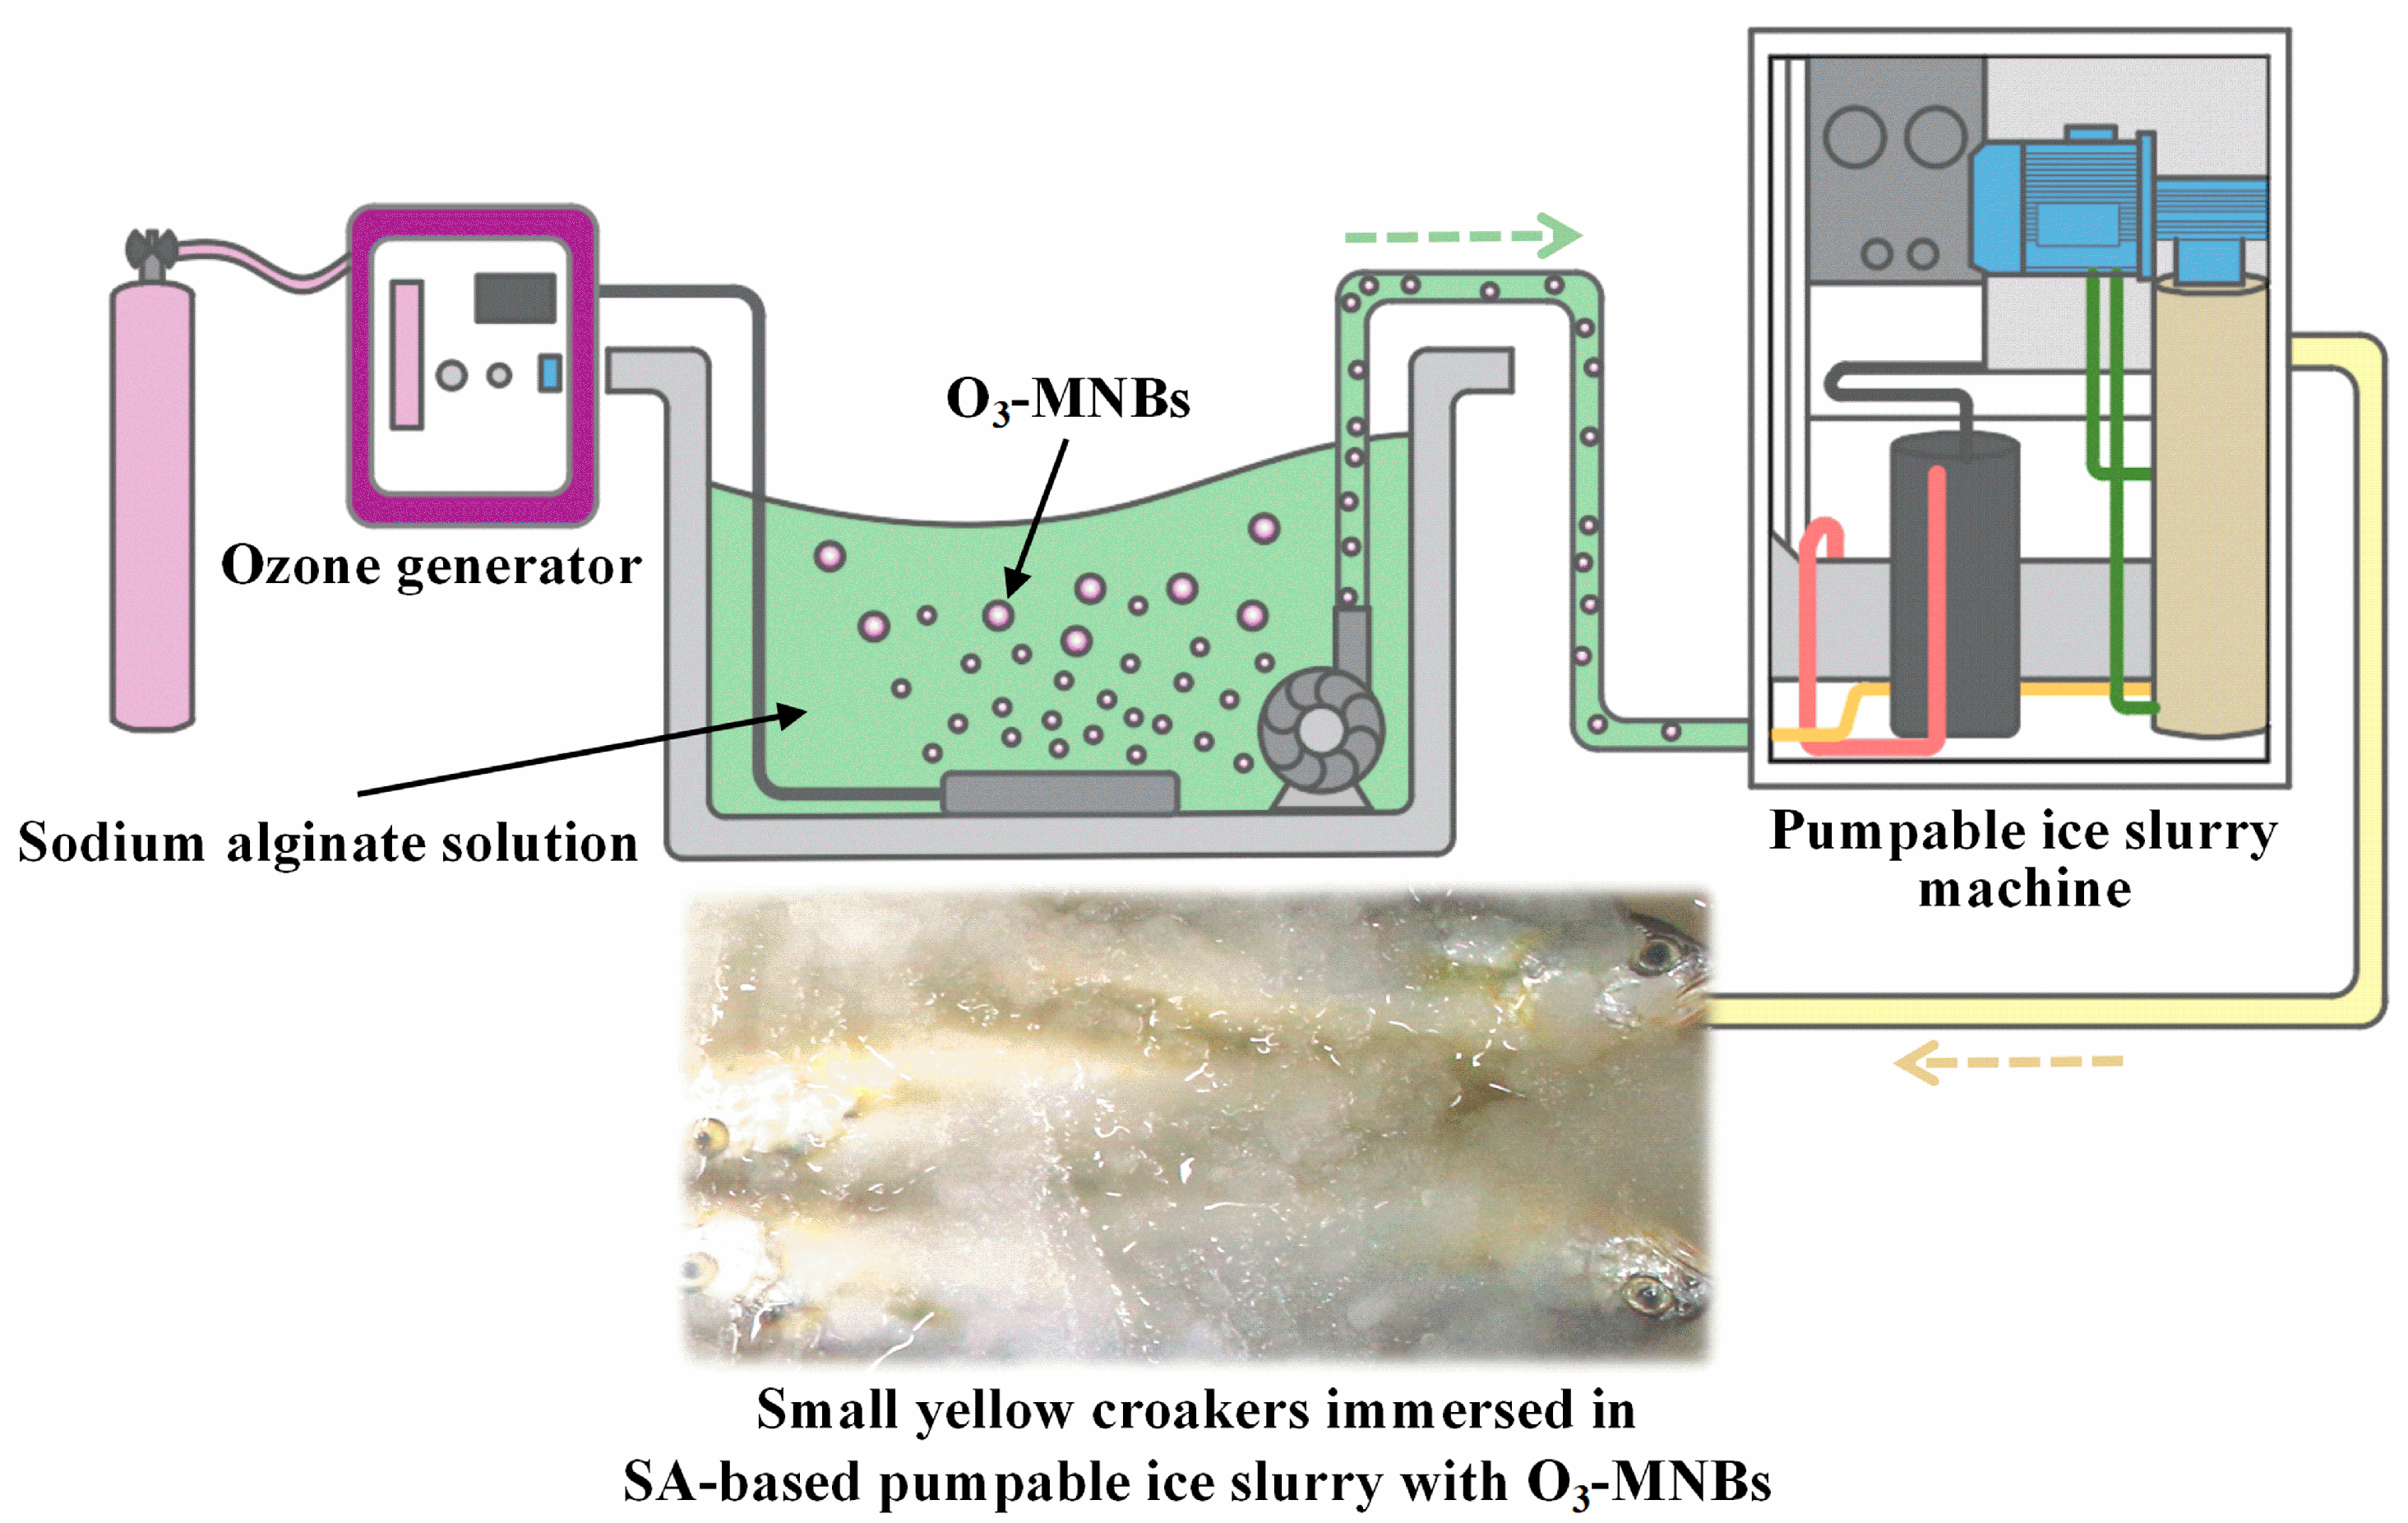
Figure 1. System for producing the novel PIS.
Foods 12 02206 g001
Figure 2. Light microscope images and bubble distribution for different samples ((ac) are SA Ⅰ~Ⅲ, and (df) are SA-O3 Ⅰ~Ⅲ).
Foods 12 02206 g002
Figure 3. Time–temperature profiles for (a) SA samples and (b) SA-O3 samples during PIS production.
Foods 12 02206 g003
Figure 4. The concentration of O3 in SA-O3 samples and SA-PIS-O3 samples.
Foods 12 02206 g004
Figure 5. (a) TVC, (b) pH, (c) TVB-N, and (d) TBARS of small yellow croaker during storage.
Foods 12 02206 g005
Table 1. Nucleation temperature, supercooling degree, and total freezing time for different samples during PIS production.
SolutionNucleation Temperature (°C)Supercooling Degree (°C)Total Freezing Time
(s)
SA Ⅰ−5.2 ± 1.4 c5.2 ± 1.4473.3 ± 20.8 a
SA Ⅱ−3.9 ± 0.9 b3.9 ± 0.9406.7 ± 5.8 b
SA Ⅲ0.0 ± 0.3 a/343.3 ± 5.8 cd
SA-O30.0 ± 0.2 a/396.7 ± 11.5 b
SA-O30.0 ± 0.2 a/363.3 ± 5.8 c
SA-O30.0 ± 0.2 a/316.7 ± 5.8 d
Different lowercase letters (a–d) in the same column indicate significant differences in different samples (p < 0.05).
Table 2. A comparison between previously reported works and this work.
Ice TypeFish SampleStorage TimeFreshness IndicatorsReference
TVC
(log CFU/g)
pHTVB-N
(mg/100 g)
TBARS
(mg MDA/kg)
FIsquidDay 156.61-40-[27]
mackerelDay 21>7.07.231.183.8[47]
large yellow croakerDay 218.77.4225.823.5[21]
PISfarmed perchDay 205.60-32.5-[48]
squidDay 154.74-13.26-[27]
PIS combined with slightly acidic electrolyzed watermackerelDay 245.86.587.52.51[47]
PIS combined with chitosansilver pomfretDay 205.286.7624.784.28[15]
PIS combined with O3sardineDay 22-6.0732.22-[18]
large yellow croakerDay 216.857.287.093.10[21]
small yellow croakerDay 205.927.1126.324.59This work
Disclaimer/Publisher’s Note: The statements, opinions and data contained in all publications are solely those of the individual author(s) and contributor(s) and not of MDPI and/or the editor(s). MDPI and/or the editor(s) disclaim responsibility for any injury to people or property resulting from any ideas, methods, instructions or products referred to in the content.