
Impact of Homegrown School Feeding Program on Smallholders’ Farmer Household Food Security in Northeastern Nigeria
Abstract
:1. Introduction
- What are the factors affecting smallholder farmer household food security status?
- Does linking smallholder farmers to HGSF improve their household food security?
2. Theoretical Background and Literature Review
3. Methodology
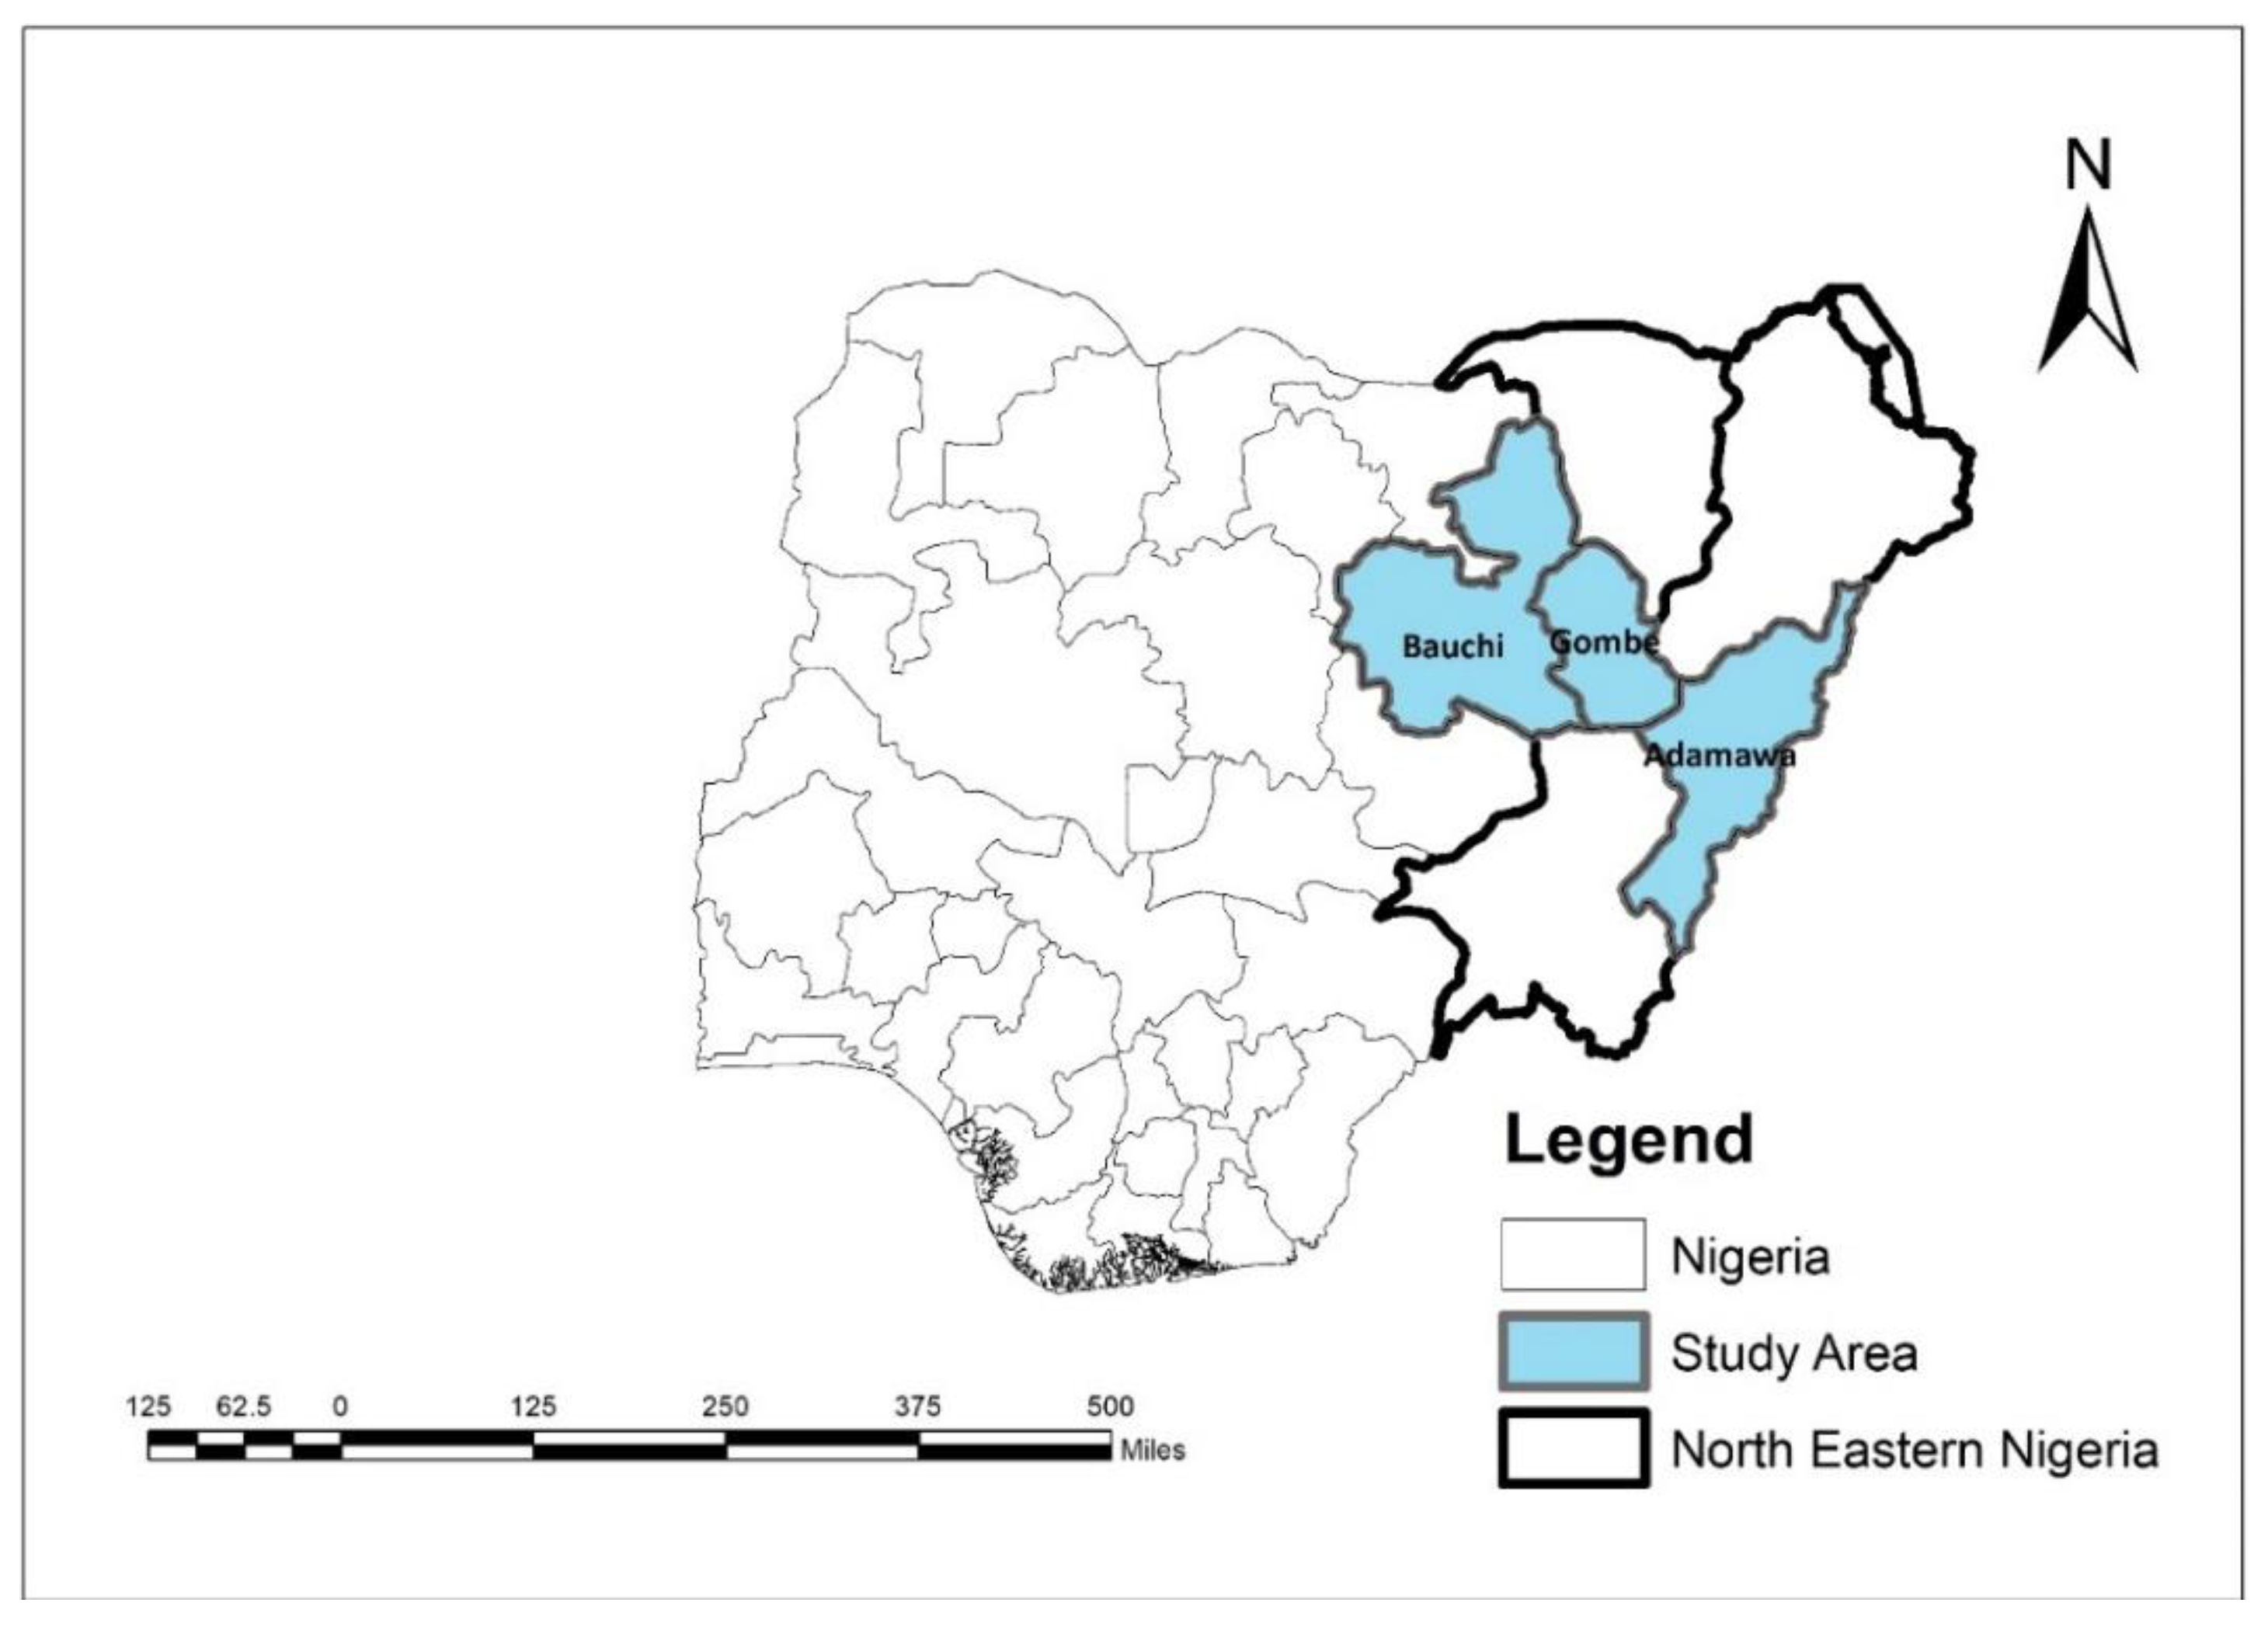
3.1. The Study Area
Definition of the Study Sample
3.2. Sampling Procedure and Sample Size
3.3. Data Collection
3.4. Data Analysis
3.4.1. Probit Model
3.4.2. Empirical Strategy
Propensity Score Matching and Endogenous Switching Regression
3.5. Sample Description
3.5.1. Selection of Variables in the Models
3.5.2. Description of Variables in the Probit Model
The Food Consumption Score
4. Result
4.1. Sociodemographic Information of Smallholder Farmers
4.2. Household Food Security Status of Farmers
4.3. Factors Affecting Smallholder Farmers’ Household Food Security Status
4.4. Effect of Homegrown School Feeding Program on the Food Security Status
5. Discussion
6. Conclusions and Implications
Author Contributions
Funding
Data Availability Statement
Conflicts of Interest
Appendix A

| Effect of HGSF on Household Food Security | ||||||
|---|---|---|---|---|---|---|
| HGSF Status | HGSF Beneficiaries | Nonbeneficiaries | ||||
| Variables | Coef. | Std. Err. | Coef. | Std. Err. | Coef. | Std. Err. |
| Age | 0.022 | 0.022 | −0.386 | 0.196 ** | −0.156 | 0.218 |
| Gender | −0.116 | 0.211 | 2.811 | 2.173 | −1.128 | 2.003 |
| Household size | 0.015 | 0.037 | 0.893 | 0.302 *** | −0.591 | 0.389 |
| Years of experience | −0.015 | 0.022 | −0.085 | 0.191 | 0.210 | 0.220 |
| Education qualification | 0.619 | 0.079 *** | ||||
| Access to input subsidy | −0.771 | 0.268 *** | ||||
| Market information | 0.688 | 0.418 * | ||||
| Constant | −3.127 | 0.852 *** | 41.064 | 6.132 *** | 45.647 | 5.997 *** |
| /lns1 | 2.275 | 0.082 *** | ||||
| /lns2 | 2.354 | 0.062 *** | ||||
| /r1 | −0.695 | 0.223 *** | ||||
| /r2 | 0.032 | 0.266 | ||||
| sigma_1 | 9.726 | 0.805 | ||||
| sigma_2 | 10.531 | 0.651 | ||||
| rho_1 | −0.601 | 0.142 | ||||
| rho_2 | 0.032 | 0.265 | ||||
| Log-likelihood | −1000.408 | |||||
| Wald test χ2 (4) | 4.67 | |||||
| LR test of independent equations χ 2 (1) 8.64 *** | ||||||
| Decision Stage | |||
|---|---|---|---|
| Sub-Samples | HGSF Beneficiaries | Nonbeneficiaries | Treatment Effect |
| HGSF beneficiaries’ farmers | 39.853 (0.344) | 34.299 (0.319) | TT = 5.554 *** (0.476) |
| Nonbeneficiaries’ farmers | 32.706 (0.340) | 31.741 (0.292) | TU = 0.965 *** (0.964) |
| Heterogeneity effects | BH2 = 7.147 | BH1 = 2.558 | TH = 4.589 *** |

References
- WFP. School Feeding Programmes in 2019 Report. 2019. Available online: https://www.wfp.org/publications/2019-wfp-school-feeding-infographic (accessed on 15 November 2021).
- FAO & WFP. Home-Grown School Feeding Resource Framework; Technical Document; FAO & WFP: Rome, Italy, 2018; p. 170. Available online: https://www.fao.org/3/ca0957en/CA0957EN.pdf (accessed on 12 May 2022).
- FAO; FIDA & PMA. El estado de la Inseguridad Alimentaria en el Mundo: Cumplimiento de los Objetivos Internacionales Para 2015 en Relación con el Hambre: Balance de los Desiguales Progresos, Organización de las Naciones Unidas Para la Alimentación y la Agricultura (FAO), Roma. 2015. Available online: https://www.fao.org/hunger/es/ (accessed on 22 June 2022).
- WFP. Improving Links between Smallholder Farmers and School Feeding Programmes. 2014. Available online: https://documents.wfp.org/stellent/groups/public/documents/special_initiatives/WFP267759.pdf (accessed on 15 November 2021).
- WFP. State of School Feeding Worldwide 2020; World Food Programme: Rome, Italy, 2020; ISBN 978-92-95050-04-4. Available online: https://docs.wfp.org/api/documents/WFP-0000123923/download/ (accessed on 15 November 2021).
- WFP. Anthrologica. Bridging the Gap: Engaging Adolescents for Nutrition, Health and Sustainable Development. A Multi Country Study. 2018. Available online: https://bit.ly/2z7489K (accessed on 20 July 2022).
- WFP. Homegrown School Feeding, 46 Countries Have WFP-Supported Homegrown School Feeding Programmes. Home Grown School Feeding|World Food Programme. 2021. Available online: https://wfp.org (accessed on 26 February 2023).
- NHGSFP. Nigeria Home Grown School Feeding Strategic Plan 2016–2020 Report 2017. Available online: https://docs.wfp.org/api/documents/WFP-0000116838/download/ (accessed on 12 May 2022).
- AUDA-NEPAD. African Union Development Agency. In Home Grown School Feeding (HGSF) Handbook; Lessons from Botswana, Ghana and Nigeria; AUDA-NEPAD: Midrand, South Africa, 2020; ISBN 978-1-928527-25-1. Available online: https://www.nepad.org/publication/home-grown-school-feeding-handbook (accessed on 10 June 2022).
- Sumberg, J.; Sabates-Wheeler, R. Linking agricultural development to school feeding in Sub-Saharan Africa: Theoretical perspectives. Food Policy 2011, 36, 341–349. [Google Scholar] [CrossRef]
- Masset, E.; Gelli, A. Improving community development by linking agriculture, nutrition and education: Design of a randomised trial of “homegrown” school feeding in Mali. Trials 2013, 14, 55. [Google Scholar] [CrossRef]
- Soares, P.; Martinelli, S.S.; Melgarejo, L.; Cavalli, S.B.; Davó-Blanes, M.C. Using local family farm products for school feeding programmes: Effect on school menus. Br. Food J. 2017, 119, 1289–1300. [Google Scholar] [CrossRef]
- Singh, S.; Fernandes, M. Home-grown school feeding: Promoting local production systems diversification through nutrition sensitive agriculture. Food Secur. 2018, 10, 111–119. [Google Scholar] [CrossRef] [PubMed]
- Zenebe, M.; Gebremedhin, S.; Henry, C.J.; Regassa, N. School feeding program has resulted in improved dietary diversity, nutritional status and class attendance of school children. Ital. J. Pediatr. 2018, 44, 16. [Google Scholar] [CrossRef]
- Metwally, A.M.; El-Sonbaty, M.M.; El Etreby, L.A.; El-Din, E.M.S.; Abdel Hamid, N.; Hussien, H.A.; Hassanin, A.M.; Monir, Z.M. Impact of National Egyptian school feeding program on growth, development, and school achievement of school children. World J. Pediatr. 2020, 16, 393–400. [Google Scholar] [CrossRef]
- Sabates-Wheeler, R.; Devereux, S.; Hodges, A. Taking the Long View: What Does a Child Focus Add to Social Protection? IDS Bull. 2009, 40, 109–119. [Google Scholar] [CrossRef]
- Bundy, D.A.; de Silva, N.; Horton, S.; Jamison, D.; Patton, G.C. Optimising Education Outcomes: High-Return Investments in School Health for Increased Participation and Learning; World Bank: Washington, DC, USA, 2018; Available online: http://dcp-3.org/sites/default/files/resources/DCP3%20Education%20Edition_Final.pdf (accessed on 15 November 2022).
- Joshi, P.K.; Joshi, L.; Birthal, B.S. Diversification and its impact on smallholders: Evidence from a study on vegetable production. Agric. Econ. Res. Rev. 2006, 19, 57759. [Google Scholar] [CrossRef]
- Dorward, A.; Kydd, J. The Malawi 2002 food crisis: The rural development challenge. J. Mod. Afr. Stud. 2004, 42, 343–361. [Google Scholar] [CrossRef]
- Poulton, C.; Kydd, J.; Dorward, A. Overcoming market constraints on pro-poor agricultural growth in sub-Saharan Africa. Dev. Policy Rev. 2006, 24, 243–277. [Google Scholar] [CrossRef]
- Buisman, M.; Haijema, R.; Bloemhof-Ruwaard, J. Discounting and dynamic shelf life to reduce fresh food waste at retailers. Int. J. Prod. Econ. 2017, 209, 274–284. [Google Scholar] [CrossRef]
- Kolawole, O.A.; Mishra, J.L.; Hussain, Z. Addressing food waste and loss in the Nigerian food supply chain: Use of Lean Six Sigma and Double-Loop Learning. Ind. Mark. Manag. 2021, 93, 235–249. [Google Scholar] [CrossRef]
- Mensah, C. Incentivising smallholder farmer livelihoods and constructing food security through homegrown school feeding: Evidence from Northern Ghana. Braz. J. Int. Law 2019, 15, 490–504. [Google Scholar] [CrossRef]
- Fortes, A.R.; Ferreira., V.; Simões., E.B.; Baptista, I.; Grando, S.; Sequeira, E. Food Systems and Food Security: The Role of Small Farms and Small Food Businesses in Santiago Island, Cabo Verde. Agriculture 2020, 10, 216. [Google Scholar] [CrossRef]
- Heckman, J.J.; Ichimura, H.; Todd, P.E. Matching as an econometric evaluation estimator: Evidence from evaluating a job training programme. Rev. Econ. Stud. 1997, 64, 605–654. [Google Scholar] [CrossRef]
- Robins, J.; Sued, M.; Lei-Gomez, Q.; Rotnitzky, A. Comment: Performance of Double-Robust Estimators When “Inverse Probability” Weights Are Highly Variable. Stat. Sci. 2007, 22, 544–559. [Google Scholar] [CrossRef]
- Wooldridge, J.M. Inverse probability weighted estimation for general missing data problems. J. Econ. 2007, 141, 1281–1301. [Google Scholar] [CrossRef]
- Wossen, T.; Abdoulaye, T.; Alene, A.; Haile, M.G.; Feleke, S.; Olanrewaju, A.; Manyong, V. Impacts of extension access and cooperative membership on technology adoption and household welfare. J. Rural Stud. 2017, 54, 223–233. [Google Scholar] [CrossRef]
- UNICEF. An Estimated 10.4 Million Children in the Democratic Republic of the Congo, Northeast Nigeria, the Central Sahel, South Sudan and Yemen Will Suffer from Acute Malnutrition in 2021. Impact Evaluation Report 2020. 2020. Available online: https://www.unicef.org/turkiye/en/press-releases/estimated-104-million-children-democratic-republic-congo-northeast-nigeria-central (accessed on 10 November 2021).
- Adelaja, A.; George, J. Effects of conflict on agriculture: Evidence from the Boko Haram insurgency. World Dev. 2019, 117, 184–195. [Google Scholar] [CrossRef]
- Weiss, C.H. Nothing as practical as good theory: Exploring theory-based evaluation for comprehensive community initiatives for children and families. In New Approaches to Evaluating Community Initiatives: Concepts, Methods, and Contexts; Connell, J.P., Kubisch, A.C., Weiss, C.H., Eds.; Aspen Institute: Washington, DC, USA, 1995. [Google Scholar]
- Saint Ville, A.; Hickey, G.M.; Rouwette, E.; Samuels, A.; Guariguata, L.; Unwin, N.; Phillip, L.E. A Combined Theory of Change-Group Model Building Approach to Evaluating “Farm to Fork” Models for School Feeding in the Caribbean. Front. Sustain. Food Syst. 2022, 6, 801731. [Google Scholar] [CrossRef]
- Ratcliffe, M.M. A sample theory-based logic model to improve program development, implementation, and sustainability of farm to school programs. Child. Obes. (Former. Obes. Weight.) 2012, 8, 315–322. [Google Scholar] [CrossRef] [PubMed]
- Ajzen, I. The theory of planned behavior. Hum. Decis. Process. 1991, 50, 179–211. [Google Scholar] [CrossRef]
- Espejo, F.; Burbano, C.; Galliano, E. Home Grown School Feeding: A Framework to Link School Feeding with Local Agricultural Production; World Food Programme: Rome, Italy, 2009; ISBN WFPWFP261. Available online: https://wfp.tind.io/record/7264?ln=en (accessed on 10 November 2021).
- Morgan, K.; Bastia, T.; Kanemasu, T. Home Grown: The New Era of School Feeding; World Food Programme: Rome, Italy, 2007; Available online: https://orca.cardiff.ac.uk/id/eprint/24443 (accessed on 10 November 2021).
- Corsi, S.; Marchisio, L.V.; Orsi, L. Connecting smallholder farmers to local markets: Drivers of collective action, land tenure and food security in East Chad. Land Use Policy 2017, 68, 39–47. [Google Scholar] [CrossRef]
- Devereux, S. Social protection for enhanced food security in sub-Saharan Africa. Food Policy 2016, 60, 52–62. [Google Scholar] [CrossRef]
- Kissoly, L.; Faße, A.; Grote, U. The integration of smallholders in agricultural value chain activities and food security: Evidence from rural Tanzania. Food Secur. 2017, 9, 1219–1235. [Google Scholar] [CrossRef]
- Herrmann, R.; Nkonya, E.; Faße, A. Food value chain linkages and household food security in Tanzania. Food Secur. 2018, 10, 827–839. [Google Scholar] [CrossRef]
- Geday, E.A.; Degefa, T.; Martine, P.; Etienne, M. Food Security and Nutrition Impacts of Smallholder Farmers’ Participation in Dairy Value Chain in Ethiopia. J. Int. Bus. Econ. 2016, 16, 21–38. [Google Scholar] [CrossRef]
- Maziya, M.; Mudhara, M.; Chitja, J. What factors determine household food security among smallholder farmers? Insights from Msinga, KwaZulu-Natal. S. Afr. Agrekon 2017, 56, 40–52. [Google Scholar] [CrossRef]
- Salazar, L.; Aramburu, J.; González-Flores, M.; Winters, P. Sowing for food security: A case study of smallholder farmers in Bolivia. Food Policy 2016, 65, 32–5233. [Google Scholar] [CrossRef]
- Danso-Abbeam, G.; Ehiakpor, D.S.; Aidoo, R. Agricultural extension and its effects on farm productivity and income: Insight from Northern Ghana. Agric. Food Secur. 2018, 7, 74. [Google Scholar] [CrossRef]
- Ogunniyi, A.I.; Omotoso, S.O.; Salman, K.K.; Omotayo, A.O.; Olagunju, K.O.; Aremu, A.O. Socioeconomic Drivers of Food Security among Rural Households in Nigeria: Evidence from Smallholder Maize Farmers. Soc. Indic. Res. 2021, 155, 583–599. [Google Scholar] [CrossRef]
- Wossen, T.; Berger, T.; Haile, M.G.; Troost, C. Impacts of climate variability and food price volatility on household income and food security of farm households in East and West Africa. Agric. Syst. 2018, 163, 7–15. [Google Scholar] [CrossRef]
- Gelli, A.; Masset, E.; Folson, G.; Kusi, A.; Arhinful, D.K.; Asante, F.; Ayi, I.; Bosompem, K.M.; Watkins, K.; Abdul-Rahman, L.; et al. Evaluation of alternative school feeding models on nutrition, education, agriculture and other social outcomes in Ghana: Rationale, randomised design and baseline data. Trials 2016, 17, 37. [Google Scholar] [CrossRef]
- Afridi, F.; Bidisha, B.; Rohini, S. School Meals and Classroom Effort: Evidence from India. Mimeo. 2014. Available online: https://ssrn.com/abstract=3457671 (accessed on 15 November 2022).
- Abdullah, D.Z.; Tariq, S.; Sajjad, A.; Waqar, A.; Izhar, U.D.; Aasir, I. Factors affecting household food security in rural northern hinterland of Pakistan. J. Saudi Soc. Agric. Sci. 2019, 18, 201–210. [Google Scholar] [CrossRef]
- Mustapha, M.; Kamaruddin, R.B.; Dewi, S. Factors affecting rural farming households’ food security status in Kano, Nigeria. Int. J. Manag. Res. Rev. IJMRR SatyaDham Found. 2018, 8, 1. [Google Scholar]
- Oduniyi, O.S.; Tekana, S.S. Status and Socioeconomic Determinants of Farming Households’ Food Security in Ngaka Modiri Molema District, South Africa. Soc. Indic. Res. 2020, 149, 719–732. [Google Scholar] [CrossRef]
- Alpízar, F.; Saborío-Rodríguez, M.; Martínez-Rodríguez, R.; Viguera, B.; Vignola, R.; Capitán, T.; Harvey, C.A. Determinants of food insecurity among smallholder farmer households in Central America: Recurrent versus extreme weather-driven events. Reg. Environ. Chang. 2020, 20, 22. [Google Scholar] [CrossRef]
- Milazzo, A.; van de Walle, D. Women Left Behind? Poverty and Headship in Africa. In Policy Research Working Paper; World Bank: Washington, DC, USA, 2015; No. 7331; Available online: https://openknowledge.worldbank.org/handle/10986/22212 (accessed on 10 November 2021).
- Ogundari, K. The Paradigm of Agricultural Efficiency and its Implication on Food Security in Africa: What Does Meta-Analysis Reveal. World Dev. 2014, 64, 690–702. [Google Scholar] [CrossRef]
- Kehinde, A.D.; Adeyemo, R.; Ogundeji, A.A. Does social capital improve farm productivity and food security? Evidence from cocoa-based farming households in Southwestern Nigeria. Heliyon 2021, 7, e06592. [Google Scholar] [CrossRef]
- Gebru, G.W.; Ichoku, H.E.; Phil-Eze, P.O. Determinants of smallholder farmers’ adoption of adaptation strategies to climate change in Eastern Tigray National Regional State of Ethiopia. Heliyon 2020, 6, e04356. [Google Scholar] [CrossRef]
- Mango, N.; Zamasiya, B.; Makate, C.; Nyikahadzoi, K.; Siziba, S. Factors influencing household food security among smallholder farmers in the Mudzi district of Zimbabwe. Dev. S. Afr. 2014, 31, 625–640. [Google Scholar] [CrossRef]
- Nyikahadzoi, K.; Siziba, S.; Mango, N.; Mapfumo, P.; Adekunhle, A.; Fatunbi, O. Creating food self-reliance among the smallholder farmers of eastern Zimbabwe: Exploring the role of integrated agricultural research for development. Food Secur. 2012, 4, 647–656. [Google Scholar] [CrossRef]
- Bacon, C.M. Food sovereignty, food security and fair trade: The case of an influential Nicaraguan smallholder cooperative. Third World Q. 2015, 36, 469–488. [Google Scholar] [CrossRef]
- National Bureau of Statistics. Nigerian Gross Domestic Product Report (Expenditure and Income Approach) (Q1, Q2, Q3, & Q4 2020). 2021. Available online: https://www.nigerianstat.gov.ng (accessed on 12 February 2022).
- UNICEF. Futures of 370 Million Children in Jeopardy as School Closures Deprive Them of School Meals. 2019. Available online: https://www.unicef.org/press-releases/futures-370-million-children-jeopardy-school-closures-deprive-them-school-meals (accessed on 13 March 2022).
- National Bureau of Statistics. Nigeria in 2019: Economic Review and 2017–2019 Outlook. 2020. Available online: https://www.nbs.org/ (accessed on 15 January 2022).
- Stoddard, A.; Harvey, P.; Czwarno, M.; Breckenridge, M.-J. Humanitarian Access SCORE Report: Northeast Nigeria. Survey on the Coverage, Operational Reach, and Effectiveness of Humanitarian Aid. Humanitarian Outcomes. 2020. Available online: https://www.humanitarianoutcomes.org/ (accessed on 15 November 2022).
- Hertzog, M.A. Considerations in determining sample size for pilot studies. Res. Nurs. Health 2008, 31, 180–191. [Google Scholar] [CrossRef] [PubMed]
- Wadud, A. Impact of Microcredit on Agricultural Farm Performance and Food Security in Bangladesh, Working Paper No. 14; Institute of Microfinance (InM): Newcastle, UK, 2013; pp. 1–33. Available online: https://www.findevgateway.org/sites/default/files/publications/files/mfg-en-paper-impact-of-microcredit-on-agricultural-farm-performance-and-food-security-in-bangladesh-feb-2013.pdf (accessed on 13 March 2022).
- Wooldridge, J.M. Econometric Analysis of Cross Section and Panel Data, 2nd ed.; The MIT Press: Cambridge, MA, USA, 2010; ISBN 978-0-262-23258-6. Available online: https://books.google.cz/books?hl=en&lr=&id=hSs3AgAAQB (accessed on 24 September 2021).
- Maddalla, G.S. Limited Dependent and Qualitative Variables in Econometrics; Cambridge University Press: Cambridge, UK, 1983; Available online: https://books.google.cz/books?hl=en&lr=&id=-Ji1ZaUg7gcC&oi=fnd&pg=PR11&dq=Maddalla,+G.S.+(1983) (accessed on 15 July 2022).
- Guo, S.; Fraser, M.; Chen, Q. Propensity Score Analysis: Recent Debate and Discussion. J. Soc. Soc. Work. Res. 2020, 11, 463–482. [Google Scholar] [CrossRef]
- Peel, M.J. Addressing Unobserved Selection Bias in Accounting Studies: The Bias Minimization Method. Eur. Account. Rev. 2018, 27, 173–183. [Google Scholar] [CrossRef]
- Imbens, G.W.; Wooldridge, J.M. Recent Developments in the Econometrics of Program Evaluation. J. Econ. Lit. 2009, 47, 5–86. [Google Scholar] [CrossRef]
- Rosenbaum, P.R.; Rubin, B.D. Constructing a control group using multivariate matched sampling methods that incorporate the propensity score. Am. Stat. 1985, 39, 33–38. [Google Scholar] [CrossRef]
- Bidzakin, J.K.; Fialor, S.C.; Awunyo-Vitor, D.; Yahaya, I. Impact of contract farming on rice farm performance: Endogenous switching regression. Cogent Econ. Financ. 2019, 7, 1618229. [Google Scholar] [CrossRef]
- Shiferaw, B.; Hellin, J.; Muricho, G. Improving market access and agricultural productivity growth in Africa: What role for producer organizations and collective action institutions. Food Secur. 2011, 3, 475–489. [Google Scholar] [CrossRef]
- Ma, W.; Abdulai, A. Does cooperative membership improve household welfare? Evidence from apple farmers in China. Food Policy 2016, 58, 94–102. [Google Scholar] [CrossRef]
- Adjin, K.C.; Goundan, A.; Henning, C.H.C.A.; Sarr, S. Estimating the impact of agricultural cooperatives in Senegal: Propensity score matching and endogenous switching regression analysis. Work. Pap. Agric. Policy 2020, 8, WP2020-10. Available online: http://hdl.handle.net/10419/235900 (accessed on 15 November 2022).
- Heckman, J.J. Micro Data, Heterogeneity, and the Evaluation of Public Policy: Nobel Lecture. J. Political Econ. 2001, 109, 673–748. [Google Scholar] [CrossRef]
- Leroy, J.L.; Ruel, M.; Frongillo, E.A.; Harris, J.; Ballard, T.J. Measuring the food Access Dimension of food Security: A Critical Review and Mapping of indicators. Food Nutr. Bull. 2015, 36, 167–195. [Google Scholar] [CrossRef]
- WFP. Vulnerability Analysis and Mapping Branch (ODAV) Picture: WFP/Andrea Berardo. 2006. Available online: http://www.wfp.org/odan/senac (accessed on 15 November 2022).
- World Bank Group. Poverty and Equity Brief, African Western and Central Nigeria Report. 2021. Available online: https://www.worldbank.org/en/topic/poverty/publication/poverty-and-equity-briefs (accessed on 15 November 2022).
- Montalbano, P.; Pietrellib, R.; Salvatici, L. Participation in the market chain and food security: The case of the Ugandan maize farmers. Food Policy 2018, 76, 81–98. [Google Scholar] [CrossRef]
- IFAD. Investing in smallholder family agriculture for global food security and nutrition. In IFAD Post-2015 Policy Brief 3; IFAD: Rome, Italy, 2014; Available online: https://www.ifad.org/documents/38714170/39135645/IFAD+Policy+brief+3+-++Investing+in+smallholder+family+agriculture+for+global+food+security+and+nutrition.pdf/f81a75f1-854f-4b79-b569-d5b8566ca2fe (accessed on 15 November 2022).
- Jimi, N.A.; Nikolov, P.V.; Malek, M.A.; Kumbhakar, S. The effects of access to credit on productivity: Separating technological changes from changes in technical efficiency. J. Prod. Anal. 2019, 52, 37–55. [Google Scholar] [CrossRef]
- Bocher, T.F.; Alemu, B.A.; Kelbore, Z.G. Does access to credit improve household welfare? Evidence from Ethiopia using endogenous regime switching regression. Afr. J. Econ. Manag. Stud. 2017, 8, 51–65. [Google Scholar] [CrossRef]

| State | LGAs | Wards | Beneficiary Farmers | Nonbeneficiary Farmers |
|---|---|---|---|---|
| Adamawa | Yola north | 5 | 11 | 10 |
| Demsa | 5 | 10 | 9 | |
| Numan | 5 | 11 | 10 | |
| Mayo-Belwa | 5 | 10 | 9 | |
| Bauchi | Alkaleri | 5 | 10 | 9 |
| Bauchi | 5 | 11 | 10 | |
| Dass | 5 | 10 | 9 | |
| Katagum | 5 | 11 | 10 | |
| Gombe | Akko | 5 | 11 | 10 |
| Billiri | 5 | 10 | 9 | |
| Gombe | 5 | 11 | 10 | |
| Bajoga | 5 | 10 | 9 | |
| Total | 12 | 60 | 126 | 114 |
| Subsamples | Decision Stage | Treatment Effects | |
|---|---|---|---|
| Beneficiaries | Nonbeneficiaries | ||
| Beneficiaries’ farmers | (a) E(Y1i|Ti = 1) | (c) E(Y2i|Ti = 1) | ATT |
| Nonbeneficiaries’ farmers | (d) E(Y1i|Ti = 0) | (b) E(Y2i|Ti = 0) | ATU |
| Heterogeneity effects | BH1 | BH2 | TH |
| Variables | Description and Measurement | Mean | Std. Dev. |
|---|---|---|---|
| Dependent Variable | |||
| Food security indicators | |||
| Food consumption score | 0 = poor and borderline (up to 35), 1 = acceptable (>35) | 0.30 | 0.46 |
| Independent Variables | |||
| Household head characteristics | |||
| Age | Age of household head (years) | 42.09 | 8.48 |
| Gender | Male = 1, Female = 0 | 0.67 | 0.47 |
| Marital status | Married = 1, unmarried = 0 | 0.89 | 0.31 |
| Years of experience | Farming experience in years | 17.67 | 8.91 |
| Educational Qualification | Quranic Edu. = 1, primary = 2, secondary = 3, NCE = 4, graduate = 5, postgraduate = 6 | 2.83 | 1.44 |
| Household characteristics | |||
| Household size | The household size in numbers | 7.94 | 3.88 |
| Households with children benefiting from SFP | Yes = 1 No = 0 | 0.61 | 0.49 |
| Homegrown school feeding program | |||
| HGSF program | Beneficiary farmers = 1 Nonbeneficiary = 0 | 0.53 | 0.50 |
| Institutional variables | |||
| Access to extension services | Yes = 1 No = 0 | 0.18 | 0.38 |
| Access to credit | Yes = 1 No = 0 | 0.45 | 0.50 |
| Access to input subsidy | Yes = 1 No = 0 | 0.24 | 0.42 |
| Market information | Yes = 1 No = 0 | 0.03 | 0.16 |
| Member of cooperative | Yes = 1 No = 0 | 0.21 | 0.14 |
| Variables | Beneficiary Farmers (n = 126) | Nonbeneficiary Farmers (n = 114) | Mean Difference | t-Statistics |
|---|---|---|---|---|
| Mean ± S.D. | Mean ± SD | |||
| Age of farmers | 41.98 (8.77) | 42.20 (8.19) | −0.22 | 0.20 |
| Gender | 0.65 (0.48) | 0.69 (0.46) | −0.04 | 0.69 |
| Marital status | 0.86 (0.35) | 0.93 (0.35) | −0.07 | 1.81 |
| Household size | 7.71 (3.82) | 8.19 (3.95) | −0.48 | 0.95 |
| Years of farming experience | 17.38 (9.03) | 17.98 (8.80) | −0.60 | 0.52 |
| Educational Qualification | 3.23 (1.50) | 2.40 (1.23) | 0.83 *** | 4.69 |
| HH Children benefiting SFP | 0.56 (0.50) | 0.66 (0.48) | −0.10 | 1.496 |
| Access to credit | 0.75 (0.43) | 0.12 (0.32) | 0.63 *** | 12.616 |
| Access to extension services | 0.21 (0.41) | 0.14 (0.36) | 0.07 | 1.153 |
| Access to input subsidy | 0.18 (0.38) | 0.30 (0.46) | −0.12 ** | 2.242 |
| Market information | 0.02 (0.15) | 0.03 (0.16) | −0.01 | 0.123 |
| Cooperative membership | 0.02 (0.15) | 0.02 (0.13) | 0.00 | 0.338 |
| FCS (Household) | 36.88 (11.55) | 29.64 (7.56) | 7.24 *** | 5.682 |
| FCS | Profile | Beneficiary Farmers % (n = 126) | Nonbeneficiary Farmers% (n = 114) |
|---|---|---|---|
| 0–21 | Poor | 0.5 | 9.26 |
| 21.5–35 | Borderline | 60.32 | 70.56 |
| >35 | Acceptable | 39.18 | 20.18 |
| Variable | Marginal Effect | Std. Err. |
|---|---|---|
| Social safety net program | ||
| HGSF status | 0.404 *** | 0.087 |
| Household head characteristics | ||
| Age | −0.008 * | 0.004 |
| Gender | 0.002 | 0.044 |
| Marital status | −0.016 | 0.065 |
| Years of farming experience | 0.003 | 0.004 |
| Educational Qualification | 0.022 | 0.019 |
| Household characteristic | ||
| Household size | 0.010 | 0.007 |
| Households with children benefiting SFP | 0.022 | 0.043 |
| Institutional characteristic | ||
| Access to credit | 0.270 *** | 0.087 |
| Extension service delivery | 0.063 * | 0.065 |
| Input subsidy | 0.101 | 0.066 |
| Market information | 0.289 | 0.338 |
| Number of observations | 240 | |
| Constant | 4.348 | |
| LR chi2 | 52.56 | |
| Pseudo R2 | 0.251 | |
| Prob > chi2 | 0.000 | |
| Variables | Average Treatment Effect on the Treated (ATT) | ||
|---|---|---|---|
| PSM | IPWRA | ESR | |
| 1 | 2 | 3 | |
| HGSF | 4.931 ** | 3.258 ** | 5.554 *** |
| (1.997) | (1.582) | (0.476) | |
| N | 240 | 240 | 240 |
Disclaimer/Publisher’s Note: The statements, opinions and data contained in all publications are solely those of the individual author(s) and contributor(s) and not of MDPI and/or the editor(s). MDPI and/or the editor(s) disclaim responsibility for any injury to people or property resulting from any ideas, methods, instructions or products referred to in the content. |
© 2023 by the authors. Licensee MDPI, Basel, Switzerland. This article is an open access article distributed under the terms and conditions of the Creative Commons Attribution (CC BY) license (https://creativecommons.org/licenses/by/4.0/).
Share and Cite
Barnabas, B.; Agyemang, S.A.; Zhllima, E.; Bavorova, M. Impact of Homegrown School Feeding Program on Smallholders’ Farmer Household Food Security in Northeastern Nigeria. Foods 2023, 12, 2408. https://doi.org/10.3390/foods12122408
Barnabas B, Agyemang SA, Zhllima E, Bavorova M. Impact of Homegrown School Feeding Program on Smallholders’ Farmer Household Food Security in Northeastern Nigeria. Foods. 2023; 12(12):2408. https://doi.org/10.3390/foods12122408
Chicago/Turabian StyleBarnabas, Bulus, Sylvester Amoako Agyemang, Edvin Zhllima, and Miroslava Bavorova. 2023. "Impact of Homegrown School Feeding Program on Smallholders’ Farmer Household Food Security in Northeastern Nigeria" Foods 12, no. 12: 2408. https://doi.org/10.3390/foods12122408