Article

Exploring the Successions in Microbial Community and Flavor of Daqu during Fermentation Produced by Different Pressing Patterns

1
College of Biomass Science and Engineering, Sichuan University, Chengdu 610065, China
2
Sichuan Liquor Group, Chengdu 610000, China
3
Sichuan Yibin Xufu Liquor Co., Ltd., Yibin 644000, China
*
Authors to whom correspondence should be addressed.
Foods 2023, 12(13), 2603; https://doi.org/10.3390/foods12132603
Submission received: 13 June 2023 / Revised: 30 June 2023 / Accepted: 3 July 2023 / Published: 5 July 2023
(This article belongs to the Special Issue The Microbial Community and Its Functions in Fermented Foods)

Abstract

:
Daqu can be divided into artificially pressed daqu (A-Daqu) and mechanically pressed daqu (M-Daqu) based on pressing patterns. Here, we compared the discrepancies in physicochemical properties, volatile metabolites, and microbiota features between A-Daqu and M-Daqu during fermentation and further investigated the factors causing those differences. A-Daqu microbiota was characterized by six genera (e.g., Bacillus and Thermoactinomyces), while five genera (e.g., Bacillus and Thermomyces) dominated in M-Daqu. The flavor compounds analysis revealed that no obvious difference was observed in the type of esters between the two types of daqu, and M-Daqu was enriched with more alcohols. The factors related to differences between the two types of daqu were five genera (e.g., Hyphopichia). The functional prediction of microbial communities revealed that the functional discrepancies between the two types of daqu were mainly related to ethanol metabolism and 2,3-butanediol metabolism. This study provided a theoretical basis for understanding the heterogeneity of daqu due to the different pressing patterns.

1. Introduction

Daqu is a kind of microbial fermenting starter, which is rich in a large number of microorganisms and various metabolites, such as various enzymes and flavor substances, with the functions of saccharification, fermentation, and aromatization, and daqu plays an important role in the brewing of baijiu [1]. Daqu is made from wheat as the main raw material or, in some cases, barley or peas [2]. According to the highest temperature reached during production, daqu is divided into low, medium, and high temperatures, which are applied to the production of Qingxiangxing, Nongxiangxing, and Jiangxiangxing baijiu, respectively, and contribute unique flavors to baijiu [3]. Generally, the flavor and quality of baijiu are closely related to the microbial community throughout the production process, especially to the microorganisms in daqu, as a high percentage (~20%) of daqu is added to the raw grains required for the fermentation of Nongxiangxing baijiu [4].
In recent years, the microbial communities in daqu have drawn increasing attention due to the advancement of high-throughput sequencing technology, and extensive and in-depth studies have been conducted on the microbial composition of daqu. The variations of volatile compounds and the interactions between microorganisms and the environmental factors during the fermentation of daqu were investigated using high-throughput, sequencing-based, culture-independent technology combined with culture-dependent methods [5,6].
Recently, the demand for daqu is increasing quickly, along with the consumer market for baijiu. The cumulative production of Nongxiangxing baijiu in China reached 1.86 million kiloliters in May 2023 (data from National Bureau of the Statistics of the People’s Republic of China). Daqu manufacturers currently prefer to make daqu using a mechanical pattern due to its higher efficiency compared with artificial manufacturing, with which it is difficult to meet the demands for daqu output [7]. Manufacturers have started using automated facilities for bricks, decreasing labor intensity by more than half [8]. The traditional preparation process of Nongxiangxing daqu consists of three main stages: (i) wheat infiltration and grinding; (ii) shaping into bricks; and (iii) fermentation and storage. The shaping stage is the pressing of the raw material into bricks. In this stage, two types of brick forming can be used, i.e., an artificial daqu-stepping mold or a pressed-shaping machine, but with the same production process (e.g., raw materials, process parameters) [9]. The mechanically pressed daqu bricks are M-Daqu, while the artificially pressed daqu are A-Daqu. Although the process principle of M-Daqu is the same as that of A-Daqu, there are still differences in quality and microbial community structure [10,11]. The investigation of the differences between M-Daqu and A-Daqu will help to promote the fully automatic production of Nongxiangxing daqu. Currently, numerous scholars have carried out far-reaching research on daqu during the fermentation process, revealing the microbial community succession and the correlation between microorganisms and flavor substances, and they have investigated the impact of environmental factors on daqu microbial communities [5,6]. However, the differences in microbial community structure and flavor between M-Daqu and A-Daqu during fermentation remain unclear. Therefore, in this study, the succession of microbial communities and volatile compounds of the two types of daqu during fermentation were investigated. Then, the biomarkers that distinguish the two types of daqu were revealed. Random forest (RF) analysis was used to identify the main factors influencing the changes in microbial community and physicochemical properties of daqu during fermentation. On this basis, the function of microorganisms in flavor development was further revealed by applying the PICRUSt2 tool based on 16S rRNA and ITS sequencing results. The results presented in this study may contribute to promoting the technological development for daqu manufacturing and improve the quality of daqu and Chinese baijiu.

2. Materials and Methods

2.1. Collection and Preparation of Sample

Samples of artificially pressed daqu (A-Daqu) and mechanically pressed daqu (M-Daqu) were obtained from Sichuan Yibin Xufu Liquor Co., Ltd. (Yibin, Sichuan, China), a representative liquor enterprise located in Sichuan province, China (105°36′47.4″ E, 28°45′55.9″ N). A-Daqu (25 cm × 24 cm × 5 cm) adopted an artificially pressed method, while M-Daqu (25 cm × 24 cm × 5 cm) adopted a mechanical pressed method. In September 2021, three parallel samples were randomly chosen from the upper, middle, and bottom stacked layers in the Qu room (incubating room). The A-Daqu samples were harvested on the 5th, 10th, 15th, 25th, and 40th days during the daqu incubation process, and they were labeled as A5, A10, A15, A25, and A40, respectively. On the 5th, 10th, 15th, 20th, and 30th days of fermentation, M-Daqu was collected, and these samples were marked as M5, M10, M15, M20, and M30, respectively. The initial raw material mixtures were labeled D0. The 33 samples were collected, ground, and mixed separately, with the amount of powder required for DNA extraction collected and stored separately in a −80 °C refrigerator, and the remainder was sealed in sterile bags and maintained at −80 °C until further analysis.

2.2. Determination of Physicochemical Properties and Enzymatic Activities

A gravimetric approach was employed to evaluate the water content of the samples, which dried the samples to a constant weight at 105 °C (QB/T 4257–2011) [12]. The total titratable acid was measured using the direct titration method with 0.1 mol/L NaOH solution to the endpoint of a pH of 8.2. Fermenting power (FP), saccharification power (SP), esterifying power (EP), and liquefying power (LP) were determined based on national professional standard techniques (QB/T 4257–2011). The fermentation power was expressed as the weight of carbon dioxide produced from fermentable sugars in 0.5 g of daqu at 30 °C for 72 h. The saccharification power was defined as the production of glucose converted from soluble starch in 1 g of daqu at 35 °C and a pH of 4.6 in 1 h. The esterifying power was expressed as the production of ethyl hexanoate synthesized from hexanoic acid and ethanol in 25 g of daqu at 35 °C for 7 d. One unit of liquefying power was defined as the amount of soluble starch that can be liquefied in 1 g of absolute dry daqu in 1 h. All physicochemical and enzymatic parameters were determined in triplicate.

2.3. Analysis of Volatile Metabolites by HS-SPME-GC/MS

Volatile chemicals were extracted with a headspace-solid phase microextraction (HS-SPME) technique, applying a DVB/CAR/PDMS fiber 50/30 μm three-phase extraction head (Supelco, Inc., Bellefonte, PA, USA). Briefly, 0.5 g of sample was placed in a 15 mL headspace vial with 10 µL 2-octanol (0.0158 g/100 mL) dissolved in chromatographic grade methanol as an internal standard. After balancing the head bottle in a warm sink for 15 min at a constant temperature of 60 °C under stirring, the fiber was pushed into the bottle and extracted for 50 min at the same temperature. Immediately thereafter, the fiber was inserted into the gas chromatograph-mass spectrometer (GC-MS) input, and the analyte was thermally desorbed for 3 min at 250 °C. Volatile chemicals were determined by a Shimadzu (Japan) GCMS-QP2010SE machine equipped with a DB-WAX capillary column (60 m × 0.32 mm × 0.25 μm). The desorption duration was 3 min, and the input temperature was 250 °C. The split ratio was 20:1 with a constant flow rate of 1.0 mL/min of helium carrier gas. The temperature protocol was as follows: 40 °C for 5 min, then increased to 220 °C at 5 °C/min and maintained for 5 min. The ion source temperature, interface temperature, EI ionization mode, and mass range were all adjusted to 250 °C, 200 °C, 70 ev, and 40–500 m/z, respectively, for MS parameters. The compounds were identified by comparing mass spectra to the NIST05 spectral database.

2.4. DNA Extraction, PCR Amplification and Illumina MiSeq Sequencing

Microbial community genomic DNA was extracted from 33 daqu samples using the E.Z.N.A.® soil DNA Kit (Omega Bio-tek, Norcross, GA, USA) according to the manufacturer’s instructions. The DNA extract was checked on 1% agarose gel, and the DNA concentration and purity were determined with a NanoDrop 2000 UV-vis spectrophotometer (Thermo Scientific, WA, USA). The hypervariable region V3-V4 of the bacterial 16S rRNA gene and the ITS regions of fungal rRNA gene were amplified with the primer pairs 338F/806R and ITS1F/ITS2R, respectively, by an ABI GeneAmp® 9700 PCR thermocycler (ABI, San Francisco, CA, USA). The PCR amplification of 16S rRNA genes was performed as follows: initial denaturation at 95 °C for 3 min, followed by 29 cycles of denaturing at 95 °C for 30 s, annealing at 53 °C for 30 s and extension at 72 °C for 45 s, a single extension at 72 °C for 10 min, and ending at 10 °C. The PCR amplification of ITS regions of fungal genes were performed as follows: initial denaturation at 95 °C for 3 min, followed by 35 cycles of denaturing at 95 °C for 30 s, annealing at 55 °C for 30 s and extension at 72 °C for 45 s, a single extension at 72 °C for 10 min, and ending at 10 °C. The PCR mixtures contained 5 × TransStart FastPfu buffer 4 μL, 2.5 mM dNTPs 2 μL, forward primer (5 μM) 0.8 μL, reverse primer (5 μM) 0.8 μL, TransStart FastPfu DNA Polymerase 0.4 μL, BAS 0.2 μL, template DNA 10 ng, and finally ddH2O up to 20 μL. PCR reactions were performed in triplicate. The PCR products were extracted from 2% agarose gel and purified using the AxyPrep DNA Gel Extraction Kit (Axygen Biosciences, Union City, CA, USA) according to the manufacturer’s instructions and quantified using a Quantus™ Fluorometer (Promega, Madison, WI, USA).
Purified amplicons were pooled in equimolar and paired-end sequenced on an Illumina MiSeq PE300 platform/NovaSeq PE250 platform (Illumina, San Diego, CA, USA) according to the standard protocols by Majorbio Bio-Pharm Technology Co., Ltd. (Shanghai, China).

2.5. Processing of Sequencing Data

The raw paired-end reads were demultiplexed, quality-filtered by fastp version 0.20.0 [13], and merged by FLASH version 1.2.7 [14] with the following criteria. (i) The 300-bp reads were truncated at any site receiving an average quality score of <20 over a 50-bp sliding window, the truncated reads shorter than 50 bp were discarded, and reads containing ambiguous characters were also discarded. (ii) Only overlapping sequences longer than 10 bp were assembled according to their overlapped sequences. The maximum mismatch ratio of overlap region was 0.2. Reads that could not be assembled were discarded. (iii) Regarding exact matching of barcodes, primers were allowed two mismatches, and reads containing ambiguous characters are removed; operational taxonomic units (OTUs) with 97% similarity cutoff [15,16] were clustered using UPARSE version 7.1 [15], and chimeric sequences were identified and removed. The taxonomy of each OTU representative sequence was analyzed by RDP Classifier version 2.2 [17] against the 16S rRNA database Silva (Release138) an ITS rRNA database (unite 8.0) using a confidence threshold of 0.7.

2.6. Statistical Analysis and Visualization

The indices of α diversity, ACE, Chao1, and Shannon indices, were calculated using mothur (version v.1.30.2). Venn diagrams were constructed to visualize the shared and unique volatile metabolites among daqu samples using a free online website (http://www.ehbio.com/test/venn/#/ (accessed on 2 July 2023)). Heatmaps illustrating the variation of gene abundances were produced using TBtools 0.665. β diversity was analyzed using principal coordinate analysis (PCoA) on the basis of the UniFrac distance using an unweighted algorithm. Biomarkers were predicted in the two types of daqu with R (version 3.3.1) using the randomForest package. Co-occurrence network visualization between microorganisms was performed using the Gephi program (version 0.9.2). Spearman’s rank correlation analysis was performed using the R package Hmisc to investigate the interactions between the main microbial genera and the main volatile compounds. Using the R vegan package, redundancy analysis was used to investigate the relationship of samples with physicochemical indices and enzymatic indicators [18]. The rfPermute package was used to assess the main predictors of changes in the physicochemical properties of the two types of daqu [19]. Phylogenetic Investigation of Communities by Reconstruction of Unobserved States II (PICRUST II) was used to predict the microbial community function and pathway enrichment of metabolites based on the Kyoto Encyclopedia of Genes and Genomes (KEGG) database [20]. Bubble plots demonstrating the interactions between the key functional enzymes and taxa were generated using R, with ggplot2.

3. Results

3.1. Temporal Changes in Physicochemical Characteristics and Enzymatic Activities of Daqu during Fermentation

The changes in the physicochemical properties and enzymatic activities of the two types of daqu during fermentation were investigated (Figure S1). The water content of daqu gradually decreased with the extension of fermentation time and stabilized after 20 days in both types of daqu samples (Figure S1A). As for acidity, it increased throughout the fermentation period in both types of daqu. (Figure S1B). Regarding fermenting power (FP), similar change trends for both daqu samples were observed during fermentation, which increased to the maximum on the fifth day and then decreased gradually (Figure S1C). Analysis of the saccharifying power (SP) of daqu showed that SP in A-Daqu grew to its peak value (1006 mg/g·h) on the 10th day and subsequently decreased to its minimum (610 mg/g·h) on the 25th day. M-Daqu showed a similar trend of changes in saccharifying power. However, the saccharifying power of A-Daqu was higher than that of M-Daqu (Figure S1D). The esterifying power (EP) of the two types of daqu differed significantly, with A-Daqu fluctuating up and down during the fermentation phase, whereas M-Daqu had a steady upward tendency (38.24–282.58 mg/25 g·7 d) (Figure S1E). In the first 10 days, the liquefying power (LP) of A-Daqu swiftly rose to the maximum (0.086 g/g·h) and then gradually declined to its lowest point (0.017 g/g·h) on the 40th day. The liquefying power of M-Daqu displayed a consistent upward trend (0.0044–0.028 g/g·h) with a relatively small variation (Figure S1F).

3.2. Analysis of Volatile Compounds

The flavor compounds of the two types of daqu samples at various fermentation stages were identified (Table S1). As shown in Table S1, a total of 97 compounds were detected, comprising 59 esters, 16 alcohols, 7 ketones and 8 aldehydes, 4 acids, 1 aromatic, 1 phenol, and 1 pyrazine. The amount and content of esters in both types of daqu during fermentation accounted for the majority of all flavor substances (Figure 1A,B).
Among the semi-quantified esters, hexadecanoic acid methyl ester, hexanoic acid methyl ester, octanoic acid methyl ester, and hexanoic acid ethyl ester were the dominant esters (Table S1). The Upset diagram shows the number of flavor substances common and specific to each sample, and these specific flavor substances are shown in the Venn networks (Figure 1C,D). There were 21 distinctive flavor substances in A-Daqu, and the contents of which were significantly higher than those in M-Daqu (15). In addition, PCoA showed that the flavor substances could be broadly divided into three groups: A, M, and D0 (p < 0.05). LEfSe analysis was applied to further identify statistically representative flavor substances, with alcohols being enriched in M-Daqu and aldehydes, ketones, and phenols being enriched in D0 (Figure 1F,G). In addition, it was noteworthy that 2,3-butanediol and 2,3-butanediol [R-(R*, R*)] occurred almost exclusively in large quantities at the end of fermentation in M-Daqu. The characteristic volatiles in A-Daqu were hexanoic acid ethyl ester, hexadecanoic acid ethyl ester, etc. Hexanoic acid ethyl ester, an important flavor substance in Nongxiangxing baijiu, was also detected in the two types of daqu at high levels, with the greatest amount of hexanoic acid ethyl ester occurring at the end of fermentation.

3.3. The Succession of Microbial Community in the Two Types of Daqu

High-throughput sequencing was employed to investigate the succession of microbial community in the two types of daqu. The 33 samples had a range of 32,331–57,908 effective sequences for bacteria and 42,495–90,377 for fungi, respectively (Table S2). The saturation plateau of the rarefaction curves based on OTU numbers revealed that the sequencing depth in our study was suitable to represent the community structure of samples (Figure S2). The total number of shared bacterial genera in all samples was 34, of which 124 genera were unique to A25 (Figure S3A). Vulgatubacter and Gluconobacter, for example, were genera unique to M-Daqu, while Aggregatibacter, Trichococcus, etc., were exclusive genera in A-Daqu (Figure S3C). Figure S3B demonstrates that there were 18 fungal genera shared by M-Daqu and A-Daqu. Species richness was measured using the ACE and Chao1 indices, and species diversity was measured using the Simpson and Shannon indices (Table S3). The lowest bacterial diversity was observed in M30, whereas the maximum was reported in A25. The lowest level of fungal community diversity was discovered in M20, while the most was detected in A5.
The results from temporal profiling of the bacterial community structure of A-Daqu and M-Daqu during fermentation are shown in Figure 2. The top 6 bacterial phyla with an abundance greater than 1% were demonstrated in A-Daqu and M-Daqu (Figure 2A). Both Firmicute and Proteobacteria were the dominant phyla in A-Daqu and M-Daqu. As for fungi, three phyla were detected in A-Daqu and M-Daqu, including Ascomycota, Basidiomycota, and Mucoromycota (Figure 2B). Ascomycota dominated the fungal phyla in both A-Daqu and M-Daqu. On the whole, both A-Daqu and M-Daqu maintained a relatively stable fungal community structure at the phylum level compared to that of bacteria during the fermentation process.
At the genus level, the most predominant bacterial genus in both A-Daqu and M-Daqu was Bacillus (Figure 2C). In A-Daqu, the relative abundance of Bacillus increased sharply to 75.37% on the fifth day, followed by a decrease to 9.31% as fermentation continued. The amounts of Thermoactinomyces, Weissella, and Lactobacillus all rose during the late stage of fermentation (15–40 d). In M-Daqu, Bacillus rose to the maximum value (60.97%) at day 10, then fell to a lesser amount (6.71% for M15), and ultimately returned to a higher value (46.52%) at day 30. Streptococcus, and Thermoactinomyces were discovered in A-Daqu and rarely in M-Daqu. However, Pantoea and Corynebacterium were more prevalent in M-Daqu than in A-Daqu.
The most predominant fungal genera in A-Daqu and M-Daqu were Unclassified_f_Dipodascaceae and Thermomyces, respectively (Figure 2D). The relative abundance of Thermomyces was at a low level until A40 (76.87%). In M-Daqu, the relative abundance of Thermomyces peaked at 85.53% in M10 and then dropped to 28.5% in M30. Compared to Thermomyces, the relative abundance of Thermoascus showed the reverse tendency.

3.4. Divergence of Microbial Communities in Two Types of Daqu Samples

Principal coordinate analysis (PCoA) was performed using the unweighted algorithm based on the genus level to evaluate beta-diversity (β-diversity) in the microbial communities of the A-Daqu and M-Daqu samples (Figure 3). The results demonstrated that the bacterial community profiles could be divided into A-Daqu and M-Daqu groups during fermentation (Figure 3A). As demonstrated in Figure 3A, bacterial communities in M-Daqu samples were more aggregated during the fermentation process, while in A-Daqu, they were more dispersed. As for fungi, fungal community profiles might also be divided into A-Daqu and M-Daqu groups (Figure 3B). Compared to bacterial communities, the fungal communities in both the A-Daqu and M-Daqu groups were more concentrated. In addition, the microbial community of D0 was highly separate from that in other samples, and the composition was clearly distinguishable, consistent with previous studies [21].
The results of PCoA showed that the microbial communities of the two types of daqu during the fermentation process differed significantly and could be clearly distinguished as A-Daqu and M-Daqu. A random forest learning algorithm was used to regress the relative abundance of each microbial genus with respect to the corresponding daqu, and the top eight bacterial genera and top eight fungal genera were obtained as biomarkers to distinguish A-Daqu from M-Daqu based on importance values > 2 of the microbial genera (Figure 3C,D). Among them, bacterial genera belonged to Proteobacteria and Firmicutes (Figure 3E), while the fungal genera were classified as Basidiomycota and Ascomycota (Figure 3F). Among the two types of daqu, the relative abundance of Pantoea, Kosakonia, and Staphylococcus was higher in M-Daqu, and conversely, A-Daqu had greater relative abundances of Acinetobacter, Streptococcus, and Thermoactinomyces. On the other hand, the relative abundance of all seven genera, except Thermomyces, was lower in M-Daqu than that of the corresponding genera in A-Daqu.

3.5. Interaction Network between Microbial Communities and Volatile Compounds in Daqu

Spearman’s correlation analysis (p < 0.05) between the top 20 volatiles and dominant microorganisms, including the top 10 fungal and top 10 bacterial genera in relative abundance, was conducted, aiming to clarify their relationship and to obtain more meaningful information (Figure 4). In A-Daqu, Lactobacillus and Theromactinomyces were positively correlated with almost all the flavor substances (Figure 4A). Pantoea, Weissella, Saccharopolyspora, and Lactobacillus were positively correlated with hexanoic acid ethyl ester and hexanoic acid butyl ester. The bacteria Pantoea, Weissella, Saccharopolyspora, and Thermomyces were positively connected to hexanoic acid, an exclusive flavor component in A-Daqu. In M-Daqu, Aspergillus and Thermoascus were positively correlated with almost all flavor substances (Figure 4B). 2,3-butanediol, [R-R*, R*] was a flavor substance distinctive to M-Daqu, which was positively correlated with Aspergillus and Thermoascus.

3.6. Microbial Interactions and Correlation between Microbial Communities and Physicochemical Properties

To elucidate the interactions between microbial communities during the fermentation of the two types of daqu, we explored the co-occurrence and co-exclusion patterns of microbial communities based on Spearman’s rank correlation (|ρ| > 0.6 and p < 0.05) (Figure 5A,B). A total of 50 nodes and 117 edges were obtained in the 50 dominant genera, including the top 25 fungal and top 25 bacterial genera in relative abundance in A-Daqu and 50 nodes and 184 edges in the 50 dominant genera in M-Daqu. In A-Daqu, microbial interactions were overwhelmingly positively correlated (99.15%), except for Bacillus and Lactococcus, which showed a negative correlation (Figure 5A). In M-Daqu, positive correlations reached 96.2%, with Bacillus showing negative correlations with Pseudomonas and Lactococcus showing negative correlations with Pantoea, different from the reciprocal relationships presented by Bacillus in A-Daqu (Figure 5B). Comparing the two types of daqu, there were more edges of microbial networks in M-Daqu than in A-Daqu, indicating that the interactions between microorganisms in M-Daqu were closer.
The correlations between six physicochemical properties and the top 15 bacteria and top 15 fungi in relative abundance were investigated by redundancy analysis (Figure 5C,D). Lactobacillus, Weissella, and Leucanostoc were positively correlated with acidity (Figure 5C). Bacillus, Streptococcus, Hyphopichia, and Wickerhamomyces were positively correlated with FP, SP, EP, and LP (Figure 5D). In addition, the results also revealed that LP and acidity were the key determinants representing the changes in microbial taxa during fermentation of A-Daqu, whereas M-Daqu was determined by water content.

3.7. Factors Contributing to the Differences in the Microbial Communities and Physicochemical Properties of the Two Daqu

The Mantel test was employed to further investigate the relationship between biomarkers and other microorganisms in the microbial community and to clarify the factors responsible for differences in the microbial community in the two types of daqu during fermentation. As shown in Figure 5E, the bacterial biomarkers were correlated with Bacillus (r = 0.2, p < 0.01), Pediococcus (r = 0.21, p < 0.01), and Fusobacterium (r = 0.27, p < 0.01). On the other hand, the fungal biomarkers were correlated with Bacillus (r = 0.17, p < 0.01), Pediococcus (r = 0.22, p < 0.01), and Kocuria (r = 0.29, p < 0.01). Figure 5F suggested that the bacterial biomarkers were correlated with Thermoascus (r = 0.28, p < 0.01), Fusarium (r = 0.2, p < 0.01), Wallemia (r = 0.23, p < 0.01), and Diutina (r = 0.24, p < 0.01) Furthermore, the fungal biomarkers were correlated with Fusarium (r = 0.4, p < 0.01), Alternaria (r = 0.31, p < 0.01), Epicoccum (r = 0.36, p < 0.01), and Wallemia (r = 0.36 p < 0.01). The results showed that both fungi and bacteria were almost always significantly associated with fungal and bacterial biomarkers. Therefore, we hypothesized interactions between biomarkers and other microorganisms, and the results indicated that microorganisms interacted with biomarkers and influenced the abundance of biomarkers, thus leading to the differences in the microbial community structures in the two types of daqu.
Differences in microbial communities may cause discrepancies in the physicochemical properties between the two types of daqu, so PCoA was used to analyze the disparities in physicochemical properties between the two types of daqu. The results showed that there were significant differences in the physicochemical properties (Figure S4). Therefore, we further investigated the factors responsible for the differences in physicochemical properties. Spearman’s correlation test was used to investigate the relationship between each biomarker and the physicochemical properties (Figure 5G,H). Most of the bacterial and fungal biomarkers were significantly correlated with these properties. In addition, random forest analysis was used to identify the main factors influencing the changes in the physicochemical properties of daqu during fermentation (Figure 6). In A-Daqu (Figure 6A,B), Thermoactinomyces, Thermomyces, and Hyphopichia were important factors in explaining water content variation, while Aquabacterium and Hyphopichia were important factors in explaining the changes in acidity and EP. Streptococcus and Apiotrichum had high MSE values and played major roles in explaining FP. Pantoea and Hyhopichia were important factors that explained the change in LP. Finally, Streptococcus and Hyphopichia were important factors in explaining SP. As for M-Daqu (Figure 6C,D), Thermoactinomyces, Aquabacterium, Thermomyces, and Apiotrichum were essential factors in explaining water content, acidity, and EP. Thermomyces and Apiotrichum were factors important in explaining FP. Kosakonia, Streptococcus, and Hyphopichia were important factors in explaining SP. Thus, the variations in physicochemical properties in the two types of daqu were mainly caused by Thermoactinomyces, Aquabacterium, Streptococcus, Thermomyces, and Hyphopichia.

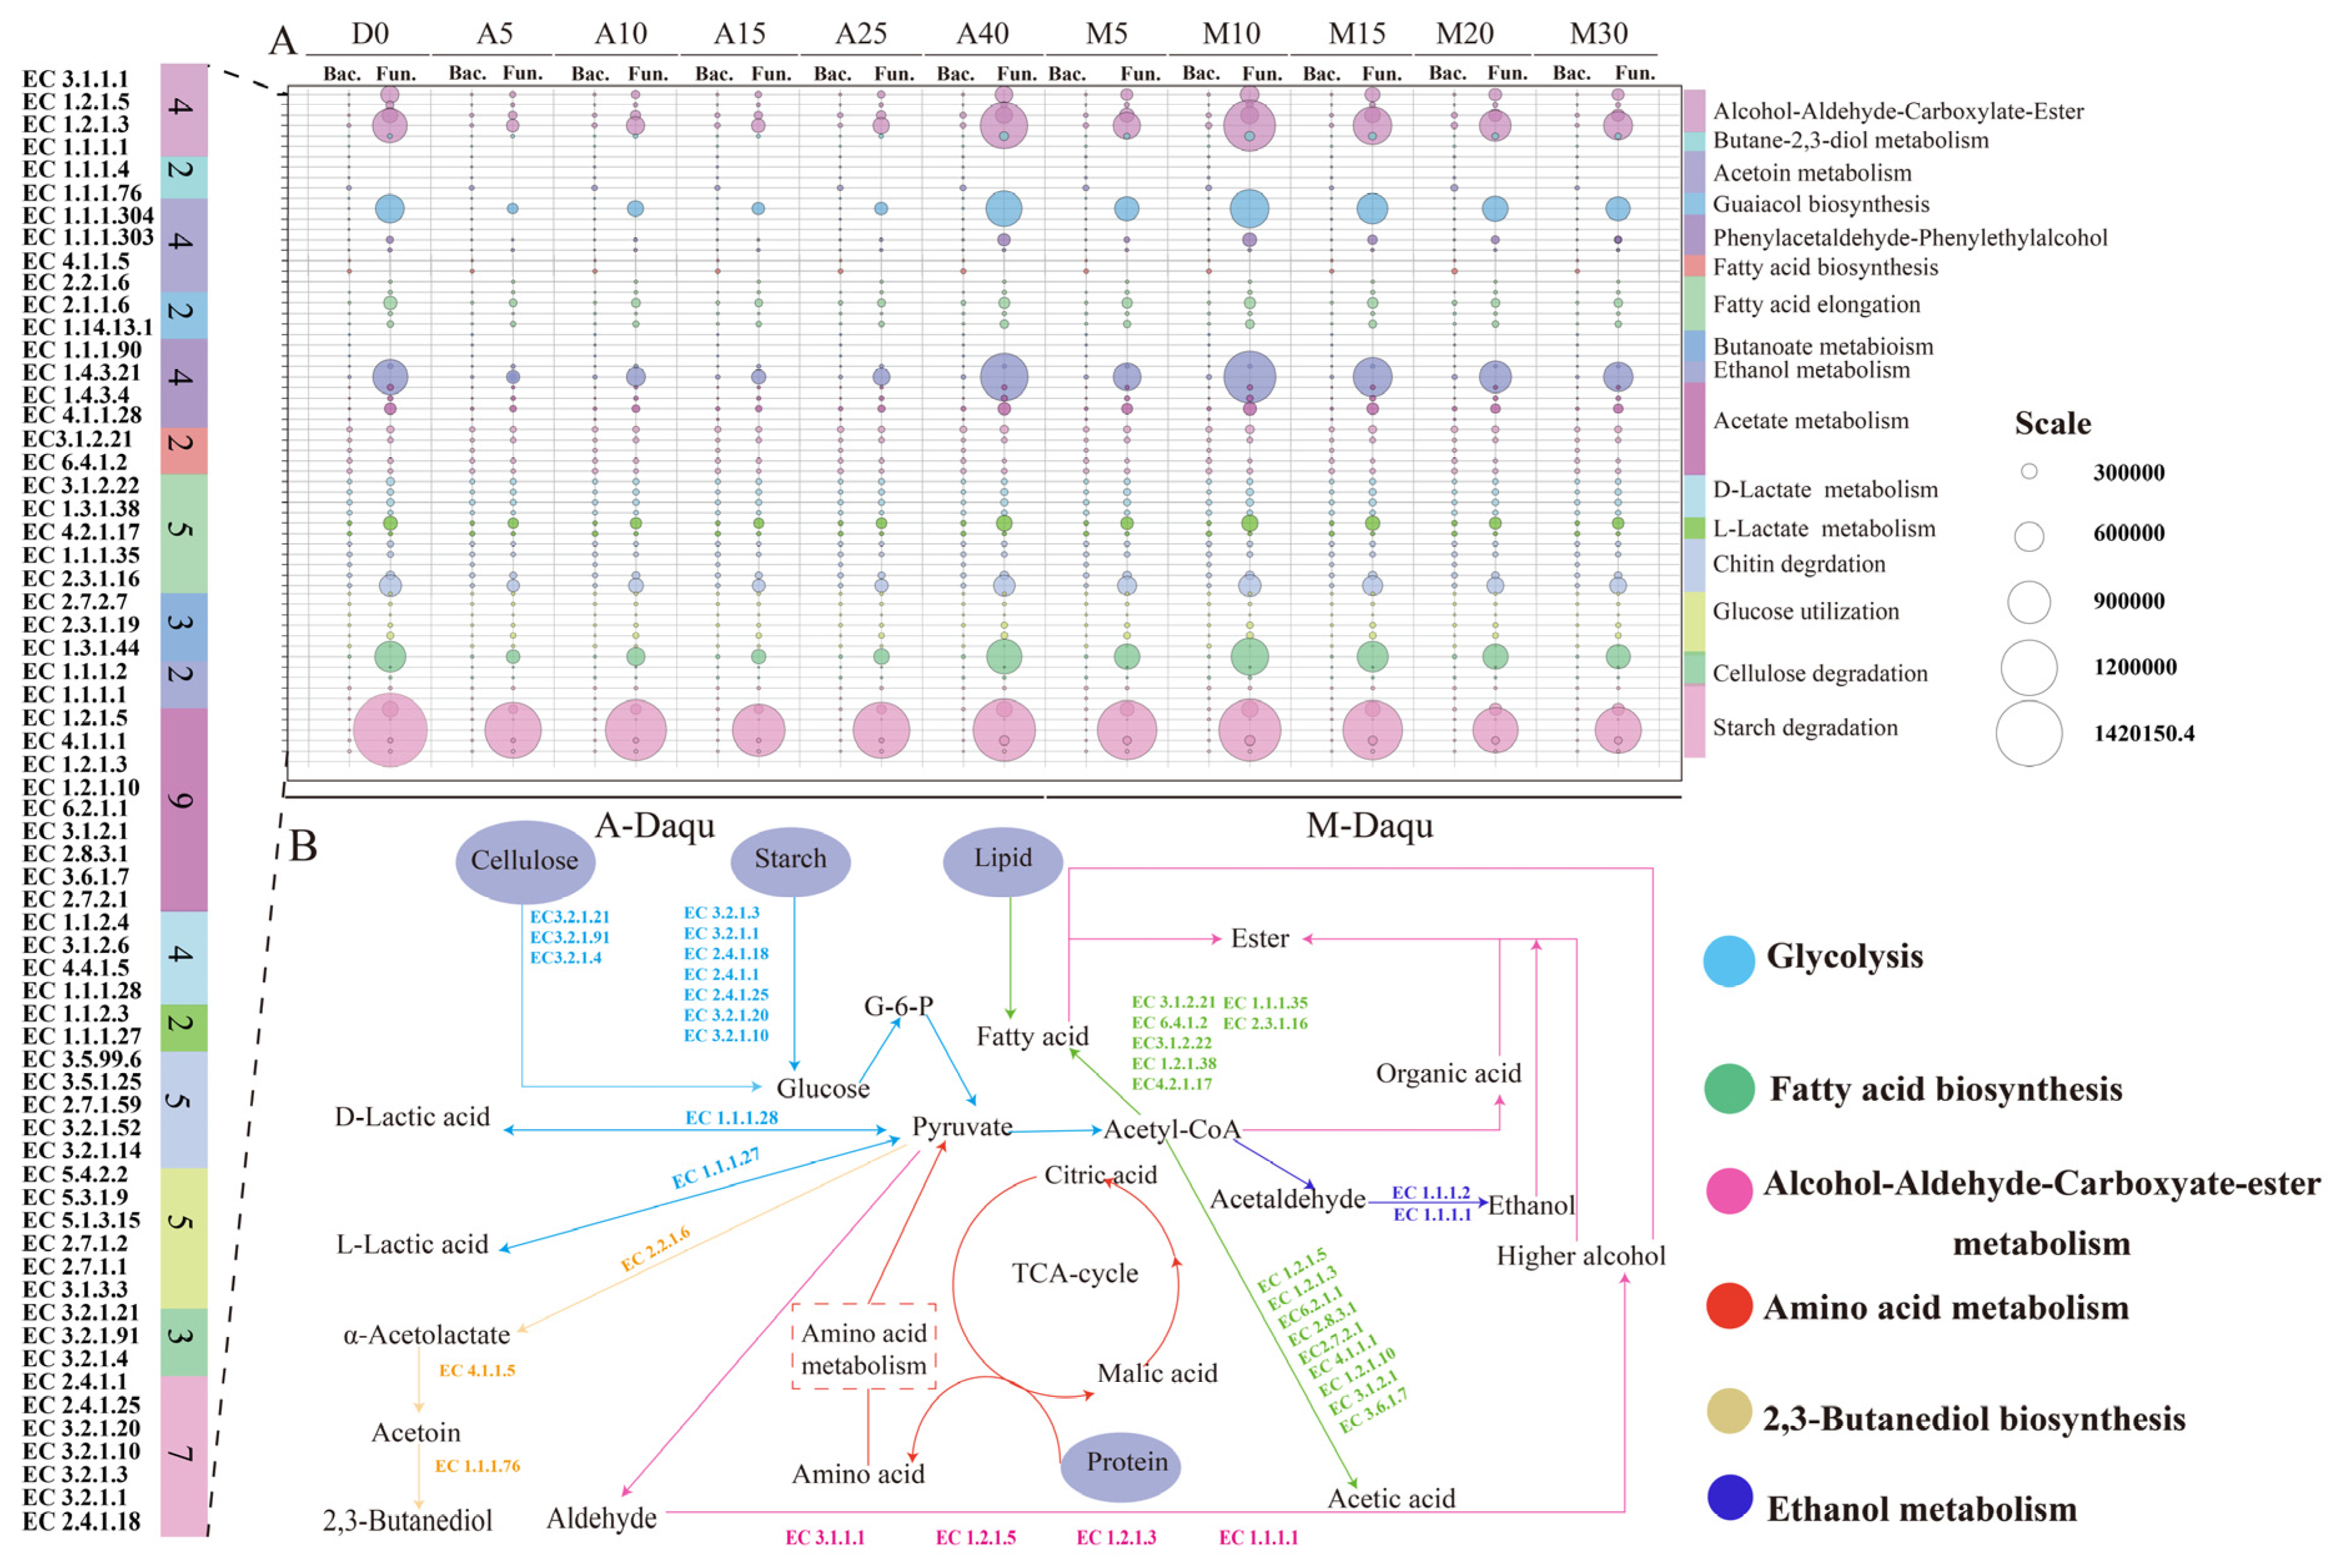
3.8. Prediction of the Microbial Functions in Daqu

The results of PICRUSt2 based on 16S rRNA and ITS sequencing data were used to predict the interconnections between the two types of daqu and specific functional enzymes during fermentation. We selected 64 enzymes from the KEGG database that were potentially involved in substrate degradation and flavor formation in the two types of daqu and then categorized them into 16 functional components (Figure 7A). The abundance of enzymes related to starch catabolism, ethanol metabolism, and ethanol aldehyde-carboxylate metabolism were high during the fermentation process in both types of daqu. In addition, the relative abundance of these enzymes in M-Daqu was generally higher than that in A-Daqu, and these enzymes were almost exclusively secreted by the fungi. Among them, the glucan 1,4-alpha-glucosidase (EC 3.2.1.3), the dominant enzyme related to starch catabolism, had the highest abundance in both types of daqu. Starch was broken down into glucose by the action of enzymes (EC 3.2.1.3, EC 3.2.1.133, EC 3.2.1.1) and further metabolized via the glycolytic pathway to produce pyruvate, which was then converted as a precursor substance to form organic acids (Figure 7B). Additionally, alcohol dehydrogenase (EC 1.1.1.1), which is the main enzyme involved in the metabolism of ethanol and ethanol aldehyde-carboxylate, converts pyruvate into acetaldehyde and ethanol in the absence of oxygen. As shown in Table S1, the contents of 2,3-butanediol and other higher alcohols in M-Daqu were higher than those in A-Daqu. It is noteworthy that the abundance of enzymes (EC 2.2.2.6, EC 4.1.1.5, EC 1.1.1.76, EC 3.1.1.1, EC1.1.1.1, and so on) associated with 2,3-butanedione biosynthesis and higher alcohol formation were indeed greater in M-Daqu than in A-Daqu (Figure 7).

4. Discussion

This study compared the microbial community structure, flavor, and microbial functions between two different types of Nongxiangxing daqu, and it revealed the factors that caused differences in microbial communities and physicochemical properties between the two types of daqu. Then, the microbial interactions and functions of daqu were elucidated based on high throughput sequencing.
The physicochemical characteristics of daqu are commonly used as a benchmark for evaluating the quality of daqu, and variations in the physicochemical properties are related to the microbial composition of daqu. The acidity of the two types of daqu increased with time during fermentation, and similar results were also reported by Guan et al. (2019) [9]. At the same time, the relative abundance of Lactobacillus increased with time (Figure 2C,D). In addition, RDA results also showed that the relationship between acidity and Lactobacillus, Weissella, and Leucanostoc was positively correlated with COS > 0 (Figure 5C). The fermenting power of daqu was mainly positively correlated with Wickerhamomyces and Leuconostoc (Figure 5C,D), consistent with previous studies [9,22] The sudden increase in saccharifying power after 20 and 25 days of fermentation for M-Daqu and A-Daqu, respectively, may be ascribed to the increased relative abundance of the glycosylase-producing strain Thermoascus at the corresponding times [23] (Figure 2). Liquefying power reflects the ability of daqu to decompose starch, and Bacillus was reported to be the main contributor to starch degradation by secreting starch degrading enzymes, such as alpha-amylase [24]. Meanwhile, samples A10 and M10 showed higher liquefying power and higher relative abundance of Bacillus compared to other daqu samples (Figure S1F and Figure 2). RDA also showed that Bacillus was positively correlated with saccharifying power and liquefying power (Figure 5C), consistent with Shi et al. (2021) [25].
To further investigate the difference in microbial community in two types of daqu during fermentation, combined Illumina MiSeq sequencing and bioinformatic analysis was performed. The results demonstrated that Firmicutes and Proteobacteria were the dominant bacterial phyla in both A-Daqu and M-Daqu, and similar results were also reported by previous research [22,26].The dominant bacterial genera identified in both types of daqu in this study were Bacillus, Lactobacillus, and Weissella, which were often detected in previous research in high- and medium-temperature daqu [27,28]. In addition, Saccharopolyspora and Thermoactinomyces were the dominant bacterial genera in A-Daqu, and Pantoea, Staphylococcus, Leuconostoc, and Pediococcus were the dominant bacterial genera in M-Daqu. Thermoactinomyces was regarded as a biomarker and a facilitator of changes in physicochemical properties in this study (Figure 3C and Figure 6). In addition, it was suggested that Thermoactinomyces may play important roles in maintaining flavor diversity and community balance [29]. Pantoea and Staphylococcus, which served as biomarkers to distinguish A-Daqu from M-Daqu in this study (Figure 3C), were susceptible to carbon dioxide, water content, and acidity [30]. Of these genera, Pantoea was almost exclusively present in M-Daqu and had the highest relative abundance on the fifth day of fermentation (Figure 2C). Previous research has indicated that Pantoea was present in large quantities only in the early stages of daqu fermentation [31], and it was reported to be involved in lipid synthesis during the fermentation of daqu, producing low-molecular weight lipopolysaccharides [32,33]. Pantoea promotes the conversion of sulfur-containing compounds into less volatile sulfur-containing amino acids [34].The Staphylococcus in daqu may result from the raw material wheat of daqu [35]. It was inferred that the Staphylococcus may mainly originate from raw wheat and may be affected by the microenvironment in M-Daqu because of inconsistencies in the looseness of M-Daqu compared with A-Daqu, resulting in inconsistent succession patterns of Staphylococcus in the two types of daqu. In addition, the formation of aromatic chemicals by Staphylococcus, including 3-methyl-1-butanol, and diacetyl,2-butanone, may be crucial in the brewing of baijiu [36].
In this study, the dominant eukaryotic microorganisms identified in both types of daqu were Thermomyces, and Thermoascus, which are also considered to be the central microorganisms in the synthesis of ethyl caproate during baijiu brewing [5,37]. Among them, Thermoascus is also a biomarker of Nongxiangxing Daqu in Sichaun [38].In addition, four dominant eukaryotes were found in A-Daqu samples, namely Hyphopichia, Wickerhamomyces, and Saccharomycopsis. Aspergillus and Rhizopus were the dominant eukaryotic microorganisms in M-Daqu. Aspergillus is an important functional fungal genus in daqu due to its ability to secrete acid- and ethanol-resistant extracellular enzymes, such as saccharifying enzyme [39,40,41]. Rhizopus can produce lipase and amylase, which can break down protein and starch into sugar and amino acids and contribute particularly to the flavor of Chinese baijiu [42]. Figure 2 demonstrates that the relative abundance of Hyphopichia in A-Daqu was high during the first 10 days of fermentation, which may be related to its thermal stability [43]. When A-Daqu were pressed, more microorganisms in air, such as Saccharomycopsi, remain in the daqu due to multiple stepping. This fact may be why Saccharomycopsis was the dominant genus in A-Daqu rather than M-Daqu. In addition, Du et al. (2019) [31] suggested that Saccharomycopsis in daqu may originate from the air.
The types and contents of volatiles in the two types of daqu increased with fermentation time, consistent with previous studies [5]. Spearman’s correlation analysis indicated that ester compounds were positively correlated with lactic acid bacteria in A-Daqu (Figure 4). Jin et al. (2019) [5] suggested that Lactobacillales (Enterococcus, Pediococcus, Lactobacillus) was also involved in the formation of methyl and ethyl esters. In the case of M-Daqu, the esters were positively correlated with Aspergillus, consistent with previous studies [22]. Ketones were mainly detected in A-Daqu, with 2-octanone being the most abundant (Table S1). Benzaldehyde dominated the aldehydes, and it was only found in the M-Daqu and was positively correlated with Thermoascus and Weissella (Figure 4B). Moreover, there were significant differences in the alcohols, particularly 2,3-butanediol and 2,3-butanediol, [R-(R*, R*)], which occurred almost exclusively in the later stages of M-Daqu fermentation. In general, Weissella, Bacillus, Lactobacillus, and Staphylococcus were the main contributors to the production of 2,3-butanediol [29]. In addition, 2,3-butanediol can also be considered one of the biomarkers reflecting the growth of Bacillus [37]. However, in this study, in addition to Bacillus in M-Daqu, which was positively correlated with 2,3-butanediol, Aspergillus was also positively correlated with 2,3-butanediol (Figure 4B). The abundance of enzymes involved in the synthesis of 2,3-butanediol was significantly higher in M-Daqu than that in A-Daqu (EC 2.2.1.6, EC 4.1.1.5 and EC 1.1.1.76), probably due to the higher abundance of Bacillus and Aspergillus (Figure 7A). Functional predictions of the enzymes in daqu showed that the main enzymes in the two types of daqu were glucan 1,4-α-glucosidase (EC 3.2.1.3), alcohol dehydrogenase (EC 1.1.1), and β-glucosidase (EC 3.2.1.21). In addition, the abundance of these enzymes was higher in M-Daqu than in A-Daqu, which was inconsistent with the enzyme activities measured in Figure S1. This finding may be ascribed to the inactivation of enzyme-producing microbes during fermentation, with the DNA still retained in the samples [29].

5. Conclusions

In summary, the physicochemical characteristics, microbial community structure, and volatiles of the two types of Nongxiangxing daqu were investigated during the fermentation process. The results showed that the different production methods led to heterogeneity in the physicochemical properties, microbial community structure, and flavor metabolites of the daqu. During fermentation, the enzyme activities of A-Daqu were generally higher than those of M-Daqu. The predominant bacterial and fungal genera in A-Daqu were Saccharopolyspora, Streptococcus, Hyphopichia, Wickerhamomyces, Saccharomycopsis, and so on, while Pantoea, Staphylococcus, Leuconostoc, Aspergillus, and Rhizopus predominated in M-Daqu. Among these microbes, Pantoea, Staphylococcus, Thermoactinomyces, and Thermomyces were the biomarkers with highly important values to distinguish the two types of daqu. Thermoactinomyces, Aquabacterium, Streptococcus, Thermomyces, and Hyphopichia were the main factors contributing to differences in physicochemical properties between the two types of daqu. However, the factors that contributed to microbial differences were complex, and further investigation is needed. Benzaldehyde and 2,3-butanediol, [R-(R*, R*)] were only detected in large amounts in M-Daqu. The bacterial community in M-Daqu showed higher potential for 2,3-butanediol and 2,3-butanediol [R-(R*, R*)] synthesis. Hexanoic acid, phenylethyl alcohol, and pyrazine tetramethyl, on the other hand, were only present in A-Daqu. In conclusion, our work may contribute to understand the impacts of different pressing patterns on daqu as well as the distinctions between the two types of daqu. Additionally, it helps to screen functional microorganisms from A-Daqu and apply them to M-Daqu to reduce the quality differences between the two types of daqu, thus improving the quality of M-Daqu and providing a scientific basis for the optimization of the daqu production process.

Supplementary Materials

The following supporting information can be downloaded at: https://www.mdpi.com/article/10.3390/foods12132603/s1, Figure S1: Dynamics of physicochemical and enzymatic characteristics during the fermentation of daqu; Figure S2: Rarefaction curve for bacteria (A) and fungi (B) in two types of daqu samples based on the observed species; Figure S3: Shared and unique microbial taxa across the two types of daqu; Figure S4: Principal coordinate analysis (PCoA) of the physicochemical properties in two types of daqu during fermentation; Table S1: Main flavor substances detected in daqu during fermentation; Table S2: High quality sequencing based on 16S rRNA and ITS sequencing; Table S3: Differences in α-diversity indices for microbial communities based on 16S rRNA and ITS sequencing.

Author Contributions

Conceptualization, P.H., Y.J., M.L., L.P., G.Y., Z.L., D.J., J.Z., R.Z. and C.W.; methodology, Y.J., M.L., L.P., G.Y., Z.L., D.J., J.Z., R.Z. and C.W.; software, P.H.; validation, P.H. and C.W.; formal analysis, C.W.; investigation, C.W.; resources, C.W.; data curation, P.H.; writing—original draft preparation, P.H.; writing—review and editing, Y.J., M.L., L.P., G.Y., Z.L., D.J., J.Z., R.Z. and C.W.; visualization, P.H.; supervision, Y.J., M.L., L.P., G.Y., Z.L., D.J., J.Z., R.Z. and C.W.; project administration, C.W.; funding acquisition, C.W. and J.Z. All authors have read and agreed to the published version of the manuscript.

Funding

This research was funded by the Key Research and Development Project of Sichuan Province (2023YFS0450) and the Sichuan University-Luzhou Cooperation Project (2021CDLZ-19).

Data Availability Statement

Data presented in this study are available upon request from the corresponding author upon reasonable request.

Acknowledgments

This work was supported by the Key Research and Development Project of Sichuan Province (2023YFS0450) and the Sichuan University-Luzhou Cooperation Project (2021CDLZ-19).

Conflicts of Interest

L.P., Z.L., and D.J. were employed by the company Xufu Yibin. The remaining authors declare that the research was conducted in the absence of any commercial or financial relationships that could be construed as potential conflicts of interest. We declare that the present work does not have any commercial or associative interest that represents a conflict of interest in connection with the company Sichuan Yibin Xufu Liquor Co., Ltd., Yibin, 644000, China.

References

  1. Fan, G.; Fu, Z.; Sun, B.; Zhang, Y.; Wang, X.; Xia, Y.; Huang, M.; Li, X. Roles of aging in the production of light-flavored Daqu. J. Biosci. Bioeng. 2019, 127, 309–317. [Google Scholar] [CrossRef] [PubMed]
  2. Wu, C.; Deng, J.; He, G.; Zhou, R. Metaproteomic Characterization of Daqu, a Fermentation Starter Culture of Chinese Liquor. J. Proteom. Bioinform. 2016, 9, 49–52. [Google Scholar] [CrossRef] [Green Version]
  3. Liu, J.; Chen, J.; Fan, Y.; Huang, X.; Han, B. Biochemical characterisation and dominance of different hydrolases in different types of Daqu—A Chinese industrial fermentation starter. J. Sci. Food Agric. 2018, 98, 113–121. [Google Scholar] [CrossRef] [PubMed]
  4. Zou, W.; Zhao, C.; Luo, H. Diversity and Function of Microbial Community in Chinese Strong-Flavor Baijiu Ecosystem: A Review. Front. Microbiol. 2018, 9, 671. [Google Scholar] [CrossRef] [Green Version]
  5. Jin, Y.; Li, D.; Ai, M.; Tang, Q.; Huang, J.; Ding, X.; Wu, C.; Zhou, R. Correlation between volatile profiles and microbial communities: A metabonomic approach to study Jiang-flavor liquor Daqu. Food Res. Int. 2019, 121, 422–432. [Google Scholar] [CrossRef]
  6. Ma, S.; Luo, H.; Zhao, D.; Qiao, Z.; Zheng, J.; An, M.; Huang, D. Environmental factors and interactions among microorganisms drive microbial community succession during fermentation of Nongxiangxing daqu. Bioresour. Technol. 2022, 345, 126549. [Google Scholar] [CrossRef]
  7. Zheng, X.-W.; Tabrizi, M.R.; Nout, M.J.R.; Han, B.-Z. Daqu—A Traditional Chinese Liquor Fermentation Starter. J. Inst. Brew. 2011, 117, 82–90. [Google Scholar] [CrossRef]
  8. Jiang, S.; Qiu, S.; Zou, J.; Chen, L.; Luo, X.; Wang, X. Preliminary studies on yeasts from sauce-flavor Daqu made by traditional and mechanical methods. China Brew. 2017, 36, 59–65. [Google Scholar]
  9. Guan, T.; Yang, H.; Ou, M.; Zhang, J. Storage period affecting dynamic succession of microbiota and quality changes of strong-flavor Baijiu Daqu. LWT Food Sci. Technol. 2020, 139, 110544. [Google Scholar] [CrossRef]
  10. Wang, J.; Zhong, Q.; Yang, Y.; Li, H.; Wang, L.; Tong, Y.; Fang, X.; Liao, Z. Comparison of Bacterial Diversity between Two Traditional Starters and the Round-Koji-Maker Starter for Traditional Cantonese Chi-Flavor Liquor Brewing. Front. Microbiol. 2018, 9, 1053. [Google Scholar] [CrossRef] [Green Version]
  11. Wang, X.-D.; Qiu, S.-Y.; Li, P.; Ban, S.-D. Analysis of Microbial Community Structure in Traditional and Automated Moutai-Flavor Daqu. J. Am. Soc. Brew. Chem. 2019, 77, 140–146. [Google Scholar] [CrossRef]
  12. QB/T 4257 2011; Ministry of Industry and Information Technology of the People’s Republic of China, General analysis method of brewing Daqu (QB/T4257 2011). China Light Industry Press: Beijing, China, 2011.
  13. Chen, S.; Zhou, Y.; Chen, Y.; Gu, J. fastp: An ultra-fast all-in-one FASTQ preprocessor. Bioinformatics 2018, 34, i884–i890. [Google Scholar] [CrossRef]
  14. Magoč, T.; Salzberg, S.L. FLASH: Fast length adjustment of short reads to improve genome assemblies. Bioinformatics 2011, 27, 2957–2963. [Google Scholar] [CrossRef] [PubMed] [Green Version]
  15. Edgar, R.C. UPARSE: Highly accurate OTU sequences from microbial amplicon reads. Nat. Methods 2013, 10, 996–998. [Google Scholar] [CrossRef] [PubMed]
  16. Stackebrandt, E.; Goebel, B. Taxonomic note: A place for DNA-DNA reassociation and 16S rRNA sequence analysis in the present species definition in bacteriology. Int. J. Syst. Evol. Micr. 1994, 44, 846–849. [Google Scholar] [CrossRef] [Green Version]
  17. Wang, Q.; Garrity, G.M.; Tiedje, J.M.; Cole, J.R. Naïve Bayesian Classifier for Rapid Assignment of rRNA Sequences into the New Bacterial Taxonomy. Appl. Environ. Microbiol. 2007, 73, 5261–5267. [Google Scholar] [CrossRef] [Green Version]
  18. Legendre, P.; Anderson, M.J. Distance-Based Redundancy Analysis: Testing Multispecies Responses in Multifactorial Ecological Experiments. Ecol. Monogr. 1999, 69, 512. [Google Scholar] [CrossRef]
  19. Jiao, S.; Chen, W.; Wang, J.; Du, N.; Li, Q.; Wei, G. Soil microbiomes with distinct assemblies through vertical soil profiles drive the cycling of multiple nutrients in reforested ecosystems. Microbiome 2018, 6, 146. [Google Scholar] [CrossRef] [Green Version]
  20. Langille, M.G.I.; Zaneveld, J.; Caporaso, J.G.; McDonald, D.; Knights, D.; Reyes, J.A.; Clemente, J.C.; Burkepile, D.E.; Vega Thurber, R.L.; Knight, R.; et al. Predictive functional profiling of microbial communities using 16S rRNA marker gene sequences. Nat. Biotechnol. 2013, 31, 814–821. [Google Scholar] [CrossRef] [PubMed]
  21. Mao, J.; Liu, X.; Gao, T.; Gu, S.; Wu, Y.; Zhao, L.; Ma, J.; Li, X.; Zhang, J. Unraveling the correlations between bacterial diversity, physicochemical properties and bacterial community succession during the fermentation of traditional Chinese strong-flavor Daqu. LWT Food Sci. Technol. 2021, 154, 112764. [Google Scholar] [CrossRef]
  22. He, M.; Jin, Y.; Zhou, R.; Zhao, D.; Zheng, J.; Wu, C. Dynamic succession of microbial community in Nongxiangxing daqu and microbial roles involved in flavor formation. Food Res. Int. 2022, 159, 111559. [Google Scholar] [CrossRef] [PubMed]
  23. Fan, G.; Sun, B.; Fu, Z.; Xia, Y.; Huang, M.; Xu, C.; Li, X. Analysis of Physicochemical Indices, Volatile Flavor Components, and Microbial Community of a Light-Flavor Daqu. J. Am. Soc. Brew. Chem. 2018, 76, 209–218. [Google Scholar] [CrossRef]
  24. Yan, S.; Tong, Q.; Guang, J. Yeast dynamics and changes in volatile compounds during the fermentation of the traditional Chinese strong-flavor Daqu. LWT Food Sci. Technol. 2019, 106, 57–63. [Google Scholar] [CrossRef]
  25. Shi, W.; Chai, L.-J.; Fang, G.-Y.; Mei, J.-L.; Lu, Z.-M.; Zhang, X.-J.; Xiao, C.; Wang, S.-T.; Shen, C.-H.; Shi, J.-S.; et al. Spatial heterogeneity of the microbiome and metabolome profiles of high-temperature Daqu in the same workshop. Food Res. Int. 2022, 156, 111298. [Google Scholar] [CrossRef]
  26. Gan, S.-H.; Yang, F.; Sahu, S.K.; Luo, R.-Y.; Liao, S.-L.; Wang, H.-Y.; Jin, T.; Wang, L.; Zhang, P.-F.; Liu, X.; et al. Deciphering the Composition and Functional Profile of the Microbial Communities in Chinese Moutai Liquor Starters. Front. Microbiol. 2019, 10, 1540. [Google Scholar] [CrossRef] [Green Version]
  27. Su, Y.; Yang, L.; Hui, L.; Yuan-Yuan, G.; Ming-Juan, Z.; Chun-Hui, X.; Ling, X.; Chi, C. Bacterial communities during the process of high-temperature Daqu production of roasted sesame-like flavour liquor. J. Inst. Brew. 2015, 121, 440–448. [Google Scholar] [CrossRef]
  28. Tang, J.; Rao, J.; Zou, Y.; Liao, L.; Huang, D.; Luo, H. The community assembly patterns determined differences between the surface and the core microbial communities of Nongxiangxing Daqu. LWT Food Sci. Technol. 2023, 183, 114936. [Google Scholar] [CrossRef]
  29. Yang, Y.; Wang, S.-T.; Lu, Z.-M.; Zhang, X.-J.; Chai, L.-J.; Shen, C.-H.; Shi, J.-S.; Xu, Z.-H. Metagenomics unveils microbial roles involved in metabolic network of flavor development in medium-temperature daqu starter. Food Res. Int. 2021, 140, 110037. [Google Scholar] [CrossRef]
  30. Zhu, M.; Zheng, J.; Xie, J.; Zhao, D.; Qiao, Z.-W.; Huang, D.; Luo, H.-B. Effects of environmental factors on the microbial community changes during medium-high temperature Daqu manufacturing. Food Res. Int. 2022, 153, 110955. [Google Scholar] [CrossRef]
  31. Du, H.; Wang, X.; Zhang, Y.; Xu, Y. Exploring the impacts of raw materials and environments on the microbiota in Chinese Daqu starter. Int. J. Food Microbiol. 2019, 297, 32–40. [Google Scholar] [CrossRef]
  32. Hou, Q.; Wang, Y.; Cai, W.; Ni, H.; Zhao, H.; Zhang, Z.; Liu, Z.; Liu, J.; Zhong, J.; Guo, Z. Metagenomic and physicochemical analyses reveal microbial community and functional differences between three types of low-temperature Daqu. Food Res. Int. 2022, 156, 111167. [Google Scholar] [CrossRef]
  33. Kang, J.; Hu, Y.; Ding, Z.; Ye, L.; Li, H.; Cheng, J.; Fan, L.; Zhao, H.; Han, B.; Zheng, X. Deciphering the Shifts in Microbial Community Diversity from Material Pretreatment to Saccharification Process of Fuyu-Flavor Baijiu. Front. Microbiol. 2021, 12, 2354. [Google Scholar] [CrossRef]
  34. Yang, L.; Chen, R.; Liu, C.; Chen, L.; Yang, F.; Wang, L. Spatiotemporal accumulation differences of volatile compounds and bacteria metabolizing pickle like odor compounds during stacking fermentation of Maotai-flavor baijiu. Food Chem. 2023, 426, 136668. [Google Scholar] [CrossRef] [PubMed]
  35. Zhang, Y.; Xu, J.; Ding, F.; Deng, W.; Wang, X.; Xue, Y.; Chen, X.; Han, B.-Z. Multidimensional profiling indicates the shifts and functionality of wheat-origin microbiota during high-temperature Daqu incubation. Food Res. Int. 2022, 156, 111191. [Google Scholar] [CrossRef]
  36. Zhang, L.; Wu, C.; Ding, X.; Zheng, J.; Zhou, R. Characterisation of microbial communities in Chinese liquor fermentation starters Daqu using nested PCR-DGGE. World J. Microbiol. Biotechnol. 2014, 30, 3055–3063. [Google Scholar] [CrossRef]
  37. Deng, Y.; Huang, D.; Han, B.; Ning, X.; Yu, D.; Guo, H.; Zou, Y.; Jing, W.; Luo, H. Correlation: Between Autochthonous Microbial Diversity and Volatile Metabolites during the Fermentation of Nongxiang Daqu. Front. Microbiol. 2021, 12, 688891. [Google Scholar] [CrossRef] [PubMed]
  38. Zhu, C.; Cheng, Y.; Shi, Q.; Ge, X.; Yang, Y.; Huang, Y. Metagenomic analyses reveal microbial communities and functional differences between Daqu from seven provinces. Food Res. Int. 2023, 172, 113076. [Google Scholar] [CrossRef]
  39. He, M.; Jin, Y.; Liu, M.; Yang, G.; Zhou, R.; Zhao, J.; Wu, C. Metaproteomic investigation of enzyme profile in daqu used for the production of Nongxiangxing baijiu. Int. J. Food Microbiol. 2023, 400, 110250. [Google Scholar] [CrossRef]
  40. Zhao, G.; Liu, C.; Li, S.; Wang, X.; Yao, Y. Exploring the flavor formation mechanism under osmotic conditions during soy sauce fermentation in Aspergillus oryzae by proteomic analysis. Food Funct. 2020, 11, 640–648. [Google Scholar] [CrossRef]
  41. Xu, Y.; Wu, M.; Zhao, D.; Zheng, J.; Dai, M.; Li, X.; Li, W.; Zhang, C.; Sun, B. Simulated Fermentation of Strong-Flavor Baijiu through Functional Microbial Combination to Realize the Stable Synthesis of Important Flavor Chemicals. Foods 2023, 12, 644. [Google Scholar] [CrossRef]
  42. Yang, Y.; Hu, W.; Xia, Y.; Mu, Z.; Tao, L.; Song, X.; Zhang, H.; Ni, B.; Ai, L. Flavor Formation in Chinese Rice Wine (Huangjiu): Impacts of the Flavor-Active Microorganisms, Raw Materials, and Fermentation Technology. Front. Microbiol. 2020, 11, 580247. [Google Scholar] [CrossRef] [PubMed]
  43. Huang, Y.; Yi, Z.; Jin, Y.; Zhao, Y.; He, K.; Liu, D.; Zhao, D.; He, H.; Luo, H.; Zhang, W.; et al. New microbial resource: Microbial diversity, function and dynamics in Chinese liquor starter. Sci. Rep. 2017, 7, 14577. [Google Scholar] [CrossRef] [PubMed] [Green Version]
Figure 1. Comparison of volatile compounds of the two types of daqu samples based on the results of HS−SPME−GC/MS. (A) Variations in the category and number of volatiles. (B) Variations in the relative content of each category. (C) Shared and unique volatile compounds presented by Venn networks. The color of the circles in plot C corresponds to the color of the bars in plot D, reflecting the shared and unique flavors in the sample. (D) The number of shared and unique volatile compounds presented by Upset diagram. (E) Variations in volatile compounds based on principal component analysis of different daqu samples. (F,G) The cladogram and characteristic volatiles of different daqu samples obtained from LEfSe analysis. The red, blue and green nodes indicate microbial taxa that are significantly enriched in D0, A and M groups, respectively, and have a significant effect on the difference between groups. the light yellow nodes indicate microbial taxa that are not significantly different in any of the different groups, or have no significant effect on the difference between groups.
Foods 12 02603 g001
Figure 2. Changes in bacterial (A,C) and fungal (B,D) communities in two types of daqu during fermentation. (A,B) Phylum level; (C,D) genus level. A-Daqu and M-Daqu represent artificially pressed and mechanically pressed daqu, respectively.
Foods 12 02603 g002
Figure 3. The principal coordinates analysis (PCoA) (A,B), biomarkers discrimination (C,D) of the microbial community in two types of daqu samples, and the significance values distribution (E,F) of biomarkers. Dotted circle represent grouped ellipses.PCoA was performed based on bacterial community (A) and fungal community (B) at genus level. As for biomarker analysis, 8 bacterial genera (C) and 8 fungal genera (D) that distinguish A-Daqu from M-Daqu were presented. The bars represent the significance values for bacterial biomarkers (E) and fungal biomarkers (F) estimated by the random forest learning algorithm, and the colours of the bars indicate the classification of the genus at the phylum level.
Foods 12 02603 g003
Figure 4. Interaction network of microbial communities and volatile compounds in A-Daqu (A) and M-Daqu (B).
Foods 12 02603 g004
Figure 5. Interaction network of microbial communities and correlation analysis between physicochemical properties and microbial communities. (A,B) A-Daqu and M-Daqu; (C,D) bacteria and fungi. The Mantel test analysis of the biomarkers and each of other microorganisms. (E,F) bacteria and fungi. Spearman’s correlation between biomarkers and physicochemical properties in two types of daqu samples: (G,H) bacterial and fungal biomarkers. * p < 0.05, ** p < 0.01, *** p < 0.001.
Foods 12 02603 g005
Figure 6. The importance of bacterial (A,C) and fungal (B,D) biomarkers as influencing factors for the occurrence of physicochemical property changes in two types of daqu during fermentation. (A,B) A-Daqu; (C,D) M-Daqu.
Foods 12 02603 g006
Figure 7. Functional prediction of the microorganisms in two types of daqu during fermentation. (A) The abundance and functional classification of the main enzymes in the two types of daqu during fermentation. (B) The primary metabolic pathways involved in the formation of major flavor compounds in the two types of daqu.
Foods 12 02603 g007
Disclaimer/Publisher’s Note: The statements, opinions and data contained in all publications are solely those of the individual author(s) and contributor(s) and not of MDPI and/or the editor(s). MDPI and/or the editor(s) disclaim responsibility for any injury to people or property resulting from any ideas, methods, instructions or products referred to in the content.

