Abstract
The purpose of this work was to evaluate the selected physicochemical, rheological, and sensory properties of a new whey-enriched carrot juice beverage (carrot juice: whey ratios of 100:0; 95:5; 85:15; 75:25; 65:35) fermented with milk or water kefir starter cultures over a storage period of 21 days (at 4 ± 1 °C). In general, for all tested samples, the values of total soluble solids, pH, and density decreased with increasing storage time. In contrast, the values of ethanol, degree of fermentation, and total dissolved solids increased with the prolongation of the storage time. Furthermore, it was found that all the model samples exhibited pseudoplastic behavior. Based on the sensory analysis performed, samples containing 25% (w/w) whey were evaluated as the most acceptable. Last but not least, the present study can serve as a basis for optimizing the manufacturing technology of a novel fermented vegetable beverage enriched with whey.
1. Introduction
In recent years, there has been increasing consumer interest in functional foods containing biologically active substances with possible positive effects on the human body [1]. In general, these types of products are described as functional foods. Additionally, the American Dietetic Association defines functional foods as “foods that are in the form of whole, fortified, enriched, or enhanced foods that provide functional advantages and/or health benefits beyond basic nutrition when consumed at an effective level on a regular basis” [2]. Functional foods include, for example, baby food, cereals, meat products, various spreads, dairy products, and beverages. In addition, even fermented products can be classified as functional foods [3]. Due to (i) consumer demands for container contents, size, shape, and appearance; (ii) ease of distribution and better storage for refrigerated and shelf-stable products; and (iii) numerous opportunities to include desirable nutrients and bioactive compounds, beverages are by far the most active functional food category [4,5].
Carrots (Daucus carota) contain compounds that have been experimentally shown to have anticarcinogenic and immunoactive properties, as well as the ability to maintain an appropriate level of blood sugar, cholesterol, and blood pressure [6]. Carrot juice is growing in popularity due to its balanced organoleptic and nutritional properties. The main benefits include a high content of carotenoids, a variety of vitamins (such as vitamins B1, B2, B6, B9, C, and K), fiber, and antioxidants [7,8].
Whey can be considered a suitable new ingredient for the production of fermented dairy beverages because lactic acid bacteria (LAB) can metabolize it [9,10]. Whey is produced as a by-product of the dairy industry. Furthermore, further use of whey could lead to a sustainable economy since up to 40% of whey is not processed, reducing environmental pollution. Whey is highly digestible and serves as a source of lactose, high-quality complete serum proteins, vitamins, and minerals (especially calcium, magnesium, and phosphorus) [11,12,13]. Furthermore, whey can provide the human body with positive effects, including antioxidant activity, antihypertensive, antidiabetic, or antimicrobial properties, and is therefore considered a suitable ingredient for the production of functional foods [13,14].
Moreover, kefir starter cultures can be used in the production of fermented beverages combined with fruit or vegetable components. Kefir is a frequently consumed beverage, especially in Eastern European and Central Asian countries, and contains significant amounts of protein, prebiotics, and probiotics [15]. The milk kefir grains are small, round, and white and represent a symbiotic microbial ecosystem composed of lactic acid bacteria (LAB), yeast, and a small amount of acetic acid bacteria (AAB) distributed in an exopolysaccharide complex of kefiran. The genera of microorganisms found in milk kefir starter culture include, for example, the genera Lactobacillus, Lactococcus, Leuconostoc, Sacharomyces, and Kluyveromyces [16,17,18].
Another fermentation option is the use of water kefir grains (WKG). WKGs are small, irregularly shaped, and translucent. In particular, WKGs are a symbiotic culture of microorganisms, specifically LAB and acetic acid bacteria (AAB), and yeasts found in a polysaccharide complex called α-glucan. In addition, the matrix can also contain levan [19]. The most prominent genera are Lactobacillus, Acetobacter, Saccharomyces, and other genera that occur simultaneously, but the exact composition is not yet defined. The presence of calcium and magnesium ions is important for the proper multiplication of grains. If these ions are not present, the grains are very small and more susceptible to microbial contamination. Therefore, it is recommended to use calcium-rich fruits or vegetables, including dried figs (162 mg/100 g), apricots (55 mg/100 g) or carrots (33 mg/100 g) [20].
In general, fermented whey beverages combined with fruit juices are primarily manufactured [21]. Therefore, the studies published so far have focused on the production of fermented beverages based on kefir starter cultures (milk or water kefir starter cultures) with the addition of mainly fruit components [22,23,24]. However, to date, there is little information in the available scientific literature on the development and characterization of vegetable beverages enriched with whey and fermented with milk or water kefir starter cultures. Furthermore, the application of water kefir culture for the manufacture of fermented beverages containing whey is scarce. The latter beverages may be suitable for a wide range of consumers due to their possible positive effects on humans. In particular, the enrichment of vegetable beverages with ingredients of dairy origin (i.e., the addition of whey) can enhance the functional properties of the aforementioned products.
Therefore, the present work was carried out with the objective of evaluating selected physicochemical, rheological, and sensory properties of a novel carrot juice whey-enriched beverage (carrot juice:whey ratios of 100:0; 95:5; 85:15; 75:25; 65:35) fermented with milk or water kefir starter cultures over a storage period of 21 days (at 4 ± 1 °C).
2. Materials and Methods
2.1. Materials
For the production of model fermented beverages, pasteurized carrot juice (dm-drogerie markt GmbH, Karlsruhe, Germany) was used, with a chemical composition of fat < 5.0% (w/w), carbohydrates 8.8% (w/w), and protein 1.0% (w/w). For whey powder (Mogador, s.r.o., Otrokovice, Czech Republic), the chemical composition was fat 0.5% (w/w), carbohydrate 76.0% (w/w), and protein 13.0% (w/w). Kefir cultures were used for fermentation: milk kefir starter culture (UNIBIOM s.r.o., Břeclav, Czech Republic), where the presence of microorganisms of the genera Lactococcus, Leuconostoc, Lactobacillus, Saccharomyces, and Kluyveromyces were found, and water kefir starter culture (UNIBIOM s.r.o., Czech Republic), where the presence of microorganisms of the genera Lactobacillus, Lactrococcus, Leuconostoc, Acetobacter, Saccharomyces, and Kluyveromyces were found (information obtained by the producer).
2.2. Manufacture of the Model Fermented Beverages
Model samples were produced by back-sloping. The inoculum for the production of model samples was prepared by adding 0.50 ± 0.03 g of lyophilized kefir culture in 500 mL of carrot juice. Inoculum fermentation was carried out at 20 ± 2 °C for 48 h (for the development of the active inoculum). Additionally, for the manufacture of fermented beverages, whey powder was reconstituted in distilled water (final concentration 5% w/w). Subsequently, the whey was thermally treated at 90 ± 1 °C for 10 ± 1 min and left to cool to 20 ± 2 °C. The samples were labeled as follows: M95_5 or W95_5 (95% w/w carrot juice and 5% w/w whey; M: sample fermented with milk kefir starter culture and W: sample fermented with water kefir starter culture), M85_15 or W85_15 (85% w/w carrot juice and 15% w/w whey), M75_25 or W75_25 (75% w/w carrot juice and 25% w/w whey), M65_35 or W65_35 (65% w/w carrot juice and 35% w/w whey). In addition, a sample consisting only of carrot juice served as a control sample (MCS, WCs). In all samples, 5% (w/w) of the active inoculum was added. After reaching the pH value of 4.3, the model samples were transferred to the refrigerator, where they were stored at 4 ± 1 °C. Analyses were subsequently performed after 1, 7, 14, and 21 days of storage. A total of 1500 mL of each fermented model beverage sample was prepared. Furthermore, 30 batches of model fermented beverages were manufactured: 5 variants of whey concentrations (including the control sample) × 2 types of starter culture × 3 repetitions.
2.3. Physicochemical Analysis
A Kern OTSS 45BE digital refractometer (Kern & Sohn GmbH, Balingen, Germany) was used to determine the total soluble solids (TSS; % w/w) of the samples. Total dissolved solids (TDS; ppt) were determined using a CyberScan CON 110 (Thermo Fisher Scientific Brno s.r.o., Brno, Czech Republic). Measurements of TSS and TDS were performed nine times (n = 9) at 20 ± 2 °C. Ethanol content (% v/v), density (kg·m−3), and the real degree of fermentation (RDF; % w/w) values were determined using an Anton Paar Alcolyzer Plus (Anton Paar GmbH, Graz, Austria) and an Anton Paar DMA 4500 density meter (Anton Paar GmbH, Austria). RDF was calculated directly by the Anton Paar Alcolyzer Plus software (version 2.2). Prior to the measurements, the samples were centrifuged and degassed using an EBA 21 centrifuge (Schoeller Instruments, s.r.o., Prague, Czech Republic, Germany) at 6000 rpm for 10 min. In addition, a water activity meter (AquaLab, Decagon Devices, Inc., Pullman, WA, USA) was used to determine the water activity values of the samples at 25 ± 1 °C. Before and during the measurement, the instrument was calibrated using a standard (aw = 0.92 NaCl 2.33 mol in H2O; Qi Analytical, s.r.o., Prague, Czech Republic). The pH of the samples was determined (at 20 ± 1 °C) by inserting a glass tip electrode of a calibrated pH meter (Edge; Hanna Instruments Czech s.r.o., Prague, Czech Republic) directly into the samples. All analyses (with exception of TSS and TDS) were performed in triplicate (n = 3).
2.4. Rheological Analysis
The rheological analysis was determined with a HAAKE RheoStress 1 rheometer (Thermo Fisher Scientific, Waltham, MA, USA) equipped with a concentric cylinder geometry with a 2.1 mm gap. For each analysis, 1.0 mL of the sample tempered to 20.0 ± 0.1 °C was used. The samples were measured in sweep of shear rate (0–200 s−1) mode to calculate the steady-state rheological properties. Nonlinear regression analysis (Power Law model, Equation (1)) to process the flow curves obtained was used.
shear stress (Pa); flow consistency index (Pa·s); hear rate (s−1); Power Law index (dimensionless). The recorded values were the mean of at least six replicates (n = 6).
2.5. Instrumental Analysis of Color
A HunterLab UltraScan Pro Color spectrophotometer (Hunter Associates Laboratory, Inc., Reston, VA, USA) was used to determine the color of the samples. The CIE color scale (L*a*b*) with illumination D65 (normal daylight) and an angle of 10° was used for the evaluation. The parameter L* indicates lightness (luminosity) and takes values from 0 (black) to 100 (white). The parameter a* indicates the color spectrum from green (−) to red (+), the parameter b* indicates the color spectrum from blue (−) to yellow (+) [25]. The instrument was calibrated in reflectance mode excluding specular reflection using white (A41 1014-635 Rev. B; Hunterlab ColoTSSlex CZ; Hunter Associates Laboratory, Inc., Reston, VA, USA) and black (A41-1017-037 Rev A; Hunterlab ColoTSSlex CZ; Hunter Associates Laboratory, Inc., Reston, VA, USA) reference plates. Analyses were performed in triplicate (n = 3).
2.6. Turbidity Analysis
The determination of turbidity in the samples was performed using a TURB 430 IR portable turbidimeter (Xylem Analytics Germany Sales GmbH & Co. KG, WTW; Weilheim, Germany) equipped with an infrared LED lamp (860 nm), according to ISO 7027-1:2016 [26], using a nephelometric approach. Turbidity measurements are expressed in nephelometric turbidity units (NTU) [27]. Analyses were performed in triplicate (n = 3).
2.7. Sensory Analysis
The sensory parameters tested for the evaluation of the model samples were appearance, taste, aroma, and overall rating. A total of 12 assessors (9 women and 3 males) aged 22–51 years participated in the sensory evaluation. The samples were served in glass containers (50 mL, coded with three-digit codes) in a random order at a controlled temperature of 20 ± 2 °C. The sensory evaluation took place in a sensory analysis laboratory (separate sensory booths for each panelist under normal light conditions) equipped according to the standard ISO 8589, 2007 [28]. Water was served as a neutralizer. A 10-min pause was taken after each sample to prevent palate fatigue. Appearance, taste, and aroma were evaluated using a 5-point product quality scale (1—excellent, 3—good, 5—unacceptable; each point on the scale was objectively defined with quality parameters). For the overall rating, a 5-point scale was used, where 1—extraordinarily good and 5—extremely bad.
2.8. Statistical Analysis
The physicochemical and rheological parameters were compared by analysis of variance (one-factor ANOVA) and subsequent post-test (Tukey’s test) with 95% reliability. Data obtained were expressed as mean ± standard deviation. Additionally, the sensory properties of the model samples were verified by Kruskall–Wallis and Wilcoxon tests. The significance level used in the tests was 0.05. Statistical analyses were performed using Minitab®16 software (Minitab®, Ltd., Coventry, UK).
3. Results and Discussion
3.1. Physicochemical Analyses
The results of the physicochemical analyses of the model samples are presented in Table 1. The initial TSS values of the model samples with milk kefir starter culture ranged from 6.6 to 7.3 °Bx and with water kefir starter culture ranged from 6.1 to 7.1 °Bx. The initial TSS value decreased accordingly with the whey content of the developed samples (p < 0.05). During storage time, all TSS values decreased; the most significant reduction in TSS values was observed in control samples MCS and WCS. In contrast, the lowest decrease in TSS was observed in samples with 15 and 25% whey. According to Puerari et al. [25] and da Silva Araújo et al. [29], during fermentation, fermentable carbohydrates, including sucrose, glucose, and fructose, are consumed by the present microflora, generating other compounds, such as ethanol, CO2 and organic acids, which may explain the data obtained.

Table 1.
Physicochemical parameters of the evaluated carrot juice whey-enriched beverages fermented with milk and water kefir starter cultures.
In the same token, the density of the model samples decreased during fermentation due to the conversion of fermentable carbohydrates to ethanol, CO2, and other sensory active substances, while the density decrease depended on the fermentation time [25]. The decrease was more pronounced on day 7 (p < 0.05), after that, the density was almost constant until day 21. The highest difference between the initial density values was observed in the control samples, while the lowest was observed in the samples with the addition of 15 and 25% whey. Moreover, the density of the samples also decreased during fermentation in the study of Paredes et al. [30], which dealt with the production of a fermented beverage from fruit and vegetable juices.
The limit of 0.5% (v/v) for non-alcoholic beverages is applied in most European countries [25]. According to the measured values, it can be concluded that only two samples with a milk kefir culture (M85_15, M75_25) and one sample with a water kefir culture (W85_15) can be classified as non-alcoholic (p < 0.05). The ethanol content of the samples with milk kefir starter culture was generally lower compared to that of the samples with water kefir starter culture. The final ethanol content ranged from 0.38 to 0.80% (v/v). Compared to samples with water kefir starter culture, the final ethanol content ranged from 0.5–0.91% v/v. Only the sample W85_15 was non-alcoholic on day 21 of the experiment; the other model samples with water kefir starter culture fell into the category of low-alcoholic beverages. These results can be compared to the study by Randazzo et al. [31]. Furthermore, according to Tzavaras et al. [32], the transition from milk to water kefir is indeed feasible, leading to the production of beverages with relatively higher ethanol content than milk kefir. Moreover, according to Beshkova et al. [33], the presence of ethanol is crucial for kefir-like products because it imparts the typical light alcoholic flavor and, along with CO2 primarily produced during yeast fermentation, gives the finished product the desired exotic notes and yeasty aroma.
The highest increase in the RDF value was observed on day 7 (p < 0.05), which corresponded to an increase in the ethanol content and a decrease in density. On the basis of the results obtained, it can be concluded that the activity of microorganisms was the highest during this period. The difference between the initial and final RDF values of the MCS and M65_35 model samples was the highest (p < 0.05). These samples, by their composition, represented the most suitable medium for fermentation and the microorganisms that were part of the kefir culture. However, the lowest RDF value was observed in samples M85_15 and M75_25. In general, the RDF value was higher in the samples with water kefir, which could be due to the more suitable medium for fermentation given by the water kefir culture.
Model samples showed an increase in the TDS value during 21 days of storage in all cases (p < 0.05). The conductivity of the model samples could be explained by the recorded TDS values; a greater value indicated more electrolytes or dissolved solids, which were present in the fermented beverages [34].
The water activity during storage decreased slightly in the model samples; however, the differences between the initial and final values were not statistically significant (p > 0.05).
The initial pH of the samples (determined immediately after manufacture) was 5.79 ± 0.01 (0 day) and 5.81 ± 0.02 (0 day) for samples manufactured with milk kefir starter culture and water kefir starter culture, respectively. The pH values of the model fermented beverages were (1 day) 4.42 ± 0.02 (for samples manufactured with milk kefir starter culture) and 4.28 ± 0.02 (for samples manufactured with water kefir starter culture), respectively. In particular, this decrease in the pH values is the result of organic acid production by LAB and yeasts. The results agree with those of M’hir et al. [35]. The prolongation of the storage time slightly affected the pH values of the tested samples (p > 0.05). The pH values of the samples on day 21 were 4.05 ± 0.01 (for samples manufactured with milk kefir starter culture) and 4.02 ± 0.01 (for samples manufactured with water kefir starter culture), regardless of the applied whey concentration. Although there was a decrease in the pH values of the samples during storage time, this decrease was not significant (p > 0.05). In general, acidic pH is important to preserve kefir-like beverages from spoilage microorganisms [35].
3.2. Rheological Analysis
In general, there were changes in the flow curves of the model samples during the 21-day experiment period (Figure 1). In particular, as can be seen in Figure 1, with an increase in shear rate, shear stress increases. On the first day of the experiment, WCS exhibited lower shear stress/shear rate values compared to the samples with whey addition, indicating a potential influence of the whey content on the flow properties of the samples. However, this trend was not observed in samples with milk kefir cultures. The flow curves of the model samples with milk kefir culture were relatively similar during storage; however, statistically significant differences were observed between the individual samples (p < 0.05). In addition, the differences in the flow curves of the model samples with the water kefir culture were more pronounced.
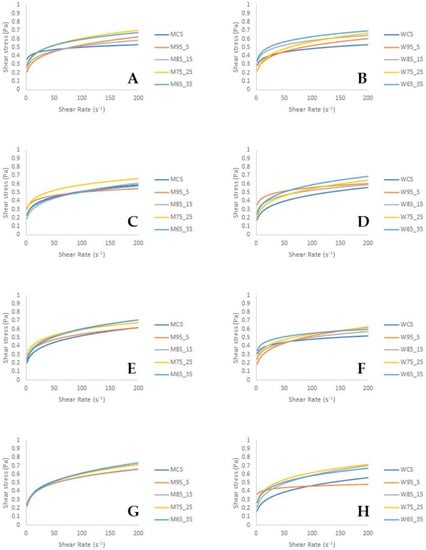
Figure 1.
Flow curves of the model samples during a period of 21 days; samples with milk kefir starter culture day 1 (part A), day 7 (part C), day 14 (part E), day 21 (part G); model samples with water kefir starter culture day 1 (part B), day 7 (part D), day 14 (part F), day 21 (part H). MCS and WCS: control samples (M: sample fermented with milk kefir starter culture and W: sample fermented with water kefir starter culture), M95_5 or W95_5 (95% w/w carrot juice and 5% w/w whey), M85_15 or W85_15 (85% w/w carrot juice and 15% w/w whey), M75_25 or W75_25 (75% w/w carrot juice and 25% w/w whey), M65_35 or W65_35 (65% w/w carrot juice and 35% w/w whey).
The Power Law model exhibited an adjustment to the rheological data, as evidenced by the coefficients of determination (R2) that exceeded 0.99 (Table 2). During the experiment, the flow properties of the model samples changed significantly (p < 0.05). The addition of whey affected the values of K and n, and differences were observed at the same time between the sample concentrations. All fermented beverage samples (regardless of the whey concentration used or starter culture applied) were discovered to exhibit non-Newtonian fluid behavior (shear thinning or pseudoplastic) and the structures were characterized by relatively low resistance to flow. Fermented carrot juice beverages enriched with whey were reported to have a pseudoplastic fluid character because the n values were less than 1. Pseudoplastic behavior (shear thinning character) occurs as a result of the break-down of structural units (hydrocolloids) because of the hydrodynamic forces generated during the shearing process [36]. Similarly, in rheological studies on kefir, which is a type of fermented beverage, the flow curves showed that it has shear-thinning (pseudoplastic) properties [37]. Furthermore, after increasing during the first seven days of the storage period, the consistency index of most samples decreased (Table 2; p < 0.05) [38,39,40,41]. The results are in accordance with those previously reported by Oliveira et al. [42] and Amaral et al. [43].
Table 2.
Rheological parameters (K—flow consistency index, n—Power Law index, R2—coefficient of determination) of the model samples obtained from the Power Law model.
3.3. Instrumental Color Analysis and Turbidity Analysis
Colorimetric parameters (Table 3) L*, a*, and b* showed significant differences (p < 0.05) between samples as a function of increasing whey addition. On the contrary, the differences between the use of milk and water kefir cultures were not significant (p > 0.05). In general, the addition of whey affected all colorimetric parameters. The L* values of all model samples were close to 0; however, the values increased as the whey content increased. Both a* and b* parameters took positive values; therefore, the color of the model samples can be described as yellow with a red tint.
Table 3.
Colorimetric parameters (L* lightness; a* from green (−) to red (+); b* from blue (−) to yellow (+)) and turbidity results of the model samples.
Table 3 shows the results of the turbidity values. As the whey content of the samples increased, the turbidity values decreased, so the samples MCS and WCS, which contained only carrot juice, showed the highest turbidity values. These results are in accordance with those previously reported in the study of Liao et al. [44].
3.4. Sensory Analysis
The results of the sensory analysis are shown in Table 4. The model samples were evaluated for appearance, taste, aroma, and overall rating. During fermentation, there may be a change in appearance due to oxidation, an increase in acidity, and a consequent change in taste and aroma, which might affect the overall impression of the tested samples [45]. Almost all model samples showed changes in organoleptic properties during storage; however, there were no differences between model samples (p > 0.05) in the appearance assessment, and all samples were judged to have a satisfactory appearance. In contrast, during the prolonged storage time, the taste and aroma deteriorated in most of the model samples (p < 0.05). In terms of overall rating, the samples M75_25 and W75_25 containing 25% whey were the best rated during the 21-day storage experiment.
Table 4.
Results of the sensory analysis of the model samples (Appearance, Aroma, Taste, Overall Rating).
4. Conclusions
The purpose of this work was to evaluate the selected physicochemical, rheological, and sensory properties of a new whey-enriched carrot juice beverage (carrot juice: whey ratios of 100:0; 95:5; 85:15; 75:25; 65:35) fermented with milk or water kefir starter cultures over a storage period of 21 days (at 4 ± 1 °C). During the experiment, changes in physicochemical properties were observed, such as a decrease in density, TSS, pH, ethanol content, RDF, and TDS. In addition, all evaluated samples (regardless of the whey concentration used or starter culture applied) were discovered to exhibit non-Newtonian fluid behavior (shear thinning or pseudoplastic), and the structures were characterized by relatively low resistance to flow. At the same time, changes in the organoleptic properties of the model samples were also monitored. Samples containing 25% (% w/w) of whey were considered the most acceptable samples, regardless of the starter culture used. Our findings demonstrated the potential of whey as an ingredient in the formulation of functional food products, particularly fermented beverages. Although whey is already used in the formulation of some beverages, our work further highlighted its potential for use in vegetable-based fermented beverages. Thus, the use of whey as a key ingredient in the production of functional foods could lead to a sustainable economy, as the disposal of whey can cause serious environmental issues. Further research can explore the antioxidant profile, antioxidant ability, microbiological characteristics, and commercial potential of the products mentioned above.
Author Contributions
Conceptualization: R.N.S.; methodology: A.R., Z.M., E.L., V.K., R.A., D.S. and R.N.S.; formal analysis: A.R. and R.N.S.; investigation: A.R. and R.N.S.; data curation: A.R. and R.N.S.; writing—original draft preparation: A.R.; writing—review and editing: Z.M., E.L., V.K., R.A., D.S. and R.N.S.; visualization: A.R. and R.N.S.; supervision: R.N.S.; project administration: A.R. and R.N.S.; funding acquisition: R.N.S. All authors have read and agreed to the published version of the manuscript.
Funding
This work was kindly supported by the project of the internal grant of Tomas Bata University in Zlin No. IGA/FT/2023/007 funded from the resources of specific university research.
Data Availability Statement
The data used to support the findings of this study can be made available by the corresponding author upon request.
Conflicts of Interest
The authors declare no conflict of interest.
References
- Bazán, D.L.; del Río, P.G.; Domínguez, J.M.; Cortés-Diéguez, S.; Mejuto, J.C.; Pérez-Guerra, N. The Chemical, Microbiological and Volatile Composition of Kefir-like Beverages Produced from Red Table Grape Juice in Repeated 24-h Fed-Batch Subcultures. Foods 2022, 11, 3117. [Google Scholar] [CrossRef] [PubMed]
- American Dietetic Association. Position of the American Dietetic Association: Functional foods. J. Am. Diet. Assoc. 2004, 104, 814–826. [Google Scholar] [CrossRef] [PubMed]
- Aslam, H.; Green, J.; Jacka, F.N.; Collier, F.; Berk, M.; Pasco, J.; Dawson, S.L. Fermented foods, the gut and mental health: A mechanistic overview with implications for depression and anxiety. Nutr. Neurosci. 2018, 23, 659–671. [Google Scholar] [CrossRef] [PubMed]
- Sun-Waterhouse, D. The development of fruit-based functional foods targeting the health and wellness market: A review. Int. J. Food Sci. Technol. 2011, 46, 899–920. [Google Scholar] [CrossRef]
- Corbo, M.R.; Bevilacqua, A.; Petruzzi, L.; Casanova, F.P.; Sinigaglia, M. Functional beverages: The emerging side of functional foods: Commercial trends, research, and health implications. Compr. Rev. Food Sci. Food Saf. 2014, 13, 1192–1206. [Google Scholar] [CrossRef]
- da Silva Dias, J.C. Nutritional and Health Benefits of Carrots and Their Seed Extracts. Food Nutr. Sci. 2014, 5, 2147–2156. [Google Scholar] [CrossRef]
- Amany, E.E.A.; Hany, A.A.G.; Hamida, M.M.; Mohammed, M.Y. Mixes of Carrot Juice and Some Fermented Dairy Products: Potentiality as Novel Functional Beverages. Food Nutr. Sci. 2012, 3, 233–239. [Google Scholar] [CrossRef]
- Fan, L.; Ismail, B.B.; Gao, L.; Liu, D. Comparison of high-and low-frequency thermosonication and carvacrol treatments of carrot juice: Microbial inactivation and quality retention. Appl. Food Res. 2022, 2, 100162. [Google Scholar] [CrossRef]
- García-Burgos, M.; Moreno-Fernández, J.; Alférez, M.J.M.; Díaz-Castro, J.; López-Aliaga, I. New perspectives in fermented dairy products and their health relevance. J. Funct. Foods 2020, 72, 104059. [Google Scholar] [CrossRef]
- Mauriello, G.; Moio, L.; Moschetti, G.; Piombino, P.; Addeo, F.; Coppola, S. Characterization of lactic acid bacteria strains on the basis of neutral volatile compounds produced in whey. J. Appl. Microbiol. 2001, 90, 928–942. [Google Scholar] [CrossRef]
- Silva e Alves, A.T.; Spadoti, L.M.; Zacarchenco, P.B.; Trento, F.K.H.S. Probiotic Functional Carbonated Whey Beverages: Development and Quality Evaluation. Beverages 2018, 4, 49. [Google Scholar] [CrossRef]
- Bandara, T.A.; Munasinghe-Arachchige, S.P.; Gamlath, C.J. Fermented Whey Beverages: A Review of Process Fundamentals, Recent Developments and Nutritional Potential. Int. J. Dairy Technol. 2023; ahead of print. [Google Scholar] [CrossRef]
- Arsić, S.; Bulatović, M.; Zarić, D.; Kokeza, G.; Subić, J.; Rakin, M. Functional fermented whey carrot beverage-qualitative, nutritive and techno-economic analysis. Rom. Biotechnol. Lett. 2018, 23, 13496–13504. [Google Scholar]
- Barukčić, I.; Lisak Jakopović, K.; Božanić, R. Valorisation of Whey and Buttermilk for Production of Functional Beverages -An Overview of Current Possibilities. Food Technol. Biotechnol. 2019, 57, 448–460. [Google Scholar] [CrossRef]
- González-Orozco, B.D.; García-Cano, I.; Jiménez-Flores, R.; Alvárez, V.B. Invited review: Milk kefir microbiota—Direct and indirect antimicrobial effects. J. Dairy Sci. 2022, 105, 3703–3715. [Google Scholar] [CrossRef]
- Rodrigues, K.L.; Caputo, L.R.G.; Carvalho, J.C.T.; Evangelista, J.; Schneedorf, J.M. Antimicrobial and healing activity of kefir and kefiran extract. Int. J. Antimicrob. Agents 2005, 25, 404–408. [Google Scholar] [CrossRef] [PubMed]
- Gocer, E.M.C.; Koptagel, E. Production and evaluation of microbiological & rheological characteristics of kefir beverages made from nuts. Food Biosci. 2023, 52, 102367. [Google Scholar] [CrossRef]
- Guzel-Seydim, Z.B.; Gökırmaklı, C.; Greene, A.K. A comparison of milk kefir and water kefir: Physical, chemical, microbiological and functional properties. Trends Food Sci. Technol. 2021, 113, 42–53. [Google Scholar] [CrossRef]
- Moretti, A.F.; Moure, M.C.; Quiñoy, F.; Esposito, F.; Simonelli, N.; Medrano, M.; León-Peláez, Á. Water kefir, a fermented beverage containing probiotic microorganisms: From ancient and artisanal manufacture to industrialized and regulated commercialization. Future Foods 2022, 5, 100123. [Google Scholar] [CrossRef]
- Lynch, K.M.; Wilkinson, S.; Daenen, L.; Arendt, E.K. An update on water kefir: Microbiology, composition and production. Int. J. Food Microbiol. 2021, 345, 109128. [Google Scholar] [CrossRef]
- Ahmed, T.; Sabuz, A.A.; Mohaldar, A.; Fardows, H.M.S.; Inbaraj, B.S.; Sharma, M.; Rana, M.R.; Sridhar, K. Development of Novel Whey-Mango Based Mixed Beverage: Effect of Storage on Physicochemical, Microbiological, and Sensory Analysis. Foods 2023, 12, 237. [Google Scholar] [CrossRef]
- Corona, O.; Randazzo, W.; Miceli, A.; Guarcello, R.; Francesca, N.; Erten, H.; Moschetti, G.; Settanni, L. Characterization of kefir-like beverages produced from vegetable juices. LWT–Food Sci. Technol. 2016, 66, 572–581. [Google Scholar] [CrossRef]
- Ozcelik, F.; Akan, E.; Kinik, O. Use of Cornelian cherry, hawthorn, red plum, roseship and pomegranate juices in the production of water kefir beverages. Food Biosci. 2021, 42, 101219. [Google Scholar] [CrossRef]
- Tavares, P.P.L.G.; dos Anjos, E.A.; Nascimento, R.Q.; da Silva Cruz, L.F.; Lemos, P.V.F.; Druzian, J.I.; de Oliveira Mamede, M.E. Chemical, microbiological and sensory viability of low-calorie, dairy-free kefir beverages from tropical mixed fruit juices. CyTA-J. Food 2021, 19, 457–464. [Google Scholar] [CrossRef]
- Puerari, C.; Magalhães, K.T.; Schwan, R.F. New cocoa pulp-based kefir beverages: Microbiological, chemical composition and sensory analysis. Food Res. Int. 2012, 48, 634–640. [Google Scholar] [CrossRef]
- Pereira, M.O.; Guimarães, J.T.; Ramos, G.L.; do Prado-Silva, L.; Nascimento, J.S.; Sant’Ana, A.S.; Cruz, A.G. Inactivation kinetics of Listeria monocytogenes in whey dairy beverage processed with ohmic heating. LWT– Food Sci. Technol. 2020, 127, 109420. [Google Scholar] [CrossRef]
- ISO 7027-1:2016; Water Quality—Determination of Turbidity. International Organization for Standardization: Geneva, Switzerland, 2016.
- Kolniak-Ostek, J.; Oszmiański, J.; Rutkowski, K.P.; Wojdyło, A. Effect of 1-methylcyclopropene postharvest treatment apple and storage on the cloudy juices properties. LWT–Food Sci. Technol. 2014, 59, 1166–1174. [Google Scholar] [CrossRef]
- Araújo, C.d.S.; Macedo, L.L.; Teixeira, L.J.Q. Use of mid-infrared spectroscopy to predict the content of bioactive compounds of a new non-dairy beverage fermented with water kefir. LWT 2023, 176, 114514. [Google Scholar] [CrossRef]
- ISO 8589:2007; Sensory Analysis—General Guidance for the Design of Test Rooms. International Organization for Standardization: Geneva, Switzerland, 2007.
- Avila-Reyes, S.V.; Márquez-Morales, C.E.; Moreno-León, G.R.; Jiménez-Aparicio, A.R.; Arenas-Ocampo, M.L.; Solorza-Feria, J.; García-Armenta, E.; Villalobos-Espinosa, J.C. Comparative Analysis of Fermentation Conditions on the Increase of Biomass and Morphology of Milk Kefir Grains. Appl. Sci. 2022, 12, 2459. [Google Scholar] [CrossRef]
- Tzavaras, D.; Papadelli, M.; Ntaikou, I. From Milk Kefir to Water Kefir: Assessment of Fermentation Processes, Microbial Changes and Evaluation of the Produced Beverages. Fermentation 2022, 8, 135. [Google Scholar] [CrossRef]
- Beshkova, D.M.; Simova, E.D.; Frengova, G.I.; Simov, Z.I.; Dimitrov, Z.P. Production of volatile aroma compounds by kefir starter cultures. Int. Dairy J. 2023, 13, 529–535. [Google Scholar] [CrossRef]
- Paredes, J.L.; Escudero-Gilete, M.L.; Vicario, I.M. A new functional kefir fermented beverage obtained from fruit and vegetable juice: Development and characterization. LWT–Food Sci. Technol. 2022, 154, 112728. [Google Scholar] [CrossRef]
- M’hir, S.; Rtibi, K.; Mejri, A.; Ziadi, M.; Aloui, H.; Hamdi, M.; Ayed, L. Development of a Novel Whey Date Beverage Fermented with Kefir Grains Using Response Surface Methodology. J. Chem. 2019, 2019, 1–13. [Google Scholar] [CrossRef]
- Iskakova, J.; Smanalieva, J.; Methner, F.J. Investigation of changes in rheological properties during processing of fermented cereal beverages. J. Food Sci. Technol. 2019, 56, 3980–3987. [Google Scholar] [CrossRef]
- Glibowski, P.; Kowalska, A. Rheological, texture and sensory properties of kefir with high performance and native inulin. J. Food Eng. 2012, 111, 299–304. [Google Scholar] [CrossRef]
- Okaru, A.O.; Lachenmeier, D.W. Defining No and Low (NoLo) Alcohol Products. Nutrients 2022, 14, 3873. [Google Scholar] [CrossRef] [PubMed]
- Randazzo, W.; Corona, O.; Guarcello, R.; Francesca, N.; Germanà, M.A.; Erten, H.; Moschetti, G.; Settanni, L. Development of new non-dairy beverages from Mediterranean fruit juices fermented with water kefir microorganisms. Food Microbiol. 2016, 54, 40–51. [Google Scholar] [CrossRef]
- Lin, S.D.; Yang, J.H.; Hsieh, Y.J.; Liu, E.H.; Mau, J.L. Effect of Different Brewing Methods on Quality of Green Tea: Quality of Green Tea. J. Food Process. Preserv. 2014, 38, 1234–1243. [Google Scholar] [CrossRef]
- Jabbar, S.; Abid, M.; Hu, B.; Hashim, M.M.; Lei, S.; Wu, T.; Zeng, X. Exploring the potential of thermosonication in carrot juice processing. J. Food Sci. Technol. 2015, 52, 7002–7013. [Google Scholar] [CrossRef]
- Oliveira, G.A.; Guimarães, J.T.; Ramos, G.L.P.; Esmerino, E.A.; Pimentel, T.C.; Neto, R.P.; Cruz, A.G. Benefits of thermosonication in orange juice whey drink processing. Innov. Food Sci. Emerg. Technol. 2021, 75, 102876. [Google Scholar] [CrossRef]
- Amaral, G.V.; Silva, E.K.; Costa, A.L.R.; Alvarenga, V.O.; Cavalcanti, R.N.; Esmerino, E.A.; Cruz, A.G. Whey-grape juice drink processed by supercritical carbon dioxide technology: Physical properties and sensory acceptance. LWT–Food Sci. Technol. 2018, 92, 80–86. [Google Scholar] [CrossRef]
- Liao, H.; Sun, Y.; Ni, Y.; Liao, X.; Hu, X.; Wu, J.; Chen, F. The effect of enzymatic mash treatment, pressing, centrifugation, homogenization, deaeration, sterilization and storage on carrot juice. J. Food Process Eng. 2007, 30, 421–435. [Google Scholar] [CrossRef]
- Faisal, S.; Chakraborty, S.; Devi, W.E.; Hazarika, M.K.; Puranik, V. Sensory evaluation of probiotic whey beverages formulated from orange powder and flavor using fuzzy logic. Int. Food Res. J. 2017, 24, 703–710. [Google Scholar]
Disclaimer/Publisher’s Note: The statements, opinions and data contained in all publications are solely those of the individual author(s) and contributor(s) and not of MDPI and/or the editor(s). MDPI and/or the editor(s) disclaim responsibility for any injury to people or property resulting from any ideas, methods, instructions or products referred to in the content. |
© 2023 by the authors. Licensee MDPI, Basel, Switzerland. This article is an open access article distributed under the terms and conditions of the Creative Commons Attribution (CC BY) license (https://creativecommons.org/licenses/by/4.0/).